1
6
Tutorial A: Introductory Examples
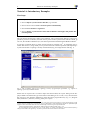
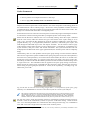
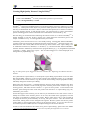
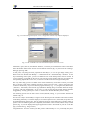
On the left-hand side of the Navigation bar, the currently active view (e.g. ”Picture 1”) is given in the
context of the current document, separated by ’>’ signs which indicate the hierarchy. For example,
”c60.cif > S1252286 > Picture 1” means that currently picture ”Picture 1” of the crystal structure
titled ”S1252286” is displayed which is contained in the D IAMOND document ”c60.cif”.
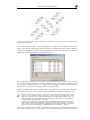
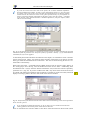
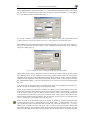
In addition to the structure picture(s), there are three different views available for the current structure:
Data sheet The Data sheet contains all information that is currently known about the structure, i.e.
it is an extended version of the data brief.
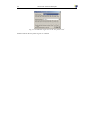
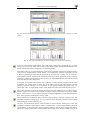
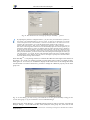
Distances and angles Here a table as well as a histogram representation of the distances and angles
between the various atoms in the structure is displayed.
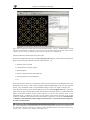
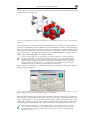
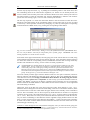
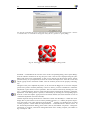
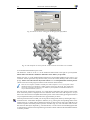
Powder pattern The powder diffraction pattern is calculated from the crystal structure data. Both a
list of individual reflections as well as a diffraction diagram are presented. Various parameters
of the diffraction pattern calculation (radiation, wavelength, LP-correction, profile function
etc.) as well as the diagram (scaling, colors etc.) can be adjusted.
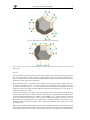
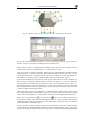
Please walk through these views by clicking on the corresponding symbols in the Navigation bar,
and try to change the settings e.g. for the diffraction pattern or the distances and angles calculation.
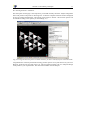
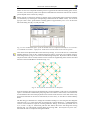
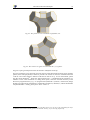
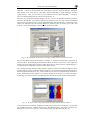
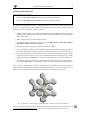
If you click on the structure name in the navigation bar (in our case ”S1252286”), you will obtain a
thumbnail overview of all pictures which have been created for the current crystal structure (”structure level”), as well as the ”Data brief” providing a quick overview over the most important crystal
structure data.
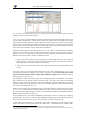
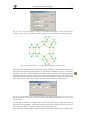
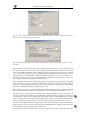
If you click on the document name in the Navigation bar (”c60.cif” in our case; the ”top level” in the
document hierarchy), an overview over all structures in the current document is provided (”document
level”). If you click on (select) a certain structure in the table at the top, you will obtain a thumbnail
overview of all pictures which have been created for this crystal structure as well as the ”Data brief”
providing a quick overview over the most important crystal structure data.
The first tutorial session is finished at this point; you have got an overview over the user interface
and some important dialog elements. We will now start working with D IAMOND in the next chapter,
by manually entering the crystal structure data and creating a picture ”on your own”.