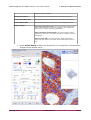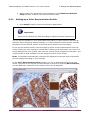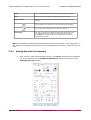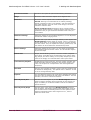
1
MembraneQuant
Module
1.12
User's Guide
19 June 2009
MembraneQuant for MIRAX Viewer 1.12 User's Guide
Contents
Disclaimer.....................................................................................................................4
Font types and symbols..................................................................................................5
Terms and abbreviations.................................................................................................6
1 About MembraneQuant.................................................................................................7
1.1 MembraneQuant in the MIRAX product family...........................................................7
1.2 Overview of Membrane Analysis..............................................................................8
1.2.1 MembraneQuant algorithms.............................................................................8
1.2.2 Annotations, Fields, and Objects in MembraneQuant ..........................................8
1.2.3 CCC files.....................................................................................................10
1.2.4 MISP files....................................................................................................10
1.2.5 Using a MISP file on other slides.....................................................................10
1.2.6 MembraneQuant Measurements.....................................................................10
1.2.7 Measurement Export in CSV Format................................................................11
1.3 Overview of Measurement Visualization.................................................................11
2 Installing MembraneQuant and Measurement Visualization Bundled with MIRAX Viewer 1.12
..................................................................................................................................13
2.1 Prerequisites for the MIRAX Viewer Installation.......................................................13
2.1.1 Licensing.....................................................................................................13
2.2 Installing MIRAX Viewer and Its Modules................................................................13
3 Working with MembraneQuant.....................................................................................21
3.1 Before you start..................................................................................................21
3.2 Creating Annotation for Membrane Analyzer...........................................................21
3.3 Running the Algorithm on a Single Slide.................................................................22
3.3.1 Setting up a Color Deconvolution Profile..........................................................25
3.3.2 Setting Detection Parameters.........................................................................26
3.3.3 How to set the Scoring..................................................................................28
3.4 Running Batch Process in MembraneQuant.............................................................30
3.5 Saving MembraneQuant Results to the Slide...........................................................30
3.6 Exporting MembraneQuant Results in CSV Format (Measurements from One Slide)....30
3.7 Exporting MembraneQuant Results to a Cumulative CSV File...................................31
4 Working with Measurement Visualization.......................................................................32
4.1 Creating a Histogram...........................................................................................32
4.2 Creating a Scatter Plot.........................................................................................34
4.3 Creating a Gallery...............................................................................................36
4.4 Creating a Classification Gallery............................................................................38
Related documents.......................................................................................................41
Index..........................................................................................................................42
June 19, 2009
3DHISTECH Ltd.
2(43)
MembraneQuant for MIRAX Viewer 1.12 User's Guide
Appendix A - MembraneQuant.......................................................................................43
A.1 Object-specific parameters...................................................................................43
A.2 Summing parameters for an area..........................................................................43
June 19, 2009
3DHISTECH Ltd.
3(43)
MembraneQuant for MIRAX Viewer 1.12 User's Guide
Disclaimer
Copyright © 2001-2009 3DHISTECH Ltd.
All rights reserved.
The following patents are pending for 3DHISTECH products:
EP07733864.8; US 12/301,781; EP07713006.0; US 12/281,566; PI0708550-8;
20070007642.2; US 2008/0306964 A1; HK07113109.4; EP05702806.0
3DHISTECH Ltd. is not liable for damage of whatever nature (including, but not limited
to, general or specific damage, indirect damage, consequential damage or incidental
damage, including the results of the analysis of the digitized slides, for example: change
of health status related to erroneous diagnosis from the digitalized slide(s)) that stems
from or is associated with use of Product, digitalized slides, quality of staining, quality of
stained slides, quality of used method of staining. Certain legal systems do not allow the
limitation or exclusion of accidental damage. This restriction therefore may not apply in
your case. 3DHISTECH Ltd. assumes no responsibility for the functionality and fault-free
condition of your "application programs" (Workflows, VBA macros, Commander scripts).
CAUTION
For research and education uses only, not
has not been approved or cleared as a
Administration, nor any other regulatory
viewed using this product are not intended
for use in diagnostic procedures. This product
medical device by the U.S. Food and Drug
authority. The data and images obtained or
for clinical or diagnostic use.
Third-party disclaimer (LibTIFF - TIFF Library and Utilities)
3DHISTECH Ltd. is not liable for damage of whatever nature (including, but not limited
to, general or specific damage, indirect damage, consequential damage or incidental
damage, including damage resulting from lost profits, interruption of business, loss of
business information, pecuniary loss or similar damage) that stems from or is associated
with the incorporated part of this Product that is made by Silicon Graphics Inc.
THE SOFTWARE IS PROVIDED "AS-IS" AND WITHOUT WARRANTY OF ANY KIND,
EXPRESSED, IMPLIED OR OTHERWISE, INCLUDING WITHOUT LIMITATION, ANY
WARRANTY OF MERCHANTABILITY OR FITNESS FOR A PARTICULAR PURPOSE.
IN NO EVENT SHALL SAM LEFFLER OR SILICON GRAPHICS BE LIABLE FOR ANY SPECIAL,
INCIDENTAL, INDIRECT OR CONSEQUENTIAL DAMAGES OF ANY KIND, OR ANY
DAMAGES WHATSOEVER RESULTING FROM LOSS OF USE, DATA OR PROFITS, WHETHER
OR NOT ADVISED OF THE POSSIBILITY OF DAMAGE, AND ON ANY THEORY OF LIABILITY,
ARISING OUT OF OR IN CONNECTION WITH THE USE OR PERFORMANCE OF THIS
SOFTWARE.
Further information
For the latest information on 3DHISTECH products and services, visit
http://www.3dhistech.com.
June 19, 2009
3DHISTECH Ltd.
4(43)
MembraneQuant for MIRAX Viewer 1.12 User's Guide
Font types and symbols
Example
Abbreviation or term that is explained in the section Terms and Abbreviations.
Example
Words or characters that appear on the screen. These include field names,
screen titles, pushbuttons and menu names, paths or options.
Keys on the keyboard. For example, function keys (such as F11) or the
Ctrl+O key combination.
Example
Cross-references to other documents.
Warning!
Indicates that you need an additional module to use the feature or that
there are prerequisites for the task or that special care should be taken
when using certain feature of the device.
Important!
An important piece of information or a recommendation. The application
will work if you choose not to follow the recommendation but its performance might be less than optimal.
Tip!
A suggestion about using the application in some other way or to some interesting purpose.
June 19, 2009
3DHISTECH Ltd.
5(43)
MembraneQuant for MIRAX Viewer 1.12 User's Guide
Terms and abbreviations
Annotation
A particular detail of a digitized slide. MembraneQuant can perform measurements on annotations.
CCC
The Color Deconvolution setting is stored in a .ccc file.
CSV format
Comma separated value
Digital slide
Slide digitized with a MIRAX scanner microscope, for example MIRAX SCAN.
Consists of an MRXS file and a folder with the same name as the MRXS file.
Field
In MembraneQuant: an annotation.
In ImmunoScreener: a grid cell.
Layer
A group of cell compartments matching the same stain and size criteria.
Measurement
MembraneQuant can perform two types of measurements:
MISP
•
field-specific (related to the annotation)
•
object-specific
MIRAX Imaging Segmentation Profile
A MembraneQuant segmentation and measuring algorithm is stored in a MISP
file.
MRXS
MIRAX Slide
File extension of a digitized MIRAX slide.
Object
A cell compartment (for example, membrane tissue), cell or tissue that is relevant for the immunohistochemical analysis.
Segmentation
Identification of cells or cell compartments based on their different reactions to
immunohistochemical staining.
June 19, 2009
3DHISTECH Ltd.
6(43)
MembraneQuant for MIRAX Viewer 1.12 User's Guide
1
1 About MembraneQuant
About MembraneQuant
MembraneQuant is an optional module for MIRAX Viewer. It allows you to perform examinations of immunolabelled cell membrane on the virtual slides and digitalized with
MIRAX microscopes.
- MembraneQuant performs segmentation and measurements on MIRAX digital
slides based on the colors of the immunoreactive cell membrane.
- Based on the intensity of the immunohistochemical dyeing, it can classify the
cell membrane.
1.1
MembraneQuant in the MIRAX product family
The following picture shows how MembraneQuant and Measurement Visualization
extend MIRAX Viewer and how they fit into the MIRAX product family.
1. Slides are digitized with MIRAX microscopes, for example, MIRAX SCAN. For
more details, see MIRAX SCAN User's Guide. A digitized slide consists of an
MRXS file and a folder with the same name as the MRXS file.
June 19, 2009
3DHISTECH Ltd.
7(43)
MembraneQuant for MIRAX Viewer 1.12 User's Guide
1 About MembraneQuant
2. Digitized slides are stored on a computer. You can also use a dedicated server
(for example, MIRAX Server) for storing the MIRAX slides.
3. Slides digitized with a MIRAX microscope can be viewed in MIRAX Viewer. If the
slide is stored on a MIRAX Server, it is opened through the Teleconsultation
module. Local slides are opened directly with MIRAX Viewer.
4. MembraneQuant allows you to perform measurements on digital slides and to
export measurements in CSV format.
5. Measurement Visualization displays the MembraneQuant data as a scatter
plot, a histogram, an image gallery or a classification gallery.
6. Digital slides, including slides that store MembraneQuant measurements, can
be shared via PathoNet (www.pathonet.com). They can also be used in E-School
as training and/or exam materials.
1.2
Overview of Membrane Analysis
You can perform two types of tasks in MembraneQuant:
1.2.1
•
set algorithms then run them on a slide or a set of slides
•
view the measurement results with the Measurement Visualization module,
save the measurement annotations with the slide or export the measurement results to CSV file(s)
•
create a report based on your saved measurements
MembraneQuant algorithms
MembraneQuant is a membrane analysis application with color deconvolution profile
settings. You can set the parameters of smoothness and merger, you can also filter the
areas by size. The information necessary for the algorithm is not saved on the slide but in
a MIRAX Image Segmentation Profile (MISP) file, which can be used later to evaluate
other annotations on the same slide or on other slides.
Note: Since MembraneQuant enables you to make measurements on the slides and digitalized image processing can cause loss of quality, please, always make sure that the
measurements are acceptable to you. Measurement values are optimized by default; set
parameters manually only if the result is not satisfactory to you.
1.2.2
Annotations, Fields, and Objects in MembraneQuant
MembraneQuant uses annotations. If you want to perform measurements on the entire
digitized area of the slide, you need an annotation that covers the entire area. You can
use any of the annotations created in MIRAX Viewer, including annotations containing
MembraneQuant measurements.
June 19, 2009
3DHISTECH Ltd.
8(43)
MembraneQuant for MIRAX Viewer 1.12 User's Guide
1 About MembraneQuant
Tips!
You can add a caption and a description to an annotation. If you want to
see a piece of information, for example a short comment, to be visible in
the gallery that you can export from MembraneQuant, add it to the caption. Only the annotation caption is exported, the description is not.
Create unique captions to make annotations distinguishable, thus the
measurements can be easily identifiable.
The following image shows a virtual slide treated with IHC stains. There are two annotations on the slide, these are possible targets for MembraneQuant analyses.
Annotation types:
(1) field: user-defined annotation (rectangle, polygonal/freehand)
(2) object (cell membrane): algorithm-defined annotation in the field
Note: A layer consists of objects (cell membranes) of a certain kind.
June 19, 2009
3DHISTECH Ltd.
9(43)
MembraneQuant for MIRAX Viewer 1.12 User's Guide
1.2.3
1 About MembraneQuant
CCC files
MembraneQuant saves Color Deconvolution settings into a CCC file, that contains base
settings by default.
1.2.4
MISP files
MembraneQuant algorithms are saved in MISP files that store the following information
about the algorithm:
1.2.5
•
segmentation algorithm
Filters for noise reduction, segmentation and object separation so that MembraneQuant can isolate objects (for example, cell membranes) on the digitized
slide.
•
measurement parameters
For example, the diameters (shorter/longer), the distance between two objects or
the number of objects in an annotation.
Using a MISP file on other slides
You can reuse the MISP on other slides from the same batch (for example, on slides that
are from the same specimen) without modifications. You can also use the same algorithm
on slides from other specimens with the same staining.
You might need to adjust the profile to ensure that differences in the specimen or stain
quality do not affect the result.
1.2.6
MembraneQuant Measurements
MembraneQuant creates the following types of measurement:
•
object-specific measurement (related to an object)
•
•
is related to an object, for example, its area. For more information, see Appendix A1.
field-specific measurement (related to an annotation)
•
sums up object data, for example the total area of objects of the same layer in
an annotation. For more information, see Appendix A2.
•
conveys information about the annotation, for example its total area. For more
information, see Appendix A2.
June 19, 2009
3DHISTECH Ltd.
10(43)
MembraneQuant for MIRAX Viewer 1.12 User's Guide
1.2.7
1 About MembraneQuant
Measurement Export in CSV Format
You can export MembraneQuant measurements as CSV files. Both field-level and object-level measurements are exported.
You can choose between the following options:
Object-Specific CSV
Saves the parameter values for each object in the annotations that you
select for the CSV export.
If you use an existing file name, the old file will be overwritten.
Cumulative CSV
Single File Cumulative CSV
Multi File Cumulative CSV
•
One cumulative file will be
created
•
If you enter a new file name, the CSV export will contain all data
in the project.
•
If you select an existing CSV file, only the summary data will be
added to the existing file. Use this option to create a cumulative
file, for example for longitudinal studies or to follow-up a patient's history.
•
One cumulative file will be
created for each layer of
objects detected
Tips!
Check the documentation of your statistical or spreadsheet application to
ensure that the CSV file exported from MembraneQuant is compatible
with that application.
Also, make sure that the regional settings of the operating system, MIRAX
Viewer and the post-processing application are the same. Otherwise, separators (comma, semicolon, etc.) used during the CSV export will not be
recognized in the statistical or spreadsheet application.
1.3
Overview of Measurement Visualization
Measurement Visualization is an extension to MembraneQuant which allows you to
create a graphical representation of measurement results obtained from the MembraneQuant algorithm run on a slide (or set of slides grouped into an ImmunoScreener
project). For more information on ImmunoScreener, see ImmunoScreener Module for
MIRAX Viewer 1.12 User's Guide.
June 19, 2009
3DHISTECH Ltd.
11(43)
MembraneQuant for MIRAX Viewer 1.12 User's Guide
1 About MembraneQuant
Measurement Visualization works only with object-level measurements, which means
that if you select three annotations, all object data are summed up, but there is no information regarding how many data items derive, and from which fields.
June 19, 2009
3DHISTECH Ltd.
12(43)
MembraneQuant for MIRAX Viewer 1.12 User's Guide
2 Installing MembraneQuant and
Measurement Visualization Bundled with
MIRAX Viewer 1.12
2 Installing MembraneQuant and Measurement
Visualization Bundled with MIRAX Viewer 1.12
MembraneQuant and Measurement Visualization are not stand-alone applications:
you need MIRAX Viewer to run them. Therefore, you have to install MIRAX Viewer before
installing the application.
2.1
Prerequisites for the MIRAX Viewer Installation
Prerequisites
Description
Hardware
Minimum:
Pentium P4, 3GHz, 1GB RAM
Recommended:
Pentium C2D (DualCore), 2 GHz, 2GB RAM
Operating system
Microsoft Windows XP
Disk space
MIRAX Viewer 1.12 bundled with the MembraneQuant and Measurement Visualization modules 1.12
Minimum:
110 MB
2.1.1
Licensing
You receive a product-specific license when purchasing any of the 3DHISTECH applications.
2.2
Installing MIRAX Viewer and Its Modules
1. Launch the 3DHISTECH_Apps.exe file that you received on a 3DHISTECH installation CD or downloaded in a compressed file.
2. Follow the instructions in the installation wizard.
June 19, 2009
3DHISTECH Ltd.
13(43)
MembraneQuant for MIRAX Viewer 1.12 User's Guide
2 Installing MembraneQuant and
Measurement Visualization Bundled with
MIRAX Viewer 1.12
3. By default, the installation folder is the following:
C:\Program files\3DHISTECH\MIRAX Viewer\
4. Set the license mode. If necessary, select install with HASP dongle, otherwise
select a license file.
June 19, 2009
3DHISTECH Ltd.
14(43)
MembraneQuant for MIRAX Viewer 1.12 User's Guide
2 Installing MembraneQuant and
Measurement Visualization Bundled with
MIRAX Viewer 1.12
5. Accept the End-User License Agreement, and click Next.
6. Select the components you want to install.
June 19, 2009
3DHISTECH Ltd.
15(43)
MembraneQuant for MIRAX Viewer 1.12 User's Guide
2 Installing MembraneQuant and
Measurement Visualization Bundled with
MIRAX Viewer 1.12
7. If not previously done, you have to install the prerequisites of the installation.
8. Click Install to continue with the installation of the selected components.
June 19, 2009
3DHISTECH Ltd.
16(43)
MembraneQuant for MIRAX Viewer 1.12 User's Guide
2 Installing MembraneQuant and
Measurement Visualization Bundled with
MIRAX Viewer 1.12
A progress bar and an information box is displayed, showing the status of the
installation procedure.
9. After completing the installation of MIRAX Viewer and its modules, click Finish
to close the wizard.
June 19, 2009
3DHISTECH Ltd.
17(43)
MembraneQuant for MIRAX Viewer 1.12 User's Guide
2 Installing MembraneQuant and
Measurement Visualization Bundled with
MIRAX Viewer 1.12
10. If you have an older or newer version of the applications, you have to uninstall
them first.
11. If the uninstall wizard window opens, click Next.
June 19, 2009
3DHISTECH Ltd.
18(43)
MembraneQuant for MIRAX Viewer 1.12 User's Guide
2 Installing MembraneQuant and
Measurement Visualization Bundled with
MIRAX Viewer 1.12
12. The wizard automatically detects the folder of the previously installed applications. Click Uninstall to proceed.
13. When the uninstallation of MIRAX Viewer and its modules is complete, click Finish to close the wizard.
June 19, 2009
3DHISTECH Ltd.
19(43)
MembraneQuant for MIRAX Viewer 1.12 User's Guide
2 Installing MembraneQuant and
Measurement Visualization Bundled with
MIRAX Viewer 1.12
14. After the previously installed applications are removed, click Next to launch the
installation wizard.
June 19, 2009
3DHISTECH Ltd.
20(43)
MembraneQuant for MIRAX Viewer 1.12 User's Guide
3
3.1
3 Working with MembraneQuant
Working with MembraneQuant
Before you start
MembraneQuant works on selected annotations. You can run other algorithms on several annotations by selecting all the annotations that you need when you start the algorithm.
Important!
MembraneQuant algorithms utilize the computer's hardware (mainly the
CPU and the memory). The speed of the MembraneQuant evaluation depends on the hardware configuration and performance, the size and the
number of the measured annotations, and the quantity of detected objects.
MembraneQuant algorithm runs only on Brightfield slides.
To ensure accurate results and to reduce computation time:
•
Make the training annotation as small as possible. The annotated areas should not
be larger than 300x300 µm (1:1 magnification).
•
When you are creating a free-hand annotation, follow the outline of the area as
closely as possible.
•
Select the annotation area appropriately, for example, select an area that is rich in
tumor cells instead of connective tissue.
Tip!
If you need to make measurements on the entire specimen, simply select
the whole slide.
3.2
Creating Annotation for MembraneQuant
1. Open the slide in MIRAX Viewer. For more information on how to open slides in
MIRAX Viewer, see section Working with slides in MIRAX Viewer in the MIRAX
Viewer 1.12 User's Guide.
June 19, 2009
3DHISTECH Ltd.
21(43)
MembraneQuant for MIRAX Viewer 1.12 User's Guide
3 Working with MembraneQuant
2. Create the annotation on the area of your interest:
•
Select the annotation type (rectangle or free-hand) and cover the area with the
annotation.
For information on navigating and zooming on the slide, see section Viewing
slides in the MIRAX Viewer 1.12 User's Manual.
•
In the Create or Edit Annotation window add a title to the annotation, enter a
comment and determine the background color of the title and the outline color of
the annotation. You can either select from predetermined colors or you can define
custom colors.
Only captions are exported to the CSV output file. Annotation descriptions are visible only in MIRAX Viewer.
3. Repeat step 2 for each area on which you want to run the algorithm.
3.3
Running the Algorithm on a Single Slide
Open the slide in MIRAX Viewer.
1. In the main toolbar, click the
Image Analysis Modules.
June 19, 2009
icon and select MembraneQuant from the
3DHISTECH Ltd.
22(43)
MembraneQuant for MIRAX Viewer 1.12 User's Guide
3 Working with MembraneQuant
2. Select the annotation or annotations you want to analyze, in the Available window at the Annotations Selection panel, then move them to the Selected
window by clicking > or >>.
If you need the whole slide, check Process whole Slide.
Profile Setup
June 19, 2009
Use this application to set or change the Profile Setup of the
3DHISTECH Ltd.
23(43)
MembraneQuant for MIRAX Viewer 1.12 User's Guide
3 Working with MembraneQuant
MembraneQuant algorithm.
Annotation Selection
You can select your annotation(s) for the measuring process.
Process Annotation Area
The algorithm will be executed only on the selected annotations.
Process Whole Slide
The annotation will be executed on the whole digital slide area.
Export settings
Save Region measurements: The measurements will be exported to a CSV file that you can open and edit in any spreadsheet
software (for example. MS Excel, OpenOffice).
Save Cumulative measurements: The measurements will be
exported to CSV files. A cumulative file will be created for each detected layer.
Save to single CSV: The measurements will be exported to a
single CSV file. This file will contain all the parameters of the layers.
3. Select Profile Setup to define the parameters of the algorithm. The Membrane
Analysis Setup window opens.
June 19, 2009
3DHISTECH Ltd.
24(43)
MembraneQuant for MIRAX Viewer 1.12 User's Guide
3 Working with MembraneQuant
4. Before setting the parameters of the detection in the Membrane Analysis
Setup window, create a Color Deconvolution Profile.
3.3.1
Setting up a Color Deconvolution Profile
5. Click Setup to specify Color Deconvolution parameters.
Important!
There are four preset CCC files according to different camera sensitivities.
You can set the software to your automated slide stainer or labor protocol with this application. When assigning manual settings, it is recommended to take random intensity
samples from the preview screen of the most dense areas of the chromogen.
If you get the desired result in the chromogen preview and the parameters are set correctly, modify the color settings of counterstain. Marking with chromogen can result in a
strong background color; please, take this into account when sampling counterstain. It is
recommended to take samples from the background area of the image.
Note: The software automatically refreshes the displayed chromogen and counterstain
preview images according to your settings.
In the Color Deconvolution Setup window, you see a magnified image of the slide
where a preview of the original can be switched on and off by pressing Show Preview,
and the RGB color spectrum of the marker colors can be adjusted.
June 19, 2009
3DHISTECH Ltd.
25(43)
MembraneQuant for MIRAX Viewer 1.12 User's Guide
3 Working with MembraneQuant
Load
You can load predefined Color Deconvolution Profiles (CCC files).
Save
You can save your settings to Color Deconvolution Profiles.
Show Preview
A preview window opens where you can select the area of your
interest.
You can position the image in the left-side window by dragging.
You can get color samples from the image on the left.
Color boxes
Left-click on the boxes to adjust the RGB color spectrum if necessary, with the help of the slides or type in the required values
(press Enter to refresh). Right-click on the boxes to reset the
sampled color to black.
Note: The software continuously refreshes the two preview images on the right side of
the window during sampling, and also note, that sampling has effect on both preview images.
3.3.2
Setting Detection Parameters
6. After saving a Color Deconvolution Profile, click Close, and define the parameters of the algorithm in the Membrane Detection tab on the left side of the
Settings Preview window.
June 19, 2009
3DHISTECH Ltd.
26(43)
MembraneQuant for MIRAX Viewer 1.12 User's Guide
3 Working with MembraneQuant
Color Deconvolution
Use this to set up the CD (Color Deconvolution) parameters.
Image
Shows the mask and various aspects of the digitized slide.
Membrane
Shows the various aspects of the membrane algorithm.
Smooth: Blurring is recommended on an ordinary histology
sample (smoothness value is 3 by default), and when working on
low quality samples (too much noise on the image) it is recommended to raise the value.
Merge membrane spots: Membranes can be merged respectively to their border intensity, weakness-length, and area. Change
parameters until you get the desired detection result in the preview window.
Membrane Settings
Parameter settings of the membrane algorithm. You can adjust the
smoothness and the merging values.
Filter
Sets the size in µm and the average intensity of the objects that
MembraneQuant should detect as objects. There is a post-processing filter option in the algorithm based on Average intensity
and Area values. Thus, the superfluous tissues, gland lumens, and
cell cavities can be excluded from the detection process.
Nucleus Settings
Parameter settings of the nucleus. You can adjust the threshold,
the smoothness and the erosion values. You can also filter objects
by size and shape.
Median filter
Simple, but fast filtering method; it uses the median of adjacent
pixel values. A 3X3 blurring is recommended on an ordinary histology sample, and when working on low quality samples (too much
noise on the image) it is recommended to raise up the values.
Local Intensity Amplifier
Amplificates the local maximums, the area of which complies with
the R radius filter. Sets the intensity to the average cell size. The
value is 20-25 pixels on a sample taken with 20x magnification
level/zoom.
Threshold
Sets the pixel intensity threshold (values under the threshold will
be defined as background). The optimal value is between 20 and
30 on an average intensity slide.
Separate
The pixel distance between two seeds which separates the spots if
the given value is smaller than half of the seed-distance. The less
the value, the more it reduces the distance.
Filter Objects By Size
Sets the size of the objects in µm2 that MembraneQuant should
detect as objects. Excludes pixel groups that are too small or too
large. It enables you to filter the smaller nuclei of the inflamed
part of the tissue.
Filter Objects By Shape
Sets the shape of the objects that MembraneQuant should detect as objects. This filtering method marks the roundish nuclei of
the connective tissue cells distinguished from the epidermal cells
that have high shape factor. Value ranges from 0-1, where 1
marks the round nuclei.
June 19, 2009
3DHISTECH Ltd.
27(43)
MembraneQuant for MIRAX Viewer 1.12 User's Guide
3.3.3
3 Working with MembraneQuant
How to set the Scoring
7. Select Scoring tab and set the membrane scoring setup.
8. In the Scoring tab, you can set Average Intensity values for the nuclei marked
with +1, +2, and +3.
Automatic scoring can be set based on pixel intensity values. When defining
scoring values, please, take the previous settings and results of Color Deconvolution into account.
Cell score
Scores the cell membranes based on their intensity.
Field score
Scores the whole field.
Average membrane intensity
Scores an area based on the average intensity.
Std. Dev. of membrane intensity
Indicates the allowed deviation in intensity.
June 19, 2009
3DHISTECH Ltd.
28(43)
MembraneQuant for MIRAX Viewer 1.12 User's Guide
Up, down, left, right
3 Working with MembraneQuant
Moves the annotation up, down, left and right.
9. Save your settings and close the Membrane Scoring Setup form by clicking
Ok.
10. [optional] You can export Membrane Analysis measurements as CSV files by
specifying the Export Settings. Specify where the CSV file(s) should be saved.
Save Region measurements
The measurements will be exported to a CSV file that you can
open and further edit in any spreadsheet software (for example,
MS Excel, OpenOffice).
Save Cumulative measurements
Cumulative measurements will be exported to CSV files. A cumulative file will be created for each detected layer.
Save to single CSV
The measurements will be exported to a single CSV file. This file
will contain all the parameters of the layers.
11. Launch the MembraneQuant algorithm by clicking Start in the Membrane window.
Warning!
By using the same annotation and MISP file, the program overwrites the
previously saved CSV file. If you want to create a different file, locate an-
June 19, 2009
3DHISTECH Ltd.
29(43)
MembraneQuant for MIRAX Viewer 1.12 User's Guide
3 Working with MembraneQuant
other folder to save measurement data.
The process is fully automated, you only need to click Close when MembraneQuant has finished. The application leaves the slide open. If more than
one slide is open when you launch the Wizard, MembraneQuant always uses
the active one.
Tip!
To view the existing annotations and measurements on the slide, click
INFO in the slide toolbar and then select Show Annotations or Show
HQ Measurements from the shortcut menu.
3.4
Running Batch Process in MembraneQuant
In Image Analysis Modules menu, you have the option to work in batch mode. Select
the slides you want MembraneQuant to work with and specify the parameters according to which they should be analyzed.
3.5
Saving MembraneQuant Results to the Slide
MembraneQuant automatically saves the following data results to the slide:
3.6
•
outline of the detected objects
•
measured data: morphometrical or colorimetrical data on the detected objects
and area-specific parameters
Exporting MembraneQuant Results in CSV Format
(Measurements from One Slide)
When you create the MISP file, MembraneQuant exports the results to a CSV file. If you
need measurements from this slide, provide a new file name.
If you create several layers in the annotation with the MembraneQuant algorithm, the
data for each layer can be exported into a separate CSV file. Furthermore, a cumulative
CSV file is also exported with the layer data.
Note: CSV file names are generated automatically from the combination of names of
MISP, slide, and annotation.
June 19, 2009
3DHISTECH Ltd.
30(43)
MembraneQuant for MIRAX Viewer 1.12 User's Guide
1
Slide information
2
Name of the annotation(s) that you selected for the CSV export
3 Working with MembraneQuant
If you selected several annotations on the same slide for the CSV export, the CSV file lists
them at the top of the table; the object IDs of the annotations are listed one after the other
at the bottom section of the table.
3
Objects
Each object that the MembraneQuant algorithm found in the annotation is shown in a separate row.
4
Parameters
Each parameter is shown in a separate column.
5
Measurement
Each measurement (the value of a parameter in an object) is shown in a separate cell.
3.7
Exporting MembraneQuant Results to a Cumulative CSV
File
When you create the MISP file, MembraneQuant exports the results to a CSV file. If you
require measurements from several slides to create a cumulative database, select the
CSV file to which MembraneQuant appends two rows.
1
Slide information
2
The layer information is visible in the parameter names in the column headers.
3
Parameters that you selected for the MembraneQuant algorithm and for which measurement data is available for CSV export.
June 19, 2009
3DHISTECH Ltd.
31(43)
MembraneQuant for MIRAX Viewer 1.12 User's Guide
4
4 Working with Measurement Visualization
Working with Measurement Visualization
The Measurement Visualization module for MIRAX Viewer creates a scatter plot or a histogram from the MembraneQuant measurements.
4.1
Creating a Histogram
1. Click the
icon in the slide toolbar in the MIRAX Viewer.
2. Select the name of measurement (previously saved to the slide) from the MISP
names drop-down menu in the Data Selection panel.
3. Select the annotations you want to display. By clicking the right-side checkbox
above the Annotations window, you can select all the annotations. To remove
selections, click the checkbox to the left.
4. Select the object layer that you want to display from the Layer drop-down
menu.
5. Select Histogram and the press Show button.
6. Set the parameters. If you enter new values into the text fields, press Enter to
refresh the diagram.
June 19, 2009
3DHISTECH Ltd.
32(43)
MembraneQuant for MIRAX Viewer 1.12 User's Guide
4 Working with Measurement Visualization
Auto Refresh
Automatically updates the histogram when
you change the settings for the parent form.
Statistics
Overall shows the quantitative data of the objects.
X Axis
Offers various parameters for the X axis.
When you export the results into a CSV file,
there is an explanation for the abbreviations
of the parameter names.
Gate
Chooses an interval within the examined
range on X axis.
Mode
By using Gate function, the program either
creates new histogram, new scatter plot,
shows gallery or opens a new form where the
user can save CSV files, but only for the selected interval.
By not using Gate function, the program uses
all the above mentioned features but for the
whole data range.
7. Press Back to get to the parent window.
8. To create a snapshot of the histogram, click Save.
June 19, 2009
3DHISTECH Ltd.
33(43)
MembraneQuant for MIRAX Viewer 1.12 User's Guide
4 Working with Measurement Visualization
9. To exit Measurement Visualization, click Close.
4.2
Creating a Scatter Plot
1. Click the
icon in the slide toolbar in the MIRAX Viewer, only if no other data
visualization window is open.
2. Select the name of measurement (previously saved to the slide) from the MISP
names drop-down menu in the Data Selection panel.
3. Select the annotations that you want to display.
4. Select the object layer that you want to display.
5. Select Scatter Plot and the press the Show button.
If you select Scatter Plot button in the Mode panel of the previously opened Data
Visualization window, then press Go... . The process steps can be seen in the title
bar of the new window, for example, H:1 → S:1.
June 19, 2009
3DHISTECH Ltd.
34(43)
MembraneQuant for MIRAX Viewer 1.12 User's Guide
4 Working with Measurement Visualization
6. Set the parameters. If you enter new values into the text fields, press Enter to
refresh the diagram.
Auto Refresh
Automatically updates the histogram when
you change the settings for the parent form.
Statistics
Overall it shows the quantitative data of the
objects.
X Axis
Offers various parameters for the X axis.
Y Axis
Offers various parameters for the Y axis.
Gate
Chooses an interval within the examined
range on X axis. You can position the scatter
plot gates by clicking on the arrow.
Mode
By using Gate function, the program either
creates new histogram, new scatter plot,
shows gallery or opens a new form where the
user can save CSV files, but only in the selected interval.
By not using Gate function, the program uses
all the above mentioned features, but for the
whole data range.
7. Press Back to get to the parent window.
June 19, 2009
3DHISTECH Ltd.
35(43)
MembraneQuant for MIRAX Viewer 1.12 User's Guide
4 Working with Measurement Visualization
8. To create a snapshot of the histogram, click Save.
9. To exit Measurement Visualization, click Close.
4.3
Creating a Gallery
1. Click the
icon in the slide toolbar in MIRAX Viewer, only in case no other
data visualization window is open.
2. Select the name of measurement from the MISP names drop-down menu in
the Data Selection panel.
3. Select the annotations that you want to display.
4. Select the object layer that you want to display.
5. Select Gallery and the press the Show button.
If you select Gallery button in the Mode function panel of the previously opened
Data Visualization window, then press Go.... The process steps can be seen in the
title bar of the new window, for example, H:1 → S:1 → G:1.
June 19, 2009
3DHISTECH Ltd.
36(43)
MembraneQuant for MIRAX Viewer 1.12 User's Guide
4 Working with Measurement Visualization
Auto Refresh
Automatically updates the histogram when
you change the settings for the parent form.
Border size
Sets the size of the area around the object.
Zoom factor
Sets the zoom rate of the images. You can
determine the zoom value by entering the exact rate in the text field.
If you move the cursor over an image an info box appears conveying all the necessary data regarding that image.
6. Press Back to get to the parent window.
7. To export the gallery as an image, click Save.
8. To exit Measurement Visualization, click Close.
Tip!
If you select an image in the gallery, it will be highlighted in the scatter
plot as well.
June 19, 2009
3DHISTECH Ltd.
37(43)
MembraneQuant for MIRAX Viewer 1.12 User's Guide
4.4
4 Working with Measurement Visualization
Creating a Classification Gallery
1. Click the
icon in the slide toolbar in MIRAX Viewer, only in case no other
data visualization window is open.
2. Select the name of measurement from the MISP names drop-down menu in
the Data Selection panel.
3. Select the annotations that you want to display.
4. Select the object layer that you want to display.
5. Select Gallery and the press the Show button.
You can group your objects in accordance with their score values. You can revalidate and
rescore your object. On the right side panel, you can move cell nuclei from one group to
the other. On the left panel, you can view the selected cell nuclei.
June 19, 2009
3DHISTECH Ltd.
38(43)
MembraneQuant for MIRAX Viewer 1.12 User's Guide
June 19, 2009
4 Working with Measurement Visualization
Slideview
Shows the selected slide.
Outline
Shows the group-specific outline.
Boundary
Shows the number of the selected objects.
Export CSV
Exports the measurements to a CSV file.
Save to slide
Saves the changes to the slides.
Auto save
Automatically saves all changes. Note, that it
decelerates the program.
Border size slider
Increases / decreases the size of object borders in the right panel.
Zoom factor slider
Zooms in / out on the objects in the right
panel.
Toggle mode
You can select objects with the help of your
mouse in the right panel. You can rescore objects using right-click.
Tooltip
Moving cursor over an object shows the basic
information of the given object.
View
You can select among normal, horizontal or
vertical view of the objects in the right panel.
3DHISTECH Ltd.
39(43)
MembraneQuant for MIRAX Viewer 1.12 User's Guide
4 Working with Measurement Visualization
By right-clicking on a selected object or selected objects, you can rescore or delete them,
select all or none, and/or show their annotations.
The Field Parameters window lists parameter names and values of that specific annotation. Scroll down or change window size to see the whole list.
June 19, 2009
3DHISTECH Ltd.
40(43)
MembraneQuant for MIRAX Viewer 1.12 User's Guide
4 Working with Measurement Visualization
Related documents
MIRAX Viewer 1.12 User's Guide
ImmunoScreener Module for MIRAX Viewer 1.12, User's Guide
MIRAX SCAN User's Guide
Image processing and analysis
(http://books.google.com/books?id=kvWKgG6iPXMC&dqÖ)
June 19, 2009
3DHISTECH Ltd.
41(43)
MembraneQuant for MIRAX Viewer 1.12 User's Guide
4 Working with Measurement Visualization
Index
A
B
C
Annotation................................................2, 6, 8-12, 21-24, 27, 29-32, 34, 36, 38, 40, 44
Batch Process.........................................................................................................2, 30
CCC.......................................................................................................2, 6, 10, 25, 26
Chromogen................................................................................................................25
Classification Gallery...............................................................................................2, 38
Color Deconvolution..............................................................................2, 6, 8, 10, 25-28
Colorimetrical data.....................................................................................................30
Computation time.......................................................................................................21
Counterstain..............................................................................................................25
CSV.........................................................................2, 6, 8, 11, 22, 24, 29-31, 33, 35, 39
F
Field...............................................................................2, 5, 6, 8-12, 28, 32, 35, 37, 40
Field Parameters.........................................................................................................40
G
Gallery................................................................................................2, 8, 9, 33, 35-38
Gate....................................................................................................................33, 35
H
Histogram..........................................................................................2, 8, 32, 33, 35-37
L
Layer........................................................................2, 6, 9-11, 24, 29-32, 34, 36, 38, 44
Local Intensity Amplifier..............................................................................................27
Longitudinal studies....................................................................................................11
M
Measurement.................................................................2, 6-13, 21, 24, 29-32, 34, 36-39
Median filter...............................................................................................................27
MISP...................................................................................2, 6, 8, 10, 29-32, 34, 36, 38
R
MRXS......................................................................................................................6, 7
Rescore................................................................................................................38-40
RGB....................................................................................................................25, 26
S
Scatter plot..............................................................................................2, 8, 32-35, 37
Segmentation......................................................................................................6-8, 10
Segmentation Profile.................................................................................................6, 8
T
Teleconsultation......................................................................................................8, 21
V
Virtual slide.................................................................................................................9
June 19, 2009
3DHISTECH Ltd.
42(43)
MembraneQuant for MIRAX Viewer 1.12 User's Guide
Appendix A
A.1
- MembraneQuant
Object-specific parameters
Parameter
name
A.2
4 Working with Measurement Visualization
Description
Area
Area of the detected object in μm2
BInt
B intensity of the detected object
GInt
G intensity of the detected object
GrayInt
Gray intensity of the detected object
IF_C1
Integrated fluorescence in channel 1
IF_C2
Integrated fluorescence in channel 2
IF_C3
Integrated fluorescence in channel 3
LDia
Longest diameter of the detected object in μm
Peri
Perimeter of the detected object in μm
RInt
R intensity of the detected object
SDi
Shortest diameter of the detected object in μm
SF
Shape factor of the detected object
Summing parameters for an area
Parameter
name
Description
FA
Overall annotation area in mm2
fNO
NO/FA; frequency of detected objects per μm2
HSCORE
1*(‘NO+1’/’NO’)*100 + 2*(‘NO+2’/’NO’)*100 + 3*(‘NO+3’/’NO’)*100
MA
Overall mask area in mm2: Total area of all detected objects in each layer.
MA0
Mask area of negative Membrane
MA+1
Mask area of +1 Membrane
MA+2
Mask area of +2 Membrane
MA+3
Mask area of +3 Membrane
NO
Number of detected objects: Total number of each detected object in each
layer
NO0
Number of negative Membrane
NO+1
Number of +1 Membrane
NO+2
Number of +2 Membrane
NO+3
Number of +3 Membrane
rMA
(MA/FA)*100; relative mask (object) area in %
rMAPos
((‘MAO+1’ + ‘MAO+2’ + ‘MA+3’) / MA)*100
rNOPos
((‘NO+1’ + ‘NO+2’ + ‘NO+3’) / NO)*100
June 19, 2009
3DHISTECH Ltd.
43(43)