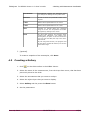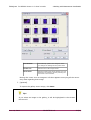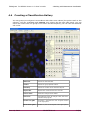
1
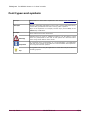
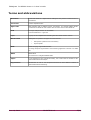
FISHQuant
Module
1.12
User's Guide
June 11, 2009
FISHQuant for MIRAX Viewer 1.12 User's Guide
Contents
Disclaimer.....................................................................................................................3
Font types and symbols..................................................................................................4
Terms and abbreviations.................................................................................................5
1 About FISH Analysis.....................................................................................................6
1.1 FISH Analysis in the MIRAX product family...............................................................6
1.2 Overview of FISH Analysis.....................................................................................7
1.2.1 FISHQuant algorithms...................................................................................7
1.2.2 MISP files.....................................................................................................7
1.2.3 Using a MISP file on other slides......................................................................7
2 Installing MIRAX Viewer and FISHQuant.........................................................................9
3 Working with FISH Analyzer........................................................................................10
3.1 Before you start..................................................................................................10
3.2 Creating an annotation for FISHQuant...................................................................10
3.3 Running the Algorithm on a Single Slide.................................................................11
3.4 Running Batch Process in FISHQuant.....................................................................15
4 Working with Measurement Visualization.......................................................................16
4.1 Creating a Histogram...........................................................................................16
4.2 Creating a Scatterplot..........................................................................................18
4.3 Creating a Gallery...............................................................................................19
4.4 Creating a Classification Gallery............................................................................21
Related documents.......................................................................................................23
Index..........................................................................................................................24
Appendix A FISH Analysis..............................................................................................26
A.1 Object-specific parameters...................................................................................26
A.2 Summing parameters for an area..........................................................................26
June 19, 2009
3DHISTECH Ltd.
2(26)
FISHQuant for MIRAX Viewer 1.12 User's Guide
Disclaimer
Copyright
All rights reserved.
©
2001-2008
3DHISTECH
Ltd.
The following patents are pending for 3DHISTECH products: WO/2006/030326,
P0700409 and 11/826,752.
3DHISTECH Ltd. is not liable for damage of whatever nature (including, but not limited
to, general or specific damage, indirect damage, consequential damage or incidental
damage, including the results of the analysis of the digitized slides, for example: change
of health status related to erroneous diagnosis from the digitalized slide(s)) that stems
from or is associated with use of Product, digitalized slides, quality of staining, quality of
stained slides, quality of used method of staining. Certain legal systems do not allow the
limitation or exclusion of accidental damage. This restriction therefore may not apply in
your case. 3DHISTECH Ltd. assumes no responsibility for the functionality and fault-free
condition of your "application programs" (Workflows, VBA macros, Commander scripts).
CAUTION
For research and education uses only, not for use in diagnostic procedures. This product
has not been approved or cleared as a medical device by the U.S. Food and Drug
Administration. The data and images obtained or viewed using this product are not
intended for clinical or diagnostic use.
Third-party disclaimer (LibTIFF - TIFF Library and Utilities)
3DHISTECH Ltd. is not liable for damage of whatever nature (including, but not limited
to, general or specific damage, indirect damage, consequential damage or incidental
damage, including damage resulting from lost profits, interruption of business, loss of
business information, pecuniary loss or similar damage) that stems from or is associated
with the incorporated part of this Product that is made by Silicon Graphics Inc.
THE SOFTWARE IS PROVIDED "AS-IS" AND WITHOUT WARRANTY OF ANY KIND,
EXPRESSED, IMPLIED OR OTHERWISE, INCLUDING WITHOUT LIMITATION, ANY
WARRANTY OF MERCHANTABILITY OR FITNESS FOR A PARTICULAR PURPOSE.
IN NO EVENT SHALL SAM LEFFLER OR SILICON GRAPHICS BE LIABLE FOR ANY SPECIAL,
INCIDENTAL, INDIRECT OR CONSEQUENTIAL DAMAGES OF ANY KIND, OR ANY
DAMAGES WHATSOEVER RESULTING FROM LOSS OF USE, DATA OR PROFITS, WHETHER
OR NOT ADVISED OF THE POSSIBILITY OF DAMAGE, AND ON ANY THEORY OF LIABILITY,
ARISING OUT OF OR IN CONNECTION WITH THE USE OR PERFORMANCE OF THIS
SOFTWARE.
Further information
For
the
latest
information
http://www.3dhistech.com.
June 19, 2009
on
3DHISTECH
products
3DHISTECH Ltd.
and
services,
visit
3(26)
FISHQuant for MIRAX Viewer 1.12 User's Guide
Font types and symbols
Example
Abbreviation or term that is explained in the section Terms and Abbreviations.
Example
Words or characters that appear on the screen. These include field names,
screen titles, pushbuttons and menu names, paths or options.
Keys on the keyboard. For example, function keys (such as F11) or the
Ctrl+O key combination.
Example
Warning!
Important!
Tip!
June 19, 2009
Cross-references to other documents.
Indicates that you need an additional module to use the feature or that
there are prerequisites for the task or that special care should be taken
when using certain feature of the device.
An important piece of information or a recommendation. The application
will work if you choose not to follow the recommendation but its performance might be less than optimal.
A suggestion about using the application in some other way or to some interesting purpose.
3DHISTECH Ltd.
4(26)
FISHQuant for MIRAX Viewer 1.12 User's Guide
Terms and abbreviations
Annotation
A particular detail of a digitized slide. FISHQuant can perform measurements on
annotations.
CSV format
Comma separated value
Digital slide
Slide digitized with a MIRAX scanner microscope, for example MIRAX SCAN.
Consists of an MRXS file and a folder with the same name as the MRXS file.
Field
In image analysis module: an annotation.
In ImmunoScreener: a grid cell.
Layer
A group of cell compartments matching the same stain and size criteria.
Measurement
FISHQuant can perform two types of measurements:
MISP
•
field-specific (related to the annotation)
•
object-specific
MIRAX Imaging Segmentation Profile
An image analysis segmentation and measuring algorithm is stored in a MISP
file.
MRXS
MIRAX Slide
File extension of a digitized MIRAX slide.
Object
A cell compartment (for example the FISH), cell or tissue that is relevant for the
immunohistochemical analysis.
Segmentation
Identification of cells or cell compartments based on their different reaction to
immunohistochemical staining.
June 19, 2009
3DHISTECH Ltd.
5(26)
FISHQuant for MIRAX Viewer 1.12 User's Guide
1
1 About FISH Analysis
About FISH Analysis
FISHQuant is an optional module for MIRAX Viewer. It allows you to detect and
separate FISH spots on the virtual slides and digitalized with MIRAX microscopes.
- FISH Analysis performs segmentation and measurements on MIRAX digital slides
based on the colors of the spots.
- Based on the applied FISH probe it can classify the cell nuclei.
1.1
FISH Analysis in the MIRAX product family
The following picture shows how FISH and Measurement Visualization extend MIRAX
Viewer and how they fit into the MIRAX product family.
1. Slides are digitized with MIRAX microscopes. A digitized slide consists of an MRXS file
and a folder with the same name as the MRXS file.
2. Digitized slides are stored on a computer. You can also use a dedicated server (MIRAX
Server) for storing the MIRAX slides.
June 19, 2009
3DHISTECH Ltd.
6(26)
FISHQuant for MIRAX Viewer 1.12 User's Guide
1 About FISH Analysis
3. Slides digitized with a MIRAX microscope can be viewed in MIRAX Viewer. If the slide
is stored on a MIRAX Server, it is opened through the Teleconsultation module. Local
slides are opened directly with MIRAX Viewer.
4. FISHQuant allows you to perform measurements on digital slides and to export the
measurements in CSV format.
5. Measurement Visualization displays the FISHQuant data as a scatterplot, a
histogram or a gallery.
6. Digital slides, including slides that store FISHQuant measurements, can be shared
via PathoNet. They can also be used in E-School training and exam material.
1.2
Overview of FISH Analysis
You can perform three types of tasks in FISHQuant:
1.2.1
•
create algorithms based on your parameters and then run them on a slide or a set
of slides
•
view the measurement results with the Measurement Visualization module,
save the measurement annotations with the slide or export the measurement results to CSV file(s)
•
create a report based your saved measurements.
FISHQuant algorithms
FISHQuant allows you a FISH analysis setup application, which has a segmentation and
a thresholding setup section. You can also change the score outlining color. The information needed for the algorithm is not saved on the slide but in a MIRAX Image Segmentation Profile (MISP) file, which can be used later to evaluate other annotations on the
same slide or on other slides.
1.2.2
MISP files
FISHQuant algorithms are saved in MISP files that store the following information about
the algorithm:
•
segmentation
(filters for noise reduction, segmentation and object separation)
•
classifications
June 19, 2009
3DHISTECH Ltd.
algorithm
7(26)
FISHQuant for MIRAX Viewer 1.12 User's Guide
1.2.3
1 About FISH Analysis
Using a MISP file on other slides
You can reuse the MISP on other slides from the same batch (on slides that are from the
same specimen) without modifications. You can also use the same algorithm on slides
from other specimens with the same staining.
You might need to adjust the profile to ensure that differences in the specimen or stain
quality do not affect the result.
June 19, 2009
3DHISTECH Ltd.
8(26)
FISHQuant for MIRAX Viewer 1.12 User's Guide
2
2 Installing MIRAX Viewer and FISHQuant
Installing MIRAX Viewer and FISHQuant
1. Start the MIRAX Viewer setup.exe file that you received on a MIRAX Viewer
DVD or downloaded in a compressed file.
2. Follow the instructions in the installation wizard.
3. Start the application setup.exe file that you received on the application DVD or
downloaded in a compressed file.
4. Follow the instructions in the installation wizard.
June 19, 2009
3DHISTECH Ltd.
9(26)
FISHQuant for MIRAX Viewer 1.12 User's Guide
3
3 Working with FISH Analyzer
Working with FISH Analyzer
3.1
Before you start
FISHQuant works on selected annotations. You will be able to run other algorithms on
several annotations by selecting all the annotations that you need when you start the algorithm.
Important!
FISH Analysis algorithms require a significant amount of computer resources. The resource need and the speed of the Membrane Analysis evaluation depends on the size and the number of the measured annotations,
and the quantity of detected objects.
To ensure accurate results and to reduce computation time:
•
Make the training annotation as small as possible. The annotated areas should not
be larger than 300x300 µm (1:1 magnification).
•
When you are creating a free-hand annotation, follow the outline of the area as
closely as possible.
•
Membrane Analysis only works on slides to which you have write access. You may
have only read permission to a slide if you access it through Teleconsultation and
the host only gave you read permission, or if you access a slide stored on a network drive and you only have read, but not write permission to the drive.
Tip!
If you need measurements on the entire specimen, put an annotation on
the slide to cover the entire specimen.
3.2
Creating an annotation for FISHQuant
1. Open the slide in MIRAX Viewer. For more information on how to open slides in MIRAX
Viewer, see section Working with slides in MIRAX Viewer in the MIRAX Viewer 1.12
User's Guide.
2. Create the annotation on the area of your interest:
•
Select the annotation type (rectangle or free-hand) and cover the area with the
annotation.
June 19, 2009
3DHISTECH Ltd.
10(26)
FISHQuant for MIRAX Viewer 1.12 User's Guide
3 Working with FISH Analyzer
For information on navigating and zooming on the slide, see section Viewing
slides in document Mirax Viewer 1.12 User's Manual.
•
In the Create or Edit Annotation window add a title to the annotation, enter a
comment and determine the background color of the title and the outline color of
the annotation. You can either select from predetermined colors or you can define
custom
colors.
Only captions are exported to the CSV output file. Annotation descriptions are visible only in MIRAX Viewer.
3. Repeat step 2 for each area on which you want to run the algorithm.
3.3
Running the Algorithm on a Single Slide
Open the slide in MIRAX Viewer.
1. In the main toolbar, click
dules.
June 19, 2009
and select FISHQuant from the Image Analysis Mo-
3DHISTECH Ltd.
11(26)
FISHQuant for MIRAX Viewer 1.12 User's Guide
3 Working with FISH Analyzer
2. Select a FISH probe from the roll-down list.
3. If it's not automatical, choose the adequate channel name for the colors.
4. Select the annotation(s) you want to analyze in the Available window and move
them to the Selected window. Also the whole slide can be selected to work with.
5. Select Profile Settings to define the parameters of the algorithm.
June 19, 2009
3DHISTECH Ltd.
12(26)
FISHQuant for MIRAX Viewer 1.12 User's Guide
3 Working with FISH Analyzer
FISH Settings
Setting or changing Profile Setup of the FISH algorithm.
Channel Settings
Specifying BRG color attributes .
Annotation Selection
Selecting annotation(s) for the measuring process.
Process Annotation Area
The algorithm will be executed only on the selected annotations.
Process Whole Slide
The algorithm will be executed on the whole digital slide area.
Export settings
The measurements will be exported to a CSV file that can be
opened and edited further in Microsoft Excel.
Important!
FISHQuant is able to work with slides scanned in appropriate channel
order (B-G-R) and with adequate channel name (blue/DAPI/Aqua;
green/FITC; red/orange/rhodamine) only.
6. Click ProfileSetup and set the following attributes:
Nucleus Threshold settings
Specifying the limit values in DAPI channel; enabling Hole Filling
with the DAPI mask if necessary.
Extended Segmentation
Especially for tissue samples. Emboss radius (1-100), Shape
smooth iteration (1-100) and Maximal parts to merge (2-16) can
be defined.
June 19, 2009
3DHISTECH Ltd.
13(26)
FISHQuant for MIRAX Viewer 1.12 User's Guide
3 Working with FISH Analyzer
Spot Thresholding
Specifying the limit values in FITC and Rhodamine channels.
Nucleus filtering
Nuclei can be filtered based on their shape factor and size.
Spots filtering
Spots can be filtered by size.
Nuclei setup
Setting the number of nuclei to measure and the average nucleus
area for segmentation.
Score Color
Score-specific labelling can be defined.
7. Click OK to save settings and the form will be closed.
Save Region measurements
The measurements will be exported to a CSV file that can be
opened and edited further in Microsoft Excel.
Save Cumulative measurements
The measurements will be exported to CSV files. A cumulative file
will be created for each detected layer.
Save to single CSV
The measurements will be exported to a single CSV file. This file
will contain all the parameters of the layers.
8. Launch the FISH Analysis algorithm by clicking Start.
The process is fully automated, you only need to click Close when FISH Analysis has
finished. FISH Analysis leaves open the slide. If more than one slide is open when you
start FISHQuant, FISHQuant starts using the active one.
June 19, 2009
3DHISTECH Ltd.
14(26)
FISHQuant for MIRAX Viewer 1.12 User's Guide
3 Working with FISH Analyzer
Tip!
To view the existing annotations and existing measurements on the slide,
click INFO in the slide toolbar and then select Show Annotations or
Show HQ Measurements from the shortcut menu.
3.4
Running Batch Process in FISHQuant
In Image Analysis Modules menu, you have the option to work with batch files. Select
the slides you want FISHQuant to work with and specify the parameters for which they
should be analyzed. Every slide needs to have the correct channel name and order,
as mentioned above.
June 19, 2009
3DHISTECH Ltd.
15(26)
FISHQuant for MIRAX Viewer 1.12 User's Guide
4
4 Working with Measurement Visualization
Working with Measurement Visualization
The Measurement Visualization module for MIRAX Viewer creates a scatter plot or a histogram from the FISHQuant measurements.
4.1
Creating a Histogram
1. Click
in the slide toolbar in the MIRAX Viewer.
2. Select the name of measurement from the drop-down menu that has been previously saved to the slide.
3. Select the annotations that you want to analyze. You can select all by checking
the Select all option.
4. Select the object layer that you want to display from the Layer drop-down menu.
5. Select Histogram and the press Show button.
6. Set the parameters. If you enter new values into the text fields, press Enter to
refresh the diagram.
June 19, 2009
3DHISTECH Ltd.
16(26)
FISHQuant for MIRAX Viewer 1.12 User's Guide
4 Working with Measurement Visualization
Auto Refresh
Automatically updates the histogram when
you change the settings for the parent form.
Statistics
Overall shows the quantitative data of the objects.
X Axis
Offers various parameters for the X axis.
When you export the results into a CSV file,
there is an explanation for the abbreviations
of the parameter names.
Gate
Chooses an interval within the examined
range on X axis.
Mode
By using Gate function, the program either
creates new histogram, new scatter plot,
shows gallery or opens a new form where the
user can save CSV files, but only in the selected interval.
By not using Gate function, the program uses
all the above mentioned features but for the
whole data range.
As the measurements run on digital slides, the perimeter and area sizes of the very small
objects (appropriating the pixel-size) can show some inaccuracy.
7. [optional]
To create a snapshot of the histogram, click Save.
June 19, 2009
3DHISTECH Ltd.
17(26)
FISHQuant for MIRAX Viewer 1.12 User's Guide
4.2
4 Working with Measurement Visualization
Creating a Scatterplot
1. Click
in the slide toolbar in the MIRAX Viewer.
2. Select the name of measurement, from the drop-down menu, that has been
previously saved to the slide.
3. Select the annotations that you want to analyze.
4. Select the object layer that you want to display.
5. Select Scatter Plot and the press the Show button.
6. Set the parameters. If you enter new values into the text fields, press Enter to
refresh the diagram.
June 19, 2009
3DHISTECH Ltd.
18(26)
FISHQuant for MIRAX Viewer 1.12 User's Guide
4 Working with Measurement Visualization
Auto Refresh
Automatically updates the histogram when
you change the settings for the parent form.
Statistics
Overall it shows the quantitative data of the
objects.
X Axis
Offers various parameters for the X axis.
Y Axis
Offers various parameters for the Y axis.
Gate
Chooses an interval within the examined
range on X axis. You can position the scatter
plot gates by clicking on the arrow.
Mode
By using Gate function, the program either
creates new histogram, new scatter plot,
shows gallery or opens a new form where the
user can save CSV files, but only in the selected interval.
By not using Gate function, the program uses
all the above mentioned features, but for the
whole data range.
7. [optional]
To create a snapshot of the scatterplot, click Save.
4.3
Creating a Gallery
1. Click
on the slide toolbar in the MIRAX Viewer.
2. Select the name of the measurement, from the drop-down menu, that has been
previously saved to the slide.
3. Select the annotations that you want to analyze.
4. Select the object layer that you want to display.
5. Select Gallery and the press the Show button.
6. Set the parameters.
June 19, 2009
3DHISTECH Ltd.
19(26)
FISHQuant for MIRAX Viewer 1.12 User's Guide
4 Working with Measurement Visualization
Auto Refresh
Automatically updates the histogram when
you change the settings for the parent form.
Border size
Sets the size of the image border.
Zoom factor
Sets the zooming rate of the images. You can
determine the zooming value by entering the
exact rate in the text field.
Moving the cursor over an image an info box appears conveying all the necessary data regarding that image.
7. [optional]
To export the gallery as an image, click Save.
Tip!
If you select an image in the gallery, it will be highlighted in the Scatter
Plot as well.
June 19, 2009
3DHISTECH Ltd.
20(26)
FISHQuant for MIRAX Viewer 1.12 User's Guide
4.4
4 Working with Measurement Visualization
Creating a Classification Gallery
You can group your objects in accordance with their score values (the probe used on the
objects). You can revalidate and rescore your object. On the right side panel, you can
move cell nuclei from one group to the other. On the left panel, you can view the selected
cell nuclei.
June 19, 2009
Slideview
Shows the selected slide.
Outline
Shows the group-specific outline.
Boundary
Shows the number of the detected objects.
Export CSV
Exports the measurements to a CSV file.
Save to slide
Saves the changes to the slides.
Auto save
Automatically saves all changes. Note, that it decelerates the program.
Border size glide
Increases / decreases the size of object borders
in the right panel.
Zoom factor glide
Zooms in / out on the objects in the right panel.
3DHISTECH Ltd.
21(26)
FISHQuant for MIRAX Viewer 1.12 User's Guide
June 19, 2009
4 Working with Measurement Visualization
Toggle mode
You can select objects with the help of your
mouse in the right panel. You can rescore objects using right-click.
Field Parameters
Shows the field specific parameters.
Tooltip
Moving cursor over an object shows the basic information of the given object.
View
You can select among normal, horizontal or vertical view of the objects in the right panel.
3DHISTECH Ltd.
22(26)
FISHQuant for MIRAX Viewer 1.12 User's Guide
4 Working with Measurement Visualization
Related documents
MIRAX Viewer 1.12 User's Guide
ImmunoScreener Module for MIRAX Viewer 1.12, User's Guide
MIRAX SCAN User's Guide
http://books.google.com/books?id=kvWKgG6iPXMC&dq
June 19, 2009
3DHISTECH Ltd.
23(26)
FISHQuant for MIRAX Viewer 1.12 User's Guide
4 Working with Measurement Visualization
Index
C
L
MISP...................................................5
computation time.................................9
Layer..................................................5
M
June 19, 2009
S
Segmentation......................................5
Segmentation Profile.............................5
3DHISTECH Ltd.
24(26)
FISHQuant for MIRAX Viewer 1.12 User's Guide
Appendix A
A.1
FISH Analysis
Object-specific parameters
Parameter
name
A.2
4 Working with Measurement Visualization
Description
Area
Area of the detected object in μm2
BInt
B intensity of the detected object
GInt
G intensity of the detected object
GrayInt
Gray intensity of the detected object
IF_C1
Integrated fluorescence in channel 1
IF_C2
Integrated fluorescence in channel 2
IF_C3
Integrated fluorescence in channel 3
LDia
Longest diameter of the detected object in μm
Peri
Perimeter of the detected object in μm
RInt
R intensity of the detected object
SDi
Shortest diameter of the detected object in μm
SF
Shape factor of the detected object
Summing parameters for an area
Parameter
name
Description
AvgPos0
Average positivity of negative Nuclei
AvgPos+1
Average positivity of +1 Nuclei
AvgPos+2
Average positivity of +2 Nuclei
AvgPos+3
Average positivity of +3 Nuclei
FA
Overall annotation area in mm2
fNO
NO/FA; frequency of detected objects per μm2
HSCORE
MA
Overall mask area in mm2: Total area of all detected objects in each layer.
MA0
Mask area of negative Nuclei
MA+1
Mask area of +1 Nuclei
MA+2
Mask area of +2 Nuclei
MA+3
Mask area of +3 Nuclei
NO
Number of detected objects: Total number of each detected object in each
layer
NO0
Number of negative Nuclei
NO+1
Number of +1 Nuclei
NO+2
Number of +2 Nuclei
June 19, 2009
3DHISTECH Ltd.
25(26)
FISHQuant for MIRAX Viewer 1.12 User's Guide
4 Working with Measurement Visualization
NO+3
Number of +3 Nuclei
rMA
(MA/FA)*100; relative mask (object) area in %
rMAPos
((‘MAO+1’ + ‘MAO+2’ + ‘MA+3’) / MA)*100
rNOPos
((‘NO+1’ + ‘NO+2’ + ‘NO+3’) / NO)*100
June 19, 2009
3DHISTECH Ltd.
26(26)