1
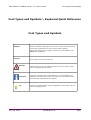
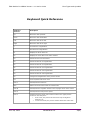
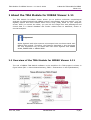
TMA Module for MIRAX Viewer 1.11 User's Guide June 26, 2008 TMA Module for MIRAX Viewer 1.11 User's Guide Contents Disclaimer.............................................................................................3 Font Types and Symbols \ Keyboard Quick Reference...................................4 1 About the TMA Module for MIRAX Viewer 1.11..........................................6 1.1 Overview of the TMA Module for MIRAX Viewer 1.11...........................6 1.2 Key Features of the TMA Module for MIRAX Viewer 1.11......................7 2 Installing TMA Bundled with MIRAX Viewer 1.11......................................9 2.1 Prerequisites.................................................................................9 2.2 Installing the Application Bundle......................................................9 3 Setting up a TMA Project.....................................................................10 3.1 Collecting Project Data in an Excel Worksheet and Building a TMA.......10 3.2 Starting the MIRAX TMA Software...................................................12 3.3 Opening a Project........................................................................13 3.4 Managing TMA Projects.................................................................14 3.5 Managing TMA Slides in a Project...................................................15 3.6 Linking Excel Data to TMA Cores....................................................16 3.7 Finding TMA Spots........................................................................18 3.8 Adjusting Annotations in the MIRAX Viewer 1.11...............................20 4 Scoring.............................................................................................22 4.1 Scoring Setup..............................................................................22 4.1.1 Simple Scoring Scheme...........................................................22 4.1.2 Combined Scoring Scheme......................................................23 4.2 Scoring TMA Spots.......................................................................25 4.2.1 Scoring in MIRAX Viewer 1.11 Software.....................................26 4.2.2 Scoring in Gallery...................................................................27 4.2.3 Sequential Scoring.................................................................27 4.3 Consensus Autoscore....................................................................28 5 Managing Spots in the Gallery..............................................................30 5.1 Function Buttons..........................................................................31 5.2 Labels........................................................................................32 5.3 Filter Parameters.........................................................................32 5.3.1 Filtering For All Users..............................................................32 5.3.2 Filtering Only For Consolidate User...........................................33 6 Exporting Data and Images.................................................................34 6.1 Exporting Data............................................................................34 6.1.1 Exporting Score Values to 1 Column..........................................35 6.1.2 Exporting Score Values to 2 Columns........................................35 6.1.3 Exporting Threshold Values into XLS.........................................36 6.1.4 Exporting Score Values for Generating Allred Values....................36 6.1.5 Exporting Score Values to TreeView Software.............................37 6.1.6 Exporting Score Values to R Software........................................38 6.2 Exporting Images.........................................................................41 7 Analyzing the Data Exported from TMA Module (Cluster Analysis)............43 June 26, 2008 3DHISTECH Ltd. 2(44) TMA Module for MIRAX Viewer 1.11 User's Guide Disclaimer Copyright © 2001-2008 3DHISTECH Ltd. All rights reserved. The following patents are pending for 3DHISTECH products: WO/2006/030326, P0700409 and 11/826,752. 3DHISTECH Ltd. is not liable for damage of whatever nature (including, but not limited to, general or specific damage, indirect damage, consequential damage or incidental damage, including the results of the analysis of the digitized slides, for example: change of health status related to erroneous diagnosis from the digitalized slide(s)) that stems from or is associated with use of Product, digitalized slides, quality of staining, quality of stained slides, quality of used method of staining. 3DHISTECH Ltd. assumes no responsibility for the functionality and fault-free condition of your "application programs" (Workflows, VBA macros, Commander scripts). CAUTION For research and education uses only, not for use in diagnostic procedures. This product has not been approved or cleared as a medical device by the U.S. Food and Drug Administration. The data and images obtained or viewed using this product are not intended for clinical or diagnostic use. Third-Party Disclaimer (LibTIFF - TIFF Library and Utilities) 3DHISTECH Ltd. is not liable for damage of whatever nature (including, but not limited to, general or specific damage, indirect damage, consequential damage or incidental damage, including damage resulting from lost profits, interruption of business, loss of business information, pecuniary loss or similar damage) that stems from or is associated with the incorporated part of this Product that is made by Silicon Graphics Inc. THE SOFTWARE IS PROVIDED "AS-IS" AND WITHOUT WARRANTY OF ANY KIND, EXPRESSED, IMPLIED OR OTHERWISE, INCLUDING WITHOUT LIMITATION, ANY WARRANTY OF MERCHANTABILITY OR FITNESS FOR A PARTICULAR PURPOSE. IN NO EVENT SHALL SAM LEFFLER OR SILICON GRAPHICS BE LIABLE FOR ANY SPECIAL, INCIDENTAL, INDIRECT OR CONSEQUENTIAL DAMAGES OF ANY KIND, OR FOR ANY DAMAGES WHATSOEVER RESULTING FROM LOSS OF USE, DATA OR PROFITS, WHETHER OR NOT ADVISED OF THE POSSIBILITY OF DAMAGE, AND ON ANY THEORY OF LIABILITY, ARISING OUT OF OR IN CONNECTION WITH THE USE OR PERFORMANCE OF THIS SOFTWARE. Further Information For the latest information on 3DHISTECH products and services, visit http://www.3dhistech.com. June 26, 2008 3DHISTECH Ltd. 3(44) TMA Module for MIRAX Viewer 1.11 User's Guide Font Types and Symbols Font Types and Symbols \ Keyboard Quick Reference Font Types and Symbols Example Words or characters that appear on the screen. These include field names, screen titles, pushbuttons and menu names, paths or options. Keys on the keyboard. For example, function keys (such as F11) or the Ctrl+O key combination. Example Warning! Cross-references to other documents. Indicates that you need an additional module to use the feature or that there are prerequisites for the task. Important! Contains an important piece of information or a recommendation. The application will work if you choose not to follow the recommendation but its performance might be less than optimal. Tip! Contains a suggestion about using the application in some other way or to some interesting purpose. June 26, 2008 3DHISTECH Ltd. 4(44) TMA Module for MIRAX Viewer 1.11 User's Guide Font Types and Symbols Keyboard Quick Reference Keyboard shortcut Description Up Moves the slide upwards. Down Moves the slide downwards. Left Moves the slide to the left. Right Moves the slide to the right. + Increases the magnification. - Decreases the magnification. F1 Displays the list of shortcuts. F2 Displays the entire slide in the active window. F3 Shows the size at its actual size. F4 Shows the slide at x2 magnification. F5 Shows the slide at x5 magnification. F6 Shows the slide at x10 magnification. F7 Shows the slide at x20 magnification. F8 Shows the slide at x40 magnification. F9 Changes the magnification of the preview screen. F11 Turns on/off the full screen view. Ctrl+T Shows/hides the slide tree. ESC Returns from full screen mode to normal mode. Ctrl+M Shows/hides the magnifier window in the top-right corner of the screen. Ctrl+P Shows/hides the slide preview panel. Ctrl+V Switches between the Fit and Full View modes in the upper preview window on the slide panel: • • June 26, 2008 In Fit mode, the preview window shows only the digitized specimen cut. In Full View mode, the preview window shows the entire slide. 3DHISTECH Ltd. 5(44) TMA Module for MIRAX Viewer 1.11 User's Guide 1 About the TMA module for MIRAX Viewer 1.11 1 About the TMA Module for MIRAX Viewer 1.11 The TMA Module for MIRAX Viewer allows you to perform molecular morphological analyzes on slides digitized with MIRAX scanner microscopes. With this module, you can digitally inspect and score stained tissue micro array (TMA) slides on your computer screen. After you scored the slides, you can link the image files with pathological and clinical data in a shared database and further submit them to statistical, cluster or survival analyses. Important! Slides digitized with other scanner microscopes have not been tested with MIRAX TMA module. Therefore, the features described in this document are fully supported only for slides that have been digitized with MIRAX SCAN, MIRAX MIDI or MIRAX DESK. 1.1 Overview of the TMA Module for MIRAX Viewer 1.11 The role of MIRAX TMA Module software in the workflow of a TMA project is shown in figure below (IHC = immunohistochemistry; FISH = fluorescence in situ hybridization) June 26, 2008 3DHISTECH Ltd. 6(44) TMA Module for MIRAX Viewer 1.11 User's Guide 1 About the TMA module for MIRAX Viewer 1.11 1.2 Key Features of the TMA Module for MIRAX Viewer 1.11 • Project functions ‒ Multiple users can score the spots. • Users can be selected or created in the viewer. • In single user projects the Manage users function can be ignored. • In multi user projects a special Consolidate user is generated. ‒ Different scoring scheme can be defined for every stain. ‒ Conversion of old TMA projects to the new user based format. ‒ Backward compatibility with previous viewer versions. • Support for Fluorescent TMAs • Data can be exported in CSV files in standard and TreeView (Stanford University CA USA) compatible formats • TMA gallery ‒ Images are cached ‒ Spots can be magnified in five steps (from 0.3x to Fit) ‒ Filtering for non scored spots ‒ Image export • Informative filenames • Selectable magnification • Spot images can be saved individually ‒ Sequential scoring in the Gallery automatically offers full size image of a spot on the screen, which can be further magnified in the magnifying window. Scored image will disappear allowing the next spot to pop up for scoring. ‒ There is a magnifying window (x2, 4, 8, and 16) in the Gallery function supporting scoring in filtered sets of spots at appropriate image size and June 26, 2008 3DHISTECH Ltd. 7(44) TMA Module for MIRAX Viewer 1.11 User's Guide 1 About the TMA module for MIRAX Viewer 1.11 resolution. In this way slide do not have to be opened for viewing histological details. • ‒ ‒ Score consolidation Scores are calculated according to the selected function (upper median, lower median and identical) ‒ The scores of other users can be exported to a new Excel file ‒ Other users scores can be displayed in the spot caption in the gallery and in the slide viewer window A combined 2D scoring scheme can be prepared by the user. June 26, 2008 3DHISTECH Ltd. 8(44) TMA Module for MIRAX Viewer 1.11 User's Guide 2 Installing TMA Bundled with MIRAX Viewer 1.11 2 Installing TMA Bundled with MIRAX Viewer 1.11 TMA is not a standalone application: you need MIRAX Viewer to run it. Therefore, it is installed together with MIRAX Viewer, bundled into one executable. 2.1 Prerequisites Tools to be Used Description of Prerequisites Software: MIRAX Viewer version 1.11 Runs on Microsoft Windows XP and Vista TMA Module \ Excel Export Microsoft Excel Hardware: MIRAX Viewer bundled with the HistoQuant and Measurement Visualization Modules Recommended: Pentium C2D (DualCore), 2 GHz, 2GB RAM Minimum: Pentium P4, 3GHz, 1GB RAM Minimum Disk Space: 110 MB 2.2 Installing the Application Bundle 1. Start the setup.exe file that you received on a DVD or downloaded in a compressed file. 2. Follow the instructions in the Installation Wizard. June 26, 2008 3DHISTECH Ltd. 9(44) TMA Module for MIRAX Viewer 1.11 User's Guide 3 Setting up a TMA Project 3 Setting up a TMA Project 3.1 Collecting Project Data in an Excel Worksheet and Building a TMA A TMA project can be started with collecting pathological and clinical data of relevant patients in Excel data sheet format (TMA Lookup table) and using the individual donor blocks correlated with their H&E stained sections for punching out representative cores and producing TMA blocks either using an automated or a manual TMA arrayer. TMA Master instrument is available to support MIRAX TMA projects. Each Excel file supporting a project (TMA database file) should include at least three worksheets: One for the main Lookup table (Lookup); one (or more) for linking stained spots with their location in the TMA blocks (B-1..B-n); and one for linking the stains to Excel Lookup table data (Slides). For the sake of safe tissue core (stained spot) identification (see later at Spot Finding), it is essential to include accurate information into columns A and B and C of the Lookup table. All other columns are required for the final correlation analyses with staining profiles. June 26, 2008 3DHISTECH Ltd. 10(44) TMA Module for MIRAX Viewer 1.11 User's Guide 3 Setting up a TMA Project Either using a manual or automated arrayer, a TMA map should be designed for each block to show the location and orientation of tissue cores according to the TMA block ID (B-1, B-2, B-3 etc…). This map will be used later at Spot Finding. The serial numbers in the TMA map correspond to the Unique TMA sample ID of the Excel data sheet. If there are clusters of cores within a TMA block they should also be numbered on the same basis including all clusters of a block into the same worksheet as they are arranged in the block. Tip! The core behind the red label in the corner of each TMA block map is an orientation tissue easily differentiated from the test tissue type (for example liver). However, one can use any other ways for easily recognizing the original orientation of the TMA section. Leaving out cores may be an option, but please consider that the depth of the cores is different and some may be used up at cutting before others, which also result in missing cores. The third worksheet in the Excel database file identifies stains used in the particular project. In the Stain column one can indicate the official, may be full name of the detected antigens, for example with the given clone used. In the block column (that is, B-1 for TMA Block 1, B-2, B-3… for further blocks in the project), one must use the very same labels which had been used for labeling the given slide at scanning. In other words, a slide in each TMA block column is best defined by the serial number of the slide, the applied marker and the TMA block ID (that is, the slide named 12-E-Cadh is the 12th section of B-2 block stained for E-Cadherin marker). For further instructions on slide scanning please refer to the User Guide of MIRAX Scan. June 26, 2008 3DHISTECH Ltd. 11(44) TMA Module for MIRAX Viewer 1.11 User's Guide 3 Setting up a TMA Project Important! For identifying the position of consecutive sections in Z-dimension /depth/, it is essential to use serial numbers in front of the slide labels when scanning with the MIRAX Scan (see in column B-1). It is also useful to choose the same order of sections for immuno-staining different markers in different blocks (for example E-Cadherin is followed by EGFR, etc… in each block). However, these features are optional and slides that are not labeled in this way may also be supported by the software. When starting a project, all information included in the Excel database file can be imported into the MIRAX TMA software, to be exported into a new Excel file added with the scores when scoring will have been finished. 3.2 Starting the MIRAX TMA Software For creating a new TMA project, click on the Slide-project folder in the Slide Tree panel. June 26, 2008 3DHISTECH Ltd. 12(44) TMA Module for MIRAX Viewer 1.11 User's Guide 3 Setting up a TMA Project Clicking on the “+” sign will list all slides found in the given folder, while in the right side panel their preview image will be opened with the same labels at the bottom, which were used at their scanning. Choose Create New TMA Project from the pop-up menu after clicking with the right mouse button to the Slide Project folder, for example the one named TMA here. Create a name for the new project in the dialog box then click OK. Since the new version of the program offers parallel scoring for several users, it will ask for scorer (user) name. Then the new project will include all digital slides found in the original Slide project folder. 3.3 Opening a Project Existing projects are marked with a TMA icon, followed by the name of the project. Double clicking on the given project icon will open the project folder. The software will ask for the scorer, if it is only the same person who created the project, go ahead. If different, Add new user to the list. In case of more than one assessors in a project, the Consolidate option is automatically added, which can either be used as a separate scorer to decide the final consensus scores, or this function will offer automated creation of consensus scores based for example on mean values of different scores. Obsolete slides from a project can be erased by clicking on the annotation of a slide with the right mouse button and choosing Erase Slide(s) from TMA. By keeping the Ctrl button pressed one can select more than one slide for elimination from the project. These slides will be removed from the project but will not be deleted from the disk. June 26, 2008 3DHISTECH Ltd. 13(44) TMA Module for MIRAX Viewer 1.11 User's Guide 3 Setting up a TMA Project Important! To avoid confusion only one project is allowed open at a time. Existing TMA projects can also be removed by clicking on the project name with the right mouse button and choosing Remove project from Tree. 3.4 Managing TMA Projects Having started a new TMA project or opened up an existing project the function buttons available for project management are listed on the top of the right hand panel. • Gallery – Allows for creating TMA spot galleries according to any filter options represented by each column in the Excel Lookup file. • Import – Allows importing database from Excel in XLS format. • Export – Allows exporting database to a new Excel file merging original Lookup table data with the newly generated scoring data. June 26, 2008 3DHISTECH Ltd. 14(44) TMA Module for MIRAX Viewer 1.11 User's Guide 3 Setting up a TMA Project • Scoring Scheme – Allows creating either simple or combined schemes. (Look at the details in chapter 4.1) • Consensus Autoscore – This button appears only for Consolidate user to make possible the comparison of the of the ordinary users' scores. • Matrix View – Sorts slides in the following order: Each row represents one TMA block displaying consecutive sections (Z-dimension /depth/). Each column lists sections of consecutive blocks stained for the same marker below one another. 3.5 Managing TMA Slides in a Project Having started a project, there are four functions to choose from the pop-up menu when clicking on a slide with the right mouse button. • The Spot Finding option allows for identifying and linking to Excel data of each stained spots within the given TMA slide (block). • The Open Slide option allows for opening a slide in the MIRAX Viewer software. • By choosing the Marked option one can indicate with a green tick label in the grid of a slides annotation that the scoring of that slide is completed. (Please note that this option will not be activated automatically when scoring has finished!) June 26, 2008 3DHISTECH Ltd. 15(44) TMA Module for MIRAX Viewer 1.11 User's Guide • 3 Setting up a TMA Project The Erase Slide option is used for eliminating the given slide from a project (see above). The slide label including the serial section number (Z-dimension /depth/), stain label and block number appear in the bottom region of the thumbnail image of each slide. A grid label seen in the upper left corner of each slides annotation indicates that the spots within the given slide have been identified by using the Spot Finding (The green tick label for Marked appears if activated, and may refer to the completed scoring). 3.6 Linking Excel Data to TMA Cores To identify cores and link to patients pathological and clinical data, one must first Import data stored in the Excel TMA database file by choosing the corresponding .XLS file. The name of the imported Excel file will appear below the function Toolbar in the project panel (Source XLS). One can choose to import either all information or optional numbers of Excel columns. June 26, 2008 3DHISTECH Ltd. 16(44) TMA Module for MIRAX Viewer 1.11 User's Guide 3 Setting up a TMA Project Tip! TMA Master does not support the newer than 2003 Excel files (*.xlsx). If you have newer Excel than 2003, you must choose in its File menu at Save as.. option the following file type: Excel 97-2003-worksheet (*.xls). June 26, 2008 3DHISTECH Ltd. 17(44) TMA Module for MIRAX Viewer 1.11 User's Guide 3 Setting up a TMA Project 3.7 Finding TMA Spots Having started a TMA project, the first task is to identify the individual spots on a TMA slide by choosing the Spot Finding option, which opens up a new window. Please, note that without spot identification no further options of TMA management are accessible. The main function of Spot Finding is to link stained tissue spots to relevant patients data in Excel. If there is an unwanted background staining, or the specific staining is too week, one can adjust the Background threshold level to make sure that all stained spots will be scanned. The next step is to define the diameter of the spots either directly writing it in the box or by clicking on the arrow signs in the Spot Diameter option, and pulling a line over the largest spot. The distance will appear in millimeters. Please, note that the spot diameter parameter has strong effect on the result of spot finding. Then the number of spots arranged along the horizontal and vertical axes of the TMA slide must be defined (for example 4x6) in the New Grid window. This can go up unlimited, but the basis of identification is the same. After clicking on the grid sign, each corner spots in a TMA must be clicked on one after the other, for example going clockwise, resulting in a red X sign on the labeled corner spots. After the 4th corner will June 26, 2008 3DHISTECH Ltd. 18(44) TMA Module for MIRAX Viewer 1.11 User's Guide 3 Setting up a TMA Project have been finished a net of lines will connect the middle of the spots and black square annotations will surround their borders (the size of square annotations was defined in the Cell Diameter option). By clicking on the Erase Selected Grid button with a red X on top will erase the annotations and the procedure can be started again. By clicking on the Numbering from Excel button will open a window showing the original spot map from the Excel database file (B-1, B-2, etc…). Identification of the spots can be done by clicking on one of the corner numbers in the Excel spot map and dragging it over the corresponding stained spot (drag-and-drop). Having repeated this by pulling over the number from the uppermost opposite corner and placing it to the opposite corner of the TMA slide will result in the desired numbering to appear over the cores. Important! Using an orientation tissue easily differentiated from the test tissue, such as liver (as suggested above) for example when testing breast cancer samples, safely assists in the accurate core finding. However, this is optional and any other system may be used for recognizing TMA slide orientation. June 26, 2008 3DHISTECH Ltd. 19(44) TMA Module for MIRAX Viewer 1.11 User's Guide 3 Setting up a TMA Project There is an Auto numbering option, which should only be used if the spot map is regular without any rows or column of spots missing and the numbering starts from the upper left corner of a TMA slide. The user can cancel the grid-numbering i.e. the spot numbers by pushing the Clear Num button. After spot identification layout will have been accepted, the annotations and numbers attached will be saved by clicking on the Finish button. 3.8 Adjusting Annotations in the MIRAX Viewer 1.11 Identified TMA slides can be opened in the MIRAX Viewer 1.11 software either by double clicking on their preview slide or by using the right mouse button and choosing Open Slide option from the pop up menu. The TMA identifier square linked with the core ID number annotation will appear automatically on each stained tissue core. If there is no such annotation seen, the TMA slide needs to be identified by using the Spot Finding function. June 26, 2008 3DHISTECH Ltd. 20(44) TMA Module for MIRAX Viewer 1.11 User's Guide 3 Setting up a TMA Project The shape, size and position of TMA annotations can be modified after clicking on the green based TMA sign in the Toolbar. By keeping the left mouse button down on the number of the annotation, the whole annotation (the serial number, perhaps the score-value in parentheses and the frame) can be moved away from the stained spot. By clicking on the corners or the edges of the square label, the shape and size of the frame can be modified. June 26, 2008 3DHISTECH Ltd. 21(44) TMA Module for MIRAX Viewer 1.11 User's Guide 4 Scoring 4 Scoring The latest version of TMA software allows for using different scoring schemes within the same project for example when markers detected (stains) in a project cannot be assessed on the same basis. The schemes are stored and offered for later use under the Stain option. The name and value of empirical scores used in a project can be predefined in the Scoring Scheme menu. The first step is to chose the stain (in the Stains panel, from combo box Selected Stain) for defining the score-values. The second step is to chose from options Simple or Combined in the Scoring Scheme Type panel. 4.1 Scoring Setup 4.1.1 Simple Scoring Scheme Choose the Simple option in the Scoring Scheme Type panel. Scoring can be defined on a maximum 10-scale system allowing for considering staining intensity or % of positive cells. By clicking on the Up or Down direction-buttons the user can change the number of scores. Though options are flexible and there are many, the use of a 4-scale system including -2 = negative, 0 = equivocal, 1 = weak-moderate positive, 2 = strongly positive scores, is June 26, 2008 3DHISTECH Ltd. 22(44) TMA Module for MIRAX Viewer 1.11 User's Guide 4 Scoring practical for later Unsupervised Hierarchical Clustering, which may be done without using score conversion (Deconvoluter). 4.1.2 Combined Scoring Scheme Choose the Combined option in the Scoring Scheme Type panel. The user can either write in or choose the property, one wish to evaluate and she\he can define the number of rows and columns (max. 10 rows and 10 columns). Then the user must write into the heads of rows and columns either the ranges of the chosen two properties or the structural-functional parts of the cell (for Frequency-values, for example, 0-10 %, 1-40 %, 40-80 %, 80-100 %; for Stain-Intensity: weak, moderate, strong; for Localisation: nucleus, cytoplasm, membrane). Then the user must write into each end-field (text-box) of rows and columns the score values. June 26, 2008 3DHISTECH Ltd. 23(44) TMA Module for MIRAX Viewer 1.11 User's Guide 4 Scoring Making Special Schemes: The user has a chance to define \ name special schemes giving them a value, a number (for example, Non Evaluable_0; Negative_-1) after marking in the Special Scheme Setup option. One can return to the Scoring Scheme menu by pushing the Back button. Threshold Setup: After marking in the Threshold Setup option, the user can define groups of scoring schemes for showing a common, visually hidden but known by the researcher, biological property of these value-groups (for example, a given DNA-section produces the examined protein in various rows and columns). The user can define the number of threshold-groups, and he or she can name these threshold-groups, writing a value into the text boxes of these threshold-groups, and giving a chosen color to these groups (by right mouse clicking on color box under the Color option). June 26, 2008 3DHISTECH Ltd. 24(44) TMA Module for MIRAX Viewer 1.11 User's Guide 4 Scoring One can return to the Scoring Scheme menu by pushing the Back button. After all these steps the user supposed to push the Apply or OK button. 4.2 Scoring TMA Spots Scoring of stained TMA spots can either be done from the Viewer function after opening a slide or from the Gallery. Scoring from Gallery offers much more flexibility in this updated version (see later), thus it should be preferred for scoring. Validated scoring --- allowing for possible re-scoring of spots in Gallery mode when sorted with other spots along with any common feature(s) --- is an important function of the MIRAX TMA Module software, ensuring reproducible results without the risk of false conclusions based on inconsistent scoring. June 26, 2008 3DHISTECH Ltd. 25(44) TMA Module for MIRAX Viewer 1.11 User's Guide 4 Scoring 4.2.1 Scoring in MIRAX Viewer 1.11 Software Scoring in the MIRAX Viewer 1.11 window can be done by clicking on the core with the right mouse button and choosing a score from the predefined values (see Management of TMA Projects above) in the pop-up menu. If a score has already been attached to the particular spot, it is shown in parentheses next to the spot ID (Unique TMA core ID) and also indicated by a pushed-down button in the scoring pop-up menu. When the TMA slide is closed all the scores given will be saved even if not all spots are evaluated. Having all the spots of a TMA section been scored it very useful to label the section Marked with a green tick label after closing the slide (see Management of TMA Slides). Tip! After Pushing down the Info button, the appearing pop-up menu offers an extra sub-menu only for Consolidate User to make her\him possible the overview and comparison of scores of all users. June 26, 2008 3DHISTECH Ltd. 26(44) TMA Module for MIRAX Viewer 1.11 User's Guide 4 Scoring 4.2.2 Scoring in Gallery The way of scoring here is the very same as used and described at Scoring in Viewer (see above). Briefly, it can be done by clicking on the spot with the right mouse button and choosing a score from the per-defined values of the pop-up menu. If a score has already been attached it is indicated by a pushed-down button in the scoring pop-up menu and the score appears in the label above the spot after spot ID and stain. 4.2.3 Sequential Scoring Sequential scoring in the Gallery automatically offers full size image of a spot on the screen, which can be further magnified in the magnifying window. Scores can also be given using the numeric pad on the keyboard to speed up work. Scored image will disappear allowing for the next spot to pop up for scoring. June 26, 2008 3DHISTECH Ltd. 27(44) TMA Module for MIRAX Viewer 1.11 User's Guide 4 Scoring 4.3 Consensus Autoscore In case of more than one assessors working in a project, the Consolidate option is automatically offered, which can be used as a separate scorer (user) window for creating consensus scores. Consensus Autoscore function allows automated consolidation of scores by accepting values identical at all assessors of by choosing the median values of all scorers to be registered into the score boxes of the consolidator. The scores given by the assessors can be accessed and revealed through the slide info panel in the Viewer. Also, all scoring data are accessible and can be used for filtering in the Gallery. The Score label represents the person working under the Consolidate option. The order of scores given by different users seen above the gallery spots is the same as their order under the Labels option (left hand panel). June 26, 2008 3DHISTECH Ltd. 28(44) TMA Module for MIRAX Viewer 1.11 User's Guide June 26, 2008 3DHISTECH Ltd. 4 Scoring 29(44) TMA Module for MIRAX Viewer 1.11 User's Guide 5 Managing Spots in the Gallery 5 Managing Spots in the Gallery In the Gallery, stained TMA spots can be sorted into restricted groups irrespective of their physical location (for example different glass slides) according to their staining, pathological or clinical features listed under the Filters option (lower left panel). Important! After each setting the user must push the Build Gallery button for the order-execution. June 26, 2008 3DHISTECH Ltd. 30(44) TMA Module for MIRAX Viewer 1.11 User's Guide 5 Managing Spots in the Gallery 5.1 Function Buttons (In the left upper window-corner) Desired spot magnifications can be set up with the Zoom panel in a range between x0.3 to fit on the screen. There are 5 function buttons below the Zoom option. Pushing the Build Gallery button (a green, swirling arrow) will initiate gallery spot collection. Pushing down the Sequential Scoring button (a stained TMA-spot symbol with numbers 1,2,3 in vertical order) will allow sequential scoring. Pushing down the Export Images button (an opening folder symbol) will allow saving of the selected image-collection. Pushing down the Matrix View button (a chessboard symbol) will display the spots in their original position on the slides. Pushing the magnifier glass button will activate the gallery zoom window. By right mouse clicking the user can chose from the magnification options and can define the magnification-window position. The range of magnification can be defined by clicking on the magnifier glass with the right mouse button. The magnifying window can be positioned from the same drop-down menu to any of the 4 corners of the gallery. June 26, 2008 3DHISTECH Ltd. 31(44) TMA Module for MIRAX Viewer 1.11 User's Guide 5 Managing Spots in the Gallery 5.2 Labels (In the middle left part of the window) From the Labels panel one can choose what information to be shown above the spots in the gallery. There can be as many as the number of patients related feature groups (columns) in the Excel Lookup table. Options in the Filters panel (lower left) allow for creating selected spot collections based on the listed features alone or combined. The default of each parameter is All, for selecting all members of the given category. Each filter parameter group is defined by one column in the Excel Lookup table and most of them are optional. 5.3 Filter Parameters 5.3.1 Filtering For All Users Sample ID correspond to the Unique TMA Sample ID in Excel. In some cases one sample ID identifies one patient. However, in most cases, particularly at tumor heterogeneity, or small core diameter, more than one sample (2-5) of a patient may be used, which can be managed under different sample IDs and grouped into gallery by sorting together in the Gallery with donor block ID. Restricting Sample ID to one sample only and leaving all other parameters at their default (All) allows for the rapid confirmation of the accuracy of core identification. Restricting the Score and Stain options into one parameter each will allow comparing spots of a particular staining obtained the same score. The inconsistently scored samples can be recored within the Gallery function before final exporting of the results into Excel database for further correlation studies (validated scoring). This feature of the MIRAX TMA Module allows for using highly reliable score values for statistical-, survival- and cluster analyses. June 26, 2008 3DHISTECH Ltd. 32(44) TMA Module for MIRAX Viewer 1.11 User's Guide 5 Managing Spots in the Gallery In the Gallery, the spots which have not yet been scored can be collected with filtering. Scored (on the base of the Special Scheme in the Scoring Scheme Setup menu) spots can be re-selected and re-scored. In equivocal cases, doubtfully scored spots can be reseted for non-scored, allowing their re-scoring at the end of a project based on a professional consultation, when collected them together. Using the magnifier glass at x16 magnification allows for listing and comparing several spots on the same screen area and for proper scoring in the magnifying window at high image resolution. The space for gallery images can be extended full screen on the expense of the left hand gallery menu panel by clicking on the small black triangle in the middle right edge of gallery menu panel. 5.3.2 Filtering Only For Consolidate User Only the Consolidate User has a chance to assembling spot-galleries on the base of arbitrarily selected scores of all users. (Look at the marked with red circle extra menu of the TMA Gallery window, here below.) June 26, 2008 3DHISTECH Ltd. 33(44) TMA Module for MIRAX Viewer 1.11 User's Guide 6 Exporting Data and Images 6 Exporting Data and Images 6.1 Exporting Data Warning! TMA Module does not support the newer than 2003 Excel files (*.xlsx). If you have newer Excel than 2003, you must know that although the fileextention will be .xls but the file-structure will be according to .xlsx file-extention. If you have newer Excel than 2003, you must choose in its File menu at Save as.. option the following file type: Excel 97-2003-worksheet (*.xls). After finishing scoring the database including all imported data of the patients added with the scores of the TMA spots can be exported into either a new Excel file (XLS) or a CSV format, by choosing the Export option from the project menu. Having chosen the Combined option in the Scoring Scheme Type panel, the user has got the following possibilities for exportation (please, push down the button Export, then choose XLS option). June 26, 2008 3DHISTECH Ltd. 34(44) TMA Module for MIRAX Viewer 1.11 User's Guide 6 Exporting Data and Images 6.1.1 Exporting Score Values to 1 Column It makes possible to save only one Score Value to each spot. 6.1.2 Exporting Score Values to 2 Columns It makes possible to save the Score Values of a given spot recorded on a 2D-scale into two separated columns. June 26, 2008 3DHISTECH Ltd. 35(44) TMA Module for MIRAX Viewer 1.11 User's Guide 6 Exporting Data and Images 6.1.3 Exporting Threshold Values into XLS It makes possible to save the Threshold Values into XLS by the software. 6.1.4 Exporting Score Values for Generating Allred Values The software generates an Allred Value from the Score Value given by the user. The Allred Scoring Scheme is preferred mainly in the breast cancer diagnosis. June 26, 2008 3DHISTECH Ltd. 36(44) TMA Module for MIRAX Viewer 1.11 User's Guide 6 Exporting Data and Images Allred Value = Intensity Score Value + Rate Score Value For example, in the case of 8: 4 (Rate) + 2 (Intensity) = 6 (Allred) 6.1.5 Exporting Score Values to TreeView Software In case of using a the 4-scale system as recommended at Scoring scheme, the results can also be saved in a format compatible with hierarchical cluster analysis and TreeView visualization (see below).The Consolidate function allows for saving either the scores of every user separated by commas “|”, or saving the consolidated scores only. The format of the standard Excel Lookup table of merged data is a useful platform for performing further survival analysis and statistics. June 26, 2008 3DHISTECH Ltd. 37(44) TMA Module for MIRAX Viewer 1.11 User's Guide 6 Exporting Data and Images 6.1.6 Exporting Score Values to R Software R is a statistics-producing software that is able to predict an estimated life expectancy on the base of the exported to it Score Values, using its enormous fact-database. As a first step, the User looking at the R-Script Generator window, has to choose the points, the criteria of the statistical analysis from the Organ panel, then she\he must mark the needed variables for the statistical calculations. June 26, 2008 3DHISTECH Ltd. 38(44) TMA Module for MIRAX Viewer 1.11 User's Guide 6 Exporting Data and Images After pushing button Next, the User will see an arrangement of her\his chosen criteria and she\he can re-arrange them. The User must make an order of importance for these criteria. After pushing the button Next, the User must define the folder and the file to where she\ he wants to save the R-script. If the User wants to visualise the statistical results she\he must mark (tick) the options Heatmap, Mosaic Plot, Association Plot. June 26, 2008 3DHISTECH Ltd. 39(44) TMA Module for MIRAX Viewer 1.11 User's Guide 6 Exporting Data and Images After pushing again the button Next, the generated R-script appears for the User, who can save it into the formerly defined folder and file by pushing the button Finish. (Just for extra information, the User can visit the homepage http://www.r-project.org/ June 26, 2008 3DHISTECH Ltd. 40(44) TMA Module for MIRAX Viewer 1.11 User's Guide The 6 Exporting Data and Images Project for Statistical Computing Getting Started: R is a free software environment for statistical computing and graphics. It compiles and runs on a wide variety of UNIX platforms, Windows and MacOS. To download R, please choose your preferred CRAN mirror. If you have questions about R like how to download and install the software, or what the license terms are, please read our answers to frequently asked questions before you send an email. This server is hosted by the Department of Statistics and Mathematics of the WU Wien.) June 26, 2008 3DHISTECH Ltd. 41(44) TMA Module for MIRAX Viewer 1.11 User's Guide 6 Exporting Data and Images 6.2 Exporting Images Using the Export Images button in the Gallery allows for saving TMA spot image collections either in JPEG, BMP, TIFF or PNG formats, or as an HTML page (in JPEG). Images can be saved at arbitrary magnifications and new directories can be defined. June 26, 2008 3DHISTECH Ltd. 42(44) TMA Module for MIRAX Viewer 1.11 User's Guide 7 Analyzing the Data Exported from TMA Module (Cluster Analysis) 7 Analyzing the Data Exported from TMA Module (Cluster Analysis) For Cluster Analysis --- without using the Deconvoluter program --- the 4-scale system above (-2 = negative, 0 = equivocal, 1 = weak-moderate positive, 2 = strongly positive) has to be used. At Saving Data to Excel, the program will convert them into a format, which can be loaded and analyzed in the Cluster program (for example version 2.11, see below). The modifier columns intended to appear in TreeView (for example version 1.60, see below) are also merged into one column and all other columns except those with the scores, are deleted. The modified Lookup table above is saved as a text file (data divided by tabs), which can be Loaded into the Gene Cluster program. Average Linkage Clustering (Correlation uncentered) under the option of Hierarchical Clustering will result in relation analyses, which can be imported and viewed in heat-map and dendrogram representations using the TreeView program. Recommended software tools used for Hierarchical Clustering Analysis of TMA data may be downloaded freely from the following web pages: TMA Deconvoluter (1.11) http://genome-www.stanford.edu/TMA/download.shtml, by Liu CL, Prapong W, Natkunam Y, Alizadeh A, Montgomery K, Gilks CB, van de Rijn M (2002) TMA Deconvoluter (1.11) software by Software Tools for High-Throughput Analysis and Archiving of Immunohistochemistry Staining Data Obtained with Tissue Microarrays American Journal of Pathology 61:1557-1565.) The conversion was done with the TMA module for MIRAX Viewer 1.11. June 26, 2008 3DHISTECH Ltd. 43(44) TMA Module for MIRAX Viewer 1.11 User's Guide 7 Analyzing the Data Exported from TMA Module (Cluster Analysis) TMA Cluster (2.11) and TreeView (1.60) http://rana.lbl.gov/EisenSoftware.htm, by Eisen MB, Spellman PT, Brown PO and Botstein D (1998) Cluster Analysis and Display of Genome-Wide Expression Patterns. Proc Natl Acad Sci U S A 95, 14863-14868. June 26, 2008 3DHISTECH Ltd. 44(44)