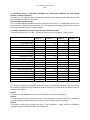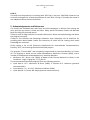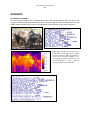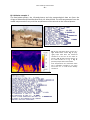
1
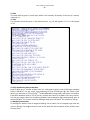
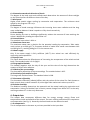
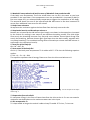
User Guide for Thermo-RESI
Energy Budget Model for Ruminants in Burkina Faso
Burkina-Faso - Germany joint research project ALUCCSA
ADAPTATION OF LAND USE TO CLIMATE CHANGE IN SUB-SAHARAN AFRICA
Georg-August-University Göttingen, Department of Bioclimatology
January 2012
M.Sc. Johannes Merklein
User Guide for Thermo-RESI
-2–
CONTENTS
1. Introduction
2. Operating the model
3. Input data
4. Output data
5. References and Acknowledgements
6. Appendix
A) Validation example 1
B) Validation example 2
C) Model structure
2
2
2
4
7
8
9
10
1. Introduction
Adaptation to Climate Change, which is often linked to higher temperatures and less precipitation, is a challenge to the whole biosphere. Globally this may lead to shifts in the
distribution and abundance of animal and plant species. Concerning human agriculture and
livestock husbandry, species and breeds of livestock which are nowadays well adapted to the
local climate conditions may suffer strongly from changed conditions in the future.
The model Thermo-RESI was especially developed to assess the suitability of cattle breeds
living under warm-hot conditions in countries like Burkina Faso to adapt to even hotter or
dryer climate conditions. At the same time it is as well possible to test cattle breeds which
are nowadays mainly kept under temperate climate conditions for their general suitability to
adapt to warm-hot conditions.
2. Operating the model
Thermo-RESI is a portable, small programm (ca. 300 kB) that can easily be used on every
Microsoft Windows operating system. Even on older computers a model run with output
data should not need more than 10 seconds of time.
The model can be started by double-clicking the exe-file Kuh.exe (German for “cow”).
Following this a terminal is opening automatically. In this terminal the input data has to be
given by the user. After writing each type of input data the “Return”-button on the keyboard
has to be pressed to go on.
After the last type of input data the program starts to calculate the output. Finally the
output will be shown in the terminal as well. Parallel to this process input and output data
are written to file “Thermo-RESI.txt” in the same folder as the exe-file. Caution: the name of
the txt-file has to be changed after a model run, otherwise the next model run overwrites
the data that is written in the file!
3. Input data
The model allows the user to define 18 types of input data. The data is partly concerning
properties of the animal and partly concerning properties of the surroundings and the
weather (compare Fig. 1).
1. Air temperature
The model is tested for air temperatures equal or higher than 26 °C.
User Guide for Thermo-RESI
-3–
2. Date
The date shall be given in Julian days which is the number of the day in the year (1. January
is day No. 1).
3. Time
The minutes should be given in the dezimal form, e.g. 12:30h equals 12.5 or 12:45 equals
12.75.
Fig. 1: The terminal with 18 types of input data.
4. Daily metabolical heat production
Heat in Watt per m2 animal surface area. For a European type dry cow of 600 kg a standard
value is 98 W/m2; for the same cow producing 20 Liter of Milk per day the value is 166
W/m2, on the basis of 773.27 kJ/kg0.75*d Metabolizable Energy (ME). ME-values for Burkina
Faso differ between 470 to 750 in the dry season and reach up to 900 in the rainy season.
For the dry season values for the Daily metabol. heat production (M) consequently start at
about 100 W/m2 for animals of 250 or 300 kg and go up to 155 W/m2 for animals of 350 kg.
5. Weight of the animal
As average for Burkina Faso a weight of 300 kg can be taken, for a European type cow the
value is 600 kg. The weight serves as well as the basis for the calculation of the surface area
of the animal.
User Guide for Thermo-RESI
-4–
6. Orientation towards the direction of South
The degree of the body main axis towards south determines the amount of direct sunlight
on the animal surface at different times of the day.
7. Wind speed
Higher wind speeds trigger cooling by convection and evaporation. The minimum wind
speed for the program is 0.1 m/s.
8. Cloud cover
The degree of cloud coverage influences the incoming short wave radiation and the long
wave radiation balance. 8 okta is equal to a fully cloud covered sky.
9. Direct shading
Direct shading by trees or buildings significantly reduces the amount of heat reaching the
animal. Without any shading the input value is 0.
10. Coat thickness
The standard input value is 0.01 m.
11. Maximum sweat rate
The maximum sweat rate is decisive for the potential cooling by evaporation. Zebu cattle
reach values up to 900 g/m2*h. European breeds of cattle have sweat rates between 140
and 300 g/m2*h, reaching 440 g/m2*h in the utmost case.
12. Water supply
Only if the water supply is fully sufficient (100 %) the animal can cool efficiently by
respiration and evaporation.
13. Specific heat
This value determines the effectiveness of increasing the temperature of the whole animal
body. The standard value is 3.4 kJ/kg*K.
14. Geographical latitude
The latitude (together with the day of the year and the time of the day) determines the
amount of direct solar radiation.
15. Albedo of the surroundings
The short wave reflectivity of the surroundings. The standard value is 0.25.
16. Emissivity of the animal surface
The long wave emission factor. The standard value is 0.98.
17. Shortwave reflectivity
The shortwave reflectivity (albedo) differs with the colour of the animal fur. Dark brown to
black animals have a value around 0.12, white light Zebu cattle reach values up to 0.51.
18. Relative humidity
The Relative humidity determines the potential and the actual cooling by respiration and
evaporation. Values for Burkina Faso in the dry season change from about 20 % in the early
morning to about 5 % in the early afternoon.
4. Output data
The output data encompass different data for energy storage, energy fluxes and
temperatures inside and outside of the animal. The main cooling mechanisms are respiration
and evaporation (see Fig. 2). Generally the food intake can be reduced as well.
1. Air temperature
The air temperature is the same as you have provided in the input data.
User Guide for Thermo-RESI
-5–
2. Metabolic heat production M and increase of Metabolic heat production dM
If the body core temperature Tb of the animal does not rise M is the same as you have
provided in the input data. If the temperature rises the provided M is increased by dM (in
the next output line), as enhanced body temperature triggers the metabolism of the body.
The output M shows the sum of the input M and dM. dM means in fact that increased Tb
causes even additional heat stress for the animal!
3. Body tissue resistance
Ib expresses the resistance against the heat flow from the body core to the skin.
4. Respiration heat Qr and Breaths per minute rr
Breaths per minute and the tidal volume (per breath; not shown in the output) are increased
by the animal for cooling in two steps to two different breathing modes: first (with slight
heat stress) the breathing becomes very fast and more shallow. Second (with strong heat
stress) the breathing becomes slower again (but faster than the basic mode), together with
very deep breathing. The combined cooling effect of breaths per minute and tidal volume is
expressed in the respiration heat Qr.
5. Heat flux of the body Qb
Qb = M – dM – Qr
6. Heat stored in the body Gb1
Gb1 is 0, if the body core temperature Tb is stable at 39°C. If Tb rises the following equation
applies:
0 = M – Qr – Es – Qc – Gb1
The equation expresses that all energy fluxes to or from the skin must balance to 0.
Fig. 2: Output data with comment on the heat stress situation of the animal. Fig. 2 is the output to the input
data in Fig. 1.
7. Evaporation from the skin Es
Es transports energy in the form of latent heat from the skin to the air. Es can not exceed a
maximum rate dependent on the maximum sweat rate in the input.
8. Skin temperature Ts
Ts is kept stable as long as the animal is able to keep Tb stable. If Tb rises, Ts rises too.
User Guide for Thermo-RESI
-6–
9. Convective heat C, Long-wave radiation Lrn, Short-wave radiation Rn and Energy
balance at coat surface Qc2
The sum of C, Lrn and Rn results in the value of Qc2 (a minus-sign of these values shows heat
flows leaving the body of the animal).
10. Heat flux through coat Qc
Qc is the heat balance between the skin and the coat surface. It is dependent of the skin
temperature Ts and the coat temperature Tc. For the right heat balance of the animal Qc has
to be equal to Qc2 (within a narrow margin).
11. Body temperature Tb and Increase of body temperature dTb
The standard value for Tb is 39°C. dTb shows the increase of Tb within 1 hour of time.
CASE 1
Air temperature (°C)
Date (Julian day)
Time (dez. minutes)
Metab. heat prod. (W/m2)
Weight (kg)
Orientation to South (deg.)
Wind speed (m/s)
Cloud cover (okta)
Direct shading (dez. fract.)
Coat thickness (m)
Max. sweat rate (g/m2*h)
Water supply (%)
Spec. heat (kJ/kg*K)
Geog. Latitude (deg.)
Albedo of surround. (dez. fr.)
Emiss. of surface (dez. fract.)
Shortwave refl. (dez. fract.)
Relative humidity (%)
38
75
12
155
350
0
0.1
0
0
0.01
900
100
3.4
13
0.25
0.98
0.12
10
CASE 2
37
120
12.5
166
600
0
0.1
0
0
0.01
400
100
3.4
13
0.25
0.98
0.2
10
CASE 3
CASE 4
37
100
12
166
600
0
0.5
0
0
0.01
220
100
3.4
13
0.25
0.98
0.25
35
40
75
13.1
166
600
0
0.1
0
0
0.01
220
100
3.4
13
0.25
0.98
0.12
20
Tab. 1: For each of the 4 cases explained in the text this table shows an example input data set.
The model distinguishes between 4 different cases of interaction between the animal and
the climatic conditions. At the end of the output according to these cases 4 different types of
comment will appear:
CASE 1:
The animal is well adapted to the climatic conditions and feels comfortable.
CASE 2:
The animal suffers from slight heat stress. The respiration is shallow and fast. Additional
cooling like direct shadow could be necessary if the situation does not change.
CASE 3:
The animal suffers from strong heat stress. The respiration is deep and fast. Additional
cooling like direct shadow should be provided soon.
User Guide for Thermo-RESI
-7–
CASE 4:
The body core temperature is increasing with ‘dTb’ Deg. C per hour. CAUTION: Cattle can not
survive a prolonged rise of body temperature of more than 2-3 Deg. C! Possibly the animal is
not adapted to these climatic conditions!
5. Acknowledgements and References
The model was validated with data from two field campaigns in Burkina Faso during the
rainy and the dry season in 2010 and 2011. Many thanks to Dietmar Fellert and Barnabé
Bayel for doing this essential work!
Thanks as well to Oleg Panferov for worthful discussions about micrometeorology and about
the program structure.
Thanks to Eva Schlecht and Zampaligre Nouhoun from Subproject VIII of ALUCCSA: for
providing data about fodder intake and itineraries of cattle and for sharing their broad
knowledge on ruminants.
Finally thanks a lot to GIZ (Deutsche Gesellschaft für Internationale Zusammenarbeit;
formerly “GTZ”) for financing the whole ALUCCSA project!
The program “Thermo-RESI” was completely programmed by Johannes Merklein in Fortran
95. The program is based on the model developed by McGovern & Bruce (2000), with a
number of modifications and adaptations by Johannes Merklein.
• McGovern, R.E.; Bruce, J.M. (2000): A Model of the Thermal Balance for Cattle in Hot
Conditions. J.agric. Engng Res., 77(1), 81-92.
The recommended input data originate from the following sources:
• Input data 4. & 5.: McGovern & Bruce (2000), E. Schlecht & Z. Nouhoun (personal
communication).
• Input data 10., 11., 13. & 17.: McGovern & Bruce (2000).
• Input data 18.: D. Fellert & B. Bayel (personal communication).
User Guide for Thermo-RESI
-8–
APPENDIX
A) Validation example 1
The Real-colour-picture, the infrared-picture and the meteorological data are from the
village of Sokouraba (Central Burkina Faso), 16. March 2010. The coat temperature from the
model output matches very well the temperatures of the animal on the infrared picture.
Fig. 1: (top, left) Real colour picture of a
brown-black animal. Fig. 2: (top, right)
Input data with the measured conditions
at the site of the cattle at 8.08 h in the
morning. Fig. 3: (left) Infrared picture of
the same animal as in Fig. 1. Fig. 4:
(bottom) Output data of the model.
User Guide for Thermo-RESI
-9–
B) Validation example 2
The Real-colour-picture, the infrared-picture and the meteorological data are from the
village of Sokouraba (Central Burkina Faso), 16. March 2010. The coat temperature from the
model output matches very well the temperatures of the animal on the infrared picture.
Fig. 1: (top, left) Real colour picture of a
light brown-white animal. Fig. 2: (top,
right) Input data with the measured
conditions at the site of the cattle at
13.10 h. Fig. 3: (left) Infrared picture of
the same animal as in Fig. 1. Fig. 4:
(bottom) Output data of the model.
Coat temperatures for dark-black cattle
like in Validation example 1 can reach
more than 57° C under these midday
conditions.
User Guide for Thermo-RESI
- 10 –
C) Model structure
The model is based on the interaction of micrometeorological and physical elements which
are presented in an overview in Fig. 1. The essential area for the interaction between these
elements is the transition zone “Skin, Coat, Coat surface, Boundary Layer, Free air” (not
presented in Fig.1).
A basic flow chart of the inner program structure is shown in Fig. 2.
Fig. 1: Elements of the
energy budget of ruminants.
All the elements in the
figure are part of the model
except the excrements.
Fig. 2: Flow chart of
the program structure
of Thermo-RESI (Resp.
= Respiratory).