1
User Manual
WFM700 Series
Waveform Monitors
071-0916-08
Test Equipment Depot - 800.517.8431 - 99 Washington Street Melrose, MA 02176 - FAX 781.665.0780 - TestEquipmentDepot.com
Table of Contents
General Safety Summary . . . . . . . . . . . . . . . . . . . . . . . . . . . . . . . . . . . . . . .
Preface . . . . . . . . . . . . . . . . . . . . . . . . . . . . . . . . . . . . . . . . . . . . . . . . . . . . . . . .
iii
Related Reference Documents . . . . . . . . . . . . . . . . . . . . . . . . . . . . . . . . . . . . . .
v
v
Product Description . . . . . . . . . . . . . . . . . . . . . . . . . . . . . . . . . . . . . . . . . . . . . .
Standard Accessories . . . . . . . . . . . . . . . . . . . . . . . . . . . . . . . . . . . . . . . . . . . . .
Optional Accessories . . . . . . . . . . . . . . . . . . . . . . . . . . . . . . . . . . . . . . . . . . . . .
1-- 1
1-- 2
1-- 4
Installation and Power On . . . . . . . . . . . . . . . . . . . . . . . . . . . . . . . . . .
1--5
Hardware Installation . . . . . . . . . . . . . . . . . . . . . . . . . . . . . . . . . . . . . . . . . . . . .
Connecting Power . . . . . . . . . . . . . . . . . . . . . . . . . . . . . . . . . . . . . . . . . . . . . . . .
1-- 5
1-- 6
Functional Overview . . . . . . . . . . . . . . . . . . . . . . . . . . . . . . . . . . . . . . .
2--1
Front Panel Knobs and Indicators . . . . . . . . . . . . . . . . . . . . . . . . . . . . . . . . . . .
Front-Panel Buttons . . . . . . . . . . . . . . . . . . . . . . . . . . . . . . . . . . . . . . . . . . . . . .
Touch Screen (Soft Keys) . . . . . . . . . . . . . . . . . . . . . . . . . . . . . . . . . . . . . . . . . .
Readouts . . . . . . . . . . . . . . . . . . . . . . . . . . . . . . . . . . . . . . . . . . . . . . . . . . . . . . .
Icons . . . . . . . . . . . . . . . . . . . . . . . . . . . . . . . . . . . . . . . . . . . . . . . . . . . . . . . . . .
Context-Sensitive Help . . . . . . . . . . . . . . . . . . . . . . . . . . . . . . . . . . . . . . . . . . . .
Rear Panel Connectors . . . . . . . . . . . . . . . . . . . . . . . . . . . . . . . . . . . . . . . . . . . .
2-- 2
2-- 4
2-- 5
2-- 5
2-- 7
2-- 7
2-- 8
Menus . . . . . . . . . . . . . . . . . . . . . . . . . . . . . . . . . . . . . . . . . . . . . . . . . . .
2--11
Making Menu Selections . . . . . . . . . . . . . . . . . . . . . . . . . . . . . . . . . . . . . . . . . .
Using the Menu Diagrams . . . . . . . . . . . . . . . . . . . . . . . . . . . . . . . . . . . . . . . . .
Audio Menu (Option DG Only) . . . . . . . . . . . . . . . . . . . . . . . . . . . . . . . . . . . . .
Configure Menu . . . . . . . . . . . . . . . . . . . . . . . . . . . . . . . . . . . . . . . . . . . . . . . . .
Cursor Menu . . . . . . . . . . . . . . . . . . . . . . . . . . . . . . . . . . . . . . . . . . . . . . . . . . . .
Display Menu . . . . . . . . . . . . . . . . . . . . . . . . . . . . . . . . . . . . . . . . . . . . . . . . . . .
Eye Menu (WFM700M Only) . . . . . . . . . . . . . . . . . . . . . . . . . . . . . . . . . . . . . .
Freeze Menu . . . . . . . . . . . . . . . . . . . . . . . . . . . . . . . . . . . . . . . . . . . . . . . . . . . .
Gain Menu . . . . . . . . . . . . . . . . . . . . . . . . . . . . . . . . . . . . . . . . . . . . . . . . . . . . .
Gamut Menu . . . . . . . . . . . . . . . . . . . . . . . . . . . . . . . . . . . . . . . . . . . . . . . . . . . .
Help Menu . . . . . . . . . . . . . . . . . . . . . . . . . . . . . . . . . . . . . . . . . . . . . . . . . . . . .
Input Menu . . . . . . . . . . . . . . . . . . . . . . . . . . . . . . . . . . . . . . . . . . . . . . . . . . . . .
Line Select Menu . . . . . . . . . . . . . . . . . . . . . . . . . . . . . . . . . . . . . . . . . . . . . . . .
Measure Mode Menu (WFM700A and WFM700HD Only) . . . . . . . . . . . . . . .
Measure Mode Menu (WFM700M Only) . . . . . . . . . . . . . . . . . . . . . . . . . . . . .
Multi Menu . . . . . . . . . . . . . . . . . . . . . . . . . . . . . . . . . . . . . . . . . . . . . . . . . . . . .
Picture Menu . . . . . . . . . . . . . . . . . . . . . . . . . . . . . . . . . . . . . . . . . . . . . . . . . . . .
Preset Menu . . . . . . . . . . . . . . . . . . . . . . . . . . . . . . . . . . . . . . . . . . . . . . . . . . . .
Print Menu . . . . . . . . . . . . . . . . . . . . . . . . . . . . . . . . . . . . . . . . . . . . . . . . . . . . .
2-- 11
2-- 12
2-- 13
2-- 14
2-- 18
2-- 19
2-- 20
2-- 21
2-- 22
2-- 23
2-- 24
2-- 24
2-- 25
2-- 26
2-- 26
2-- 27
2-- 28
2-- 29
2-- 30
Getting Started
Operating Basics
WFM700 Series Waveform Monitors User Manual
i
Table of Contents
Status Menu . . . . . . . . . . . . . . . . . . . . . . . . . . . . . . . . . . . . . . . . . . . . . . . . . . . .
Sweep Menu . . . . . . . . . . . . . . . . . . . . . . . . . . . . . . . . . . . . . . . . . . . . . . . . . . . .
Vector Menu . . . . . . . . . . . . . . . . . . . . . . . . . . . . . . . . . . . . . . . . . . . . . . . . . . . .
Waveform Menu . . . . . . . . . . . . . . . . . . . . . . . . . . . . . . . . . . . . . . . . . . . . . . . . .
2-- 30
2-- 31
2-- 32
2-- 33
Alarms . . . . . . . . . . . . . . . . . . . . . . . . . . . . . . . . . . . . . . . . . . . . . . . . . . . . . . . . .
Ancillary Data Display . . . . . . . . . . . . . . . . . . . . . . . . . . . . . . . . . . . . . . . . . . . .
ARIB STD-B39 Display . . . . . . . . . . . . . . . . . . . . . . . . . . . . . . . . . . . . . . . . . . .
Audio Mode . . . . . . . . . . . . . . . . . . . . . . . . . . . . . . . . . . . . . . . . . . . . . . . . . . . .
Audio Mode (Option DG Only) . . . . . . . . . . . . . . . . . . . . . . . . . . . . . . . . . . . . .
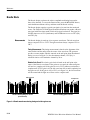
Bowtie Mode . . . . . . . . . . . . . . . . . . . . . . . . . . . . . . . . . . . . . . . . . . . . . . . . . . .
Composite Display . . . . . . . . . . . . . . . . . . . . . . . . . . . . . . . . . . . . . . . . . . . . . . .
Data Display (WFM700M Only) . . . . . . . . . . . . . . . . . . . . . . . . . . . . . . . . . . . .
Diagnostics . . . . . . . . . . . . . . . . . . . . . . . . . . . . . . . . . . . . . . . . . . . . . . . . . . . . .
Eye / Jitter Mode (WFM700M Only) . . . . . . . . . . . . . . . . . . . . . . . . . . . . . . . . .
Gamut Measurements . . . . . . . . . . . . . . . . . . . . . . . . . . . . . . . . . . . . . . . . . . . . .
Line Select Mode . . . . . . . . . . . . . . . . . . . . . . . . . . . . . . . . . . . . . . . . . . . . . . . .
Logging . . . . . . . . . . . . . . . . . . . . . . . . . . . . . . . . . . . . . . . . . . . . . . . . . . . . . . . .
Measure Mode (WFM700M Only) . . . . . . . . . . . . . . . . . . . . . . . . . . . . . . . . . .
Multi Mode . . . . . . . . . . . . . . . . . . . . . . . . . . . . . . . . . . . . . . . . . . . . . . . . . . . . .
Picture Mode . . . . . . . . . . . . . . . . . . . . . . . . . . . . . . . . . . . . . . . . . . . . . . . . . . . .
Printing . . . . . . . . . . . . . . . . . . . . . . . . . . . . . . . . . . . . . . . . . . . . . . . . . . . . . . . .
Status Displays . . . . . . . . . . . . . . . . . . . . . . . . . . . . . . . . . . . . . . . . . . . . . . . . . .
Vector Mode . . . . . . . . . . . . . . . . . . . . . . . . . . . . . . . . . . . . . . . . . . . . . . . . . . . .
Waveform Mode . . . . . . . . . . . . . . . . . . . . . . . . . . . . . . . . . . . . . . . . . . . . . . . . .
3-- 2
3-- 4
3-- 6
3-- 7
3-- 7
3-- 14
3-- 15
3-- 15
3-- 16
3-- 17
3-- 27
3-- 31
3-- 32
3-- 34
3-- 34
3-- 35
3-- 36
3-- 37
3-- 40
3-- 44
Reference
Index
ii
WFM700 Series Waveform Monitors User Manual
General Safety Summary
Review the following safety precautions to avoid injury and prevent damage to
this product or any products connected to it. To avoid potential hazards, use this
product only as specified.
Only qualified personnel should perform service procedures.
To Avoid Fire or
Personal Injury
Use Proper Power Cord. Use only the power cord specified for this product and
certified for the country of use.
Ground the Product. This product is grounded through the grounding conductor
of the power cord. To avoid electric shock, the grounding conductor must be
connected to earth ground. Before making connections to the input or output
terminals of the product, ensure that the product is properly grounded.
Observe All Terminal Ratings. To avoid fire or shock hazard, observe all ratings
and markings on the product. Consult the product manual for further ratings
information before making connections to the product.
Do not apply a potential to any terminal, including the common terminal, that
exceeds the maximum rating of that terminal.
Replace Batteries Properly. Replace batteries only with the proper type and rating
specified.
Do Not Operate Without Covers. Do not operate this product with covers or panels
removed.
Use Proper Fuse. Use only the fuse type and rating specified for this product.
Avoid Exposed Circuitry. Do not touch exposed connections and components
when power is present.
Do Not Operate With Suspected Failures. If you suspect there is damage to this
product, have it inspected by qualified service personnel.
Do Not Operate in Wet/Damp Conditions.
Do Not Operate in an Explosive Atmosphere.
Keep Product Surfaces Clean and Dry.
Provide Proper Ventilation. Refer to the manual’s installation instructions for
details on installing the product so it has proper ventilation.
WFM700 Series Waveform Monitors User Manual
iii
General Safety Summary
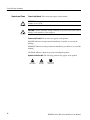
Symbols and Terms
Terms in this Manual. These terms may appear in this manual:
WARNING. Warning statements identify conditions or practices that could result
in injury or loss of life.
CAUTION. Caution statements identify conditions or practices that could result in
damage to this product or other property.
Terms on the Product. These terms may appear on the product:
DANGER indicates an injury hazard immediately accessible as you read the
marking.
WARNING indicates an injury hazard not immediately accessible as you read the
marking.
CAUTION indicates a hazard to property including the product.
Symbols on the Product. The following symbols may appear on the product:
CAUTION
Refer to Manual
iv
WARNING
High Voltage
Protective Ground
(Earth) Terminal
WFM700 Series Waveform Monitors User Manual
Preface
This user manual provides the basic information you need to install and operate
the WFM700 Series Waveform Monitor. Listed below are related documents that
contain information about the instrument.
Related Reference Documents
The following reference documents are available:
H
WFM700 Series Release Notes (English). Describes both the new features
provided by a firmware release and any known problems or behaviors that
you might encounter while using the waveform monitor.
H
WFM700 Series User Documentation CD-ROM. Located on the back cover
of the user manual, contains PDF files of the following documents:
H
WFM700 Series User Manual (English). A bookmarked PDF version of
the printed user manual.
H
WFM700 Series Technical Reference (English). Contains the following
technical information about the instrument:
H
H
H
Electrical and physical specifications, including a list of certifications and compliances
H
Descriptions of each menu selection, the status displays, and the
Option DG audio displays
H
Instructions for operating the instrument using remote control,
including the ground closure, Web server, and SNMP interfaces
H
Procedures for checking the basic functions of the instrument, for
upgrading the instrument firmware, and for performing the
user-service tasks such as cleaning and maintenance, cabinet and
rack adapter installation, and module installation or replacement
WFM700 Series SNMP MIB Reference (English). Describes the syntax
of the variables and traps for remotely controlling the instrument over a
network using SNMP.
WFM700 Series Service Manual (English). Provides servicing information
for the instrument and is intended for qualified service personnel only.
WFM700 Series Waveform Monitors User Manual
v
Preface
Non-English Language
Documents
The following non-English language documents are available:
H
WFM700 Series User Documentation Package (Japanese). Contains a
printed Japanese language user manual and the CD-ROM described on the
previous page.
H
WFM700 Series User Documentation Package (Korean). Contains a
printed Korean language user manual and the CD-ROM described on the
previous page.
www.tektronix.com
f
Web
vi
(
la d r f re e
. ktr
c
:
ume
r
ila
a the Te
I .
H
Preventing Illegal Colors. This application note describes how the Diamond,
Arrowhead, and Lightning displays can be used to help prevent the undesired
impact of color gamut violations and to simplify the assessment of proper
gamut compliance.
H
Understanding Colors and Gamut. This poster provides a large visual
display of how the Diamond, Arrowhead, and Lightning displays can be
used to help prevent the undesired impact of color gamut violations.
H
A Guide to Standard and High Definition Digital Measurements. This book
is a primer for understanding the basics for making standard and high-definition, digital-video measurements.
H
Analog and Digital Audio Monitoring. This application note describes how
to monitor analog and digital audio signals. Also discussed are specific
differences in the methods used to monitor analog audio versus digital audio,
and how to plan the transition from monitoring analog audio to monitoring
digital audio.
H
Audio Monitoring. This application note describes balanced and unbalanced
audio signals, and explains the physical and electrical characteristics and the
specific strength and weaknesses of the different digital audio signal formats.
H
Monitoring Surround Sound Audio. This application note describes the
basics of 5.1-channel surround sound audio and how to use the Surround
Sound display to visualize key audio-level and phase relationships in this
audio format.
WFM700 Series Waveform Monitors User Manual
Getting Started
Getting Started
This section contains a list of accessories, an installation procedure, and a
functional check to verify the primary functions of your waveform monitor. For
instrument specifications, refer to the WFM700 Series Technical Reference
document on the CD-ROM.
Product Description
The WFM700 waveform monitor is designed to meet the multi-format monitoring and measurement needs of digital video for program production, post-production, and transmission. The waveform monitor has three base models:
H
WFM700HD. Monitors high-definition (SMPTE 292M) video.
H
WFM700A. Monitors standard-definition (ITU--R BT.601) and high-definition (SMPTE 292M) video.
H
WFM700M. Measurement instrument for standard-definition
(ITU--R BT.601), high-definition (SMPTE 292M), and hybrid serial digital
operations.
Each waveform monitor includes:
H
One external reference module
H
One video module (with two inputs)
At the time of purchase or at a later date, you can add an additional video
module and/or the Option DG audio module to any of the three base-model
waveform monitors.
WFM700 Series Waveform Monitors User Manual
1- 1
Getting Started
Standard Accessories
Listed below are the standard accessories shipped with each waveform monitor:
Documents
Power Cords
1- 2
The following documents are shipped with each waveform monitor:
H
WFM700 Series Release Notes, Tektronix part number 061-4247-XX.
H
WFM700 Series User Documentation Package, Tektronix part number
020-2532-XX. This package contains the following items:
H
WFM700 Series User Manual, Tektronix part number 071-0916-XX.
H
WFM700 Series User Documentation CD-ROM, Tektronix part number
063-3720-XX. The CD-ROM, located on the back cover of the user
manual, contains PDF files of the following documents: WFM700 Series
User Manual, the WFM700 Series Technical Reference, and the
WFM700 Series SNMP MIB Reference.
All WFM700 waveform monitors are shipped with one of the following power
cord options. Power cords for use in North America are UL listed and CSA
certified. Cords for use in areas other than North America are approved by at
least one authority acceptable in the country to which the product is shipped.
WFM700 Series Waveform Monitors User Manual
Test Equipment Depot - 800.517.8431 - 99 Washington Street Melrose, MA 02176 - FAX 781.665.0780 - TestEquipmentDepot.com
Getting Started
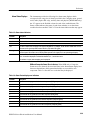
Table 1- 1: Power cord options and identification
Plug configuration
WFM700 Series Waveform Monitors User Manual
Normal usage
Option number
Tektronix part
number
North America
120 V
Standard
161-0216-00
Universal Euro
A1
161-0215-00
United Kingdom
A2
161-0066-10
Australia
A3
161-0066-11
Switzerland
A5
161-0154-00
Japan
A6
161-A008-00
China
AC
161-0304-00
No power cord supplied.
A99
------
1- 3
Getting Started
Optional Accessories
If you ordered any of the following optional accessories, they were shipped with
your waveform monitor.
Additional Inputs
You can add any of the following video or audio modules to a unit:
NOTE. You can have a maximum of two video modules and one Option DG audio
module installed.
Cabinets
Documents
1- 4
H
WFM7HD. Serial digital video monitor module for HD.
H
WFM7A. Serial digital video monitor module for SD and HD.
H
WFM7M. Serial digital video measurement module for SD and HD.
H
WFM7DG. AES digital audio measurement module.
You can order any of these cabinets:
H
WFM7F02 Portable Cabinet
H
WFM7F03 Plain Cabinet
H
WFM7F05 Rack Adapter
The following documents are optional accessories:
H
WFM700 Series Service Manual, Tektronix part number 071-0915-XX.
H
Option L5. Japanese language WFM700 Series User Manual, Tektronix part
number 020-2607-XX.
H
Option L9. Korean language WFM700 Series User Manual, Tektronix part
number 020-2608-XX.
WFM700 Series Waveform Monitors User Manual
Installation and Power On
This section contains information about installing and powering on the waveform monitor. Instructions for performing firmware upgrades are located in the
WFM700 Series Technical Reference document on the CD-ROM.
Hardware Installation
NOTE. Instructions for installing or removing the waveform monitor from a
cabinet, and for adding or removing a module from the instrument are located in
the WFM700 Series Technical Reference document on the CD-ROM.
The waveform monitor is shipped in a wrap-around chassis that covers the
instrument bottom and two sides. A cover is installed on the chassis, and the rear
panel is made up of the module rear panels.
You can operate the waveform monitor in the instrument chassis (be sure the
cover is on) or installed in an approved portable cabinet or rack adapter. You can
also install the waveform monitor in a custom installation, such as a console.
CAUTION. Do not install the waveform monitor in any cabinet except those that
are listed in Optional Accessories on page 1--4. Attempting to do so can damage
the waveform monitor and the cabinet.
If you install the waveform monitor in a custom application, such as a console,
be sure to provide adequate airflow. Follow these guidelines:
H
Do not block the ventilating holes.
H
Adhere to the clearance requirements that are listed in the specification tables
of the WFM700 Series Technical Reference document on the CD-ROM.
CAUTION. Failure to provide adequate airflow to the waveform monitor could
cause the instrument to shut down (refer to Table 2--2 on page 2--3 for LED fault
codes). If the airflow is blocked and the instrument does not shut down, the
instrument could be seriously damaged.
WFM700 Series Waveform Monitors User Manual
1- 5
Installation and Power On
Connecting Power
The waveform monitor operates from a single-phase power source with the
neutral conductor at or near earth ground. The line conductor is fused for
over-current protection. A protective ground connection through the grounding
conductor in the power cord is essential for safe operation.
WARNING. To avoid serious personal injury from electric shock, do not operate
the instrument with the cover removed. When power is supplied via the power
cord, line voltage will be present inside the waveform monitor, even if the unit is
in standby mode.
AC Power Requirements
The waveform monitor operates from an AC line frequency of 50 or 60 Hz, over
the range of 100--240 Volts, without the need for configuration, except the power
cord. Refer to page 1--2 for the power cord options.
The typical power consumption is 100 W with one video module installed and
125 W with two video modules installed. Power consumption increases by a
negligible amount when there is an Option DG audio module installed. Refer to
the product specification tables in the WFM700 Series Technical Reference
document on the CD-ROM for additional information on power and environmental requirements.
CAUTION. Use only power cords that are approved for the country of use. Using
non-approved power cords could result in fire or shock hazard.
Powering On the
Instrument
Follow these steps to power on the waveform monitor:
1. Plug the supplied power cord (IEC 320) into the back of the instrument.
Refer to page 1--2 for a list of power cord options.
2. Plug the other end of the power cord into a standard wall outlet.
3. Press the ON/STBY button to bring the waveform monitor out of standby
mode.
1- 6
WFM700 Series Waveform Monitors User Manual
Operating Basics
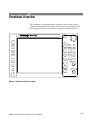
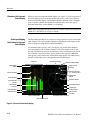
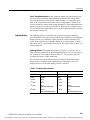
Functional Overview
The instrument is controlled through a combination of front-panel controls
(buttons and knobs) and touch-screen controls (soft keys), as described on the
following pages. The waveform monitor front panel is shown in Figure 2--1.
SELECT
HELP
VIEW
PRINT
WFM
SWEEP
GAIN
FREEZE
VECTOR
STATUS
CURSOR
DISPLAY
PICTURE MEASURE
GAMUT
EYE
LINE SEL
INPUT
CONFIG
AUDIO
VERT POS
PRESET
MULTI
FAULT
CLR MENU
HORIZ POS
ON/STBY
Figure 2- 1: Waveform monitor front panel
WFM700 Series Waveform Monitors User Manual
2- 1
Functional Overview
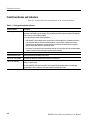
Front Panel Knobs and Indicators
Table 2--1 describes the knobs and indicators on the waveform monitor:
Table 2- 1: Front-panel knobs and indicators
Knob / Indicator
Description
General purpose knob
Located in the upper right corner of the front panel, navigates among menu choices or changes values,
depending on the feature you are currently using. In general, the knob continues to perform the assigned
function until you select a different feature.
You can use this knob with the following functions:
H
Select button. In the Configure menu, use the knob to scroll through the list of submenus, and then
press the Select button to open the selected submenu. In some modes of operation, the Select
button LED will stay illuminated. This indicates that you can press the Select button to toggle the
general purpose knob between controlling two items.
H
Line Select. Use the knob to select the desired video line. In some cases, the knob will automatically
return to Line Select mode after being assigned to another function.
Vertical position knob
Moves the waveform vertically on the screen.
Horizontal position knob
Moves the waveform horizontally on the screen.
ON / STBY LED Indicator
This green LED illuminates whenever the instrument is powered on.
FAULT LED Indicator
This red LED illuminates when a hardware fault is detected within the instrument, such as under/over
voltage of a power supply.
The green ON/STBY LED and the red FAULT LED indicate instrument status and do not report input
signal problems. Table 2-- 2 lists the LED status conditions and what they mean.
2- 2
WFM700 Series Waveform Monitors User Manual
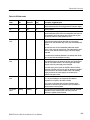
Functional Overview
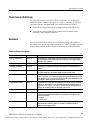
Table 2- 2: LED fault codes
State
ON/STBY
LED
Fault LED
Main power
relay
Standby
Off
Off
Off
No power. Press the ON/STBY switch for normal operation. Check
that the instrument power cord is plugged into the local power supply.
On
On
Off
On
Normal operation.
Cold
Flashing
Off
On
The LCD may be damaged if operated at low temperatures. If the
internal temperature sensors detect a low temperature, this fault code
will be asserted. Let the unit warm up and cycle the power or press
the ON/STBY switch for normal operation to occur.
Momentary
fault
On
On
On
This is a transient state. It should never last more than one second. It
occurs when the internal sensors detect that one of the internal
supplies is out of the allowable range. In this state, the instrument will
be reset.
Description / suggested action
This state can occur due to an intermittent problem that requires
service or from a drop-out on the AC line. If the fault persists for more
than one second, then the instrument will go to the Power Supply
Fault state.
It is normal for the momentary fault state to be asserted when the AC
line is removed while the instrument is running.
Power supply
fault
Off
On
Off
If the internal monitors detect that one of the internal power supplies is
out of its allowed range, the instrument will shut down and the Power
Fault LED code will be asserted. This can be triggered by multiple
drop-outs on the AC power supply to the instrument.
If this fault code is present, press the ON/STBY switch to reset the
instrument. If the fault code reoccurs, refer the instrument to qualified
service personnel. If the waveform monitor seems to be operating
properly, monitor the AC power supply to be sure there are no
problems in the power source.
Overtemp
fault
Off
Flashing
Off
The internal temperature sensors will shut down the instrument at
75 _C to prevent damage to the components if the ambient
temperature is too high or if the airflow is blocked.
If this occurs, the Overtemp fault code will be asserted. Let the
instrument cool down and cycle the power or press the ON/STBY
switch to resume normal operation.
EC self test
failed
Flashing
Flashing
Off
WFM700 Series Waveform Monitors User Manual
This is asserted if the Environmental Controller is not able to test the
temperature sensors and fan circuits. If this occurs, refer the
instrument to qualified service personnel.
2- 3
Functional Overview
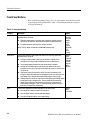
Front-Panel Buttons
Refer to Menus beginning on page 2--11 for a description of the menus accessed
by pressing the front-panel buttons. Table 2--3 describes the different categories
of front-panel buttons.
Table 2- 3: Front-panel buttons
Category
Description
Buttons
Major mode
These buttons change the entire context and content of the LCD display, and
generally function as follows:
WFM
VECTOR
PICTURE
GAMUT
AUDIO
MULTI
STATUS
MEASURE
EYE
HELP
CONFIG
H
Pressing a button selects a mode and opens a menu (for example, pressing
WFM selects the Waveform display mode and opens the Waveform menu).
H
The button illuminates to show that the mode is activated.
NOTE: The Eye button is functional on WFM700M instruments only.
Minor mode
Misc.
2- 4
These buttons activate a function that works with one or more major modes and
generally function as follows:
H
Pressing a button activates a function (if that function is supported in the
currently selected major mode) and displays the menu for that function.
H
The front-panel button illuminates to show that the mode is activated.
H
Pressing the CLR MENU button clears the function menu from the screen,
leaving the function active. The major mode button LED will be on, and the minor
one will be off.
H
Some minor modes like Line Select, Sweep, and Cursor remain active and
modify the display when their menu is not displayed. In this case, press the front
panel button once to bring the menu back and then again to exit the mode.
H
Settings selected in Sweep can only be turned off by pressing the SWEEP button
and using the menu to change modes. The only exception is that when Eye
display mode is selected, if the instrument is in 2 Line or 2 Field sweep, the
sweep setting is changed to 1 Line or 1 Field respectively and does not revert
back when you exit the Eye display mode.
These buttons perform their function depending on the current mode.
H
Press the SELECT button to make a menu selection.
H
Press the PRINT button to print the instrument display.
H
Press the CLR MENU button to clear a menu display.
SWEEP
GAIN
CURSOR
LINE SEL
FREEZE
DISPLAY
INPUT
PRESET
SELECT
PRINT
CLR MENU
WFM700 Series Waveform Monitors User Manual
Functional Overview
Touch Screen (Soft Keys)
Use the touch screen to select choices from a menu and to access additional
instrument menus. “Buttons” that appear on screen are referred to as soft keys
and change with the instrument mode. The soft keys function as follows:
H
Some soft keys toggle between two settings, such as enable and disable.
H
Some soft keys act as a linked group in which only one button can be
selected at a time (mutually exclusive).
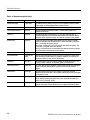
Readouts
Various on-screen readouts inform you of instrument settings and conditions,
depending on the current state of the instrument (see Table 2--4). When a menu is
displayed, the readouts on the lower part of the screen move above the menu.
Table 2- 4: Readout descriptions
Readout
Location
Description
Current reference (Ref)
Lower left
Text indicates the current source of the video reference: INT (active input signal) or
EXT (signal applied on the external reference connector). Also displays the type
and status of the reference.
Vector graticule type (Bars:)
Lower left
Text indicates the current setting of the Vector Graticule, 75% or 100%.
Horizontal gain (HGain)
Lower left
Text displays the variable horizontal gain value in yellow to indicate that it is not
standard.
Vertical gain (VGain)
Lower left
Text displays which calibrated vertical gain you have selected, such as 1x or 5x. If
you select variable gain, the readout displays the gain value in yellow.
Selected input / input format
Lower left
Text indicates the currently selected input (1A, 1B, 2A, or 2B), followed by the input
format. For example, 2A: 1.4835 Gb/s 1080sf:29.97 would indicate that the A input
of the module in slot 2 is selected, it is receiving an HD signal, and that the format
of the signal is 1080sf at a frame rate of 29.97 Hz.
Gamut threshold settings
Lower left
Text indicates the current gamut limit settings for the selected display: Arrowhead,
Diamond, or Split Diamond. For the Arrowhead display, the following readouts are
displayed: Y+C Hi, Y+C Lo, Y Hi, and Y Lo. For the Diamond and Split Diamond
displays, the following readouts are displayed: High and Low.
Color standard
Lower center
Text indicates the current colorimetry standard. Not present in all modes.
Audio channels
Lower center
If enabled in the Audio Displays submenu of the Configure menu, 16 characters
indicate embedded audio channel status; one character for each channel. The
codes are as follows:
P = Present
— = Not Present
Waveform components
Lower center
Text indicates the currently displayed waveform color components. Non-displayed
components are indicated by dashes. For example, an RGB display with G
deselected would appear as R-- B.
WFM700 Series Waveform Monitors User Manual
2- 5
Test Equipment Depot - 800.517.8431 - 99 Washington Street Melrose, MA 02176 - FAX 781.665.0780 - TestEquipmentDepot.com
Functional Overview
Table 2- 4: Readout descriptions (Cont.)
Readout
Location
Description
Magnification (Mag)
Lower center
Text indicates the mag setting. If mag is on, the text appears in yellow to indicate
that the signal is not being displayed in the normal time scale.
Sweep rate
Lower center
Text indicates the selected sweep rate.
Closed caption presence
Upper left
When the instrument detects the presence of a closed caption signal, CC is
displayed on the screen.
Timecode
Upper left
Text indicates the type of timecode (VITC or ATC) and the decoded time. A
semicolon between the seconds readout and the frame readout indicates that the
timecode is of the “drop-frame” variety. If no timecode is present, no text appears.
Ancillary data
Upper left
Indicates the presence of ancillary data packets in the video stream, excluding
packets for embedded audio and RP165 EDH. Possible messages are as follows:
Blank - No ancillary data packets present.
Anc Present - Indicates that one or more ancillary data packets are present, and
that no parity or checksum errors were detected.
Anc Error - Indicates that one or more ancillary data packets are present, and that
one or more parity or checksum errors were detected.
Program rating
Upper left
Text indicates the V-chip (Content Advisory) rating of the program.
Eye measurements
Upper left and
center
When the eye measurements are turned on in the Eye display, the current values
of the following eye measurements are displayed: amplitude, rise overshoot, fall
overshoot, rise time, fall time, and rise-fall time delta.
Gamut error
Top center
When gamut errors occur, the readout (if enabled) will display either “RGB,” “Y+C,”
or “Lum” for RGB, Composite, or Luminance gamut errors, respectively.
Current date and time
Upper right
The current date and time is displayed. Use the System submenu of the Configure
menu to set the date and time and to select the format of the date and time
displays.
Field and line
Upper right
When Line Select is active and Line is selected, on-screen text shows the
displayed field and line number. It also indicates in which portion of the video signal
the selected line occurs.
Sample
Upper right
When Line Select is active and Sample is selected, text displays the selected
sample number, followed by the portion of the video signal that the sample is in,
such as Y, Cb, Cr, EAV, HB, or SAV.
Cursor
Upper right
When cursors are active, the text displays the time or voltage (depending upon
mode) at their location and the difference in time or voltage between them (delta).
2- 6
WFM700 Series Waveform Monitors User Manual
Functional Overview
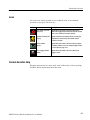
Icons
On-screen icons inform you that an error condition exists or an instrument
operation is in progress. The icons are:
Icon
Name
Description
Video Alarm / Error Indicator (Red)
Appears at the top-middle of the screen when video
alarms have triggered and remains until just after the last
alarm or error condition is resolved (cleared).
Hardware Fault Indicator
(Yellow)
Appears when there are hardware issues, such as high
temperature or a blocked fan, and remains until the
condition is resolved.
Freeze Indicator
(Green)
Appears at the left-middle of the screen when a capture
is available, whether or not it is currently displayed. Refer
to Freeze Menu on page 2-- 21.
Event Logging Indicator
(White)
Appears at the top-middle of the screen when event
logging is active.
Context-Sensitive Help
When the instrument is in a major mode, such as Waveform or Vector, pressing
the HELP button displays help about that mode.
WFM700 Series Waveform Monitors User Manual
2- 7
Functional Overview
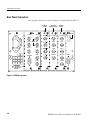
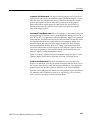
Rear Panel Connectors
The rear-panel connectors are shown in Figure 2--2 and described in Table 2--5.
WFM7DG
module
!
!
100 - 240VAC ( 10%) 50/60 Hz
175 WATTS MAXIMUM
AUX IN
WFM7A or
WFM7HD module
REF IN
WFM7M
module
!
SD PIX MON
SD PIX MON
LOOP
AUX OUT 1 THROUGH REF IN
INPUT A
INPUT A
PIX G/Y
INPUT B
INPUT B
PIX B/Pb
SERIAL OUT
SERIAL OUT
AUX OUT 2
VGA PIX MON
PIX R/Pr
!
ETHERNET
REMOTE
JITTER OUT
EXT VGA
Figure 2- 2: WFM700 rear panel
2- 8
WFM700 Series Waveform Monitors User Manual
Functional Overview
Table 2- 5: Rear-panel connectors
Connector(s)
Description
Power
This instrument is intended to operate from a single-phase power source with one current-carrying
conductor at or near earth ground (the neutral conductor). Only the Line conductor is fused for
over-current protection. The fuse is internal, on the Power circuit board. Systems that have both
current-carrying conductors live with respect to ground (such as phase-to-phase in multiphase systems)
are not recommended as power sources. Mains frequency is 50 or 60 Hz. Operating voltage range is
continuous from 100 to 240 VAC, ±10%.
Video inputs
The waveform monitor provides the following video input connectors:
NOTE: Input A and Input B are separate signal inputs and cannot be used as a loop-through signal path.
INPUT A and INPUT B. Digital, 75 Ω terminating input for signal to be monitored. For WFM700HD, this
can only accept 1.485 Gb/s High Definition serial video. For the WFM700A and WFM700M, this input can
accept HD and 270 Mb/s Standard Definition video.
REF IN LOOP-THROUGH. Compensated for 75 Ω impedance; requires proper termination at one end of
the loop-through connector or at the receiver in a monitored system. Provides for connection of an
external synchronization signal such as black burst or composite video.
AUX IN. Future capability.
Audio inputs / outputs
(Option DG only)
When your instrument has the optional WFM7DG audio module installed, the waveform monitor provides
BNC connectors that function either as inputs for external AES/EBU audio (not necessarily associated
with any video) or as outputs of the de-embedded AES audio associated with the selected video input.
Use the Audio Inputs/Outputs submenu of the Configure menu to configure these connectors.
WFM700 Series Waveform Monitors User Manual
2- 9
Functional Overview
Table 2- 5: Rear-panel connectors (Cont.)
Connector(s)
Description
Multi-pin connectors
The waveform monitor provides the following multi-pin connectors:
VGA PIX MON. A copy of the PIX G/Y, B/Pb, R/Pr pix mon outputs. This allows using an inexpensive
VGA monitor for non-critical HD applications. Most computer monitors will not lock to 50 Hz vertical rates
or to Standard Definition line rates, so this may not work in all applications.
EXT VGA. Provides an exact copy of the instrument display to drive an external monitor.
REMOTE. 9-pin subminiature D-type connector used as a Ground Closure interface for remote control.
ETHERNET. (10/100 Base T). 10/100 Mbit/sec Ethernet interface. Used for for web-based remote control
of the instrument and for downloading firmware upgrades.
Coaxial Outputs
The waveform monitor provides the following coaxial outputs:
PIX G/Y, B/Pb, R/Pr. Provides three 75 Ω component signal outputs to drive a component picture
monitor. You can set the output format to YPbPr or RGB. Out of gamut input signals cause the affected
areas to be highlighted on the monitor display. This gamut error highlight or “bright-up” signal is controlled
in the Configure menu.
SD PIX MON. This output is a copy of the PIX G/Y, B/Pb, R/Pr pix mon output, but is reclocked in SD
serial digital format. It is operational only for SD format input signals, and only while the SD signal is
being displayed on the screen of the waveform monitor. In addition, there is no signal output from this
connector on a module while an input signal from a second module is being displayed on the screen.
SERIAL OUT. Provides a version of the selected signal input (Video Input A or B). There is no signal
output from this connector on a module while an input signal from a second module is being displayed on
the screen.
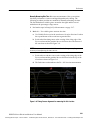
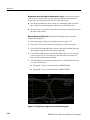
JITTER OUT. (WFM700M only) Provides a 75 Ω output signal from the jitter demodulator. This signal is
only valid when the instrument is in Jitter mode. Any signal present on this output at other times is not a
calibrated jitter signal. The jitter filter selection does not affect this signal.
This signal is used as an input to an oscilloscope or spectrum analyzer to do additional analysis on the
jitter. You can view the same jitter waveform on the waveform monitor using the Jitter display mode.
AUX OUT 1 / AUX OUT 2. Future capability.
2- 10
WFM700 Series Waveform Monitors User Manual
Menus
This section describes the various menus you can access in the instrument and
provides menu diagrams showing the location of the available selections. The
menu diagrams are organized in alphabetical order.
Refer to the WFM700 Series Technical Reference document on the CD-ROM for
a detailed description of each menu selection.
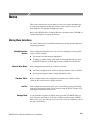
Making Menu Selections
The menu system uses several different methods for entering measurement and
monitoring parameters.
Mutually Exclusive
Buttons
Numeric Value Menus
Checkbox Tables
Some configuration parameters use a set of boxes containing all of the possible
values or states (settings).
H
The currently selected setting is highlighted.
H
To change to another setting, touch the box containing that setting or press
the SELECT button to cycle through all of the settings to the desired one.
Some configuration parameters use a numeric value box.
H
The knob icon appears in the value box and the parameter value is outlined.
H
Use the general purpose knob to change the numeric value.
In the Configure menu, some configuration parameters use check box tables.
Touch the box on the screen to change selections.
List Box
Some configuration parameters show a list of items that you can scroll through
using the general purpose knob. Select items by using the SELECT button or by
touching the desired item on the screen.
Exiting a Menu
To exit all menus except the Configure menu, press the CLR MENU button or
press any major mode button. To exit the Configure menu, press the CONFIG
button (once if you are at the top level or twice if you are in a submenu) or press
any major mode button.
WFM700 Series Waveform Monitors User Manual
2- 11
Menus
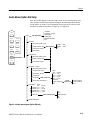
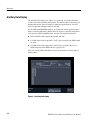
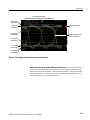
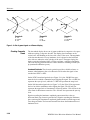
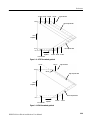
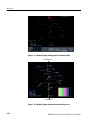
Using the Menu Diagrams
The menu diagrams contain the following components (see Figure 2--3):
1. A partial illustration of the instrument front panel, highlighting the frontpanel button you select to enter the displayed menu.
2. Menu names, shown in bold text.
3. Unique submenus, connected with a dashed line. These soft keys appear only
when a certain mode, such as Arrowhead, is selected.
4. A list of menu soft keys that are displayed on the touch screen. Touching one
of these soft keys either activates a feature or enters a submenu.
5. Submenu names, shown in bold text.
6. Submenu soft keys.
7. A vertical line ( | ) separates two options on a toggle soft key. A slash ( / )
may also be used to separate multiple options from which you can select.
8. Variables, usually controlled by the general purpose knob, are shown as
ellipses or generic names inside angle brackets <...> .
(8) Brackets
representing a variable
VIEW
(7) Vertical line
separating options
WFM
Diamond
VECTOR
STATUS
PICTURE
MEASURE
GAMUT
EYE
RGB Limit Menu
Set Thresholds
Gamut Menu
(2) Menu name
Split Diamond
Arrowhead
Setup : < . . . >
(1) Selected
button
Set Thresholds
AUDIO
Composite Limit Menu
High: < . . . >
Horizontal | Horz + Vert
Area: < . . .%>
Default Settings
Done
Limit Fmt Menu
NTSC
PAL
Auto
Done
MULTI
(3) Dashed lines showing
unique submenus
High: < . . . >
Low: < . . . >
Horizontal | Horz + Vert
Area: < . . . >
Default Settings
Done
Limit Fmt < . . . >
(4) Menu soft keys
(5) Submenu names
(6) Submenu soft keys
Figure 2- 3: Example menu diagram showing components of the diagram
2- 12
WFM700 Series Waveform Monitors User Manual
Menus
Audio Menu (Option DG Only)
Press the AUDIO button to enter the Audio mode. If your instrument has only
video modules installed, the instrument displays the Embedded Audio Status
screen and has no menu. If your instrument has the Option DG audio module
installed, the Audio menu shown in Figure 2--4 is displayed.
VIEW
Level Meters
Level Meters + Lissajous
Surround Sound
Channel Status
Embedded Audio Status
Done
WFM
Display
VECTOR
STATUS
PICTURE
MEASURE
Audio Display Menu
Level Meters
Meter Scaling: Default | Custom
Configure Custom Scaling
GAMUT
EYE
Meter Scale Menu
Format: Stereo | Surround
Scale Min: . . . dBFS
Scale Max: . . . dBFS
Done
Goto Input Map
Surround Sound
AUDIO
Audio Menu
Meter Scaling: Default | Custom
Configure Custom Scaling
MULTI
Format: Stereo | Surround
Level Meters + Lissajous
Meter Scaling: Default | Custom
Configure Custom Scaling
Format: Stereo | Surround
Goto Input Map
Lissajous Pair
Audio Lissajous Pair
Lissajous Style: Soundstage | X-- Y
Stereo
Pairs
Channels: 1 & 2 |
Channels: 3 & 4 |
Channels: 5 & 6 |
Channels: 7 & 8 |
Stereo
Pairs
Surround
1&2 | L&R
3 & 4 | C & LFE
5 & 6 | Ls & Rs
7 & 8 | Lo & Ro
Custom Pair
Configure Custom Pair
Done
Custom
Lissajous Pair
Lissajous Channel A
Lissajous Channel B
Done
Channel Status
Surround
L&R
C & LFE
Ls & Rs
Lo & Ro
Format Text
Audio Ch. Status Format
Text
Binary
XMSN Order Binary
Hex
Done
Embedded Audio Status
Figure 2- 4: Audio menu diagram (Option DG only)
WFM700 Series Waveform Monitors User Manual
2- 13
Menus
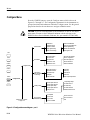
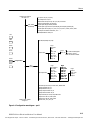
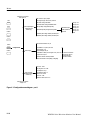
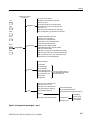
Configure Menu
Press the CONFIG button to open the Configure menu, which is shown in
Figures 2--5 through 2--7. The configuration parameters for the instrument are
grouped into functional submenus within the Configure menu. Use the general
purpose knob and/or the touchscreen to navigate within the menu.
CAUTION. To prevent a misadjustment of the instrument, do not use the adjustment menu selections in the Calibration submenu without referring to the
WFM700 Series Service Manual (Tektronix, Inc. part number 071-0915-XX).
General Alarms
RGB Gamut
Video Format Mismatch
Composite Gamut
Video-- Ref Format Mismatch
Luminance Gamut
Ext Ref Signal Missing
Video Signal Missing
Video Format Change
Ext Ref Format Mismatch
Input Signal not HD
RP165 EDH Status
SDI Code Word Violation
RP165 FF CRC
SDI Line Length Error
RP165 AP CRC
SDI Field Length Error
SMPTE292 Y CRC
SMPTE292 C CRC
SDI SAV Placement
292M Line Mismatch
Emb. Audio Presence
Audio Mute
AES Audio Unlocked
Audio Clip
AES Audio Parity
Audio Silence
Validity Bit
Professional CRC
Audio Over
Emb. Group Sample Phase
Closed Caption Presence
V-Chip Rating Change
Closed Caption Changes
Anc Data Presence
Closed Caption Parity
Anc Data Parity
Closed Caption Protocol
V-Chip Presence
Anc Data Checksum
ARIB STD-B39 Presence
HELP
PRINT
Serial Alarms
FREEZE
Configure Alarms
DISPLAY
Audio Alarms
(Option DG Audio
module only)
CONFIG
Configure Menu
PRESET
Auxiliary Alarms
Eye Amplitude
Configure menu continues
in Figure 2-- 6
Physical Alarms
(WFM700M only)
Eye Rise Time
Eye Fall Time
Eye Rise-Fall Delta
Eye Rise Overshoot
Eye Fall Overshoot
Jitter
Figure 2- 5: Configuration menu diagram - part 1
2- 14
WFM700 Series Waveform Monitors User Manual
Menus
Configure menu continued
from Figure 2-- 5
Vec I/Q Axis: Off | On | On (if SD)
Vec Compass Rose: Off | On
Wfm Graticule Units (non-50 Hz): Auto | mV | IRE | % Full-Scale
Grat / Gamut
Default Setup
Gamut Threshold Default: Tek | EBU-R103
Closed Caption Display: Enabled | Disabled
Closed Caption Type: Auto Detect | EIA-608 (VBI) | EIA-608 (ANC) | EIA-608 (708)
Closed Caption Service (608): CC1 | CC2 | CC3 | CC4 | TEXT1 | TEXT2 | TEXT3 | TEXT4
VBI Captions Line Number: Auto Detect | Line < . . . >
B39 Did/Sdid Address: ARIB | ITU
HELP
PRINT
Strip EAV/SAV (WFM): Pass | Strip
FREEZE
DISPLAY
Ext Ref Format:
CONFIG
Page 1
Auto Select
NTSC
PAL
1080i : 59.94
1080i : 60
720p : 59.94
1080p : 23.97
1080p : 24
Page 2
1080i : 50
The 1080i: 50 format appears
only when a version B
Ext. Ref. module is installed.
Configure Menu
PRESET
Video
Inputs/Outputs
Video Input Format:
Page 1
Any Supported
525i : 59.94
625i : 50
1080i : 59.94
1080i : 60
720p : 59.94
1080p : 23.98
1080p : 24
Page 2
1080p : 30
1080p : 29.97
1080p : 25
1080i : 50
1035i : 60
1035i : 59.94
1080sf : 24
1080sf : 23.98
Page 3
720p: 24
720p : 23.98
720p: 60
720p: 50
HD Colorimetry: Auto Select | ITU-R BT.709-2 | SMPTE 240M
Brightup Line/Sample: Off | On
Brightup RGB Gamut: Off | On
Brightup Composite Gamut: Off | On
Brightup Luminance Gamut: Off | On
Output Colorimetry HD: Auto | BT.709 | SMPTE 240
Output Active for HD: Off | YPbPr | RGB
Output Active for SD: Off | YPbPr | RGB
Configure menu continues
in Figure 2-- 7
Timecode: Auto | VITC | ATC | Off
Figure 2- 6: Configuration menu diagram - part 2
WFM700 Series Waveform Monitors User Manual
2- 15
Test Equipment Depot - 800.517.8431 - 99 Washington Street Melrose, MA 02176 - FAX 781.665.0780 - TestEquipmentDepot.com
Menus
Configure menu continued
from Figure 2-- 6
AES Connectors: Input | Output
Audio Program Type: Stereo Pairs | Surround
HELP
AES Alarms: Change AES Alarm
PRINT
Audio Inputs/Outputs
(Option DG audio
module only)
Embedded Alarms: Change Embedded Alarms
AES Input Map: Change AES Input Map
Embedded Groups
Embedded Input Map: Change Emb. Input Map
Audio In/Out Menu
Top Menu
FREEZE
Groups 1 & 2
Groups 3 & 4
Groups 1 & 3
Groups 2 & 4
Groups 1 & 4
Groups 2 & 3
Done
272M Group Phase Align: Disabled | Enabled | Auto
299M Group Phase Align: Disabled | Enabled | Auto
DISPLAY
Audio Presence Readout: Off | On
CONFIG
Configure Menu
PRESET
Meter Ballistics: VU | PPM | True Peak
Audio Displays
Peak Hold Time: 2 sec
Peak Hold Display: Off | On
Set 0dB Mark To: dBFS | Peak Program Level | Test Level
Lissajous AGC: Off | On
Dominance Indicator: Disabled | Enabled
These menu selections
appear only when an
Option DG audio
module is installed.
Surround Sound Filter: Linear (RMS) | A-Weighting
Test Level: - 18 dB
Peak Program Level: - 8 dB
# of Samples for Clip: 1
Audio Thresholds
(Option DG audio
module only)
# of Samples for Mute: 10
Silence Level: - 60 dB
Over Level: - 8 dB
Duration for Silence/Over: 5 sec
Configure menu continues
in Figure 2-- 8
Figure 2- 7: Configuration menu diagram - part 3
2- 16
WFM700 Series Waveform Monitors User Manual
Menus
Configure menu continued
from Figure 2-- 7
Print Layout: Portrait | Landscape
Print Format: Postscript COLOR | Postscript B&W
HELP
Paper Size: A4 | Letter
Printing/Event Log
PRINT
LPD Print Server IP Address: Press to Edit IP Address
LPD Print Queue Name: raw | Press to Edit Queue name
Ink Saver: On | Off
When Event Log Full: Overwrite Old Events | Stop Logging
Event Log Storage Mode: Log for Resolution | Log for Duration
FREEZE
Config Mode: Manual Mode | DHCP Server
DISPLAY
IP Address: Press to Edit IP Address
Subnet Mask: Press to Edit Subnet Mask
Gateway Address: Press to Edit Gateway Address
Remote Control Port: Enabled | Disabled
CONFIG
Communications
Remote Web Interface: Enabled | Disabled
Remote SNMP Mode: Disabled | Read-Only | Enabled
Configure Menu
SNMP Traps: Disabled | Enabled
PRESET
SNMP Public Comm. String: Press to Edit Public Community String
SNMP Private Comm. String: Press to Edit Public Community String
SNMP Trap Destinations: Press to Select Trap Destination to Edit
Instrument Name: Press to Edit Instrument Name
Touchpanel Calibration
Eye Gain Adjust
SD Jitter Gain Adjust
HD Jitter Gain Adjust
Calibration
Eye Loop BW Adjust (10 Hz)
Eye Loop BW Adjust (100 Hz)
Eye Loop BW Adjust (1 kHz)
These menu selections appear only
on the WFM700M and are intended
for service personnel only
Jitter HPF Adjust
Eye Sig BW Test
Current Time: Press to Edit System Time
Time Format: 12 Hour | 24 Hour
Current Date: Press to Edit System Date
System
Date Format: mm/dd/yyyy | dd/mm/yyyy
Powerup Diagnostics: Brief | Full
Run Full Powerup Diagnostics
Run Internal Digital Path Diagnostics
Run Audio Path Diagnostics (Option DG module only)
Diagnostics
Install Upgrade: Start Firmware Installation
Erase NVRAM Log
View Diagnostic Log
View Prev Log Page
View Next Log Page
Print Diagnostics Log
Back to Diags Menu
Figure 2- 8: Configuration menu diagram - part 4
WFM700 Series Waveform Monitors User Manual
2- 17
Menus
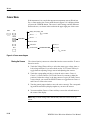
Cursor Menu
If the instrument is in a mode that supports measurement cursors (Waveform,
Eye, or Jitter modes), the Cursor menu shown in Figure 2--9 is displayed when
you press the CURSOR button. The cursor 1 and 2 settings, and the difference
between the two, are shown in the readout in the upper right part of the screen.
SWEEP
Voltage | Time | Voltage + Time
GAIN
V+T Control
Cursor 1 < . . . >
CURSOR
Cursor 2 < . . . >
Cursor Menu
Cursor to Center
LINE SEL
Track Cursors
INPUT
Set Units & 100%
Time: sec | 1/T
Percent Cursors Menu
Voltage: mV | %
Done
Set 100%
Figure 2- 9: Cursor menu diagram
Moving the Cursors
The selected (active) cursors are red and the inactive cursors are blue. To move
the active cursor:
1. Touch the Voltage/Time soft key to select the cursor type: voltage, time, or
both voltage and time. If you select both, use the V+T Control soft key to
toggle between adjusting voltage cursors and adjusting time cursors.
2. Touch the corresponding soft key to select the active cursor: Cursor 1,
Cursor 2, or Track Cursors. (Use Track Cursors if you want to adjust the
position of either the voltage or the time cursors as a pair.) If Track Cursors
is not selected, you can use the SELECT button to toggle between Cursor 1
and Cursor 2 as the active cursor.
3. Turn the general purpose knob to move the active cursor(s). The corresponding readouts and soft key displays update as you move the cursors.
4. You can touch the Cursor to Center soft key to move the selected cursor to
the center of the display.
NOTE. Mag or Gain settings other than X1 may cause the cursors to be off
screen.
2- 18
WFM700 Series Waveform Monitors User Manual
Menus
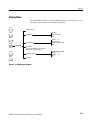
Display Menu
Press the DISPLAY button to open the Display menu shown in Figure 2--10. Use
the Display menu to adjust various display parameters.
HELP
Thumbnail Picture
PRINT
Trace Settings
Waveform < . . . >
Color: Green | White
Done
Graticule Settings
Intensity < . . .%>
Color: GLD | RED
Rendition: Additive | Overlay
Done
FREEZE
DISPLAY
Display Menu
Sleep Mode
[ Note: To exit Sleep Mode, press any button,
turn any knob, or touch the screen ]
CONFIG
Readouts & Backlight
PRESET
Readout: Enabled | Disabled
Readout < . . .%>
Backlight < . . .%>
Done
Button Illum.
Figure 2- 10: Display menu diagram
WFM700 Series Waveform Monitors User Manual
2- 19
Menus
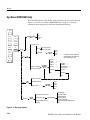
Eye Menu (WFM700M Only)
Press the EYE button to enter the Eye mode and display the Eye menu shown in
Figure 2--11. Refer to Eye Mode (WFM700M Only) on page 3--17 for more
information about using the Eye and Jitter measurement displays.
VIEW
WFM
VECTOR
STATUS
PICTURE
MEASURE
Physical Display
Menu
Eye
Jitter
Event Log
Done
Eye Meas: Off | On
GAMUT
EYE
3 Eye
Display
10 Eye (SD signals)
20 Eye (HD signals)
Clock BW : < . . . >
AUDIO
Eye
MULTI
10 Hz
100 Hz
1 kHz
Done
Clock BW
Menu
Eye
Menu
Set Meas. Thresholds
Set Default Thresholds
Rise Max: < . . . >
Rise Min: < . . . > *
Fall Max: < . . . >
Fall Min: < . . . > *
Delta Max: < . . . >
Eye Alarm
Threshold
Menu
* The minimum rise time and fall time
threshold settings are available only
when the input signal is SD.
Next Menu
Ampl Max: < . . . >
Ampl Min: < . . . >
Rise Overshoot: < . . . >
Fall Overshoot: < . . . >
Max Jitter < . . . >
Done
Next Menu
Done
Set Meas. Thresholds
Jitter
Jitter
Menu
Set Default Thresholds
High Pass Filter: < . . . >
High Pass
Filter Menu
10 Hz
1 kHz
10 kHz
100 kHz
Done
Show: All Events | Errors Only
Event Log
Logging
Menu
Configure View Filter
Log Filter Menu
Logging: Stopped | Running
Erase Log
Show All Alarms
Show General Alarms
Show Serial Alarms
Show Audio Alarms
Show Aux Data Alarms
Show Physical Alarms (WFM700M only)
Done
Figure 2- 11: Eye menu diagram
2- 20
WFM700 Series Waveform Monitors User Manual
Menus
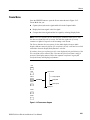
Freeze Menu
Press the FREEZE button to open the Freeze menu shown in Figure 2--12.
Freeze Mode lets you:
H
Capture (freeze) the active signal and hold it in the Capture buffer.
H
Display the frozen signal or the live signal.
H
Compare the frozen signal and the live signal by selecting Display Both.
NOTE. The Freeze function for the Data display in Measure mode freezes only
the data waveform (left side of screen). The data list (right side of screen)
continues to update in response to the incoming serial stream.
The Freeze function does not operate for the Audio display because Audio
display elements cannot be frozen. If a waveform is frozen, it will not be overlaid
with audio when the Display Both function is selected.
If you have frozen a waveform (even if it is not displayed), the pixel density of the
live waveform will be reduced. This is because the frozen waveform is using a
portion of the display memory. Delete the captured waveform to regain full
waveform density and display performance.
HELP
PRINT
Capture Screen
Display Captured
FREEZE
Freeze Menu
Display Both
DISPLAY
Delete Capture
Display Live
CONFIG
PRESET
Figure 2- 12: Freeze menu diagram
WFM700 Series Waveform Monitors User Manual
2- 21
Menus
Gain Menu
Press the GAIN button to display the Gain menu shown in Figure 2--13. The
current gain setting is displayed in the lower left corner of the screen. The gain
setting is displayed in yellow if variable gain is active.
In variable gain modes, use the general purpose knob to set the gain. The
variable gain modes work together with the fixed settings. For example, touch
the 1x soft key, touch the Variable Gain soft key, and then turn the general
purpose knob to select a setting of 1.50x. The vertical gain is 1.5. Now touch the
5x soft key. The gain is 7.50x (the product of 1.50 and 5).
NOTE. The variable gain range is from 0.25x to 14x. You cannot select values
outside this range. Gain is only active in Waveform, Vector, Lightning, Eye, and
Jitter modes.
In fixed gain settings, the vertical graticule appears with a calibrated scale. When
variable gain is enabled in Waveform, Jitter, and Eye modes, the graticule
appears without a scale. In Vector and Lightning modes, the targets move when
fixed gain settings are changed, but do not move as variable gain is adjusted.
SWEEP
GAIN
Gain: 1x
Gain Menu
CURSOR
Gain: 5x
Gain: 10x
LINE SEL
Var. Gain: < . . . >
INPUT
Var. H Gain: < . . . >
(available only in Lightning Mode)
Figure 2- 13: Gain menu diagram
2- 22
WFM700 Series Waveform Monitors User Manual
Menus
Gamut Menu
Press the GAMUT button to enter the Gamut mode and display the Gamut menu
shown in Figure 2--14. Use the Gamut menu to view the Diamond, Split
Diamond, or Arrowhead displays, and to set the gamut measurement limits.
Refer to Gamut Measurements on page 3--27 for more information.
VIEW
WFM
VECTOR
STATUS
PICTURE
MEASURE
Diamond
Diamond: Standard | Split
GAMUT
EYE
Set RGB Thresholds
RGB Limit Menu
AUDIO
RGB High: < . . .mV >
RGB Low: < . . .mV >
Horizontal | Horz + Vert
Area: < . . .% >
Default: . . . . .
Done
Gamut Menu
MULTI
Arrowhead
Set Luma Thresholds
Luminance Limit Menu
Luma High: < . . .mV >
Luma Low: < . . .mV >
Horizontal | Horz + Vert
Area: < . . .% >
Default: . . . . .
Done
Setup 0% | Setup 7.5%
Set Y+C Thresholds
Limit Fmt < . . . >
Composite Limit Menu
Y+C High: < . . . >
Y+C Low: < . . . >
Horizontal | Horz + Vert
Area: < . . .%>
Default: . . . . .
Done
Limit Fmt Menu
NTSC
PAL
Auto
Done
Figure 2- 14: Gamut menu diagram
WFM700 Series Waveform Monitors User Manual
2- 23
Menus
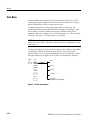
Help Menu
Press the HELP button to display online help about the current operating mode
and to display system information such as the software version, the installed
options and board versions, and the network parameters (see Figure 2--15).
HELP
Button Finder
Help Menu
PRINT
System Info
System Info
Software Version
Installed Options
Network Params
FREEZE
DISPLAY
Figure 2- 15: Help menu diagram
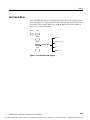
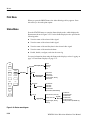
Input Menu
Press the INPUT button to display the Input menu shown in Figure 2--16. Use
the Input menu to select which video input to monitor, the reference signal
source (internal or external), and which audio input to monitor.
SWEEP
GAIN
CURSOR
Input #1A: <module type>
Input #1B: <module type>
LINE SEL
Input #2A: <module type>
Input #2B: <module type>
INPUT
These menu selections appear
only when a second video
module is installed.
Input Menu
Audio In: Embedded | Ext AES
This menu selection appears only when the
Option DG audio module is installed and the
AES connectors are configured as inputs.
Reference: Internal | External
Figure 2- 16: Input menu diagram
2- 24
WFM700 Series Waveform Monitors User Manual
Menus
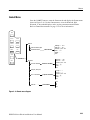
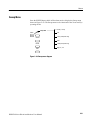
Line Select Menu
Press the LINE SEL button to enable the Line Select mode and open the menu
shown in Figure 2--17. Operating modes that support the line select function are
Waveform, Vector, Gamut, Jitter, Eye, and Data. Refer to Line Select Mode on
page 3--31 for more information.
SWEEP
GAIN
CURSOR
All Fields
Field: 1 of 2 | 2 of 2
LINE SEL
Line Select Menu
Line < . . . >
INPUT
Sample < . . . >
Figure 2- 17: Line Select menu diagram
WFM700 Series Waveform Monitors User Manual
2- 25
Test Equipment Depot - 800.517.8431 - 99 Washington Street Melrose, MA 02176 - FAX 781.665.0780 - TestEquipmentDepot.com
Menus
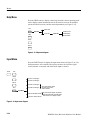
Measure Mode Menu (WFM700A and WFM700HD Only)
For instruments with only WFM7A and/or WFM7HD video modules installed,
press the Measure button to access the Bowtie mode. Refer to Bowtie Mode on
page 3--14 for more information.
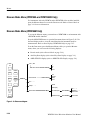
Measure Mode Menu (WFM700M Only)
To access the Measure menu, you must have a WFM700M or an instrument with
a WFM7M module installed.
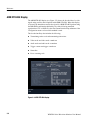
Press the MEASURE button to open the Data menu shown in Figure 2--18. Use
the Data Display mode to view the actual data that the instrument used for
measurements. Refer to Data Display (WFM700M Only) on page 3--15.
From the Data menu, press the Measure Menu soft key to open the Measure
menu, where you can access the following displays:
VIEW
H
Bowtie mode (refer to Bowtie Mode on page 3--14)
H
Ancillary Data display (refer to Ancillary Data Display on page 3--4)
H
ARIB STD-B39 display (refer to ARIB STD-B39 Display on page 3--6)
Video | Data
Select Channels
Y
Cb
Cr
Done
Readout Format
Hex
Decimal
Binary
Done
WFM
Select Channels
VECTOR
STATUS
PICTURE
MEASURE
Readout Format
Data Menu
GAMUT
EYE
AUDIO
Line < . . . >
Bowtie
Sample < . . . >
Data Display
Measure Menu
Measure Menu
Anc Data Display
Anc. Data Menu
DID: <. . . . >
SDID/DBN: < . . . >
Measure Menu
ARIB B39 Display
Anc. Data Menu
Measure Menu
MULTI
Figure 2- 18: Data menu diagram
2- 26
WFM700 Series Waveform Monitors User Manual
Menus
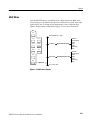
Multi Menu
Press the MULTI button to enter Multi mode, which displays the Multi menu
shown in Figure 2--19. Multi mode shows two different views of the same input
signal side-by-side. You must use the Input menu to select a different input
signal to display. Refer to Multi Mode on page 3--34 for more information.
VIEW
WFM
Selected Window: Left | Right
VECTOR
STATUS
PICTURE
MEASURE
GAMUT
EYE
Left Window:
Multi Left Window Config
Waveform
Vector/Lightning
Gamut
Audio
Status
Data Display
Done
Multi Right Window Config
Waveform
Vector/Lightning
Gamut
Audio
Status
Data Display
Done
AUDIO
Right Window:
MULTI
Multi Menu
Go To <mode> Menu
Figure 2- 19: Multi menu diagram
WFM700 Series Waveform Monitors User Manual
2- 27
Menus
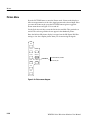
Picture Menu
Press the PICTURE button to enter the Picture mode. Picture mode displays a
full screen representation of the video signal present at the selected input. After
you enter the Picture mode, press the PICTURE button again to toggle the
Picture menu shown in Figure 2--20 on and off.
Use the Safe Area soft key to turn the Safe Action and Safe Title graticules on
and off. The safe area graticules do not appear in the thumbnail picture.
Since the full-size SD picture display is cropped, use the SD Picture Half Size
setting to view the complete picture when you are monitoring SD signals.
VIEW
WFM
VECTOR
STATUS
PICTURE
MEASURE
SD Picture: Half Size | Full Size
GAMUT
EYE
Picture Menu
Safe Area: On | Off
AUDIO
MULTI
Figure 2- 20: Picture menu diagram
2- 28
WFM700 Series Waveform Monitors User Manual
Menus
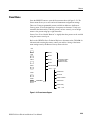
Preset Menu
Press the PRESET button to open the Preset menu shown in Figure 2--21. The
Preset menu allows you to store and recall instrument configuration settings.
There are 42 user-programmable presets available in addition to the Restore
Factory preset. You can designate up to four presets as shortcuts. To help you
remember the functionality of the the presets you have created, you can assign
names to the presets using up to eight characters.
Presets 36 to 42 are labeled “Remote” to signify that these presets can be recalled
using the remote control port.
Refer to the WFM700 Series Technical Reference document on the CD-ROM for
information about using the remote control port and for a listing of the instrument settings reset by the Restore Factory menu selection.
HELP
Shortcut
PRINT
Shortcut
Shortcut
FREEZE
Shortcut
DISPLAY
These menu selections
are grayed out until
shortcuts are created.
Undo Last Restore
— more — 1 of 2
Rename Preset
CONFIG
Save Preset
Promote to Shortcut
PRESET
Preset Menu
Remove Preset
Restore Factory
— more — 2 of 2
Figure 2- 21: Preset menu diagram
WFM700 Series Waveform Monitors User Manual
2- 29
Menus
Print Menu
When you press the PRINT button, the Abort Printing soft key appears. Press
this soft key to abort the print request.
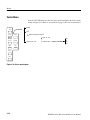
Status Menu
Press the STATUS button to enter the Status display mode, which displays the
Status menu shown in Figure 2--22. Use the Status display mode to perform the
following tasks:
H
View the status of the selected video signal
H
View the status of the selected audio signal
H
View the status of the auxiliary data in the selected video signal
H
View the status of the monitored alarms
H
Enable, disable, configure, and view the event log
For more information about using the Status mode displays, refer to Logging on
page 3--32 and Status Displays on page 3--37.
VIEW
WFM
Display
VECTOR
Status Display Menu
Session
Alarm Status
Event Log
Done
STATUS
Status Menu
PICTURE
MEASURE
GAMUT
EYE
Session
Aud/Vid/Aux Data
Session Menu
Alarm Status
AUDIO
Alarm Menu
Video Session
Audio Session
Aux Data Status
Session: Stopped | Running
Reset Session
General Alarms
Serial Alarms
Audio Alarms
Aux Data Alarms
Physical Alarms (WFM700M only)
MULTI
Show: All Events | Errors Only
Event Log
Logging Menu
Configure View Filter
Log Filter
Menu
Logging: Stopped | Running
Erase Log
Show All Alarms
Show General Alarms
Show Serial Alarms
Show Audio Alarms
Show Aux Data Alarms
Show Physical Alarms (WFM700M only)
Done
Figure 2- 22: Status menu diagram
2- 30
WFM700 Series Waveform Monitors User Manual
Menus
Sweep Menu
Press the SWEEP button while in Waveform mode to display the Sweep menu
shown in Figure 2--23. The Sweep menu is also functional in the Vector and Eye
operating modes.
Parade | Overlay
Sweep Menu
SWEEP
GAIN
Line
2 Line ( Overlay mode only)
CURSOR
Field
LINE SEL
2 Field (Overlay mode only)
Mag: On | Off
INPUT
Figure 2- 23: Sweep menu diagram
WFM700 Series Waveform Monitors User Manual
2- 31
Menus
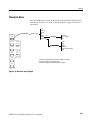
Vector Menu
Press the VECTOR button to enter the Vector mode and display the Vector menu
shown in Figure 2--24. Refer to Vector Mode on page 3--40 for more information.
Lightning
VIEW
WFM
Vector Menu
Vector
VECTOR
STATUS
PICTURE
MEASURE
GAMUT
EYE
Graticule: Component | Composite
Setup: 0% | 7.5%
Color bars: 75% | 100%
Graticule Format
Graticule Format Menu
NTSC
PAL
Auto
Done
AUDIO
MULTI
Figure 2- 24: Vector menu diagram
2- 32
WFM700 Series Waveform Monitors User Manual
Menus
Waveform Menu
Press the WFM button to open the Waveform mode and display the Waveform
menu shown in Figure 2--25. Refer to Waveform Mode on page 3--44 for more
information.
Waveform Menu
VIEW
Parade | Overlay
WFM
VECTOR
STATUS
PICTURE
MEASURE
GAMUT
EYE
Y*
R (Pb)*
G (Pr)*
B*
Setup < . . .%>{
Filters
Color Space
Filter Menu
Filter : Flat
Filter : Lowpass
Done
ColorSpace Menu
YPbPr
RGB
YRGB
Composite
Chroma: Offset | Aligned }
Done
AUDIO
MULTI
* Components can be turned on/off in respective component color space.
{ Setup only available in Composite color space.
} Chroma offset | aligned only available in YPbPr color space.
Figure 2- 25: Waveform menu diagram
WFM700 Series Waveform Monitors User Manual
2- 33
Reference
Reference
NOTE. Refer to Related Reference Documents on page vi for a list of reference
documents that are available on the WFM700 Series User Documentation
CD-ROM located on the back cover of this manual and/or at the Tektronix, Inc.
Web site (www.tektronix.com).
The topics in Reference listed below are organized alphabetically:
H
Alarms
H
Gamut measurements
H
Ancillary Data display
H
Line Select mode
H
ARIB STD-B39 display
H
Logging
H
Audio mode
H
Measure mode (WFM700M only)
H
Audio mode (Option DG only)
H
Multi mode
H
Bowtie mode
H
Picture mode
H
Composite display
H
Printing
H
Data display (WFM700M only)
H
Status displays
H
Diagnostics
H
Vector mode
H
Eye/Jitter mode (WFM700M only)
H
Waveform mode
WFM700 Series Waveform Monitors User Manual
3- 1
Test Equipment Depot - 800.517.8431 - 99 Washington Street Melrose, MA 02176 - FAX 781.665.0780 - TestEquipmentDepot.com
Reference
Alarms
Use the Configure Alarms submenu of the Configure menu to select which error
conditions you will monitor and how you will be notified in the event of an error.
The alarms are organized into the following groups to help you locate a desired
alarm: General, Serial, Audio (Option DG only), Auxiliary, and Physical
(WFM700M only).
The top level of the submenu display shows which notification methods are
enabled. An “X” indicates that a notification method is selected and an “O”
indicates that the notification method is not selected.
Refer to the WFM700 Series Technical Reference document on the CD-ROM for
a description of each alarm condition.
Possible Alarm Actions
For each available alarm, you can select one or more notification methods:
NOTE. If you do not select a notification method for an error, you will not be
notified if that error occurs.
H
On-screen. An icon appears at the top of the current display. This notification
method is disabled when the Configure menu is open.
H
Beep. The instrument makes an audible alarm.
H
SNMP. The instrument sends an SNMP trap out the Ethernet port for a
remote notification that an alarm condition occurred. You must enable and
configure the instrument for SNMP control using the Communications
submenu of the Configure menu before SNMP traps can be sent.
Refer to the WFM700 Series Technical Reference document and the
WFM700 Series SNMP MIB Reference on the CD-ROM for more information about using SNMP alarm notifications.
3- 2
H
Logging. The instrument makes an entry in the Event Log. Refer to Logging
on page 3--32 for more information.
H
Ground Closure. The instrument sends a signal out the Remote port for a
remote notification that an alarm condition occurred. You must enable the
Remote Control Port in the Communications submenu of the Configure
menu before notifications can be sent.
WFM700 Series Waveform Monitors User Manual
Reference
Viewing Alarm Status
Error Detection
Limitations
Use the Status Display mode to view current alarm conditions. Use the Event
Log to view past alarm conditions. Refer to Status Displays on page 3--37 and
Logging on page 3--32 for more information.
When the instrument is in the Eye / Jitter operating mode, all enabled alarms are
detected and reported except for the following alarms: RGB Gamut, Composite
Gamut, and Closed Caption Presence. Detection of analog (line 21) closed
caption does not operate if the instrument is in Data mode or in Multi mode
when the Data display is selected as one of the displays.
Eye Measurement Alarms. When enabled, the eye measurement alarms will be
reported to the Event Log in only the following two conditions:
H
When the Eye display is selected and the eye measurement readout is
turned on
H
When the Event Log or Alarm Status displays are selected after the eye
measurement readout is turned on
That is, if you enter the Eye display and turn on the eye measurements, and then
you use the STATUS button to view the Event Log or Alarm Status displays, the
eye measurement alarms will be active. If you select another display mode such
as Jitter or Waveform, the eye measurement alarms will be disabled.
Jitter Measurement Alarm. When enabled, the Jitter alarm will be reported to the
Event Log in only the following two conditions:
H
When the Jitter display is selected
H
When the Event Log or Alarm Status displays are selected after the Jitter
display is selected
That is, if you enter the Jitter display and then use the STATUS button to view
the Event Log or Alarm Status displays, the jitter measurement alarm will be
active. If you select another display mode such as Eye or Waveform, the jitter
measurement alarm will be disabled.
WFM700 Series Waveform Monitors User Manual
3- 3
Reference
Ancillary Data Display
The Ancillary Data display (see Figure 3--1) shows the raw (undecoded) data
words in the selected ancillary data packets. The ancillary data is shown only in
hexadecimal format. Since the display is updated at approximately 2-second
intervals, rapid data changes cannot be detected.
Use the DID and SDID/DBN soft keys in conjunction with the general purpose
knob to select the DID and/or SDID values for the type of ancillary data packet
to be monitored. DID and SDID values have the following characteristics:
H
DID and SDID values range between 0x01 and 0xff.
H
For DID values in the range 0x00 -- 0x7F (Type 2 packets), the SDID values
are used.
H
For DID values in the range 0x80 -- 0xFF (Type 1 packets), there are no
SDID values used (the SDID soft key is greyed out).
Table 3--1 lists the DID and SDID values that are defined for common types of
ancillary data.
Figure 3- 1: Ancillary Data display
3- 4
WFM700 Series Waveform Monitors User Manual
Reference
Table 3- 1: DID and SDID values for common ancillary data types
Ancillary data type
DID value
SDID value
ARIB TR-B22, Sub Information of transmitting materials
0x5F
0xE0
ARIB TR-B23, Line 20 User Data - 1
0x5F
0xFC
ARIB TR-B23, Line 20 User Data - 2
0x5F
0xFB
Video Payload Identifier
0x41
0x01
ARIB STD-B35 Trigger Signal for Data Broadcasting
0x5F
0xFD
ARIB STD-B37 Closed Captioning
Analog signal
SD signal
HD signal
0x5F
0x5F
0x5F
0xDD
0xDE
0xDF
ARIB STD-B39 Inter Stationary Control Data
ARIB specification
ITU specification
0x5F
0x43
0xFE
0x01
SMPTE RP-188 Time Code
0x60
None
EIA-608 Closed Captioning
0x61
0x02
EIA-708 Closed Captioning
0x61
0x01
Program Description
0x62
0x01
AES Audio Group 1
0xFF
None
SD Embedded Audio
Group 1
Group 2
Group 3
Group 4
0xFF
0xFD
0xFB
0xF9
None
None
None
None
SD Extended Audio Packets
Group 1
Group 2
Group 3
Group 4
0xFE
0xFC
0xFA
0xF8
None
None
None
None
HD Embedded Audio
Group 1
Group 2
Group 3
Group 4
0xE7
0xE6
0xE5
0xE4
None
None
None
None
WFM700 Series Waveform Monitors User Manual
3- 5
Reference
ARIB STD-B39 Display
The ARIB STD-B39 display (see Figure 3--2) shows the decoded data for video
signals using ancillary data compliant with ARIB STD-B39. When this display
is selected, the instrument searches the signal for ARIB STD-B39 packets using
the DID/SDID combinations defined by one of the following standards
organizations: ITU or ARIB. Use the Grat/Gamut Default Setup submenu of the
Configuration menu to select which standard is used.
The decoded ancillary data includes the following:
H
Transmitting station code and transmitting station time
H
Video mode and video mode countdown
H
Audio mode and audio mode countdown
H
Trigger counter and trigger countdown
H
Status bits
H
Error correcting code
Figure 3- 2: ARIB STD-B39 display
3- 6
WFM700 Series Waveform Monitors User Manual
Reference
Audio Mode
For instruments with only video modules installed, Audio mode provides a
protocol-level check for the AES stream. The Embedded Audio Status screen
reports the following information:
H
Which video input is the source of the embedded audio
H
The standard used by the audio signal
H
Whether the header indicates that audio is present on each pair of channels
(Status = Present or Not Present)
Audio Mode (Option DG Only)
NOTE. The information below describes the Audio mode display for instruments
with the Option DG audio module installed.
Configuring the
Instrument for Audio
Measurements
Selecting Which Audio
Input to Monitor
Use the following submenus of the Configure menu to set the various instrument
parameters for audio measurements: Audio Inputs/Outputs, Audio Displays, and
Audio Thresholds. Use the Configure Alarms submenu to configure the audio
alarms.
Use the Input menu to select which audio input the instrument will monitor.
Select Embedded to monitor the audio signal embedded in the selected video
signal input, or select Ext AES to monitor the audio signal(s) connected to the
Option DG audio module.
NOTE. When you set the function of the AES connectors to output, embedded
audio is automatically selected as the audio input source. You cannot monitor
audio signals on the AES connectors until their function is set to input (use the
Audio Inputs/Outputs submenu of the Configure menu).
When you select Embedded or Ext AES as the audio input source, the instrument
maps the audio signal to the level-meter bars as configured by the Embedded
Input Map or the AES Input Map in the Audio Inputs/Outputs submenu of the
Configure menu.
WFM700 Series Waveform Monitors User Manual
3- 7
Reference
Selecting the Audio
Display Type
Elements of the
Level Meters + Lissajous
Display
Use the Display soft key to select one of the following audio displays:
H
Level Meters
H
Level Meters + Lissajous
H
Surround Sound
H
Channel Status
H
Embedded Audio Status
When you select the Level Meters + Lissajous display (see Figure 3--3), the left
portion of the screen displays the level meters and the right portion of the screen
displays the Lissajous display (also known as a phase plot).
Lissajous (phase) display
Level meters
Meter Ballistics
readout
Session Time and Embedded
Group Sample Phase readouts
In phase label
Peak Level indicator
Test Level indicator
Selected phase
pair indicators
Level meter scale
and units
Axes for
phase display
In-bar warning
messages
Level meter labels
Audio input source
AES Connector
I/O setting
Phase correlation meters
AGC readout
Correlation meter for selected pair
Audio Presence readout
Figure 3- 3: Audio Level Meters + Lissajous display
3- 8
WFM700 Series Waveform Monitors User Manual
Reference
Selecting the Channel Pair
for the Lissajous Display
To select which channel pair is displayed on the Lissajous display:
NOTE. The channel pair labels depend on the Audio Program Type setting
(surround or stereo pairs).
1. Touch the Lissajous Pair: soft key to open the Audio Lissajous Pair menu.
2. Select a channel pair by performing one of the following actions:
H
Touch the soft key for one of the four default channel pairs.
H
Touch the Custom Pair: soft key to select the custom channel pair you
specified using the Configure Custom Pair soft key.
H
Touch the Configure Custom Pair soft key to open the Custom Lissajous
Pair menu where you can specify which audio channel is displayed in
each Lissajous channel.
3. Touch the Done soft key to save your selection.
NOTE. For SD embedded audio only:
Preservation of audio-sample phase between different AES channel pairs or
across embedded audio groups is not supported by SMPTE 272M alone. The
Lissajous Custom Pair display may not correctly represent audio phase unless
the following extensions to SMPTE 272M are observed:
1. The selected audio channels must be embedded with exactly the same audio
sample frequency.
2. The intended sample alignment must be represented by the average embedded
sample position.
3. Most lines should carry phase-aligned samples and should have an equal
number of samples from each group. This minimizes the number of attempts
needed to reestablish correct alignment.
These are not requirements of SMPTE 272M and some embedders do not meet
these criteria. Furthermore, some de-embedding equipment may not make use of
these characteristics, even if present. In these cases, there may be variation in
the displayed audio phase between different AES channels. The variation is
typically ᐔ 1 audio sample, but may be greater depending on random startup
conditions and the design of the embedder/de-embedder.
WFM700 Series Waveform Monitors User Manual
3- 9
Reference
Elements of the Surround
Sound Display
When you select the Surround Sound display (see Figure 3--3), the left portion of
the screen displays the level meters and the right portion of the screen displays
the Surround Sound display. Use the Audio Displays submenu of the Configure
menu to enable or disable the Dominance indicator and to select the type of
Surround Sound filter: Linear (RMS) or A-weighting.
NOTE. Audio Surround Sound display courtesy of Radio-Technische Werkstaetten
GmbH & Co. KG (RTW) of Cologne, Germany.
Audio Input Mapping
Restrictions for Surround
Sound Display
The Surround Sound display is restricted to using signals from only certain audio
input channels. The factory default settings for mapping the audio inputs are the
correct settings for using the Surround Sound display.
For embedded audio groups 1 and 2, the display only works when channels 1
and 2 are mapped to the L--R bars, channels 3 and 4 are mapped to the C--Lfe
bars (the Lfe channel is ignored), and channels 5 and 6 are mapped to the Ls--Rs
bars. Channels 7 and 8 are always ignored. Similar rules apply for embedded
audio groups 3 and 4 and for the external AES audio inputs. You cannot remap
the audio inputs when you are using the Surround Sound display.
Surround Sound display
Level meters
Surround sound filter setting
Meter Ballistics
readout
Phantom source
indicators
Phantom source grid
50 = center of C and R
Peak Level indicator
Center volume
indicator
Test Level indicator
Dominance indicator
Level meter scale
and units
In-bar warning
messages
Total volume indicator
Loudness grid
10 dB per marker
Level meter labels
Audio input source
AES Connector
I/O setting
Correlation meter for Ls and Rs
Phase correlation meters
Audio Presence readout
Figure 3- 4: Surround Sound audio display
3- 10
WFM700 Series Waveform Monitors User Manual
Reference
Interpreting the Surround
Sound Display
The Surround Sound display indicates the audio level balance among the left (L),
right (R), left-surround (Ls), and right-surround (Rs) channels as cyan lines on
the ruled scales radiating from the center. The scale has tic marks at 10 dB
intervals. An additional tic mark indicates the --18 dB level. The --18 dB and
--20 dB levels are typically used for aligning audio levels.
The cyan polygon formed by connecting the level indicator endpoints shows the
total sound volume formed by the L, R, Ls, and Rs channels. This connecting
line will bend away from the center if the two signals have a positive correlation,
will bend towards the center if the signals have a negative correlation, and will
not bend if the signals are uncorrelated.
The Center Volume indicator displays the sound volume of the center channel as
a vertical yellow bar between the L and R channels, and connects the ends of the
L, C, and R audio level indicators with straight lines.
Phantom Sound Indicators (PSI), located on each side of the Surround Sound
display, indicate the location of potential phantom sound sources formed by
adjacent channels. The white tic marks on these moving bar indicators show the
phantom source locations. The bar length indicates the correlation between the
adjacent channels. A short-to-medium length green bar indicates positive
correlation between the channels, forming a localized phantom sound source
located at the white tic mark. The bar grows to full length and changes color to
yellow as the correlation moves to zero, indicating a wide, non-localized sound
image. The bar changes color to red for adjacent channels with significant
negative correlation. For negative correlations, the ends of the PSI for the L and
R channels will continue to grow at a 45 _ angle while the other PSIs remain at
full length.
A fifth PSI at the top of the display shows potential phantom sources formed by
the LC channel pair and the CR channel pair. If the L, R, and C channels all have
the same signal level, the white tic mark on the bar will appear directly above the
C level indicator. The white tic mark will move right or left depending on the
relative balance between the three channels. A short bar to the left of the white
tic mark indicates a positive correlation between L and C. The bar will grow as
the correlation decreases. Like the L--R PSI, the bar will continue to grow at a
45 _ angle for negative signal correlations. The bar to the right of the white tic
mark behaves in the same way, depending on the C--R correlation. This PSI
indicator uses the same color coding as the other PSI indicators.
WFM700 Series Waveform Monitors User Manual
3- 11
Test Equipment Depot - 800.517.8431 - 99 Washington Street Melrose, MA 02176 - FAX 781.665.0780 - TestEquipmentDepot.com
Reference
Figure 3--5 shows examples of how the Surround Sound waveform appears for
some typical signal types.
Uncorrelated signals; same level in
the L, R, Ls, and Rs channels.
Sine wave test tone; same level in
the L, R, Ls, and Rs channels.
All signals are in phase, creating
phantom sources between the
adjacent channels.
Sine wave test tone; same level in
the L, R, Ls, and Rs channels.
Channels R, Ls, and Rs are in
phase, creating phantom sources
between the adjacent channels.
Channel L is out of phase.
Surround sound program with strong
center channel presence.
Surround sound program with weak
center channel presence.
Monaural signal in channels Ls and
Rs, creating a phantom source in the
center, as in a 3-- 1 surround sound
system.
Figure 3- 5: Typical waveforms on the Surround Sound display
3- 12
WFM700 Series Waveform Monitors User Manual
Reference
Channel Status Display
Embedded Audio Status
Display
The Channel Status display shows the channel status information, for one
channel pair at a time, that is embedded in the AES3--1992 (professional) or
IEC--60958-3 (consumer) digital audio channels. You can select from the
following four display formats: Text, Binary, XMSN Order Binary, or Hex.
This display reports the following information:
H
Which video input is the source of the embedded audio
H
The standard used by the embedded audio signal
H
Which audio groups are selected (use the Embedded Input Map to change)
H
The embedded group sample phase (HD signals only)
NOTE. For HD signals, the Embedded Group Sample Phase readout indicates
the misalignment, in microseconds and samples, between the audio samples of
the two selected embedded audio groups. The readout turns red when the
misalignment exceeds about 0.625 audio samples. The readout displays N/A if
one or both of the selected audio groups is missing, or if the video signal is SD.
H
Whether the header indicates that audio is present on each pair of channels
(Status = Present or Not Present).
WFM700 Series Waveform Monitors User Manual
3- 13
Reference
Bowtie Mode
The Bowtie display evaluates the relative amplitude and timing between the
three video channels. To access the Bowtie mode, press the MEASURE button,
touch the Measure Menu soft key, and then touch the Bowtie soft key.
The Bowtie display requires a special test signal to be sent from the monitored
source. The Tektronix TG2000 Signal Generation Platform can produce a Bowtie
test signal with 20 ns time marks, which aid in signal evaluation. The signal is a
500 kHz sinewave on CH 1 (luminance) and 502 kHz sine waves on CH 2 (Pb)
and CH 3 (Pr).
Measurements
The Bowtie display is made up of two separate waveforms. The left waveform
always compares CH 1 to CH 2. The right waveform always compares CH 1 to
CH 3.
Timing Measurement. The timing measurement is based on the alignment of the
center marker and the null point at the center of the waveform. The generator
provides a center marker, which is centered on the null point when interchannel
timing is correct. In Figure 3--6, the chrominance channel, CH 3 (Pr), is
advanced relative to the luminance channel by 20 ns.
Relative Gain Check. The relative gain check is based on the null point at the
center of the Bowtie waveforms. If the gains are not equal, the center null point
will not be a complete null. If the gain error is in CH 1, neither waveform has a
complete null. If CH 2 gain is off, the left waveform will not null completely, but
the right one will. If the gain is off for CH 3, as in Figure 3--6, the left waveform
will be normal and the right one will not reach a complete null.
Shifted null point
Incomplete null
Waveform showing gain error in CH 3
Waveform showing timing error in CH 3
(20 ns advanced)
Figure 3- 6: Bowtie waveforms showing timing and relative gain errors
3- 14
WFM700 Series Waveform Monitors User Manual
Reference
Composite Display
The instrument provides a composite representation of both SD and HD
component signals. To access the composite display, set the color space to
composite in Waveform mode or select Composite Graticule in Vector mode.
Data Display (WFM700M Only)
The Data Display mode shows the actual SD or HD input data without any
interpolation.
Data Display Colors
and Units
Different fields of the data stream are shown in different colors, as shown in
Table 3--2. Use the Readout Format soft key to view the data in Hex, Decimal, or
Binary units.
Table 3- 2: Data display colors
Video / Data Selection
Color
Use
Green
Active video data
Gray
Data in horizontal or vertical blanking intervals
White
EAV and SAV packets; other reserved values such as the XYZ word
Yellow
Data outside the nominal allowed values
Red
Data with illegal values
The instrument provides two modes for representing signal data: Video and Data.
Video Mode. Shows the data like the video YPbPr display in waveform mode, but
without interpolation. The Y, Cb, and Cr traces are offset vertically to separate
them, but are aligned temporally. Since Cb and Cr have half the data rate of Y,
the samples appear twice as long. Use the Select Channels soft key to turn off
individual components of the display.
Data Mode (SD). Shows the data in the same sequence as it occurs in the serial
domain. You see a sample of Y, then of Cb, then of Y’ (Y prime), and then of Cr.
Then the sequence repeats. The Y sample is the co-sited sample, and the Y’
sample is the isolated luma sample.
Data Mode (HD). Splits the serial data into a Y channel and a multiplexed Cb/Cr
channel. The intent is to show the data in the same orientation as it occurs in the
serial domain, even though it is displayed as 8 or 10 bit values.
WFM700 Series Waveform Monitors User Manual
3- 15
Reference
Diagnostics
The waveform monitor provides diagnostics capabilities, which are accessed
through the System submenu of the Configure menu. You can view or print the
Diagnostics Log, which contains the results of the last diagnostic test that the
instrument performed. You can also download the Diagnostic Log using the
Remote Web Interface.
Powerup Diagnostics
Setting
At power up, the instrument runs either full or brief diagnostics, depending on
the setting in the System submenu of the Configure menu.
Running Diagnostics
You should run diagnostics after installing a new module, upgrading the
instrument firmware, or when troubleshooting suspected instrument problems.
Warning messages are displayed in yellow text; PASS and FAIL messages are
labeled PASS (green text) or FAIL (red text). You have the following diagnostic
choices:
Run Full Powerup Diagnostics. The instrument goes through all of the diagnostics
and displays the results.
Run Internal Digital Path Diagnostics. The instrument checks the main digital
paths within the instrument and displays the results of the various tests. If there
is only one video module installed, expect some yellow warnings. After running
this diagnostic, you must reboot the instrument to return to normal operation.
Run Audio Path Diagnostics (WFM7DG Only). The instrument checks the audio
paths within the instrument from the optional WFM7DG audio module and
displays the results of the various tests. After running this diagnostic, you must
reboot the instrument to return to normal operation.
3- 16
WFM700 Series Waveform Monitors User Manual
Reference
Eye / Jitter Mode (WFM700M Only)
Press the EYE button to access the Eye / Jitter menu and measurements.
Making Eye
Measurements
The Eye pattern display presents a voltage-versus-time waveform composed of
multiple sweeps of the SD or HD serial bit stream.
You can set the sampled eye pattern to display either a full word of correlated
data (10 Eye display in SD; 20 Eye display in HD) or a three-data-bit overlay
showing jitter uncorrelated to the parallel word (3 Eye display). In the word-correlated mode, the sweep is also synchronized to the video, so that you can see
any shift in the data stream timing correlated to horizontal or vertical video
information. This mode is most useful for detecting jitter patterns or modulation
related to parallel-to-serial conversions.
Jitter is seen in the eye diagram as a horizontal thickening of the trace. As jitter
increases, the opening in the eye shrinks until the receiver can no longer reliably
decode the serial stream.
The usefulness of the eye measurement decreases with long cable lengths. Even a
short cable will slow the rise time and make evaluation of a source difficult.
Slightly longer cables will make one eye run into the next. This is called
intersymbol interference. It makes the eye appear to have multiple levels and
closes the eye opening vertically long before the receiver fails to decode the
signal. The only information the eye measurement gives on longer cables is
some idea of the cable length.
Different clock recovery bandwidths can be selected to help isolate the frequency
of any jitter that is observed. When a bandwidth setting is chosen, only jitter at
frequencies above that bandwidth are observed.
You can turn on or off a readout that displays automatic measurements and a
histogram of the eye waveform. Refer to Automatic Eye Measurements on
page 3--18 for more information.
Setup for Eye Measurements. Perform the following steps to prepare the
instrument for Eye measurements:
1. Connect a 100% Color Bar, serial video-signal to the instrument using a
75 Ω cable of two meters or less in length. Use high quality, low loss coaxial
cable, such as Belden 8281.
2. Press the GAIN button and select 1x vertical gain.
3. Press the EYE button to select the Eye Pattern display.
WFM700 Series Waveform Monitors User Manual
3- 17
Reference
Automatic Eye Measurements. When the Eye display is selected, you can use the
Eye Meas. soft key to turn on or off a readout that displays automatic measurements of the eye waveform (see Figure 3--7). The measurement readouts are
colored red when the eye waveform exceeds the defined thresholds.
Use the Set Default Thresholds soft key to set the eye measurement thresholds to
the levels defined by the associated standard (SD signals: SMPTE 259M;
HD signals: SMPTE 292M). Use the Set Meas Thresholds soft key to set custom
threshold levels.
NOTE. The automatic eye measurements are based on the eye waveform display.
To ensure the best eye measurement conditions, the instrument sets the clock
recovery bandwidth set to 1kHz. While the automatic eye measurements are
running, the instrument prevents you from adjusting the recovery bandwidth
setting or from adjusting the following signal controls: vertical and horizontal
position, sweep and gain settings, and Line Select mode.
Reporting Automatic Eye Measurement Errors. When enabled in the Physical
Alarms submenu of the Configure menu, the eye measurement alarms will be
reported to the Event Log in only the following two conditions:
H
When the Eye display is selected and the eye measurement readout is
turned on
H
When the Event Log or Alarm Status displays are selected after the eye
measurement readout is turned on
That is, if you enter the Eye display and turn on the eye measurements, and then
you use the STATUS button to view the Event Log or Alarm Status displays, the
eye measurement alarms will be active. If you select another display mode such
as Jitter or Waveform, the eye measurement alarms will be disabled.
3- 18
WFM700 Series Waveform Monitors User Manual
Reference
Eye measurement readouts
Rise overshoot
peak indicator
Upper signal
level indicator
Waveform histogram
80% signal rise
level indicator
Waveform shape indicator
(20-- 80% signal level)
80% signal fall
level indicator
Lower signal
level indicator
Fall overshoot
peak indicator
Figure 3- 7: Eye display showing the automatic measurements
Measurement Accuracy Using the Measurement Cursors. If you use the measurement cursors to measure the eye waveform, you may measure a different result
than that shown in the automatic eye measurements readout. This is because the
internal peak detector can measure waveform excursions better than people can
when using their eye to position the cursors.
WFM700 Series Waveform Monitors User Manual
3- 19
Reference
Manually Measuring Amplitude. The following procedure shows you how to
manually measure the signal amplitude using both the graticule and the Voltage
Cursors.
1. Perform the initial settings for Eye measurements described in Setup for Eye
Measurements above.
2. Use the CLOCK BW soft key to select the 1 kHz filter. This setting reduces
the effects of timing jitter, which can obscure the amplitude measurement.
3. To measure amplitude, use the graticule (1x gain) or use the voltage cursors.
Ignore any overshoot or undershoot on the rising or falling edges.
NOTE. For Cursor measurements, you can use any gain setting, including
variable gain, since the waveform and the cursors are equally affected by the
gain setting. Higher gain settings help match the cursor to the waveform.
Signal sources should measure 800 mVp-p ᐔ10%. Signal amplitudes outside of
this range can degrade receiver performance.
Manually Measuring Aberrations. Serial sources should produce good signal
transitions with a minimum of overshoot and ringing. To manually measure
aberrations, perform the following steps:
1. Perform the steps in Setup for Eye Measurements on page 3--17.
2. Position one voltage cursor at the peak of the overshoot at the top horizontal
part of the waveform.
3. Position the second voltage cursor at the bottom of the top line of the
waveform. Include any ringing (the oscillation following overshoot) in the
measurement. Essentially, you are measuring the thickness of the top line of
the waveform.
4. The Voltage Cursor readout provides the signal amplitude.
5. Perform the same voltage-cursor measurement on the bottom line thickness,
including any undershoot and ringing.
NOTE. Aberrations at the top or bottom line of the waveform should not exceed
10% of the signal amplitude since automatic equalizer circuits in receivers may
be sensitive to larger aberrations.
3- 20
WFM700 Series Waveform Monitors User Manual
Reference
Manually Measuring Rise Time. Rise time measurements of the eye waveform
check the performance of sources and signal degradation by cabling. The
following procedure provides two methods for manually measuring rise time.
The first method uses variable gain to normalize the signal and the second
method uses the percentage voltage cursors.
1. Perform the steps in Setup for Eye Measurements on page 3--17.
2. Method 1 -- Use variable gain to measure rise time.
a. Use Variable Gain to resize the waveform to 10 major divisions. Position
the top and bottom of the waveform on graticule lines.
b. Position the first timing cursor at the crossing of the rising edge of the
Eye waveform and the graticule line two divisions above the bottom of
the waveform as shown in Figure 3--8.
NOTE. You can use the horizontal MAG control in the Sweep menu for greater
accuracy when adjusting the time cursors.
c. Position the second time cursor at the crossing of the rising edge of the
Eye waveform and the graticule line two divisions below the top of the
waveform as shown in Figure 3--8.
d. The Delta time readout indicates the 20 -- 80% rise time measurement.
Figure 3- 8: Timing Cursors alignment for measuring 20- 80% rise time
WFM700 Series Waveform Monitors User Manual
3- 21
Test Equipment Depot - 800.517.8431 - 99 Washington Street Melrose, MA 02176 - FAX 781.665.0780 - TestEquipmentDepot.com
Reference
3. Method 2 -- Use the percentage voltage cursors to measure rise time:
a. Turn on the voltage cursors and set the voltage cursor units to %.
b. Position the first voltage cursor to the top of the signal, and then position
the second voltage cursor to the bottom of the signal.
c. Touch the Set 100% soft key.
d. Position the first voltage cursor to where the readout lists 80%, and then
position the second voltage cursor to where the readout lists 20%.
e. Position the first timing cursor at the crossing of the rising edge of the
Eye waveform and the 20% voltage cursor.
NOTE. You can use the horizontal MAG control in the Sweep menu for greater
accuracy when adjusting the time cursors.
f.
Position the second timing cursor at the crossing of the rising edge of the
Eye waveform and the 80% voltage cursor.
g. The Delta time readout indicates the 20 -- 80% rise time measurement.
3- 22
WFM700 Series Waveform Monitors User Manual
Reference
Making Jitter
Measurements
The Jitter display mode plots jitter versus time as a trace and measures peak-topeak time jitter on the active input signal. The Jitter mode converts any phase
modulation to amplitude and plots it against time.
Timing jitter is the deviation of signal transitions compared to those of a
reference clock. Jitter results in Eye closure along the time axis, narrowing the
window in which the data values can be accurately determined.
Jitter is characterized by both its magnitude and frequency. Signal transitions
deviate from their ideal position by a peak amount and at one or more frequencies, depending on the sources. Typically, only high frequency jitter affects data
recovery. But low frequency jitter can affect time-critical operations such as
signal multiplexing and D/A conversion.
Jitter Demodulation. The Jitter measurement uses a demodulator method to
determine signal jitter. The serial clock is recovered from the input signal and
demodulated against a very stable oscillator, which translates any phase
modulation (jitter) into a DC value. This DC value represents the phase
difference between the input signal and the reference oscillator.
The resulting DC values plotted against time are proportional to jitter in the
serial signal. This jitter waveform is passed through a high-pass filter and
applied to a peak detector. The peak detector measurement is presented in the
jitter measurement box. The demodulator can detect jitter up to 5 MHz.
Observing Word Correlated Behavior. The Eye Pattern display allows you to
analyze word correlated jitter in video signals. Use the 10-Eye mode to analyze
SD format signals and use the 20-Eye mode to analyze HD format signals.
When video is serialized, a 270 MHz serial clock is derived from the 27 MHz
rate parallel word clock. Often there is slight phase modulation of the serial
clock between the transitions of the parallel clock producing jitter at data-bit
transitions. This jitter is not random; it is correlated to the parallel word rate.
Also, the video pattern applied to the serializer changes at a 27 MHz rate or at an
integer fraction of this rate. Any video pattern related effects in the serial system
typically appear at fixed data-bit locations with respect to the parallel word.
In the 10-Eye or 20-Eye display modes, the trigger is on the parallel word
boundaries, with 10 or 20 Eyes shown per sweep. Parallel word and TV-line
correlated behavior can be seen in these modes. If a serial system has a disturbance that appears related to video patterns, either word or TV-line, use the
10-Eye (SD) or 20-Eye (HD) display mode to analyze the problem. Use the Line
Select function to place the area of interest in the Eye pattern display.
WFM700 Series Waveform Monitors User Manual
3- 23
Reference
Using Line Select. When Line Select is off, the jitter measurement reflects the
maximum amount of jitter in the full field. When Line Select is on and Line
sweep is selected, the jitter measurement displays “line n jitter,” with n being the
selected line number. The jitter measured on an individual line will always be
equal to or less than the full field jitter measurement.
Bandwidth Filters. The waveform monitor provides four bandwidth filters: 10 Hz,
1 kHz, 10 kHz, and 100 kHz. These filters only show jitter terms above the
selected filter frequency.
When you select a filter, depending on the active input signal, you select the
jitter measurement type (Timing, Alignment, or neither, as defined by the
SMPTE standard). Use the lowest settings to measure timing jitter and the higher
settings to measure alignment jitter. The type of jitter measurement is displayed
in the Measured Jitter box.
To measure timing jitter, select the 10 Hz filter for both SD and HD video
signals. To measure alignment jitter, select the 1 kHz filter for SD video signals
and the 100 kHz filter for HD video signals.
NOTE. Many jitter problems in systems have resulted from genlocking clocks to
other references, such as the horizontal synchronization pulse. Reference jitter
transferred by genlocks into a serial system is typically between 20 and several
hundred Hertz. Also, the phase detection process used by the genlock can add
noise, which results in jitter in the 10 Hz to 1 kHz range. Use the appropriate
BW Limit filter selection to include or reject genlock jitter from a measurement.
3- 24
WFM700 Series Waveform Monitors User Manual
Reference
Reporting Jitter Measurement Errors. When enabled in the Physical Alarms
submenu of the Configure menu, the Jitter alarm will be reported to the Event
Log in only the following two conditions:
H
When the Jitter display is selected
H
When the Event Log or Alarm Status displays are selected after the Jitter
display is selected
That is, if you enter the Jitter display and then use the STATUS button to view
the Event Log or Alarm Status displays, the jitter measurement alarm will be
active. If you select another display mode such as Eye or Waveform, the jitter
measurement alarm will be disabled.
Use the Set Default Thresholds soft key to set the thresholds back to the default
values for the type of signal you are monitoring: SD (SMPTE 259M) or
HD (SMPTE 292M). The default value for the jitter measurement 0.2 UI, which
is the maximum alignment jitter specification for both SD and HD signals and is
the maximum timing jitter specification for SD signals (see Table 3--3).
Since the maximum timing jitter specification for HD signals is 1.0 UI, you must
set the high-pass filter to 10 Hz and manually set the jitter threshold to 1.0 UI
before the instrument will properly generate an alarm if the HD signal exceeds
the SMPTE 292M timing jitter specification.
Use the Set Meas. Thresholds soft key to set a custom threshold level.
Table 3- 3: Jitter measurement alarm thresholds
Signal type
High pass filter setting
Alarm threshold
SD (SMPTE 259M)
10 Hz (timing jitter)
0.2 UI (740 ps)
1 kHz (alignment jitter)
0.2 UI (740 ps)
10 Hz (timing jitter)
1.0 UI (673 ps)
100 kHz (alignment jitter)
0.2 UI (134 ps)
HD (SMPTE 292M)
WFM700 Series Waveform Monitors User Manual
3- 25
Reference
Measurement Accuracy Using the Measurement Cursors. If you use the measurement cursors to measure jitter, you may measure a different result than that
shown in the jitter measurement box for the following reasons:
H
The internal peak detector does a better job of measuring jitter excursions
than a human can when using their naked eye to position the cursors
H
The noise floor is removed from the jitter measurement readout but not from
the cursor delta readout
Manually Measuring Timing Jitter. Perform the following steps to manually
measure the timing jitter:
1. Perform the steps in Setup for Eye Measurements on page 3--17.
2. Select the 3 EYE mode, which shows peak jitter at each eye crossing.
3. Select the 10 Hz bandwidth filter to measure the total broadband jitter (use
this setting if composite D/A conversion is planned).
4. Position the timing cursors to measure the width of the Eye zero-crossing
point (see Figure 3--9). If necessary, use the Gain and Sweep menus for
better vertical and horizontal resolution.
5. Check that delta between the two timing cursors is less than the following
over one horizontal line:
H
SD signals: 740 ps (0.2 unit intervals per SMPTE259M)
H
HD signals: 673 ps (1.0 unit interval per SMPTE292M)
Figure 3- 9: Timing Cursors alignment for measuring timing jitter
3- 26
WFM700 Series Waveform Monitors User Manual
Reference
Gamut Measurements
NOTE. Gamut error detection is disabled in Eye and Jitter display modes.
The waveform monitor features three types of gamut displays:
H
The Diamond display shows the relationship between the R, G, and B video
signals. The waveform monitor converts the Y, Pb, and Pr components of the
signal into R, G, and B to form the Diamond display.
H
The Split Diamond display separates the upper and lower diamonds to show
excursions below black; otherwise it is identical to the Diamond display.
H
The Arrowhead display checks that signals conform to legal composite
gamut space.
NOTE. Refer to the reference document A Guide to Standard and High-Definition
Digital Video Measurements at the Tektronix, Inc. Web site (www.tektronix.com)
for information about how the Diamond and Arrowhead displays are created
and for information about defining legal and valid gamut signals.
Checking RGB Gamut
Use the Diamond or Split Diamond displays to check RGB gamut. For a signal
to be in gamut, all signal vectors must lie within the G-B and G-R diamonds.
The direction of an excursion out of gamut indicates which signal is excessive.
Errors in green amplitude affect both diamonds equally, while blue amplitude
errors affect only the top diamond and red errors affect only the bottom diamond.
Use the Split Diamond display to see excursions below black in either of the
G--B or G--R spaces.
The intensity of a vector indicates its duration. A momentary out-of-gamut
condition appears as a faint trace. Long duration violations show as a bright
trace. Figure 3--10 shows out-of-gamut signals on the Diamond display.
Monochrome signals appear as vertical lines. Nonlinear component processing,
such as from a gamma corrector that alters white balance, can cause deviations
along the vertical axis.
Bending of the transitions indicates timing delays. When a color bar signal is
applied, the vertical axis becomes an indicator of delay errors. The Diamond and
Split Diamond displays allow you to visualize interchannel timing errors. Use
the Lightning display in Vector mode to quantify the amount of timing error.
The Diamond and Split Diamond graticules have marks to indicate conformance
using 75% color bars. The edge of the diamond is used for 100% color bars.
WFM700 Series Waveform Monitors User Manual
3- 27
Reference
Example A:
Example B:
Example C:
R - Ok
G > 700 mV
B - Ok
R - Ok
G - Ok
B > 700 mV
R - Ok
G - Ok, 350 mV
B < 0 mV
Figure 3- 10: Out-of-gamut signals on a Diamond display
Checking Composite
Gamut
The Arrowhead display shows out of gamut conditions in composite color-space,
without requiring a composite decoder. The display plots luminance on the
vertical axis, with blanking at the lower left corner of the arrow. The magnitude
of the chroma subcarrier at every luminance level is plotted on the horizontal
axis, with zero subcarrier at the left edge of the arrow. The upper sloping line
forms a graticule indicating 100% color bar total luma + subcarrier amplitudes.
The lower sloping graticule indicates a luma--subcarrier extending towards sync
tip (maximum transmitter power).
Arrowhead Graticules. The electronic graticule provides a reliable reference to
measure what luminance plus color subcarrier will be when the signal is later
encoded into NTSC or PAL.
On the NTSC Arrowhead graticule (see Figure 3--11), the 120 IRE line represents the level at which a transmitter starts clipping the signal. The --40 IRE line
represents the sync tip level, while the 7.5 IRE line represents the setup level.
On the PAL Arrowhead graticule (see Figure 3--12), the 950 mV line represents
the level at which a transmitter starts clipping the signal. The 930 mV line
represents the upper limit of chrominance excursion, and the --230 mV line is the
lower limit of chrominance excursion. The --300 mV line represents the sync tip
level.
Signals exceeding the luminance amplitude gamut extend above the top
horizontal limit (top electronic graticule line). Signals exceeding the luminance
plus or minus peak chrominance amplitude gamut extend beyond the upper and
lower diagonal limits. The bottom horizontal line shows the minimum allowed
luminance level.
3- 28
WFM700 Series Waveform Monitors User Manual
Reference
100 IRE 110 IRE 120 IRE
131 IRE
High Luma limit
100 %
High Composite limit
Luma
amplitude
7.5 %
Low Composite limit
0%
Chroma
amplitude
Low Luma limit
- 24 IRE - 33 IRE - 40 IRE
Figure 3- 11: NTSC Arrowhead graticule
700 mV
950 mV
High Luma limit
100 %
930 mV
High Composite limit
Luma
amplitude
Low Composite limit
0%
Chroma
amplitude
- 230 mV
- 300 mV
Low Luma limit
Figure 3- 12: PAL Arrowhead graticule
WFM700 Series Waveform Monitors User Manual
3- 29
Reference
Setting Gamut Alarm
Limits
Listed below are general guidelines for setting gamut alarm limits for the
Diamond and Arrowhead displays.
Default Thresholds. Use the Grat / Gamut Default Setup submenu of the
Configure menu to select the standard used for default gamut thresholds: Tek or
IBU-R103. The Tek thresholds are the default gamut thresholds historically used
by video monitoring equipment made by Tektronix, Inc. and are not intended to
conform to an officially accepted video standard.
NOTE. When you select the Tektronix default limits, the RGB, Luma, and Y+C
gamut thresholds are reset to the default values defined by Tektronix. When you
select the EBU-R103 default limits, only the RGB and Luma gamut thresholds
are reset since the Y+C gamut limits are not defined by the EBU-R103 standard.
When you touch the Default soft key in any of the Gamut Limit menus, all of the
gamut limit thresholds are reset to the standard indicated on the soft key.
Diamond Display Gamut Limits. Use the Gamut menu to set the upper and lower
RGB thresholds for a 5 mV tolerance ( +705 mV and --5 mV). This will cover
the tolerance of any signal generator that provides color bars. This tolerance is
close enough to the nominal values of 700 mV and 0 mV to be undetectable by
the human eye.
Set the Horizontal/Horiz+Vert soft key setting to Horiz+Vert. This setting will
trigger on gamut errors that form a block covering several video lines, and thus
are more visible to the human eye.
Arrowhead Display Gamut Limits. Use the Limit Format soft key to set the
instrument for NTSC or PAL gamut measurements. For North American
applications of NTSC video signals, set the Setup control to 7.5%. In addition,
set the upper Y+C Composite threshold to 120 IRE because that is the level at
which a TV transmitter starts to clip the signal. Set the lower Y+C Composite
threshold to --24 IRE because that is the lower limit of chrominance excursions.
For the majority of PAL video signal applications, set the Setup control to 0%.
Set the upper Y+C Composite threshold to 935 mV and the lower Y+C
Composite threshold to --235 mV because those are the limits of chrominance
excursion.
For both NTSC and PAL signals, set the Horizontal/Horiz+Vert soft key setting
to Horiz+Vert. This setting will trigger on gamut errors that form a block
covering several video lines, and thus are more visible to the human eye.
Set the upper and lower luminance thresholds for a 3% tolerance (103% and
--3%) to monitor excessive luminance excursions.
3- 30
WFM700 Series Waveform Monitors User Manual
Reference
Filtering. Two filters allow you to accept overshoot that would otherwise be
reported as a gamut error. Overshoot occurs due to the unequal rise time of the
chroma and luma inherent in the YPbPr signal.
Use the Horizontal filter setting to monitor for out-of-gamut errors within a
single horizontal line using a low-pass filter (SD: < 1 MHz, HD: < 1.2 MHz).
Use the Horizontal + Vertical filter setting to monitor for out-of-gamut errors on
three consecutive horizontal lines, with a weighting of 25% for the first and third
lines and 50% for the second line. Use this setting to accept horizontal artifacts,
making the detection symmetrical in the picture domain.
Area Masking. This feature lets you set the percentage of the total image pixels
(up to 10%) that can be outside the current gamut limits, yet not be reported as a
gamut error. The Area setting does not affect bright-up in the Picture display.
Line Select Mode
Use Line Select mode to select one line of the video signal to display and
measure. Line Select stays active as you change between major modes. This
enables you to select a line in Picture mode, and then go to other modes to view
the same line.
The selected line is highlighted in Picture mode and in the thumbnail picture.
The external picture monitor signals also contain a bright-up if enabled in the
Video Inputs/Outputs submenu of the Configure menu.
NOTE. Line Select mode is automatically disabled when Field sweep is selected.
Line Select mode is always enabled in Data mode.
Field Selection
Sample Selection
The Field and Next Field soft keys select the field from which the selected
line/sample is taken. Select All Fields to display the same line number from all
fields in a frame. The 1 of 2 selection lets you choose a line from only one field
in a frame. Touch the Next Field soft key repeatedly to cycle through the fields
in a frame.
Sample Select determines what portion of the video line is viewed in Data
Display mode (WFM700M only). Sample Select is also active in Picture and
thumbnail modes to allow correlation of events between modes.
WFM700 Series Waveform Monitors User Manual
3- 31
Test Equipment Depot - 800.517.8431 - 99 Washington Street Melrose, MA 02176 - FAX 781.665.0780 - TestEquipmentDepot.com
Reference
Logging
The instrument contains two different log files: diagnostics and events. You can
use the Remote Web Server interface to download the contents of either log file.
Diagnostics Log
Event Log
This log contains the results of the last diagnostic test that was performed.
The instrument maintains an event log in which every entry is time-stamped with
the time-of-day when the instrument logged the event. When you enable
Timecode in the Video Inputs/Outputs submenu of the Configure menu, events
are time-stamped with the timecode embedded in the video signal.
CAUTION. The time-of-day time stamps in the Event Log are based on the system
time of the instrument when the logging process starts. If you update the system
time of the instrument while the Event Log is in the Running mode, the time
stamps will not start using the new system time setting. You must stop and restart
the Event Log before the time stamps will use the new system time.
Controlling the Size of the Event Log. The event log can contain up to 10,000
entries. Recording each individual event separately would quickly fill the log.
To handle this problem, the instrument classifies log entries as one of the
following:
H
Single shot. One isolated occurrence is logged as one entry.
H
Continuous. Uninterrupted sequence of occurrences is logged as two entries
marking the beginning and end of the sequence.
H
Intermittent. Interrupted sequence of closely spaced occurrences can be
logged as separate entries or as one entry. Use the Printing/Event Log
submenu of the Configure menu to set the event log storage mode:
H
Log for Duration. Logs intermittent events as one event to save space in
the event log.
H
Log for Resolution. Logs intermittent events separately, which preserves
time stamp information for each event, but quickly fills up the event log.
By default, most of the possible alarms are enabled for logging. Use the
Configure Alarms submenu of the Configure menu to limit the number of
monitored error conditions.
3- 32
WFM700 Series Waveform Monitors User Manual
Reference
Configuring the Event Log Full Condition. Use the Printing/Event Log submenu of
the Configure menu to configure the instrument to either stop logging events or
to overwrite events when the event log has filled up to the 10,000 entry level.
Viewing and Printing the Event Log. You can view the Event Log using the Status
menu or using the Remote Web Interface. In the Status menu, use the Configure
View Filter soft key to show only the events you want to view.
NOTE. The Log Filter menu settings only affect how you view the log entries
using the Status display. These settings do not affect the actual contents of the
Event Log, nor do they affect the Event Log display when you use the Remote
Web Interface to view the Event Log.
The contents of the Event Log cannot be recovered after the log has been erased.
The Event Log uses icons to indicate the type and duration of detected signal
conditions. Table 3--4 shows the icons you may encounter as they appear
on-screen and in the Event Log file downloaded using the Remote Web Interface.
Table 3- 4: Event Log error status icons
On-screen icon
WFM700 Series Waveform Monitors User Manual
Remote Web
Interface symbols
Description
XXXX
Identifies a persistent (more than one video field)
alarm condition that was present when logging
started. The on-screen icon is red.
_/XX
Identifies an alarm condition that persisted for
more than one video field. The on-screen icon is
red.
_/\_
Identifies a momentary (pulse) alarm condition that
persisted for less than or equal to one video field.
The on-screen icon is red.
X\__
Identifies an alarm condition that cleared for more
than one video field. The on-screen icon is green.
X\/X
Identifies an alarm condition that cleared for less
than or equal to one video field. The on-screen
icon is red.
/\/\
Identifies an intermittent alarm condition (one field
on, one field off). The on-screen icon is red.
3- 33
Reference
Measure Mode (WFM700M Only)
Press the MEASURE button to access the Data Display. The Data Display mode
shows the actual SD or HD input data without any interpolation. Refer to Data
Display (WFM700M Only) on page 3--15 for more information.
From the Measure submenu of the Data Display menu, you can access the
following three display modes:
H
Bowtie. Use this display to evaluate the relative amplitude and timing
between the three video channels. Refer to Bowtie Mode on page 3--14 for
more information.
H
Ancillary Data. Use this display to view the raw (undecoded) data words in
the selected ancillary data packets. Refer to Ancillary Data Display on
page 3--4 for more information.
H
ARIB STD-B39. Use this display to view the decoded data for video signals
using ancillary data compliant with ARIB STD-B39. Refer to ARIB
STD-B39 Display on page 3--6 for more information.
Multi Mode
Press the MULTI button to enable the Multi mode display, which shows two
different views of the same input signal side-by-side. You must use the Input
menu to select a different input signal for display.
The front-panel controls affect only the display mode in the currently selected
Multi-mode window. Menu changes you make while the instrument is in Multi
mode remain in effect when you exit Multi mode.
Multi mode horizontally compresses displays so that they will fit side-by-side.
When the Status display is selected as one of the Multi mode displays, there may
be some overwriting of the label text in the Status display. The measurement text
is not affected by the display compression. In addition, the audio-presence
indicators for groups 3&4 may not appear on the Status display in Multi mode.
Option DG Audio Module Only: When Level Meters + Lissajous or Surround
Sound is the selected Audio-mode display, the Lissajous or Surround Sound
display will appear when you select Audio as one of the Multi mode displays.
You must select Level Meters as the Audio-mode display to view the audio level
meters in Multi mode.
Detection of analog (line 21) closed caption does not operate if the instrument is
in Data mode or in Multi mode when the Data display is selected.
3- 34
WFM700 Series Waveform Monitors User Manual
Reference
Picture Mode
Press the PICTURE button to display a full screen representation of the video
signal present at the selected input.
NOTE. Due to the number of pixels in the LCD display of the waveform monitor,
not all of the video content (particularly in HD formats) can be reproduced with
100% accuracy by this display module. The picture display offers a means of
visually identifying the content present at the active input and is not designed to
replace the rear-panel PIX MON outputs, which contain all of the video content.
Press the PICTURE button again to display the Picture menu. Use the Safe Area
soft key to display the Safe Action and Safe Title graticules, which comply with
SMPTE RP218. The safe area graticules do not appear in the thumbnail picture.
Since the full-size SD picture display is cropped, use the SD Picture Half Size
setting to view the complete picture when you are monitoring SD signals.
Use the Grat/Gamut Default Setup submenu of the Configuration menu to enable
the display of decoded closed captioning text in Picture mode.
Use the Video Inputs/Outputs submenu of the Configure menu to enable or
disable bright-ups, or contrast patterns, to show areas that are out of gamut, or to
show the selected line or sample.
Use the Display menu to enable a thumbnail picture that appears in other display
modes.
WFM700 Series Waveform Monitors User Manual
3- 35
Reference
Printing
NOTE. The instrument formats print output in Postscript color, or Postscript
black and white formats. The selected printer must support LPD protocol.
Use the Printing/Event Log submenu of the Configure menu to configure the
instrument to print the following items to a printer on your local network:
H
Instrument display. To print the current instrument display (waveforms and
text), press the Print button.
NOTE. When printing the Eye pattern display, set the trace intensity to a value
greater than 20 for good contrast between the trace and the background.
3- 36
H
Event Log file. To print the Event Log file, press the Print button when you
are viewing the Event Log in the Status display. The complete Event Log file
will be printed.
H
Diagnostics Log file. To print the Diagnostic Log file, use the System
submenu of the Configure menu.
WFM700 Series Waveform Monitors User Manual
Reference
Status Displays
Press the STATUS button and then touch the Display soft key to select from the
following status displays:
Status Display Colors
Video Status and Session
Display
H
Session. Use this selection to view the Video Status/Session, Audio
Status/Session, or Auxiliary Data Status displays.
H
Alarm Status. Use this selection to view the status of the General, Serial,
Audio (Option DG only), Auxiliary Data, or Physical (WFM700M only)
alarms.
H
Event Log. Use this selection to enable, disable, configure, and view the
event log.
Messages and values in the different status displays use the following colors to
help indicate signal status:
H
White. Identifies items that represent changes in the instrument state.
H
Green. Indicates error conditions that have cleared.
H
Yellow. Indicates a warning condition that might require attention but does
not meet the requirements of an error condition.
H
Red. Indicates signal information that has been found to be in an ongoing
error state.
The Video Status portion of the display (left side) shows the current status of the
video signal being monitored. The Video Session portion of the display (right
side) shows the cumulative results of the current video monitoring session. Use
the Session Stopped/Running soft key to start or stop the monitoring session.
Use the Reset Session soft key to clear the display.
Refer to the WFM700 Series Technical Reference document on the CD-ROM for
descriptions of the status display elements.
NOTE. The Session: Stopped/Running and the Reset Session soft keys affect both
the audio and video session displays. For example, if you stop/start or reset the
session when the currently displayed session is audio, the video session is also
stopped/started or reset.
WFM700 Series Waveform Monitors User Manual
3- 37
Reference
Audio Status and Session
Display (Option DG Only)
The Audio Status/Session display shows the current status of the audio signal
being monitored. Use the Session Stopped/Running soft key to start or stop the
monitoring session. Use the Reset Session soft key to clear the display.
Refer to the WFM700 Series Technical Reference document on the CD-ROM for
descriptions of the status display elements.
Auxiliary Data Status
Display
The Auxiliary Data Status display provides detailed information about the
auxiliary data embedded in the video signal.
Refer to the WFM700 Series Technical Reference document on the CD-ROM for
descriptions of the status display elements.
Event Log Display
3- 38
Refer to Logging on page 3--32 for information about using the Event Log.
WFM700 Series Waveform Monitors User Manual
Reference
Alarm Status Displays
The instrument provides the following five alarm status displays which
correspond to the categories of alarms provided in the Configure menu: general,
serial, audio (Option DG only), auxiliary data, and physical (WFM700M only).
An “X” appears in the Enabled column for each of the enabled alarms. The
Status column indicates the status of each alarm, whether or not that alarm
condition has been enabled. Table 3--5 lists the status indicators that may appear.
Table 3- 5: Alarm status indicators
Indicator
Description
OK
No alarm condition is detected.
Yes / No
Indicates whether or not a condition was detected.
Error
An alarm is detected and information about the error is displayed.
N/A
The alarm condition does not apply to the current configuration. For example, the RP165 EDH status alarm is set to
N/A when an HD signal is present because RP165 is only valid in SD signals.
Missing
An optional feature is not present in the input signal. For example, the RP165 EDH status alarm is set to Missing
when the input is SD but there are no RP165 packets present in the signal (EDH is an optional signal feature).
12345678
In the Audio Alarm Status display, this indicator may appear to show which audio channels have errors. For example,
- - 34-- - 78 would be displayed to indicate that channels 3, 4, 7, and 8 have errors.
This indicator is logical, after remapping, and not physical.
RGB and Composite Gamut Error Indicators. When RGB and/or Composite
Gamut errors are detected, the associated lines in the Alarm Status display have
characters that indicate which gamut threshold(s) are exceeded for each
component. Table 3--6 lists the error codes that may be displayed.
Table 3- 6: Alarm Status display error indicators
Indicator
Description
R
Signal exceeds the high gamut limit for the red component (RGB gamut)
r
Signal exceeds the low gamut limit for the red component (RGB gamut)
G
Signal exceeds the high gamut limit for the green component (RGB gamut)
g
Signal exceeds the low gamut limit for the green component (RGB gamut)
B
Signal exceeds the high gamut limit for the blue component (RGB gamut)
b
Signal exceeds the low gamut limit for the blue component (RGB gamut)
C
Signal exceeds the high gamut limit for the chroma component (composite gamut)
c
Signal exceeds the low gamut limit for the chroma component (composite gamut)
Y
Signal exceeds the high gamut limit for the luma component (composite gamut)
y
Signal exceeds the low gamut limit for the luma component (composite gamut)
WFM700 Series Waveform Monitors User Manual
3- 39
Reference
Vector Mode
Press the VECTOR button to enter the Vector mode, where you can select two
related displays: Vector and Lightning. Both displays have targets for determining conformance using 75% or 100% color bar signals.
NOTE. Refer to the reference document A Guide to Standard and High-Definition
Digital Video Measurements at the Tektronix, Inc. Web site (www.tektronix.com)
for information about how the Vector and Lightning displays are created.
Vector Display
The Vector display allows you to view the signal as a complex vector of color
components, with no luminance information included. The display is a traditional vector plot of the color difference signals Pb and Pr. The radial magnitude
represents saturation and the phase angle represents hue. With the Vector display,
you can check the encoder accuracy for both phase and amplitude errors.
Vector Graticules. You can use the Vector menu to select either a component or
composite vector graticule. When the component graticule is selected, you can
turn the compass rose graticule and the I/Q axis on or off using the Grat / Gamut
Default Setup submenu in the Configure menu.
NOTE. The component vector graticule is provided to allow comparison with
other equipment with similar displays. For a more accurate representation of
hue shift, use the composite vector representation.
Each chrominance vector of a Color Bar signal terminates as a bright dot in a
target. The distance from the center box to the target box corresponds to the
amplitude for the color being measured. The dot brightness corresponds to the
duration of the color bar. The dimension of each target box represents 2%
(±14 mV) of a 700 mV amplitude.
The dashed-vector line labeled “I” is for evaluating flesh tones. Increasing radial
amplitude along this axis indicates increasing flesh-tone saturation. Increasing
angle change from this axis indicates increasing flesh-tone hue change.
3- 40
WFM700 Series Waveform Monitors User Manual
Reference
Vector Timing Measurements. In the composite domain, the transitions between
the vector end points display timing differences. Because these timing differences include the delay in the decoder output filtering, you can usually ignore
them. In the component domain, there is no decoding required. Therefore, the
color bar transitions contain useful timing information. These timing differences
appear as looping or bowing of the transitions. While the Vector display allows
you to visualize interchannel timing errors, use the Lightning display to quantify
the amount of timing error.
Lightning Display
The Lightning display is a Tektronix, Inc. proprietary display combining a
vertical luminance axis with horizontal chrominance information. The Lightning
display plots the color difference signals, Pb and Pr, with the luminance (Y)
signal. In the top half of the Lightning display, Pb is plotted against Y, and on
the bottom half, Pr is plotted against inverted Y. The vertical center is the 0 V or
black-clamp point.
Lightning Graticule. The Lightning graticule (see Figure 3--13) has two sets of
small cross-hairs that bisect the green-magenta transitions on a color bar signal.
The calibration of the marks is shown in Table 3--7. The electronic graticule
eliminates the effects of CRT nonlinearity.
You can adjust the vertical and horizontal gain using the Gain menu and the
Sweep menu to normalize signal amplitude and to expand the scale of the
display to better view the small timing graticule cross-hairs.
Table 3- 7: Lightning graticule marks
SD cross-hair timing error calibration1
HD cross-hair timing error calibration1
Graticule mark
Description
Graticule mark
Description
Center
Aligned
Center
Aligned
20 ns
1st mark
2 ns
40 ns
2nd
5 ns
3rd mark
74 ns
(one luma sample time)
3rd mark
13.5 ns
(one luma sample time)
4th mark
148 ns
(one chroma sample time)
4th mark
27 ns
(one chroma sample time)
1st mark
2nd
1
mark
mark
The graticule calibration is only correct if the color bar signal lands in the targets.
WFM700 Series Waveform Monitors User Manual
3- 41
Test Equipment Depot - 800.517.8431 - 99 Washington Street Melrose, MA 02176 - FAX 781.665.0780 - TestEquipmentDepot.com
Reference
Figure 3- 13: Lightning display showing proper interchannel timing
40 ns timing error
20 ns timing error
Figure 3- 14: Lightning display showing interchannel timing errors
3- 42
WFM700 Series Waveform Monitors User Manual
Reference
Luminance Gain Measurement. The signal is driven along the vertical axis above
and below the center box by the luminance signal. The luminance gain is correct
when the center dot (clamped black level) is centered in the target box and the
positive and negative excursions end at the top and bottom of the graticule.
Perfect monochrome signals appear as a thin vertical line. Any deviation or
bending off the center line indicates a color variation from the monochrome
setup of the display monitor.
Interchannel Timing Measurement. The scale (sequence of dots) between the green
and magenta targets provides a way to check interchannel timing (CH-2 to CH-1
and CH-3 to CH-1) or signal delay. If the color difference signal is not coincident
with luminance, the transitions between color dots will bend. The amount of this
bending represents the relative signal delay between luminance and the color
difference signal. The upper half of the display measures the Pb-to-Y timing,
while the bottom half measures the Pr-to-Y Timing. If the transition bends in
toward the vertical center or black region, the color difference signal is delayed
with respect to luminance. If the transition bends out toward white, the color
difference signal is leading the luminance signal.
Figure 3--13 shows a signal with proper interchannel timing. In Figure 3--14, the
Lightning display shows that the signal has Y--Pb and Y--Pr timing errors.
Pr and Pb Gain Measurement. The horizontal deflection of the top half of the
display is an indication of the Pb gain and the lower half indicates the Pr gain. If
the color bar signal dots are within the horizontal dimensions of the appropriate
graticule targets, the Pb and Pr gains are within 2% of the correct amplitude.
Since the vertical and horizontal dimensions of the graticule target boxes indicate
2% luminance and color difference gain errors, respectively, you can evaluate
each color bar for encoding accuracy with these limits.
WFM700 Series Waveform Monitors User Manual
3- 43
Reference
Waveform Mode
Press the WFM button to enter the Waveform mode. In Waveform mode, the
selected components are displayed in a voltage versus time plot. You can apply
flat or low pass filters and choose the color space modes (such as RGB or
composite). In component color space modes, you can turn the individual
components on or off.
Parade / Overlay
In Parade mode, all selected components of the signal are displayed from left to
right, in the same order as they appear on the soft key (for example, in the RGB
display, “R” is on the left, followed by “G” and then “R”). In Overlay mode, all
selected components of the signal are overlaid.
Configuration
Use the Video Inputs/Outputs submenu of the Configure menu to modify the
waveform by turning the EAV/SAV stripping on and off. Use the Grat / Gamut
Default Setup submenu of the Configure menu to select the graticule units used
in the waveform display (mV, IRE, or % full-scale).
Secondary Modes
You can use the following secondary modes while in Waveform mode:
Gain. Use the Gain menu to adjust the vertical gain of the signal display.
Cursors. Use the cursors to measure time and amplitude.
NOTE. Do not use the time cursors to measure time between components in a
paraded waveform display. Parade mode is a special display format that
represents all displayed components in a single screen, irrespective of the time
relationship between components.
Line Select. Use the Line Select function to select part of the video signal to
display and measure.
Freeze. Use the Freeze feature to capture (freeze) the active signal and compare
the frozen signal to the live signal.
3- 44
WFM700 Series Waveform Monitors User Manual
Reference
Sweep. Use the Sweep menu to select from the following sweep modes:
H
Line. One horizontal line is displayed. Use the Line Select function to
choose one line out of a field or frame.
H
2 Line. (Overlay mode only) Two consecutive horizontal lines are displayed.
H
Field. All lines for one video field are displayed.
H
2 Field. (Overlay mode only) All lines for two video fields are displayed.
H
Mag. Turns the Mag function on and off.
NOTE. In waveform mode, the instrument does not maintain separate sweep
settings for the different color space selections. Changing the sweep selection in
one color space setting changes the sweep mode in all color space settings.
The composite color space does not support 2 Line and 2 Field sweeps.
Time/div varies with format and sweep type to keep the displayed waveform a
reasonable size.
Mag Sweep
When Mag sweep is on, the horizontal scale is magnified about the center of the
screen. In the magnified mode, the waveform extends off both sides of the CRT.
Use the horizontal position knob to pan left and right on the waveform.
NOTE. Timing cursors operate correctly in the magnified mode, although one or
both may be off screen during measurements.
When operating in two line sweep mode, MAG factors are chosen that optimize
the evaluation of the horizontal blanking interval. To utilize this feature, perform
the following steps:
1. Ensure that the waveform display is in OVERLAY mode.
2. Select 2LINE sweep.
3. Use the horizontal position control to adjust the waveform so that the
blanking interval is aligned with the horizontal graticule indicating the center
of the screen.
4. Select MAG sweep.
WFM700 Series Waveform Monitors User Manual
3- 45
Reference
Measuring Relative Timing
Between Two Serial
Component Signals
To measure the timing of two digital signals, use the following procedure:
1. Connect the two terminated SDI signals to be measured to Input A and
Input B on the waveform monitor.
2. Select Input A to display on the waveform monitor.
3. Verify that the waveform monitor is externally referenced to a black burst or
tri-level sync signal (as appropriate).
4. In the Video Inputs/Outputs submenu of the Configure menu, set Strip
EAV/SAV to Pass. This mode allows the 3FF, 000, 000, and XYZ values to
be displayed on the waveform monitor as shown in Figure 3--15.
NOTE. The transition from 3FF to 000 and 000 to XYZ produces ringing on the
display when passed through the appropriate SD or HD filter. The SAV or EAV
pulse can be used as a timing reference by positioning it on a major tick mark of
the waveform graticule display and comparing it to the other SDI signals,
ensuring that they are positioned at the same mark.
There are no vertical pulses in the digital domain; digital systems calculate their
video position based on the values of F, V, and H. Therefore, a reference point
must be defined in order to measure vertical timing. For simplicity, the first line
of active video can be used as the reference, because the vertical blanking lines
are normally blank.
5. To measure vertical timing, perform the following steps:
a. Set Line Select and Sweep for two-line mode.
b. Select Field 1 and set Line Select at the setting that will display the last
line in the vertical interval and the first line of active signal (Input A).
The Line Select setting should be line 20 for 1080 Interlaced HDTV,
41 for 1080 progressive formats, 25 for 720 progressive, 19 for 525
interlace, or 22 for 625 interlace. If necessary, adjust the vertical timing
of the signal source until the display is correct.
c. Select Input B and make sure the last vertical and first active lines are
displayed. If necessary, adjust the vertical timing to align both vertical
positions to the start of active video.
d. Switch back to Input A and set MAG to ON, noting the amplitude of the
SAV pulses.
e. If the amplitudes of both pulses are identical, they are in the same field.
If not, the two signals are in opposite fields and timing adjustments
should be made to align the sources to the same starting point.
3- 46
WFM700 Series Waveform Monitors User Manual
Reference
Figure 3- 15: XYZ pulse of Y channel with pass through selected
6. To measure horizontal timing, perform the following steps:
a. Switch to Input A and set the waveform monitor to one line sweep.
b. Use the horizontal position knob to set the SAV pulse to a major
graticule tick mark, or use cursor mode and set a cursor on the SAV
pulse.
c. Compare the timing to the signal on Input B by selecting Input B and
adjusting the fine timing controls to match the timing position of
Input A.
WFM700 Series Waveform Monitors User Manual
3- 47
Index
Index
A
B
Aberrations, serial channel measurements, 3-- 20
AC line frequency, 1-- 6
Accessories
Japanese user manual, 1-- 4
Korean user manual, 1-- 4
optional, 1-- 4
WFM7A, 1-- 4
WFM7DG, 1-- 4
WFM7HD, 1-- 4
plain cabinet, 1-- 4
portable cabinet, 1-- 4
protective front cover, 1-- 4
rack adapter, 1-- 4
service manual, 1-- 4
standard, 1-- 2
Additional input modules, 1-- 4
Address, Tektronix, vii
AES stream, 3-- 7
Airflow, allowing adequate, 1-- 5
Alarm
error availability, Eye / Jitter mode, 3-- 3
possible alarm actions, 3-- 2
status display error indicators, 3-- 39
types, 3-- 2
Amplitude, serial channel measurements, 3-- 20
Anciliary Data display, 3-- 4
Ancillary Data readout, 2-- 6
Application notes and reference documents, v, vi
Area masking, 3-- 31
ARIB STD-- B39 display, 3-- 6
Arrowhead display, 2-- 23, 3-- 28
Audio
channels readout, 2-- 5
display elements, 3-- 8, 3-- 10
display mode selection, 3-- 8
input selecting, 3-- 7
menu, 2-- 13
Audio mode, 3-- 7
AUX INPUT connector, 2-- 9
AUX OUT connectors, 2-- 10
Bowtie Display, relative gain check, 3-- 14
Bowtie display, timing measurement, 3-- 14
Buttons
finder, 2-- 24
front panel, 2-- 4
WFM700 Series Waveform Monitors User Manual
C
Cabinet ordering, 1-- 4
Capture, 2-- 21
Carrying case, 1-- 4
CD-- ROM, v
Clock recovery bandwidth, 3-- 17
Closed Caption Presence readout, 2-- 6
CLR MENU button, 2-- 11
Composite display, 3-- 15
Config menu, 2-- 14
Configuring a parameter, 2-- 11
Contacting Tektronix, vii
Content Advisory (V-- chip) readout, 2-- 6
Context-- sensitive help, 2-- 24
Current reference readout, 2-- 5
Current time and date readout, 2-- 6
Cursor menu, 2-- 18
Cursor readout, 2-- 6
Cursors, measurement accuracy, 3-- 19, 3-- 26
D
Data, jitter measurement with Eye Pattern, 3-- 23
Data Display menu, 2-- 26
Data Display mode, 3-- 15
Data mode (HD), 3-- 15
Data mode (SD), 3-- 15
Diagnostics, 3-- 16
Diamond display, 2-- 23
checking RGB Gamut, 3-- 27
RGB gamut, 3-- 27
DID and SDID ancillary data values, 3-- 5
Display menu, 2-- 19
Documents, v
Index- 1
Index
E
H
EC self test failed, 2-- 3
Error indicators, Alarm Status display, 3-- 39
Errors, 3-- 2
ETHERNET connector, 2-- 10
Event log, icons, 3-- 33
EXT VGA connector, 2-- 10
Eye measurements, 3-- 17
Eye Measurements readout, 2-- 6
Eye menu, 2-- 20
Eye mode, 3-- 17
Eye Pattern
aberration measurement, 3-- 20
amplitude measurement, 3-- 20
rise time measurement, 3-- 21
word correlated behavior, 3-- 23
H Gain readout, 2-- 5
Hardware fault, 2-- 2
Hardware installation, 1-- 5
Help menu, 2-- 24
HORIZ POS knob, 2-- 2
Horz + Vert, 3-- 31
Horz + Vert filter, 3-- 31
F
FAULT LED, 2-- 2
Field and line readout, 2-- 6
Field selection, 3-- 31
Filtering, 3-- 31
Flesh tone indicator, 3-- 40
Freeze menu, 2-- 21
Front panel
buttons, 2-- 4
illustration, 2-- 1
indicators, 2-- 2
interface, 2-- 1
knobs, 2-- 2
G
Gain, relative gain check with Bowtie display, 3-- 14
Gain menu, 2-- 22
Gamut display
checking RGB gamut, 3-- 27
Diamond display, 3-- 27
menu, 2-- 23
thresholds, 3-- 30
Gamut error readout, 2-- 6
Gamut Threshold Settings readout, 2-- 5
General Alarms, configure, 3-- 2
General purpose knob, 2-- 2
Graticule
for Vector display, 3-- 40
Lightning Display, 3-- 42
Index- 2
I
Icons, 2-- 7
event log, 3-- 33
Indicators
FAULT LED, 2-- 2
ON/STBY LED, 2-- 2
INPUT A connector, 2-- 9
INPUT B connector, 2-- 9
Input connectors, 2-- 9
Input menu, 2-- 24
Input modules, 1-- 4
Installation, 1-- 5
connecting power, 1-- 6
Instrument configuration, 2-- 14
J
Japanese user manual ordering, 1-- 4
Jitter, 3-- 17
definition, 3-- 23
demodulation, 3-- 23
Jitter measurements, 3-- 23
JITTER OUT connector, 2-- 10
K
Knobs
general purpose, 2-- 2
HORIZ POS, 2-- 2
VERT POS, 2-- 2
Korean user manual ordering, 1-- 4
WFM700 Series Waveform Monitors User Manual
Index
L
LED fault codes, 2-- 2
Lightning display, 3-- 41
interchannel timing measurement, 3-- 43
luminance gain measurement, 3-- 43
PbPr gain measurement, 3-- 43
Lightning graticule marks, 3-- 41
Line Select menu, 2-- 25
Line Select mode, 3-- 31
M
MAG readout, 2-- 6
Major mode buttons, 2-- 4
Making menu selections, 2-- 11
Measure menu, 2-- 26
Measure mode, 3-- 34
Measurement
amplitude with Vector display, 3-- 40
Eye Pattern aberrations, 3-- 20–3-- 22
Eye Pattern amplitude, 3-- 20–3-- 22
Eye Pattern rise time, 3-- 21–3-- 22
interchannel timing with Lightning display, 3-- 43
Jitter, 3-- 23
luminance gain with Lightning Display, 3-- 43
observing word correlated behavior, 3-- 23
PbPr gain with Lightning display, 3-- 43
phase with Vector display, 3-- 40
vector timing with Vector display, 3-- 41
Measuring serial sources, 3-- 17–3-- 22, 3-- 23–3-- 27
Menu diagrams, 2-- 11
how to use, 2-- 12
Menu hierarchy, 2-- 11
Menus, 2-- 11
config, 2-- 14
cursor, 2-- 18
data display, 2-- 26
display, 2-- 19
eye, 2-- 20
freeze, 2-- 21
gain, 2-- 22
gamut, 2-- 23
help, 2-- 24
input, 2-- 24
line select, 2-- 25
WFM700 Series Waveform Monitors User Manual
measure, 2-- 26
preset, 2-- 29
print, 2-- 30
status, 2-- 30
sweep, 2-- 31
vector, 2-- 32
waveform, 2-- 33
MIB document, v
Minor mode buttons, 2-- 4
Modes
Arrowhead, 3-- 28
Audio, 2-- 13, 3-- 7
Data display, 3-- 15
Eye, 3-- 17
Freeze, 2-- 21
Gamut, 3-- 27
Jitter, 3-- 23
Line Select, 3-- 31
Measure, 3-- 34
Split Diamond, 3-- 27
Status, 3-- 37
Vector, 3-- 40
Video, 3-- 15
Waveform, 3-- 44
Momentary fault, 2-- 3
Multi mode, 2-- 27, 3-- 34
Multi-- pin connectors, 2-- 10
O
On-- screen readouts, 2-- 5
ON/STBY, 2-- 2
Optional Accessories, additional inputs, 1-- 4
Optional accessories, 1-- 4
cabinets, 1-- 4
Options, power cords, 1-- 2
Ordering
cabinets, 1-- 4
Japanese user manual, 1-- 4
Korean user manual, 1-- 4
service manual, 1-- 4
Outputs, 2-- 10
Overshoot, 3-- 31
Overtemp fault, 2-- 3
Index- 3
Index
P
S
Part numbers
Japanese WFM700 User Manual, 1-- 4
Korean WFM700 User Manual, 1-- 4
power cords, 1-- 3
WFM700 Release Notes, 1-- 2
WFM700 Service Manual, 1-- 4
WFM700 User Manual, 1-- 2, 1-- 4
PbPr
Gain measurement with Lightning display, 3-- 43
plotted against Luminance, 3-- 41
Phone number, Tektronix, vii
Picture mode, 3-- 35
PIX G/Y, B/Pb, R/Pr outputs, 2-- 10
Pixel errors, 3-- 31
Portable cabinet, 1-- 4
Power, AC requirements, 1-- 6
Power connector, 2-- 9
Power consumption, typical, 1-- 6
Power cord options, 1-- 2
Power on, 1-- 5
Power on procedure, 1-- 6
Power source, 1-- 6
Power source requirements, 2-- 9
Power supply fault, 2-- 3
Power, connecting, 1-- 6
Powerup diagnostics, 3-- 16
PR to Y Timing, 3-- 43
Preset menu, 2-- 29
Print menu, 2-- 30
Printing, 3-- 36
Product description, 1-- 1
Product support, contact information, vii
Program Rating (V-- chip) readout, 2-- 6
Safety Summary, iii
Sample readout, 2-- 6
Sample selection, 3-- 31
SD PIX MON output, 2-- 10
Select button, 2-- 2
Selected input and format readout, 2-- 5
Selecting audio input, 3-- 7
Serial Alarms, configure, 3-- 2
Serial channel measurements
aberrations, 3-- 20
amplitude, 3-- 20
rise time, 3-- 21
word correlated behavior, 3-- 23
SERIAL OUT connector, 2-- 10
Service manual ordering, 1-- 4
Service support, contact information, vii
SNMP MIB document, v
Soft keys, 2-- 5
Split Diamond display, 2-- 23, 3-- 27
Standard accessories, 1-- 2
Status display, 3-- 37
Status menu, 2-- 30
Studio timing, 3-- 43
Sweep menu, 2-- 31
Sweep rate readout, 2-- 6
System information, 2-- 24
R
Rack adapter, 1-- 4
Readouts, 2-- 5
Rear panel connectors, 2-- 8
Rear panel illustration, 2-- 8
REF IN loop-- through connectors, 2-- 9
Related reference documents, v
Release notes, part number, 1-- 2
REMOTE connector, 2-- 10
RGB gamut, Diamond display, 3-- 27
Rise time, serial channel measurements, 3-- 21
Run audio path diagnostics, 3-- 16
Run full powerup diagnostics, 3-- 16
Run internal digital path diagnostics, 3-- 16
Running diagnostics, 3-- 16
Index- 4
T
Technical Reference document, v
Technical support, contact information, vii
Tektronix, contacting, vii
Timecode readout, 2-- 6
Timing, measurement with Bowtie, 3-- 14
Touch screen, 2-- 5
U
URL, Tektronix, vii
WFM700 Series Waveform Monitors User Manual
Index
V
W
V Gain readout, 2-- 5
V-- chip (Content Advisory) readout, 2-- 6
Variable gain, 2-- 22
Variable gain range, 2-- 22
Vector display
amplitude measurement, 3-- 40
flesh tone indicator, 3-- 40
graticules, 3-- 40
Lightning display, 3-- 41
phase measurement, 3-- 40
timing measurement, 3-- 41
vector timing measurement, 3-- 41
Vector menu, 2-- 32
Vector mode, 3-- 40
Ventilation holes, 1-- 5
VERT POS knob, 2-- 2
VGA PIX MON connector, 2-- 10
Video mode (Data display), 3-- 15
Waveform, jitter, 3-- 23
Waveform components readout, 2-- 5
Waveform menu, 2-- 33
Waveform mode, 3-- 44
Web site address, Tektronix, vii
WFM700A, 1-- 1
WFM700HD, 1-- 1
WFM700M, 1-- 1
WFM7DG, 1-- 4
WFM7F02, 1-- 4
WFM7F03, 1-- 4
WFM7F05, 1-- 4
WFM7HD, 1-- 4
WFM7M, 1-- 4
Word correlated behavior, jitter measurements, 3-- 23
WFM700 Series Waveform Monitors User Manual
Index- 5
Test Equipment Depot - 800.517.8431 - 99 Washington Street Melrose, MA 02176 - FAX 781.665.0780 - TestEquipmentDepot.com