1
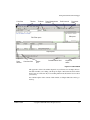
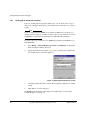
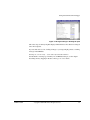
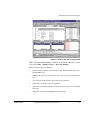
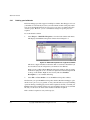
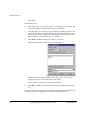
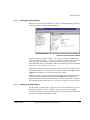
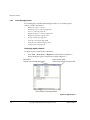
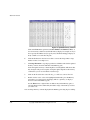
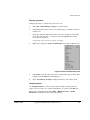
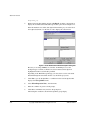
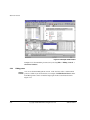
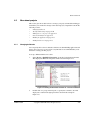
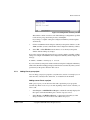
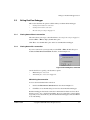
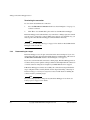
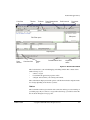
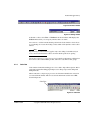
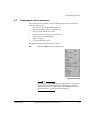
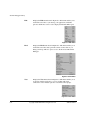
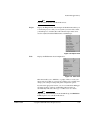
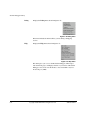
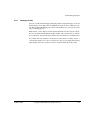
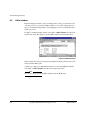
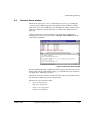
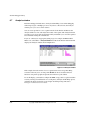
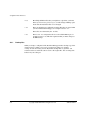
Quick-start Tutorial
Using the call stack
The Call Stack pane enables you to follow the flow of your program by examining the
current status of functions and variables. This pane shows you the path that leads from
the main entry point to the currently executing function.
To monitor your execution path:
1.
Select View → Pane Views → Call Stack from the default Code window to
display the Call Stack pane.
2.
Select File → Reload Image to Target to reload the image.
3.
Click the Go button on the Actions toolbar to execute the image. Enter a large
number of runs, for example 50000.
4.
Click Stop Execution to stop the program before it finishes.
The Call Stack tab, in the Call Stack pane, displays details of the functions
currently on the stack and awaiting execution.
5.
Right-click on an entry in the Call Stack pane, to see the Function context menu.
This menu enables you to carry out operations on the chosen function in the stack,
for example to scope to that function.
6.
Click on the Locals tab in the Call Stack pane. This displays a list of the variables
that are local to the current function, shown in the example in Figure 4-11.
Figure 4-11 Local variables in the Call Stack pane
If a variable is a structure or an array, a plus sign is added to the entry in the Call
Stack pane. You can click on this to expand the variable to see all elements of the
structure or array.
4-20
7.
Right-click on an entry in the Locals tab, to see the Variables context menu.
8.
Click on the Statics tab, to see non-local variables, that is module statics.
Copyright © 2002 ARM Limited. All rights reserved.
ARM DUI 0181B