1
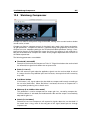
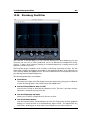
5.6 Shared tool windows 129 Changing settings You can define display colors, peak hold time, and the resolution or number of samples to display from the Functions > Settings... menu. The Phasescope meter can be found in the Meters menu of the Audio Files and Audio Montage Workspaces. It can be used either as a floating window, or docked in the Workspace or the Control Window. Related topics Metering 5.6.2 VU Meter The vu-meter is used to display the peak and average loudness/decibel level of your Audio File. It also displays the pan, or the balance between the left and right channels in a stereo file. The upper part of the level/pan meter window shows the peak level and average loudness, in the following way: The Peak Level meters display the peak levels of each channel, graphically and numeri- cally. By default, the meter segments and numerical peak values are displayed in green for low levels, yellow for levels between -6dB and -2dB, and red for levels above -2dB. You can change both the colors and the range boundaries if you wish via the Level/Pan Meter Settings dialog. This can be accessed through the Functions > Settings... menu, or by using the icon. The VU (Volume Unit) meters measure the average loudness (RMS) of each channel. These meters have a built-in inertia, evening out loudness variations over a user-defined time span. If you are monitoring playback or audio input, you will also note two vertical lines following each VU meter bar, seemingly "trying to reach" the current RMS value. These lines indicate the average of the most recent minimum RMS values (left line) and the average of the most recent maximum RMS values (right line). To the left, the difference between the minimum and maximum average values is displayed (the level value in brackets) - this gives you an overview of the dynamic range of the audio material. If you are monitoring real-time audio (playback or input), the maximum peak and loud- ness values are displayed numerically to the right of the meter bars. Numbers in brackets to the right of the Maximum Peak values indicate the number of successive clips (0dB signal peaks). Recording levels should be set so that they only rarely clip. If the master level is set too high, the sound quality and frequency response will be compromised at high recording levels, with unwanted clipping effects. If the level is set too low, noise levels may be high relative to the main sound being recorded. Pan meters The lower part of the window shows the pan (the difference in level between the left and right channel, only applicable when monitoring stereo audio): WaveLab 7