1
185
powerOne® Graph
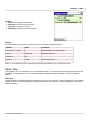
main calculator. My Data should be visible.
3. Select "New" from the bottom of My Data.
4. Choose "Table" from the list.
5. Create the new table.
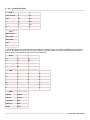
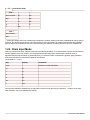
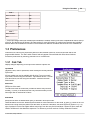
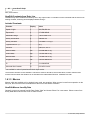
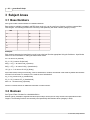
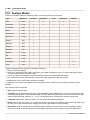
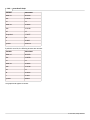
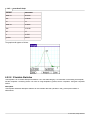
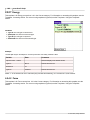
· for the name, enter chi.
· for the number of rows, enter 8.
· for the number of columns, enter 1.
6. Select "OK". The table editor should be visible.
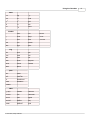
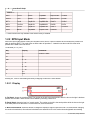
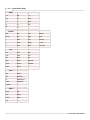
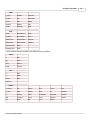
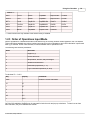
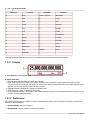
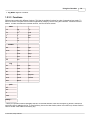
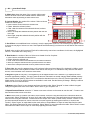
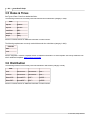
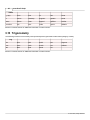
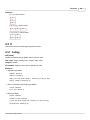
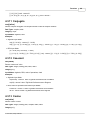
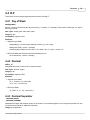
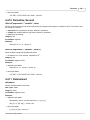
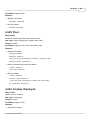
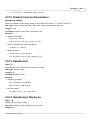
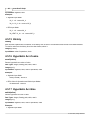
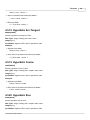
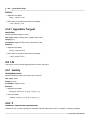
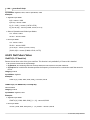
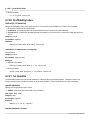
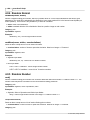
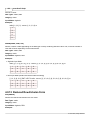
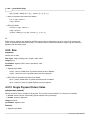
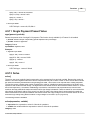
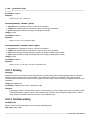
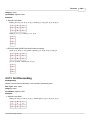
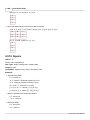
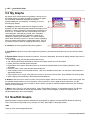
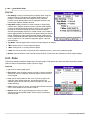
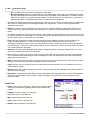
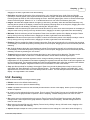
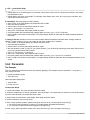
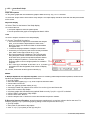
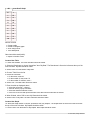
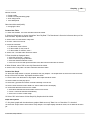
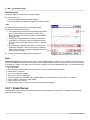
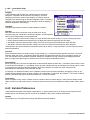
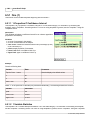
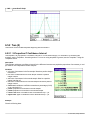
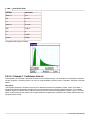
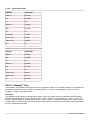
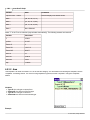
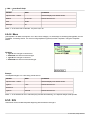
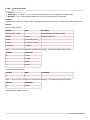
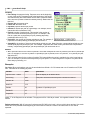
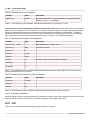
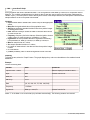
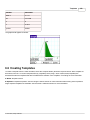
7. Enter the table as displayed above.
· select the cell at row 1, column 1.
· enter 20 into the pop-up calculator.
· select the checkmark button to save.
· move to the next cell and repeat with each cell's data until the entire table is entered.
8. When finished, select "OK" to save. My Data should be visible.
9. Select "Done" in My Data. The main calculator should be visible.
Create a New Graph
10. Select the Graph button or choose "powerOne" then "My Graphs". The Graph button is second from the left across
the top of the main calculator. My Graphs should be visible.
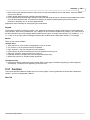
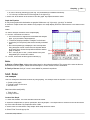
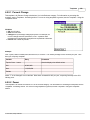
11. Select "New" from the bottom of My Graphs. New Graph should be visible.
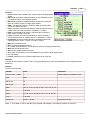
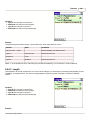
12. Select "Data" from the pop-up list.
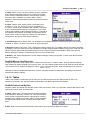
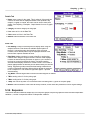
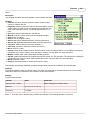
13. Select the Type label and choose "Box Plot" from the list.
14. Select "None Selected" next to X. Select Table Column will display.
15. Choose the table and column for the X data.
· select None Selected and choose table chi from the list.
· column 1 should be selected automatically.
· select "OK" to return to New Graph.
16. (Frequency will remain "1 of Each".)
17. Select "OK" at the bottom of New Graph. My Graphs should be visible.
Graph the Equation
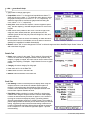
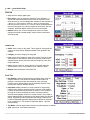
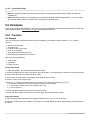
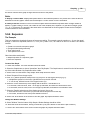
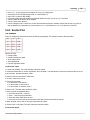
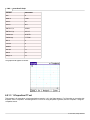
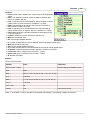
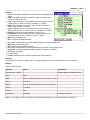
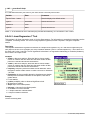
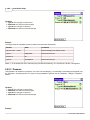
18. Only those graphs with checkmarks are graphed. Make sure only "X: chi Col: 1 Freq: 1 of Each" is checked.
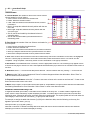
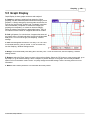
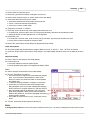
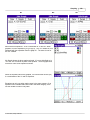
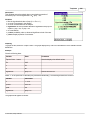
19. Select the "Graph" button at the bottom of My Graphs. The Graph display should be visible, but no data can be seen
yet.
Adjust the Display
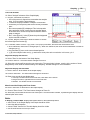
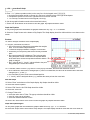
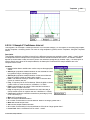
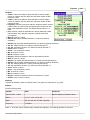
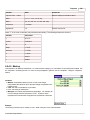
20. Select "Zoom" at the bottom of the Graph display.
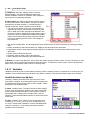
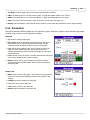
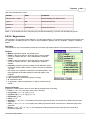
21. Choose "Best Fit".
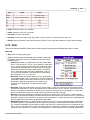
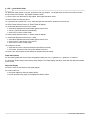
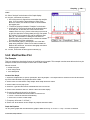
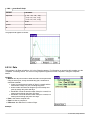
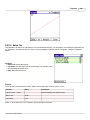
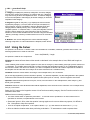
· the screen adjusts to show the plotted points.
· best fit repositions the graph so the appropriate data is visible.
© 1997-2005, Infinity Softworks