1
SI GNUM
S YS TE MS
8 3 0
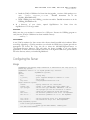
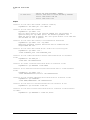
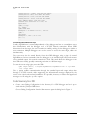
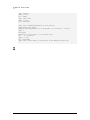
Loading section ..rodata, size 0x29 lma 0x9f10
Loading section .data, size 0x850 lma 0xa03c
Loading section .ctors, size 0x8 lma 0xa88c
Loading section ..dtors, size 0x8 lma 0xa894
Start address 0x8000, load size 10137
Transfer rate: 81096 bits in <1 sec, 151
bytes/write.
(gdb) p /x $pc
$1 = 0x8000
(gdb) break main
Breakpoint 1 at 0x8220: file x.c, line 34.
(gdb) c
Continuing.
Breakpoint 1, main () at x.c:34
34 a = 0;
...
Communicating with the GDB Server Via a Pipe
Usually, SigGdbServer is started independently of the debugger and acts as a standalone server
that communicates with the debugger over a TCP/IP network connection. When GDB
disconnects from the target, the server remains in standby, waiting for the debugger to initiate a
new connection. Multiple debuggers can use the server to access the same target, albeit not
simultaneously.
The server may also be started directly from the GDB debugger using a pipe. So started
SigGdbServer receives commands from the debugger on its standard input and sends answers
on its standard output. No network connection is used. This mode allows the debugger to run
the GDB server locally, possibly connecting each time to a different target.
To start the server using a pipe, enter in GDB
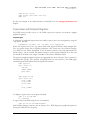
(gdb) target remote | C:/Signum/SigGdbServer/SigGdbServer.exe –s -cpu iMX31
-init -target iMX31
The –s option enables communication through the standard input and output rather than
through a TCP/IP network, while suppressing the informational messages displayed by the
server on its console when started standalone. It is possible, however, to redirect the suppressed
messages to a file using the –q <file> option.
Code Sourcery G++ IDE
1.
Create a new Debug Configuration in the Sourcery G++ IDE debugger and set it up to
work with the JTAGjet GDB Server.
Choose Debug Configuration form the Run menu to open the dialog box in Figure 1.
8