1
Copyright © 1995-2015 SolarWinds Worldwide, LLC. All rights reserved worldwide.
No part of this document may be reproduced by any means nor modified, decompiled,
disassembled, published or distributed, in whole or in part, or translated to any electronic
medium or other means without the written consent of SolarWinds. All right, title, and
interest in and to the software and documentation are and shall remain the exclusive
property of SolarWinds and its respective licensors.
SOLARWINDS DISCLAIMS ALL WARRANTIES, CONDITIONS OR OTHER TERMS,
EXPRESS OR IMPLIED, STATUTORY OR OTHERWISE, ON SOFTWARE AND
DOCUMENTATION FURNISHED HEREUNDER INCLUDING WITHOUT LIMITATION
THE WARRANTIES OF DESIGN, MERCHANTABILITY OR FITNESS FOR A
PARTICULAR PURPOSE, AND NONINFRINGEMENT. IN NO EVENT SHALL
SOLARWINDS, ITS SUPPLIERS, NOR ITS LICENSORS BE LIABLE FOR ANY
DAMAGES, WHETHER ARISING IN TORT, CONTRACT OR ANY OTHER LEGAL
THEORY EVEN IF SOLARWINDS HAS BEEN ADVISED OF THE POSSIBILITY OF
SUCH DAMAGES.
The SOLARWINDS and SOLARWINDS & Design marks are the exclusive property of
SolarWinds Worldwide, LLC and its affiliates, are registered with the U.S. Patent and
Trademark Office, and may be registered or pending registration in other countries. All
other SolarWinds trademarks, service marks, and logos may be common law marks,
registered or pending registration in the United States or in other countries. All other
trademarks mentioned herein are used for identification purposes only and may be or are
trademarks or registered trademarks of their respective companies.
SolarWinds Virtualization Manager
Version 6.2.0.1
Revised: 4/9/2015
Table of Contents
SolarWinds Virtualization Manager Administrator Guide
18
About SolarWinds
18
Contacting SolarWinds
18
Conventions
19
SolarWinds Virtualization Manager Documentation Library
19
Helpful tips and tricks
20
Chapter 1: Introduction
21
Why install SolarWinds Virtualization Manager
22
Key features of SolarWinds Virtualization Manager
23
Chapter 2: Installing SolarWinds Virtualization Manager
Minimum requirements
25
25
Browser requirements
25
Virtual appliance requirements
26
Port requirements
28
Master appliance
29
Federated collector
31
Data collection
32
Memory requirements
33
Disk space requirements
34
Expanding the provisioned disk size
34
VMware account permissions
35
SolarWinds Integrated Virtual Infrastructure Monitor Requirements
35
Installing Virtualization Manager as a virtual appliance
36
Installing Virtualization Manager on VMware vSphere 4.1 or later
37
Installing Virtualization Manager on Microsoft Hyper-V Server 2008
39
Installing Virtualization Manager on Microsoft Hyper-V Server 2012
41
3
SolarWinds Virtualization Manager Administrator Guide
Uninstalling Virtualization Manager
43
Installing the Integrated Virtual Infrastructure Monitor (IVIM)
43
Preparing for the integration of Virtualization Manager
44
Integrating Virtualization Manager for a VMware environment
Installing the SolarWinds Integrated Virtual Infrastructure Monitor in standalone mode
Integrating IVIM with Virtualization Manager
Possible issues during integration
45
47
49
50
Issues with credentials
50
Issues with importing nodes to the SolarWinds Orion server
51
Issues with changing the polling source
51
Issues with sending data to Virtualization Manager
52
Issues with the probe job
52
Managing nodes in the Orion Web Console
53
Upgrading an existing virtual appliance
54
Upgrading on vSphere 4.1 or later
54
Upgrading on Hyper-V
55
Additional upgrade steps for AD/LDAP authentication
56
Activating the license
57
Solving upgrade issues
58
Updating an existing Windows installation
58
Migrating from an existing virtual appliance to a new virtual appliance
59
Installing, updating and uninstalling a federated collector
60
Installing a federated collector
61
Updating a federated collector
62
Uninstalling a federated collector
63
Licensing
63
4
Table of Contents
License management in Virtualization Manager version 6.2
64
Activating the license on a standalone Virtualization Manager installation
64
Activating the license on Virtualization Manager integrated with the SolarWinds Integrated Virtual Infrastructure Monitor
65
New installation:
65
Upgrade:
66
Activating the license on a Virtualization Manager instance licensed per VM
66
Activating the license on Virtualization Manager integrated with SolarWinds NPM or
SolarWinds SAM
67
New installation:
67
Upgrade:
68
License management starting from Virtualization Manager version 6.1
68
Using licenses from previous versions
69
Viewing your licensing status
69
Activating a license key online
70
Activating a license key offline
71
Excluding hosts from monitoring
72
Chapter 3: Administration and setup
73
Basic setup
73
Filling in the SolarWinds registration
74
Configuring credentials
74
Configuring data sources
75
Configuring collection schedules
76
Infrastructure aging
77
Configuring SMTP settings
78
Configuring the Storage Manager installation details
79
5
SolarWinds Virtualization Manager Administrator Guide
Configuring HTTPS access only
80
Enabling Dynamic Memory on Hyper-V 2008 servers
80
Advanced setup
81
User management
82
Setting default dashboards for users
83
Using inventory filters
83
Using labels
84
Configuring SNMP
84
Configuring authentication servers
85
Adding an Active Directory authentication server
85
Adding an LDAP authentication server
86
Synchronizing the time of the AD and LDAP server and the SolarWinds Virtualization
Manager server
87
Adding AD and LDAP users to SolarWinds Virtualization Manager
88
Configuring system properties
88
Editing system properties
88
List of properties that may not be edited
90
Configuring system maintenance
91
Configuring server logging
93
Viewing the log files
93
Adding an SSL certificate to Virtualization Manager
93
Adding a self-signed SSL certificate
94
Adding a certificate from a certificate authority
96
Collecting data and calculating rollup information
98
Sample collection in a VMware environment
99
Sample collection in a Hyper-V environment
100
6
Table of Contents
Data rollup
100
Data retention
101
Aggregation
102
Infrastructure aging
102
Chapter 4: Key features
103
Dashboard
103
Explore
103
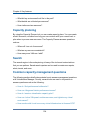
Capacity planning
104
Search
104
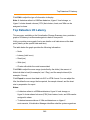
Common capacity management questions
104
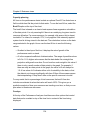
How do I find performance bottlenecks?
105
How can I diagnose historic performance issues?
105
How do I create a virtualization capacity plan?
105
How can I solve VM sprawl, reclaim resources, and rightsize my virtual environment?
106
How much would it cost to move my virtual infrastructure to Amazon EC2?
106
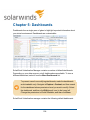
Chapter 5: Dashboards
108
Dashboard basics
110
Common widget controls
111
Moving widgets
111
Displaying widget options
111
Opening related content
112
Widget types
112
Alert Monitor widget
113
Consumption widget
114
Content/Alert List
114
Facet View widget
115
7
SolarWinds Virtualization Manager Administrator Guide
Fitment widget
116
Map widget
117
Notes widget
118
Performance Chart widget
119
RSS Feed widget
119
Top N widget
120
Trend widget
121
Customizing widgets
123
Portal integration
123
SolarWinds Orion server
124
OpenSocial portals
125
Microsoft SharePoint
126
Chapter 6: Business views
127
Trends
127
Trend operations
128
Creating trends
128
Data center visualizer
130
Historical performance analyzer charts
131
Capacity planning
134
Overlays
134
Chapter 7: Search
136
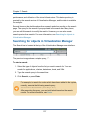
Searching for objects in Virtualization Manager
137
Search details
138
Search result actions
139
Search query actions
139
Search language
140
8
Table of Contents
Language syntax
141
Terms
141
Fields
141
Using wildcard searches
141
Using fuzzy searches
142
Using proximity searches
142
Using range searches
143
Using date searches
143
Boosting a term
144
Using Boolean operators
144
Grouping
146
Field grouping
146
Escaping special characters
146
Search query examples
146
Named fields
148
Example search queries
149
Using the query builder
161
Adding new filters
161
Common use cases
162
Chapter 8: Alerts
167
Scope
168
Criteria
169
Search result count
169
Attributes
170
Notifications
172
Using alert actions
173
9
SolarWinds Virtualization Manager Administrator Guide
Example Action
173
SNMP settings
176
Advanced settings
176
Accessing historical alert information
178
Using the Time Travel tool
178
Viewing the history of an alert
178
Viewing alert information for a specific resource
179
Chapter 9: Capacity planning
180
Planning basics
180
Using resource containers
180
Using usage profiles
183
When will I run out?
185
How much more can I add?
186
Calculating VM sizes
188
What if I add more resources?
189
Overloaded hosts
190
Advanced options
190
Calculation settings
191
Resource types
192
Workload
192
Sample period
192
Showing the calculations and variables
193
Chapter 10: Configuration comparison
194
Using DNA comparison
194
Comparing an object to itself
195
Comparing two objects
195
10
Table of Contents
Using detailed comparison by category
196
Chapter 11: Dependency maps
197
Using the initial context
197
Setting context
198
Understanding alerts
198
Adding items to a chart
198
Exporting data
199
Adding items to a list
199
Sorting items
199
Using Time Travel
199
Chapter 12: Content
201
Editing content
201
Adding and removing content
201
Importing content
202
Exporting content
202
Content types
202
Tags
204
Modifying the tags of a piece of content
204
Removing tags from a piece of content
204
Creating custom tags
204
Owner and permissions
205
Chapter 13: Lists
206
Chapter 14: Reporting
208
Data exports
208
Generating exports
208
Generating exports from a search query
209
11
SolarWinds Virtualization Manager Administrator Guide
On-demand reporting
209
Scheduled report jobs
210
Downloading reports
211
Configuring schedules
211
Removing report jobs
212
Pausing and resuming report jobs
212
Using custom reports
212
Chapter 15: Custom labels
214
Creating labels
214
Modifying labels
214
Removing labels
215
Chapter 16: Notes
216
Adding notes
216
Viewing notes
216
Chapter 17: Using the SolarWinds Integrated Virtual Infrastructure Monitor
Account limitations
217
217
Setting up user account limitations
218
Virtualization thresholds
219
Using baselining
220
Defining baselines
221
Understanding Object Statuses
223
vCenter
225
Datacenter
225
Cluster
226
Host
226
Virtual Machine
228
12
Table of Contents
AppStack Environment View and AppStack Environment resource
229
Creating virtualization alerts in the Orion Alert Manager
229
Creating virtualization reports in the Orion Report Manager
230
Viewing related entities in the Orion web console
231
Viewing storage infrastructure information in the Orion web console
232
Monitoring hardware health in IVIM
233
Chapter 18: Integrated Virtualization Infrastructure Monitor resources
234
Active Virtualization Alerts
234
Applications on this Datastore
234
Component Volumes
235
Datacenter Details
235
Datacenter Details view
235
Datacenters with Problems
236
Datastore Info
236
Datastore IOPS and Latency
237
Effective CPU Load
237
Effective Memory Load
237
ESX Host Details
238
Guests with Problems
238
Host Details view
238
Hosts with Problems
239
IOPS (Datastore and its Top VMs)
239
Latency (Datastore and its Top VMs)
240
Learn More about VMan Roles
241
List of Virtual Hosts
241
Overall Number of Running vs. Total VMs
241
13
SolarWinds Virtualization Manager Administrator Guide
Percent Availability
242
Percent Memory Used
242
Predicted Datastore Space Depletion
242
Predicted VM Disk Depletion
243
Resource Utilization
244
Setup Virtualization Manager Integration
245
Storage Summary
245
Top Datastore I/O Latency
246
Top Datastore IOPS
247
Top VM IOPS
248
Top VM Latency
248
Top XX Datastores by Low Free Space
249
Top XX Hosts by CPU Load
250
Top XX Hosts by Network Utilization
250
Top XX Hosts by Number of Running VMs
251
Top XX Hosts by Percent Memory Used
251
Top XX Managed Virtual Guests by Current Response Time
252
Top XX Managed Virtual Guests by CPU
252
Top XX Managed Virtual Guests by Memory
253
Top XX Managed Virtual Guests by Network Utilization
253
Top XX Managed Virtual Guests by % Packet Loss
254
Top XX VMs by Allocated Space
254
Top XX VMs by Low Storage Space
255
Top XX VMs by Overallocated CPU
256
Top XX VMs by Overallocated Memory
256
Top XX VMs by Snapshot Disk Usage
256
14
Table of Contents
Top XX VMs by Storage Consumed
257
Top XX VMs by Underallocated CPU
258
Top XX VMs by Underallocated Memory
258
Top XX VMs by Used Space
258
Usage MHz
259
Virtual Cluster Details
259
Virtual Disks and Related Storage Infrastructure
259
Virtual Machine Details view
260
Virtual Machine IOPS
260
Virtual Machine IOPS and Latency
260
Virtual Machine Latency
261
Virtualization Assets
261
Virtualization Asset Summary
262
Overall
262
VMware
262
Hyper-V
263
Virtualization Manager Alerts
263
Virtualization Manager Tools
264
Modifying the permissions
264
Virtualization Storage Summary
265
Virtualization Volume Details
266
VMs Idle for the Last Week
266
VMs Powered Off for More Than 30 Days
267
VMs that might benefit from decreasing vCPUs
267
VMware vCenters with Problems
267
VMware Clusters with Problems
268
15
SolarWinds Virtualization Manager Administrator Guide
Appendix A: Troubleshooting Hyper-V discovery
269
Why does Virtualization Manager not receive information from Hyper-V Hosts?
269
Testing local WMI services
270
Testing WMI on the target server
270
Resetting the WMI counters
271
Testing remote WMI connectivity
272
Remotely testing WMI on the target server
272
Verifying the administrator credentials
273
Enabling Remote Procedure Call (RPC)
274
Verifying the firewall settings
276
Adding the Windows Firewall snap-in
276
Enabling the core networking rules
277
Enabling the Windows Management Instrumentation (DCOM-In) rule
277
Creating a new firewall rule to open the RPC ports
278
Disabling ping discovery
280
Configuring Virtualization Manager to identify ESX hosts by name
280
Configuring Distributed Component Object Model (DCOM) and User Account Control
(UAC)
281
Enabling DCOM
282
Enabling account privileges in WMI
283
Disabling remote User Account Control for workgroups
284
Verifying credentials in Virtualization Manager
Testing the connection between the Hyper-V host and Virtualization Manager
284
285
Adding a new discovery job
285
Running an existing discovery job
286
Appendix B: Using PowerCLI
287
16
Table of Contents
Installing PowerShell
287
Connecting to Virtualization Manager
288
Searching in Virtualization Manager
288
Using configuration item references
289
Working with the vSphere PowerCLI
289
Cmdlets and scripts
289
Scripts
290
Using cmdlets
292
Appendix C: Using Perl SDK
305
Module installations
305
Downloading the Perl Client
305
Using the Perl Client
306
Writing your first script
306
Scripting tips
308
Using the provided example
308
17
SolarWinds Virtualization Manager Administrator Guide
SolarWinds Virtualization Manager
Administrator Guide
About SolarWinds
SolarWinds, Inc. develops and markets an array of IT management, monitoring,
and discovery tools to meet the diverse requirements of today’s IT management
and consulting professionals. SolarWinds products continue to set benchmarks
for quality and performance and have positioned the company as the leader in IT
management and discovery technology. The SolarWinds customer base includes
over 85 percent of the Fortune 500 and customers from over 170 countries. Our
global business partner distributor network exceeds 100 distributors and
resellers.
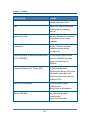
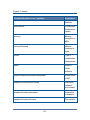
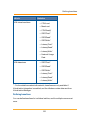
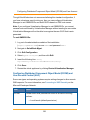
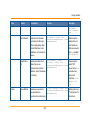
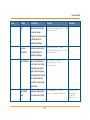
Contacting SolarWinds
You can contact SolarWinds in a number of ways, including the following:
Team
Contact Information
Sales
1.866.530.8100
http://www.solarwinds.com/
Technical http://www.solarwinds.com/support (you need a customer account
Support
to access the Customer Support area of the website.)
User
Forums
http://www.thwack.com/
18
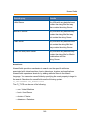
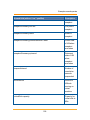
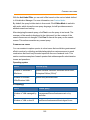
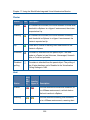
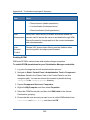
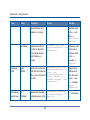
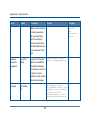
Conventions
Conventions
The documentation uses consistent conventions to help you identify items
throughout the printed and online library.
Convention
Specifying
Bold
Window items, including buttons and fields
Italics
Book and CD titles, variable names, new terms
Fixed font
File and directory names, commands and code
examples, text typed by you
Straight brackets, as
in [value]
Optional command parameters
Curly braces, as in
{value}
Required command parameters
Logical OR, as in
value1|value2
Exclusive command parameters where only one of the
options can be specified
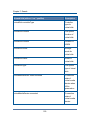
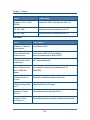
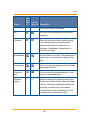
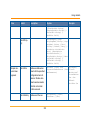
SolarWinds Virtualization Manager
Documentation Library
The following documents are included in the SolarWinds Virtualization Manager
documentation library:
Document
Purpose
Administrator Provides detailed setup, configuration, and conceptual
Guide
information.
19
Helpful tips and tricks
Release
Notes
Provides late-breaking information, known issues, and updates.
The latest Release Notes can be found at
http://www.solarwinds.com.
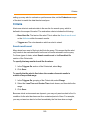
Helpful tips and tricks
l
When you are building usage trends from scratch, you can base new trends
on already existing ones. Choose a trend under Explore > Content, and
then modify the evaluation criteria to suit your needs. For more information
about creating trends, see Creating trends.
l
l
l
l
You can set up a default dashboard for users in order to control what
information they have access to. For information about setting up default
dashboards, see Dashboard basics.
To provide users with custom dashboards while preventing them from
modifying dashboards, make the dashboards world readable only. For more
information, see Dashboards.
If you do not need a particular alert but you think you might need it later, you
can disable the alert instead of removing it completely. For information
about disabling alerts, see Alerts.
You can build alerts based on complex search queries. For information
about building and modifying search queries, see Searching for objects in
Virtualization Manager.
20
Chapter 1: Introduction
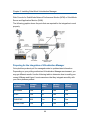
SolarWinds Virtualization Manager offers an easy-to-use, scalable virtualization
management solution whose resources can also be integrated with other
SolarWinds products on the Orion platform.
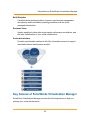
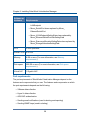
SolarWinds Virtualization Manager provides visibility into virtual machines and
their support infrastructure. It acts as a single pane of glass through which virtual
infrastructure administrators can view the internal configuration and state of the
services that comprise the virtualized workloads running atop virtual
infrastructure, along with the supporting computing environment to capture a
holistic representation of the evolution and movement of VMs within the
infrastructure.
In addition, real-time and historical information is aggregated within an advanced
visualization interface to present a structured representation of previously
unstructured uncorrelated data.
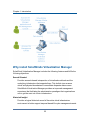
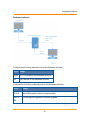
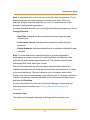
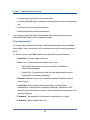
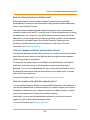
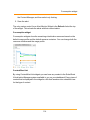
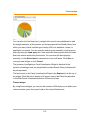
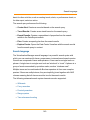
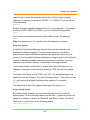
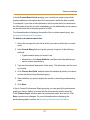
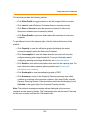
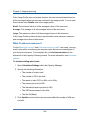
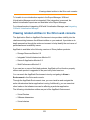
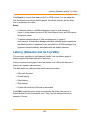
The following graphic provides a basic outline of the Virtualization Manager
architecture.
21
Chapter 1: Introduction
Why install SolarWinds Virtualization Manager
SolarWinds Virtualization Manager includes the following features and fulfills the
following objectives.
Search Oriented
Provides a search-based introspection of virtualized workloads and the
underlying infrastructure that supports them. This holistic view crosses
virtual and physical boundaries to consolidate disparate data sources.
SolarWinds Virtualization Manager provides an improved management
experience that facilitates the administration paradigms that organizations
use to get the most out of their infrastructure.
Historical Insight
Provides a logical historical record of the entire virtual infrastructure
environment to better support temporal-based life cycle management needs.
22
Key features of SolarWinds Virtualization Manager
Multi-Discipline
Facilitates broad problem isolation, forensics, performance management,
and capacity and consolidation planning processes over the entire
managed infrastructure.
Business Views
Applies analytics to show data center trends, performance correlations, and
pie chart visualizations of your virtual infrastructure.
Actionable Interface
Provides an actionable interface to all of the information sources to support
remediation-based administration models.
Key features of SolarWinds Virtualization Manager
SolarWinds Virtualization Manager provides the following features to help you
manage your virtual infrastructure:
23
Chapter 1: Introduction
l
l
l
Real-time dashboards for forecasting, detecting, and troubleshooting
capacity bottlenecks
Integrated capacity planning for VMware and Microsoft Hyper-V
Integration with SolarWinds Server & Application Monitor (SAM) and Orion
Network Performance Monitor (NPM)
l
Performance monitoring
l
Chargeback and showback automation
l
Virtualization configuration management
l
Virtualization dashboards
l
Performance alerts
l
Performance monitoring and management
24
Chapter 2: Installing SolarWinds
Virtualization Manager
This topic contains information about the installation and uninstallation
procedures for SolarWinds Virtualization Manager. The information is organized
into the following sections:
l
Minimum requirements
l
Installing Virtualization Manager as a virtual appliance
l
Installing the Integrated Virtual Infrastructure Monitor (IVIM)
l
Upgrading an existing virtual appliance
l
Updating an existing Windows installation
l
Migrating from an existing virtual appliance to a new virtual appliance
l
Installing, updating and uninstalling a federated collector
l
Licensing
Minimum requirements
This section provides information about software and hardware requirements.
Before you proceed with the installation procedures, make sure your hardware
and software meet the following minimum requirements.
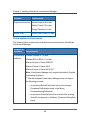
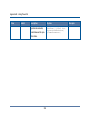
Browser requirements
SolarWinds Virtualization Manager is a web-based product that has the following
browser requirements.
25
Chapter 2: Installing SolarWinds Virtualization Manager
Software
Requirements
Supported browsers Internet Explorer 8 or later
Mozilla Firefox 3.5 or later
Google Chrome 8 or later
Adobe Flash
Adobe Flash Player 9 or later
Virtual appliance requirements
The following table contains the virtual appliance requirements for SolarWinds
Virtualization Manager.
Software or
hardware
Requirements
Virtualization VMware vSphere 4.1 or later
software
VMware ESX or ESXi 4.1 or later
Microsoft Hyper-V Server 2008 R2
Microsoft Hyper-V Server 2012
Microsoft Hyper-V Server 2012 R2***
Note: Virtualization Manager only supports the default, English
localization of Hyper-V.
***With this software Virtualization Manager does not support
the following counters:
l
l
vm.processorSocketCount (as a result of the missing
ProcessorsPerSocket property in the Msvm_
ProcessorSettingData class)
vm.processorCoresPerSocket (as a result of the missing
SocketCount property in the Msvm_ProcessorSettingData
class)
26
Virtual appliance requirements
Software or
hardware
Requirements
l
l
l
vm.processorCount (as a result of the previous two
missing properties)
host.vSwitch.maxChimneyOffloads (as a result of the
missing MaxChimneyOffloads property in the Msvm_
VirtualSwitch class)
host.vSwitch.numLearnableAddresses (as a result of the
missing NumLearnableAddresses property in the Msvm_
VirtualSwitch class)
l
l
l
host.vSwitch.port.accessVlan (as a result of the missing
AccessVLAN property in the Msvm_
VLANEndpointSettingData class)
host.vSwitch.port.defaultVLAN (as a result of the missing
DefaultVLAN property in the Msvm_
VLANEndpointSettingData class)
host.vSwitch.port.nativeVLAN (as a result of the missing
NativeVLAN property in the Msvm_
VLANEndpointSettingData class)
The following are class replacements for configuration and
performance collections against 2012 R2 servers:
l
l
l
Msvm_SwitchLANEndpoint class replaced by Msvm_
LANEndpoint
Msvm_VirtualSwitch class replaced by Msvm_
VirtualEthernetSwitch
Msvm_VmLANEndpoint class replaced by Msvm_
27
Chapter 2: Installing SolarWinds Virtualization Manager
Software or
hardware
Requirements
LANEndpoint
l
l
l
Msvm_SwitchPort class replaced by Msvm_
EthernetSwitchPort
Msvm_VLANEndpointSettingData class replaced by
Msvm_EthernetSwitchPortVlanSettingData
Msvm_ResourceAllocationSettingData class replaced by
Msvm_StorageAllocationSettingData
CPU
2 GHz quad-core
Virtual CPUs 4 vCPUs
Memory
8 GB or more (For more information, see Memory
requirements.)
Disk space
200 GB or more (For more information, see Disk space
requirements.)
Virtual NIC
1 Gigabit vNIC
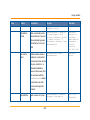
Port requirements
The port requirements of SolarWinds Virtualization Manager depend on the
features and components that you use. The features and components on which
the port requirements depend are the following:
l
VMware data collection
l
Hyper-V data collection
l
AD/LDAP authentication
l
Sending email notifications (used in alerting and reporting)
l
Sending SNMP traps (used in alerting)
28
Master appliance
l
Orion integration
l
Federated collectors
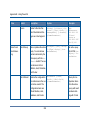
Master appliance
Configure the following inbound ports for communication with the Virtualization
Manager master appliance.
Port
Usage
443 or Performing auto-upgrade or version upgrade on federated col80
lectors, if federated collectors are configured.
29
Chapter 2: Installing SolarWinds Virtualization Manager
Port
Usage
8983
Access from federated collectors to the master appliance during initial setup.
443
HTTPS access to the Virtualization Manager user interface.
5480
HTTPS access to the Management Console.
61616 For Active MQ master-collector communication.
22
SSH access to the virtual appliance.
Configure the following outbound ports, depending on the individual setup and
the functions you use.
Port
Usage
162
Sending SNMP traps.
25
Sending emails through SMTP.
389
Active Directory authentication.
3268
LDAP authentication.
17778 Communication with the SolarWinds Orion server if the integration
with Orion is enabled.
123
Using the NTP service.
30
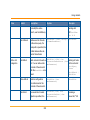
Federated collector
Federated collector
Configure the following inbound ports on the federated collector.
Port
Usage
5480 HTTPS access to the federated collector.
22
SSH access to the federated collector.
Configure the following outbound ports on the federated collector.
Port
Usage
61616
Active MQ master-collector communication.
443 or
80
Performing auto-upgrade or version upgrade.
31
Chapter 2: Installing SolarWinds Virtualization Manager
Port
Usage
8983
Access from federated collectors to the master appliance during initial setup.
Data collection
Depending on the environment you poll, configure the following outbound ports
on the master or the collector for data collection.
Port
Usage
443
Data collection from ESX hosts and vCenters.
7
Access to Hyper-V hosts that were added by using a fully qualified domain name.
135
WMI data collection from Hyper-V hosts or VMs.
Dynamic RCP WMI communication. You can configure the available ports on
ports
the WMI target/policy.
32
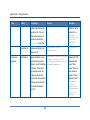
Memory requirements
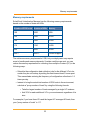
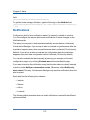
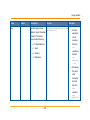
Memory requirements
SolarWinds Virtualization Manager has the following memory requirements
based on the number of hosts and VMs.
Number of ESX hosts Number of VMs Memory
100
1000
8 GB
125
1250
10 GB
150
1500
12 GB
175
1750
14 GB
200
2000
16 GB
200 <
2000 <
Contact Support
The minimum memory requirement is 8 GB, but your deployment may require
more to handle peak memory demands. If certain conditions are met, you can
reduce the memory requirement for collecting from multiple vCenters (VC) in the
following ways:
l
l
Schedule the configuration data collection jobs for the different VCs to be
certain they do not overlap, by setting the start times at least 3 hours apart.
This necessitates reducing the frequency of configuration collection to 1-2
times per day.
Instead of using the actual total number of ESX hosts in the environment,
calculate a "proxy number of hosts” by using the following formula:
l
l
Take the largest number of hosts managed by a single VC instance.
Add 15% for each additional VC in your environment, regardless of its
size.
For example, if you have three VCs and the largest VC manages 90 hosts, then
your "proxy number of hosts" is 117.
33
Chapter 2: Installing SolarWinds Virtualization Manager
117 = 90 + 0.15 x 90 + 0.15 x 90
The number of ESX hosts above is guidance only, and is based on a typical
corporate IT virtualization environment with approximately 10 VMs and one
datastore per ESX host server. Higher density environments require larger
memory sizes.
Disk space requirements
At least 200 GB of disk space is recommended so that you do not run out of
storage too soon. At the default collection interval, a virtualized environment
containing 1000 VMs and 100 hosts typically requires 40 GB of storage during the
first month, and then an additional 60 GB of storage over the next five years.
To more accurately estimate the disk space you will require over time, download
the SolarWinds Virtualization Manager Storage Calculator.
Expanding the provisioned disk size
The VMware appliance may allow thin provisioning as an option to let you install
with less than 200 GB of free disk space, but you will eventually exhaust the
available space. SolarWinds Virtualization Manager stops collecting data when
less than 1 GB of storage remains. At that point, you must increase the available
storage, and then change the provisioned size or the virtual hard disk.
To expand the provisioned size:
1. Increase the provisioned size of Hard disk 2 of the appliance.
a. Run the vSphere client, and then connect to the vCenter that is
hosting the appliance.
b. Select the SolarWinds Virtualization Manager appliance from the list
on the left.
c. Click Inventory > Virtual Machine > Edit Settings.
d. Select Hard disk 2 from the Hardware list.
34
VMware account permissions
e. Increase the Provisioned Size to the size you want.
f. Click OK.
2. Restart the appliance virtual machine.
To expand the disk on Microsoft Hyper-V, contact SolarWinds Technical Support.
VMware account permissions
SolarWinds Virtualization Manager can collect data from a VMware environment
with any combination of the following:
l
VMware vSphere 4.1+
l
VMware ESX or ESXi 4.1+ managed or unmanaged hosts
The VMware user account used for data collection must have at least Read-Only
permissions for the host and VMs you want to monitor.
To collect information about data stores, the account must also have the Browse
Datastore permission.
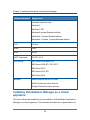
SolarWinds Integrated Virtual Infrastructure Monitor Requirements
The following table lists the minimum software requirements and
recommendations for a SolarWinds Integrated Virtual Infrastructure Monitor
installation.
Software/Hardware Requirement
Operating System
Windows Server 2003 R2 SP2 (32-bit and 64-bit)
Windows Server 2008, 2008 SP2, 2008 R2 and 2008
R2 SP1
Windows Server 2012, 2012 R2
The following operating systems are supported for
35
Chapter 2: Installing SolarWinds Virtualization Manager
Software/Hardware Requirement
evaluation purposes only:
Windows 7
Windows 7 SP1
Windows 8 (except Standard edition)
Windows 8.1 (except Standard edition)
Windows 8.1 Update 1 (except Standard edition)
CPU
3.0 GHz
RAM
8 GB
HDD
20 GB
.NET Framework
3.5 SP1, 4.0.3
SQL Server
SQL Server 2008 without SP
SQL Server 2008 SP1, SP2, SP3
SQL Server 2012
SQL Server 2012 SP1
SQL Server 2014
Browser
Internet Explorer version 8 or later
Mozilla Firefox two latest versions
Google Chrome two latest versions
Installing Virtualization Manager as a virtual
appliance
This topic outlines the installation and uninstallation of SolarWinds Virtualization
Manager as a virtual appliance. The interfaces described are a representation of
36
Installing Virtualization Manager on VMware vSphere 4.1 or later
the screens available within the vSphere, or Hyper-V client, but can differ slightly
based on version.
The SolarWinds Virtualization Manager appliance is available in two versions:
.ova file
for use with vSphere 4.1 and higher
Hyper-V .zip file
for use with Hyper-V server
The following sections describe the typical installation steps and requirements for
different versions of the virtual appliance.
l
Installing Virtualization Manager on VMware vSphere 4.1 or later
l
Installing Virtualization Manager on Microsoft Hyper-V Server 2008
l
Installing Virtualization Manager on Microsoft Hyper-V Server 2012
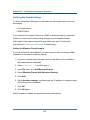
Installing Virtualization Manager on VMware vSphere 4.1 or later
Complete the following procedure to install Virtualization Manager on VMware
vSphere 4.1 or later.
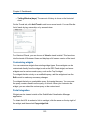
1. Extract the contents of the VSphere .zip file.
2. Run the VMware vSphere Client, and then log on with administrator
privileges.
3. Click File > Deploy OVF Template.
4. Click Browse to select the .ova file you extracted, and then click Next.
5. Click Next again.
6. Type a name for the virtual appliance, select a location for it in the Inventory
panel, and then click Next.
7. Select a resource pool, and then click Next.
8. Select either Thin-provisioned format or Thick provisioned format, and
then click Next.
Note: Thin provisioning lets you install with less than 100 GB of disk space
37
Chapter 2: Installing SolarWinds Virtualization Manager
free, but you will eventually exhaust this. For more information, see Disk
space requirements.
9. Select a network, and then click Next.
10. To use DHCP to determine the IP address of the appliance, click DHCP,
and then click Next.
11. To use a fixed IP address from the network pool, follow these steps:
a. Click Fixed, and then click Next.
b. Enter the fixed IP to reserve for the appliance, and then click Next.
12. Click Finish.
13. Open a browser to https://IPaddress:5480 where IPaddress is the
address of the virtual appliance server.
14. Log in, and then accept the End User License Agreement. The default
account is admin with the password admin.
15. Click Network, and then click Address.
16. If you use DHCP to determine the IP address of the appliance, verify that it
is selected.
17. If you use a static IP address, complete the following steps:
a. Enter the static IP of the virtual appliance.
b. Enter the net mask.
c. Enter the gateway.
d. Enter the DNS Server 1.
e. Enter the DNS Server 2.
f. Enter a host name to use for the virtual appliance.
g. Click Save Settings.
18. Click Proxy and enter proxy server information if necessary, and then click
Save Settings.
38
Installing Virtualization Manager on Microsoft Hyper-V Server 2008
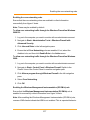
Installing Virtualization Manager on Microsoft Hyper-V Server 2008
This topic outlines the installation of SolarWinds Virtualization Manager as a
Microsoft Hyper-V virtual appliance on Windows Server 2008. The interfaces
described are a representation of the screens available within the Hyper-V
Manager, but can differ slightly based on version. The Windows server must
already be configured as described in Minimum requirements.
Complete the following procedure to install Virtualization Manager on Microsoft
Hyper-V Server 2008.
1. Extract the contents of the Hyper-V .zip file to a permanent location.
Note: After the virtual machine is imported, the location of the extracted files
cannot be changed.
2. Launch the Hyper-V Manager.
3. Connect to the appropriate Hyper-V server.
4. In the Action menu, select Import Virtual Machine.
5. Click Browse to select the folder of the extracted .zip file. By default, it is
Virtualization-Manager-HyperV-version.
6. Select Copy the virtual machine.
7. Click Import.
8. Right-click the virtual appliance, and then select Settings.
9. Select Network Adapter.
Note: Using a Legacy Network Adapter may cause degradation in network
connection: the web application might become inaccessible or the SSH
connection may break down. To verify that your network adapter is working
correctly, connect to the Virtualization Manager appliance by using the
Hyper-V Manager, and then run the ifconfig command. If the output of the
command shows that there are no dropped packets, the network adapter is
working correctly.
10. Specify the network settings the VM should use.
39
Chapter 2: Installing SolarWinds Virtualization Manager
11. Click OK.
12. Start the VM.
13. Right-click the virtual appliance in the inventory, and then click Connect.
14. Select Set Timezone and ensure that the appliance is set to the same time
zone as the Hyper-V host server.
15. Use the arrow keys to select Configure Network, and then press enter.
16. If you use DHCP to determine the IP address of the appliance, type 'y' when
prompted with the "Use a DHCP Server instead of a static IP address?"
question.
17. If you use a static IP address, complete the following steps:
a. Type 'n' when prompted with the "Use a DHCP Server instead of a
static IP address?" question.
b. Enter the static IP of the virtual appliance.
c. Enter the net mask.
d. Enter the gateway.
e. Enter the DNS Server 1.
f. Enter the DNS Server 2.
g. Enter a host name to use for the virtual appliance.
18. Enter proxy server information if necessary.
19. Type 'y' when prompted with the "Is this correct?" question.
20. Open a browser to http://IPaddress, where IPaddress is the address
shown in the console.
21. Log in, and then accept the End User License Agreement. The default
account is admin with the password admin.
40
Installing Virtualization Manager on Microsoft Hyper-V Server 2012
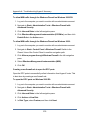
Installing Virtualization Manager on Microsoft Hyper-V Server 2012
This topic outlines the installation of SolarWinds Virtualization Manager as a
Microsoft Hyper-V virtual appliance on Windows Server 2012. The interfaces
described are a representation of the screens available within the Hyper-V
Manager, but can differ slightly based on version. The Windows server must
already be configured as described in Minimum requirements.
Complete the following procedure to install Virtualization Manager on Microsoft
Hyper-V Server 2012.
1. Extract the contents of the Hyper-V .zip file.
2. Launch the Hyper-V Manager.
3. Connect to the appropriate Hyper-V server.
4. In the Action menu, select Import Virtual Machine.
5. If this is the first time you have imported a virtual machine, or if you have not
dismissed the Before You Begin screen, click Next.
6. Click Browse to select the folder of the extracted .zip file. By default, it is
Virtualization-Manager-HyperV-version.
7. Click Next.
8. Select "Virtualization-Manager" on the import screen.
9. Select Copy the virtual machine (create a new unique ID), and then click
Next.
10. To install the VM files in the default location, click Next.
11. To install the VM files in a different location, select Store the virtual
machine in a different location, and then click Browse to change folders.
Click Next.
12. Click Browse to choose where you want to store the virtual machine files,
and then click Next.
13. Review your selections, and then click Finish.
41
Chapter 2: Installing SolarWinds Virtualization Manager
14. Right-click the virtual appliance, and then select Settings.
15. Select Network Adapter.
Note: Using a Legacy Network Adapter may cause degradation in network
connection: the web application might become inaccessible or the SSH
connection may break down. To verify that your network adapter is working
correctly, connect to the Virtualization Manager appliance by using the
Hyper-V Manager, and then run the ifconfig command. If the output of the
command shows that there are no dropped packets, the network adapter is
working correctly.
16. Specify the network settings the VM should use.
17. Click OK.
18. Start the VM.
19. Right-click the virtual appliance in the inventory, and then click Connect.
20. Select Set Timezone and ensure that the appliance is set to the same time
zone as the Hyper-V host server.
21. Open a browser to https://IPaddress:5480 where IPaddress is the
address of the virtual appliance server.
22. Log in, and then accept the End User License Agreement. The default
account is admin with the password admin.
23. Click Network, and then click Address.
24. If you use DHCP to determine the IP address of the appliance, verify that it
is selected.
25. If you use a static IP address, complete the following steps:
a. Enter the static IP of the virtual appliance.
b. Enter the net mask.
c. Enter the gateway.
d. Enter the DNS Server 1.
42
Uninstalling Virtualization Manager
e. Enter the DNS Server 2.
f. Enter a host name to use for the virtual appliance.
g. Click Save Settings.
26. Click Proxy and enter proxy server information if necessary, and then click
Save Settings.
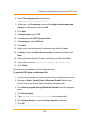
Uninstalling Virtualization Manager
This topic outlines the uninstallation procedure of Virtualization Manager.
Warning: The deletion is irreversible. Deleting the master appliance also deletes
the database. If you want to keep your database for later use, do not delete the
appliance.
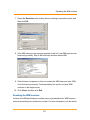
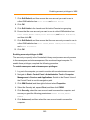
To uninstall a Virtualization Manager appliance:
1. If you have Virtualization Manager integrated with the SolarWinds Orion
server, open the Settings page of the Orion web console.
2. In the Settings grouping, click Virtualization Settings.
3. Click Setup Virtualization Manager integration.
4. Select Disable Integration.
5. After the integration with the SolarWinds Orion server is removed, turn off,
and then delete the federated collectors and the master appliance.
For information about uninstalling federated collectors, see Uninstalling a
federated collector.
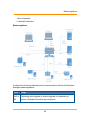
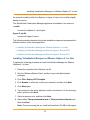
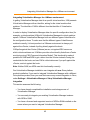
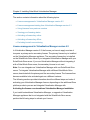
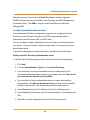
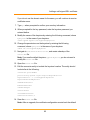
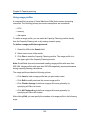
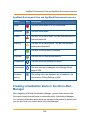
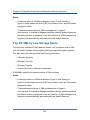
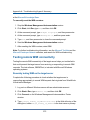
Installing the Integrated Virtual Infrastructure
Monitor (IVIM)
SolarWinds Virtualization Manager uses the Integrated Virtual Infrastructure
Monitor (IVIM) to integrate some Virtualization Manager resources into the Orion
43
Chapter 2: Installing SolarWinds Virtualization Manager
Web Console for SolarWinds Network Performance Monitor (NPM) or SolarWinds
Server and Application Monitor (SAM).
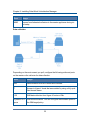
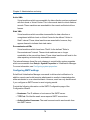
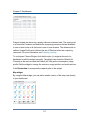
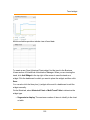
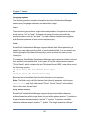
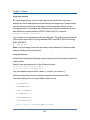
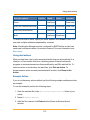
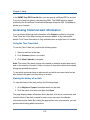
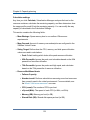
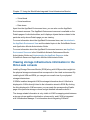
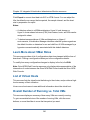
The following graphic shows the ports that are required for the integration to work
properly.
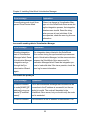
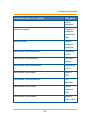
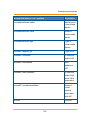
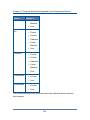
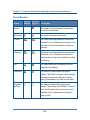
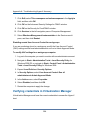
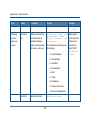
Preparing for the integration of Virtualization Manager
Orion platform products poll for managed nodes to update status information.
Depending on your polling method and Virtualization Manager environment, you
may get different results. Use the following table to determine how to modify your
current VMware and Hyper-V environments so that they integrate smoothly with
your Orion platform product.
Orion polling
method
VMware
(Host)
Hyper-V
(Host)
VMware
(Guest)
Hyper-V
(Guest)
No Status
Yes
No
Yes
Yes
ICMP
Yes
No
Yes
Yes
WMI/ICMP
N/A
Yes
Yes
Yes
SNMP/ICMP
Yes
No
Yes
Yes
44
Integrating Virtualization Manager for a VMware environment
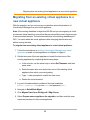
Integrating Virtualization Manager for a VMware environment
In getting Virtualization Manager data for a specific virtual machine, IVIM presents
Virtualization Manager with an identifier, asking for the virtual machine that
matches. The identifier of IVIM is different from the identifier of Virtualization
Manager.
In order to display Virtualization Manager data of a specific configuration item (for
example, a virtual machine) VIM polls Virtualization Manager for virtual machine
equals. IVIM and Virtualization Manager both use different types of identifiers for
the configuration items. To make sure that the different types of identifiers are
matched correctly, it is best practice in a VMware environment to always poll
against the vCenter, instead of polling directly against the hosts.
IVIM polls against the vCenter (VMware) server, not against ESX servers on
which virtual machines run. IVIM also provides a functionality that allows vCenter
monitoring using CIM (Common Information Model). This functionality makes it
possible for SAM and NPM to get a token from the vCenter instead of using the
credentials for the hosts, and use CIM to collect data even if you poll against the
vCenter, and not against the hosts.
Note: Neither SAM, nor NPM uses this functionality currently.
One Virtualization Manager installation can integrate with one Orion platform
product installation. If you want to integrate Virtualization Manager with a different
Orion platform product, then you must first remove any current integration in Orion,
under Settings > Virtualization Manager > Setup Virtualization Manager
Integration.
This section assumes the following:
l
l
You have already completed the installation and setup process of
Virtualization Manager.
You are ready to integrate your existing Virtualization Manager instance
with NPM or SAM.
l
You have a licensed and supported version of NPM or SAM installed on the
server where you want to integrate Virtualization Manager.
45
Chapter 2: Installing SolarWinds Virtualization Manager
For information about installing NPM, see the SolarWinds Network Performance
Monitor Administrator Guide. For information about installing SAM, see the
SolarWinds Server and Application Manager Administrator Guide.
Note: If you do not have NPM or SAM installed, you can integrate IVIM with your
Virtualization Manager instance. For information about installing and integrating
IVIM with Virtualization Manager, see Installing the SolarWinds Integrated Virtual
Infrastructure Monitor in standalone mode.
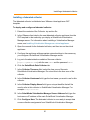
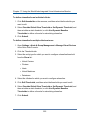
To integrate Virtualization Manager with a compatible SolarWinds product:
1. On the server where your compatible SolarWinds product is installed,
launch the SolarWinds IVIM installer.
a. Type YES to indicate that you are aware of the recommendation to
back up your existing Orion product database before installing the
Virtualization Manager integration.
b. Click to accept the License Agreement.
c. Allow the installer to copy files, and then click through the remaining
prompts. The configuration wizard starts after the installation is
finished.
d. Adjust the database and database server as the targets for adding
modules if they are not your current Orion product database and
database server.
e. Accept the default (All Unassigned Ports) as the target for adding
website modules.
f. Accept the Service Settings (VIM Collector Plugin, VIM Job Engine
Plugin).
g. Choose to launch the Orion Web Console, and then log in.
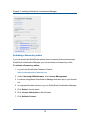
2. Navigate to Settings > Discovery Central if logging into the console does
not automatically land you there.
46
Installing the SolarWinds Integrated Virtual Infrastructure Monitor in standalone
3. Under Virtualization Discovery, click Discover My Network, and then
complete the wizard.
4. Click Settings > Virtualization Settings.
5. Click Setup Virtualization Manager Integration.
6. Enter the appropriate information about your Virtualization Manager
instance.
a. Enter the host name or IP address of the Virtualization Manager
server.
Note: To access the network settings for the Virtualization Manager
appliance server, use a browser to navigate to https://ip_
address:5480. From this page you can review and adjust network
settings, including the interface on the server through which
Virtualization Manager communicates, the use of a static IP address
instead of DHCP (default), the use of a proxy server, and the primary
and secondary DNS servers.
b. Enter the port number on which Virtualization Manager expects to
service web requests. The default port is 443.
c. Enter the user name and password with which you can access the
Virtualization Manager web console.
7. Click Submit.
Installing the SolarWinds Integrated Virtual Infrastructure Monitor
in standalone mode
Before installing the SolarWinds Integrated Virtual Infrastructure Monitor, make
sure that your computer meets the system requirements. For more information,
see SolarWinds Integrated Virtual Infrastructure Monitor Requirements.
47
Chapter 2: Installing SolarWinds Virtualization Manager
To install the SolarWinds Integrated Virtual Infrastructure Monitor in
standalone mode:
1. Log on as an administrator to the SolarWinds server on which you want to
install the SolarWinds Integrated Virtual Infrastructure Monitor.
2. Launch the executable file.
l
l
If you downloaded the product from the SolarWinds website, navigate
to the download location, and then launch the executable file. You
may need to run the file as an administrator.
If you received physical media, browse to the executable file, and then
launch the executable file. You may need to run the file as an
administrator.
3. If you are prompted to install any required components, such as Microsoft
.NET Framework, click Install, and then complete the component
installation, including a reboot, if required.
Notes:
l
l
Downloading and installing Microsoft .NET Framework may take more
than 20 minutes, depending on your existing system configuration.
If a reboot is required, click Install after restarting the computer to
resume the installation.
4. Review the Welcome text. To use the SolarWinds Improvement Program to
send anonymous data about your application usage, select Send usage
statistics, and then click Next.
5. Select your preferred language, and then click Next.
6. If another SolarWinds Orion product is already installed, type YES to indicate
that you are aware of the recommendation to back up your existing Orion
product database before installing the SolarWinds Integrated Virtual
Infrastructure Monitor, and then click Next.
7. Accept the license agreement, and then click Next.
48
Integrating IVIM with Virtualization Manager
8. Select the file system folder where you want to install SolarWinds Integrated
Virtual Infrastructure Monitor, and then click Next.
9. Click Next on the Start Copying Files window.
10. Click Finish to close the installation wizard.
11. The SolarWinds Configuration Wizard is launched automatically. Click Next
on the Welcome window to continue the basic configuration. For more
information about completing the configuration wizard, see the SolarWinds
Network Performance Monitor Administrator Guide.
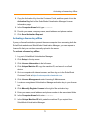
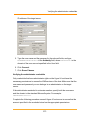
Integrating IVIM with Virtualization Manager
After finishing the configuration of the Integrated Virtual Infrastructure Monitor, log
in to the Orion web console. You will be prompted to integrate IVIM with
Virtualization Manager.
To perform the integration, complete the following steps:
1. Enter the appropriate information about your Virtualization Manager
instance.
a. Enter the host name or IP address of the Virtualization Manager
server.
Note: To access the network settings for the Virtualization Manager
appliance server, use a browser to navigate to https://ip_
address:5480. From this page you can review and adjust network
settings, including the interface on the server through which
Virtualization Manager communicates, the use of a static IP address
instead of DHCP (default), the use of a proxy server, and the primary
and secondary DNS servers.
b. Enter the port number on which Virtualization Manager expects to
service web requests. The default port is 443.
c. Enter the credentials of the administrator user with which you can
access the Virtualization Manager web console.
49
Chapter 2: Installing SolarWinds Virtualization Manager
2. Click Submit.
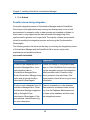
Possible issues during integration
During the integration process of Virtualization Manager and the SolarWinds
Orion server, both applications keep running, and changes may occur in both
environments, for example, nodes or data sources can be added or deleted. In
these cases, it may happen that the data collected at the beginning of the
synchronization process is no longer valid. The majority of these issues can be
solved by resetting the integration process, and running the Synchronization
Wizard again.
The following sections list the errors that may occur during the integration process
of Virtualization Manager and the SolarWinds Orion server, and provide
explanations and possible solutions.
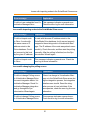
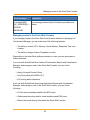
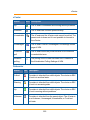
Issues with credentials
Error message
Explanation
Could not use credentials from Virtualization Manager/Orion. Incorrect integration data in
Virtualization Manager/Orion.
Reset Virtualization Manager integration and go through the Syn-
If there is a change in Virtualization Manager or in the SolarWinds Orion server during the integration process, the integration
data becomes invalid. Reset the integration process to load valid data. If the
issue persists, check the error log for more
chronization Wizard again.
information.
Could not use credentials from Virtualization Manager/Orion. Reset
Virtualization Manager integration
and go through the Synchronization Wizard again. If this
There is inconsistency in the database.
Data related to processed nodes is missing. Use the Database Maintenance tool
to clean up the database, and then reset
the integration process.
error persists, check the error log
for more information.
50
Issues with importing nodes to the SolarWinds Orion server
Error message
Explanation
Could not use credentials from Vir- This message indicates a general error.
tualization Manager/Orion.
Check the error log for more information.
Issues with importing nodes to the SolarWinds Orion server
Error message
Explanation
Could not import node
to Orion. A node with
A node with the same IP address exists in the
SolarWinds Orion database, but it was not properly
the same name or IP
address exists in the
Orion database. Could
not connect to this host
by the given IP address.
mapped to the existing node in Virtualization Manager. The IP address of the node was probed unsuccessfully. Check the node, and then start the polling
manually. After the polling is finished, run the Synchronization Wizard again.
Could not import node
to Orion.
This message indicates a general error. Check the
error log for more information.
Issues with changing the polling source
Error message
Explanation
Could not change Polling source
to Virtualization Manager/Orion.
If there is a change in Virtualization Manager or in the SolarWinds Orion server dur-
Incorrect integration data in Virtualization Manager. Reset Virtualization Manager integration
and go through the Synchronization Wizard again.
ing the integration process, the integration
data becomes invalid. Reset the integration process to load valid data. If the
issue persists, check the error log for more
information.
Could not change Polling source
This message indicates a general error.
to Virtualization Manager/Orion.
Check the error log for more information.
51
Chapter 2: Installing SolarWinds Virtualization Manager
Error message
Explanation
Reconfiguring node to poll from
parent Virtual Center failed.
If there is a change in Virtualization Manager or in the SolarWinds Orion server during the integration process, the integration
data becomes invalid. Reset the integration process to load valid data. If the
issue persists, check the error log for more
information.
Issues with sending data to Virtualization Manager
Error message
Explanation
Sending integration
data to Virtualization
Manager failed. Reset
Virtualization Manager
integration and go
through the Synchronization Wizard
again.
The integration data collected in the SolarWinds
Orion server during the synchronization process was
sent to Virtualization Manager, but the communication
between the SolarWinds Orion server and Virtualization Manager failed. Reset the integration process to load valid data. If the issue persists, check the
error log for more information.
Issues with the probe job
Error message
Explanation
Could not connect
to node [NAME] ([IP
address]) using credential '[Credential
name]'.
This is an informational message that indicates that the
connection to the IP address is successful, but the credential is invalid. The node will be added to the
SolarWinds Orion server, but you should verify the node
and its credential.
Could not connect
The connection to the IP address is unsuccessful. The
52
Managing nodes in the Orion Web Console
Error message
Explanation
to node [NAME]
([IP_ADDRESS]). +
ERROR
MESSAGE
error message returned by the Probe job provides more
details.
Managing nodes in the Orion Web Console
If you manage a node in the Orion Web Console as an addition to managing it in
Virtualization Manager, you can make use of the following features:
l
l
The ability to monitor CPU, Memory, Virtual Memory, Response Time, and
Latency.
The ability to assign Custom Properties to nodes.
Depending on the other Orion platform products you own, you can get access to
further resources.
If you use both SolarWinds Orion Network Performance Monitor and Virtualization
Manager, and manage a node in the Orion Web Console, you can do the
following:
l
Apply Universal Device Pollers.
l
Use Device Kits (with NPM v10.7).
l
Pull routing table information.
If you use both SolarWinds Server and Application Monitor and Virtualization
Manager, and manage a node in the Orion Web Console, you can do the
following:
l
Poll the server hardware health of the ESX hosts.
l
Gather asset inventory data for virtual machines and ESX hosts.
l
Reboot the server directly from within the Orion Web Console.
53
Chapter 2: Installing SolarWinds Virtualization Manager
l
l
Leverage the Real-Time Event Log Viewer, the Real-Time Process
Explorer, and the Service Control Manager.
Use network interface monitoring (for Windows only).
Upgrading an existing virtual appliance
To upgrade from Virtualization Manager 5.x to 6.x, you must first upgrade to
Virtualization Manager 5.1.1, and then upgrade to 6.x from that version.
The following sections provide information about upgrading in different
environments, and about the additional steps that are necessary after the
upgrade.
l
Upgrading on vSphere 4.1 or later
l
Upgrading on Hyper-V
l
Additional upgrade steps for AD/LDAP authentication
l
Activating the license
Upgrading on vSphere 4.1 or later
The appliance upgrade comes as an .iso file for use with the vSphere or vCenter
client.
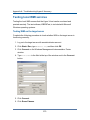
To upgrade Virtualization Manager on vSphere 4.1 or later, complete the
following steps:
1. Save the .iso file to the computer you use to access the vSphere client.
2. Run the vSphere Client, and then log in as an administrator.
3. Select the virtual machine currently running SolarWinds Virtualization
Manager.
4. Click the CD/DVD utility icon, and then click CD/DVD Drive 1 > Connect to
ISO image on local disk.
5. Select the .iso file, and then click Open.
54
Upgrading on Hyper-V
6. Open a browser to https://ip_address:5480 where ip_address is the IP
address or name of the SolarWinds Virtualization Manager VM.
7. Log in to the website using your SolarWinds Virtualization Manager
credentials.
8. Click the Update tab.
9. Click Check Updates.
10. Click Install Updates, and then click OK.
Note: If Virtualization Manager displays odd behavior after an upgrade, you may
need to clear the browser cache.
Upgrading on Hyper-V
The appliance upgrade comes as an .iso file for use with the Hyper-V client.
To upgrade Virtualization Manager on Hyper-V, complete the following
steps:
1. Save the .iso file to a data storage that you can access from the virtual
machine running SolarWinds Virtualization Manager.
2. Run the Hyper-V Manager.
3. Select the virtual machine currently running SolarWinds Virtualization
Manager.
4. Click Settings.
5. Click DVD Drive.
6. Select the Image file, and then click Browse.
7. Select the .iso file, and then click Open.
8. Click OK.
9. Open a browser to https://ip_address:5480 where ip_address is the IP
address or name of the SolarWinds Virtualization Manager VM.
55
Chapter 2: Installing SolarWinds Virtualization Manager
10. Log on to the website using your SolarWinds Virtualization Manager
credentials.
11. Click the Update tab.
12. Click Check Updates.
13. Click Install Updates, and then click OK.
Note: If Virtualization Manager displays odd behavior after an upgrade, you may
need to clear the browser cache.
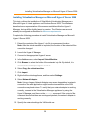
Additional upgrade steps for AD/LDAP authentication
Previous versions of the virtual appliance version of this software required you to
edit the hyper9-config-jaas.conf configuration file to configure authentication for
your Active Directory (AD) or LDAP users. Starting with SolarWinds Virtualization
Manager 4.0, you set up authentication for AD/LDAP users from the
Authentication Server configuration page.
If you have never made changes to the configuration file before upgrading,
configuring authentication for your AD/LDAP users works as described in
Configuring authentication servers.
If you are upgrading from 4.0 to newer versions of Virtualization Manager, you
must reenter the bind password.
If you have existing changes to the configuration file, authentication for AD/LDAP
users may not work until you manually update the configuration file.
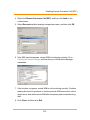
To fix AD/LDAP authentication for an upgraded appliance:
1. Log on to the administration website of SolarWinds Virtualization Manager
with your admin credentials.
Note: Typically, this is https://hostname:5480 where hostname is the host
name or IP address of your appliance. Acknowledge the security certificate
warning, and then continue to the website.
2. Click Management > Edit Configuration.
56
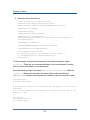
Activating the license
3. Select hyper9-config-jaas.conf, and then click Edit.
4. Replace all of the existing content with the following, and then click Save.
hyper9 {
com.hyper9.security.auth.Hyper9AuthLoginModule required debug=true;
};
h9kerberos {
com.sun.security.auth.module.Krb5LoginModule required client=TRUE
refreshKrb5Config=TRUE;
};
5. Click Restart, and then click Confirm Restart.
6. Log on to the regular SolarWinds Virtualization Manager website.
7. Click Configuration, and then click Authentication Server on the left
menu.
8. Follow the AD/LDAP configuration instructions in Configuring
authentication servers.
Activating the license
If you upgrade without a valid maintenance license, SolarWinds Virtualization
Manager may not be able to apply a new license. Change the permissions of the
etc/.java file, and then activate your license.
To change the permissions of the etc/.java file:
1. Log on to the virtual appliance console using the admin account credentials.
You can open the console by using your VM management system to
connect to or open the console.
2. Type sudo chmod -R 777 /etc/.java in the command line.
3. Exit the console.
If you encountered an error during activation, the SolarWinds licensing server
may have already activated your license. In this case, either use the instructions
57
Chapter 2: Installing SolarWinds Virtualization Manager
in Activating a license key offline to manually upload your license, or contact
SolarWinds Customer Service to reset your activation.
Solving upgrade issues
The following issues may occur during and after the upgrade procedure.
Historical data is unavailable during the search index rebuild
After the upgrade process has completed, the database search index is
rebuilt. This process can take between 20 minutes and two days to
complete, depending on the size of the database and its disk performance.
Until the index rebuild is finished, some performance graphs do not display
historical data. If the system has to be restarted, the indexing will resume
where it left off.
Restoring the SolarWinds Mgmt tab
Occasionally the SolarWinds Mgmt tab is unavailable after an upgrade. If it
has not returned after 60 seconds, log out of the administration website,
clear the browser cache, and close the browser. The SolarWinds Mgmt tab
will be available the next time you log on to the administration website.
NTP status is blank
After the upgrade process has completed, the NTP status may be blank in
the SolarWinds Virtualization Manager administration website. If this occurs,
click Restart ntpd.
Updating an existing Windows installation
Starting from SolarWinds Virtualization Manager 5.0, SolarWinds no longer
provides a Windows installer and previous versions cannot be upgraded to the
current version.
To help you upgrade, SolarWinds provides a migration tool to move your data
from your Windows installation to a virtual appliance, and a Hyper-V virtual
appliance that deploys Virtualization Manager in a Windows environment.
58
Migrating from an existing virtual appliance to a new virtual appliance
Migrating from an existing virtual appliance to a
new virtual appliance
With the migration tool you can move your data from an existing instance of
Virtualization Manager to a new virtual appliance.
Note: If the existing database is larger than 60 GB and you are migrating to a thinprovisioned virtual machine, ensure that the provisioned disk size is large enough
to accommodate the data. The recommended size is the existing database plus
50%. You must restart the virtual appliance after changing the disk size and
before moving the data.
To migrate from an existing virtual appliance to a new virtual appliance:
1. Follow the instructions in Installing Virtualization Manager as a virtual
appliance to install a virtual appliance on vSphere or Hyper-V.
2. Set the time zone of the new appliance to match the time zone of the
existing appliance by completing the following steps:
a. In the console, use the arrow keys to select Set Timezone, and then
press enter.
b. Select the same time zone as the time zone of the existing virtual
appliance from which you are migrating.
c. Type ‘1’ when prompted to confirm the time zone.
d. Restart the virtual machine.
3. Log on to the administration website of the new installation
(https://ipAddress:5480) as user admin and password admin.
4. Navigate to SolarWinds Mgmt.
5. Click Migrate Data From Old Hyper9 / VMgr Server.
6. Select Prepare source appliance for migration, and then enter the user
name and password of the source appliance.
59
Chapter 2: Installing SolarWinds Virtualization Manager
7. Enter the host name or IP address of the existing virtual appliance that you
are migrating from in the text field of Step 2.
8. Click Perform Migration. The migration tool moves your information to the
new virtual appliance.
Installing, updating and uninstalling a federated
collector
By using a federated collector, you can split the data collection tasks of
SolarWinds Virtualization Manager between one or more remote servers. The
federated collector has no database of its own. Its function is to serve as a proxy,
collecting configuration and performance data and relaying the collection back to
SolarWinds Virtualization Manager. To monitor 10,000 VMs or more, it is strongly
recommended that you use a federated collector.
Reasons for deploying a federated collector include scalability and geography. A
single SolarWinds Virtualization Manager data collector might not have sufficient
computing resources by itself to collect data from very large virtual environments
with thousands of VMs. If you experience slow performance due to collection,
consider deploying a federated collector.
Additionally, it is more efficient to collect data from distant vCenters by deploying
a federated collector in that distant location and having the collector periodically
phone home with a dense stream of data. If your organization uses WANs,
consider deploying a federated collector.
To use federated collectors, TCP port 61616 must be open on SolarWinds
Virtualization Manager. For more information, see Port requirements.
Note: Upgrading to the latest version of Virtualization Manager upgrades the
Virtualization Manager software on both the master virtual appliance and on
federated collectors. However, while the upgrade to Virtualization Manager also
raises the CentOS version on the master appliance, you must manually upgrade
CentOS on federated collectors using the .ISO file.
60
Installing a federated collector
Installing a federated collector
The federated collector is distributed as a VMware virtual appliance OVF
template.
To deploy and configure a federated collector:
1. Extract the contents of the Collector .zip archive file.
2. In the VMware client, deploy the new federated collector appliance from the
OVF template in the same way you deploy a SolarWinds Virtualization
Manager server. For information about installing a Virtualization Manager
server, see Installing Virtualization Manager as a virtual appliance.
3. Open the console for the federated collector, and then turn on the virtual
appliance.
4. Configure the appliance with appropriate network settings in the same way
you configure a SolarWinds Virtualization Manager server.
5. Log on to the administration website of the new collector
(https://ipAddress:5480) with the user admin and the password admin.
6. Click the SolarWinds Data Collector tab.
7. In the Collector Timezone field, select the time zone of the main
SolarWinds Virtualization Manager. Do not set this to the time zone of the
collector.
8. In the Collector Hostname field, type the host name you want to use for this
collector.
9. In the Collector Display Name field, type a unique identifier that will be
used to refer to this collector in SolarWinds Virtualization Manager. For
example: tokyo-collector.
10. In the SolarWinds Virtualization Manager Server Address field, type the
host name or IP address of the main SolarWinds Virtualization Manager.
11. Click Configure Now. The federated collector is now ready to accept data
source collection assignments from SolarWinds Virtualization Manager.
61
Chapter 2: Installing SolarWinds Virtualization Manager
For more information, see Configuring data sources.
Updating a federated collector
Any federated collectors from versions earlier than 4.0 must be shut down and
replaced with the new federated collector. To prevent having to remap existing
collections to the new collector, reuse the previous Collector Display Name for
the new collector.
To keep the same display name for the new collector:
1. Log on to the VMware client as an administrator.
2. Open the VMware console for the collector appliance.
3. Type configure at the login prompt, and then run the time zone
configuration.
4. After configuring the time zone, note the collector's name.
5. In the VMware client, shut down and delete the old collector.
6. Extract the contents of the Collector .zip archive file.
7. In the VMware client, deploy the new federated collector appliance from the
OVF template.
8. Power on the federated collector, and then configure it through the console
with your network settings.
9. Log on to the administration website of the new collector
(https://ipAddress:5480).
10. Click the SolarWinds Data Collector tab.
11. In the Collector Timezone field, select the time zone of the main
SolarWinds Virtualization Manager.
62
Uninstalling a federated collector
12. In the Collector Hostname field, enter the host name you want to use for
this collector.
13. In the Collector Display Name field, enter the display name of the previous
collector.
14. In the SolarWinds Virtualization Manager Server Address field, enter the
host name or IP address of the main SolarWinds Virtualization Manager.
15. Click Configure Now.
Uninstalling a federated collector
In order to delete a federated collector that is associated with Virtualization
Manager, complete the following steps.
To uninstall a federated collector:
1. On the Setup tab of Virtualization Manager, click Data Sources on the left
menu.
2. Select a data source, and then click Edit.
3. Select a different collector for the data source from the Collector list than
the one you want to delete.
4. Click Save.
5. Repeat Steps 2 - 4 for each data source.
6. Turn off the federated collector, and then delete the virtual machine.
Licensing
SolarWinds Virtualization Manager is licensed according to the number of CPU
sockets per monitored host. If you try to monitor more sockets or VMs than your
license allows, you will not be able to add more data sources and you will not be
able to apply upgrades or updates to SolarWinds Virtualization Manager.
If you are licensed per VM, you can continue to use that license. Contact your
SolarWinds sales representative if you have questions about your license.
63
Chapter 2: Installing SolarWinds Virtualization Manager
The section contains information about the following topics:
l
License management in Virtualization Manager version 6.2
l
License management starting from Virtualization Manager version 6.1
l
Using licenses from previous versions
l
Viewing your licensing status
l
Activating a license key online
l
Activating a license key offline
l
Excluding hosts from monitoring
License management in Virtualization Manager version 6.2
In Virtualization Manager version 6.2, the license you have to apply consists of
two parts: a primary and a secondary license. The primary license key is installed
on the Virtualization Manager appliance. The secondary license key is installed
on the SolarWinds Orion server if you integrated Virtualization Manager with your
SolarWinds Orion server. If you use Virtualization Manager without integrating it
with a SolarWinds Orion server, the secondary license is not used.
Note: You can integrate one Virtualization Manager with one SolarWinds Orion
server. To integrate Virtualization Manager with a different SolarWinds Orion
server, deactivate both the primary and the secondary license. The licenses then
become available to be activated again on a different instance.
The following sections provide information about the different steps and order of
activating your Virtualization Manager license, depending on the additional Orion
platform products you use and integrate Virtualization Manager with.
Activating the license on a standalone Virtualization Manager installation
If you install a standalone Virtualization Manager, or upgrade a Virtualization
Manager appliance that is not integrated with the SolarWinds Orion server,
perform the following steps to activate your license.
64
Activating the license on Virtualization Manager integrated with the SolarWinds
1. Install or upgrade the Virtualization Manager appliance. For installation
instructions, see Installing Virtualization Manager as a virtual appliance, for
upgrade instruction, see Upgrading an existing virtual appliance.
2. Activate the primary license key on the appliance. For license activation
instructions, see Activating a license key online or Activating a license key
offline.
Note: An error message is displayed if you attempt to install the secondary
license key on the Virtualization Manager appliance.
Activating the license on Virtualization Manager integrated with the
SolarWinds Integrated Virtual Infrastructure Monitor
If you install or upgrade a Virtualization Manager appliance that is integrated with
the SolarWinds Integrated Virtual Infrastructure Monitor, install the products and
activate the license keys in the following order.
New installation:
1. Install the SolarWinds Integrated Virtual Infrastructure Monitor and the
Virtualization Manager appliance. For installation instructions, see Installing
the SolarWinds Integrated Virtual Infrastructure Monitor in standalone mode
and Installing Virtualization Manager as a virtual appliance.
2. Integrate the Virtualization Manager appliance with the SolarWinds Orion
server. For integration instructions, see Preparing for the integration of
Virtualization Manager.
3. Activate the primary license key on Virtualization Manager. For license
activation instructions, see Activating a license key online or Activating a
license key offline.
4. Activate the secondary license key on the SolarWinds Integrated Virtual
Infrastructure Monitor.
65
Chapter 2: Installing SolarWinds Virtualization Manager
Note: You can also activate the primary license key on the SolarWinds Integrated
Virtual Infrastructure Monitor, and the secondary license key on Virtualization
Manager.
Upgrade:
1. Upgrade the Virtualization Manager appliance. For upgrade instructions,
see Upgrading an existing virtual appliance.
2. Install the SolarWinds Integrated Virtual Infrastructure Monitor. For
installation instructions, see Installing the SolarWinds Integrated Virtual
Infrastructure Monitor in standalone mode.
3. Integrate the Virtualization Manager appliance with the SolarWinds Orion
server. For integration instructions, see Preparing for the integration of
Virtualization Manager.
4. Activate the primary license key on the Virtualization Manager appliance.
For license activation instructions, see Activating a license key online or
Activating a license key offline.
5. Activate the secondary license key on the SolarWinds Orion server.
Note: You can also activate the primary license key on the SolarWinds Orion
server, and the secondary license key on Virtualization Manager.
Activating the license on a Virtualization Manager instance licensed per VM
If you use a Virtualization Manager appliance that is licensed per VM instead of
per socket, upgrade the products and activate the license keys in the following
order.
1. Upgrade the SolarWinds Orion server.
2. Upgrade the Virtualization Manager appliance. For upgrade instructions,
see Upgrading an existing virtual appliance.
66
Activating the license on Virtualization Manager integrated with SolarWinds NPM
3. Activate the primary license key on Virtualization Manager. For license
activation instructions, see Activating a license key online or Activating a
license key offline.
4. Activate the secondary license key on the SolarWinds Orion server.
Note: You can also activate the primary license key on the SolarWinds Orion
Server, and the secondary license key on Virtualization Manager.
Activating the license on Virtualization Manager integrated with SolarWinds
NPM or SolarWinds SAM
If you install or upgrade a Virtualization Manager appliance that is integrated with
SolarWinds Network Performance Monitor (NPM) or SolarWinds Server &
Application Monitor (SAM), install the products and activate the license keys in
the following order.
New installation:
1. Install Virtualization Manager. For installation instructions, see Installing
Virtualization Manager as a virtual appliance.
2. Install SolarWinds NPM or SolarWinds SAM. For installation instructions,
see Completing an Orion NPM installation or Installing SolarWinds Server
& Application Monitor.
3. Activate the primary license key on Virtualization Manager. For license
activation instructions, see Activating a license key online or Activating a
license key offline.
Note: In this case, you can leave the secondary license unused. However, you
can also activate an evaluation license for SolarWinds Integrated Virtual
Infrastructure Monitor. In this case, see the instructions about Activating the
license on Virtualization Manager integrated with the SolarWinds Integrated
Virtual Infrastructure Monitor.
67
Chapter 2: Installing SolarWinds Virtualization Manager
Upgrade:
1. Upgrade SolarWinds NPM or SolarWinds SAM. For upgrade instructions,
see Upgrading SolarWinds Network Performance Monitor or Upgrading
SolarWinds Server & Application Monitor.
2. Upgrade Virtualization Manager. For upgrade instructions, see Upgrading
an existing virtual appliance.
3. Activate the primary license key on Virtualization Manager. For license
activation instructions, see Activating a license key online or Activating a
license key offline.
Note: In this case, you can leave the secondary license unused. However, you
can also activate an evaluation license for SolarWinds Integrated Virtual
Infrastructure Monitor. In this case, see the instructions about Activating the
license on Virtualization Manager integrated with the SolarWinds Integrated
Virtual Infrastructure Monitor.
License management starting from Virtualization Manager version
6.1
Starting from Virtualization Manager version 6.1, you can upgrade licenses
without manual intervention. The appliance periodically connects to the licensing
server, and when it detects that a new license is available, it downloads and
applies the license automatically.
If you are using Virtualization Manager with an evaluation license, the application
does not perform the license update check. The automatic license update checks
start after you activate your first commercial license key, either through online or
offline activation.
By default, the automatic license synchronization is enabled, and the appliance
checks for license updates once every 24 hour. The first license check is
performed 1 hour after the initial startup of the application. This value is controlled
by the license.synchronizer.initial.delay property. You can modify the
default settings in the System Properties page of Virtualization Manager.
68
Using licenses from previous versions
To modify the default settings:
1. Navigate to Setup > Advanced Setup.
2. Click System Properties.
3. To modify the default license update checking frequency, click in the Value
column next to license.synchronizer.check.frequency. The minimum
frequency is 24 hours.
4. To disable automatic license synchronization, click in the Value column
next to license.synchronizer.enabled, and then set the property to false.
Notes:
l
l
If there is no internet connectivity when Virtualization Manager starts, the
automatic license synchronization will not be enabled.
Despite the changes in licensing and license updating, the earlier licenses
remain operable, and the methods of online and offline license key
activation remain the same.
Using licenses from previous versions
SolarWinds Virtualization Manager incorporates the SolarWinds licensing system
that uses a different kind of license key than what was used in version 3.0.5 and
earlier. After you upgrade to the current version, the upgraded system will be
licensed with a temporary 30-day trial license.
To relicense your software, see Activating a license key online and Activating a
license key offline.
Viewing your licensing status
To view your license status information, log on to Virtualization Manager, and
then click Help.
69
Chapter 2: Installing SolarWinds Virtualization Manager
Activating a license key online
If you can access the SolarWinds website from a computer that can also access
SolarWinds Virtualization Manager, you can activate your license key online.
To activate a license key online:
1. Log on to the SolarWinds Customer Portal at
https://customerportal.solarwinds.com.
2. Under Licensing & Maintenance, click License Management.
3. Locate an unregistered Virtualization Manager activation key in your license
list.
4. In a separate browser window, log on to SolarWinds Virtualization Manager.
5. Click Setup in the top menu.
6. Click License Information in the left menu.
7. Click Activate License.
70
Activating a license key offline
8. Copy the Activation Key from the Customer Portal, and then paste it into the
Activation Key field of the SolarWinds Virtualization Manager License
Information page.
9. In the Computer Name field, type localhost.
10. Provide your name, company name, email address and phone number.
11. Click Send Activation Request.
Activating a license key offline
If proxy or firewall restrictions prevent the same computer from accessing both the
SolarWinds website and SolarWinds Virtualization Manager, you can request a
license file that you can then manually upload to the server.
To activate a license key offline:
1. Log on to SolarWinds Virtualization Manager.
2. Click Setup in the top menu.
3. Click License Information in the left menu.
4. Click Unique Machine ID, copy the machine ID, and save it on a flash
device.
5. Go to a computer with internet access, and then log on to the SolarWinds
Customer Portal at https://customerportal.solarwinds.com.
6. Click License Management under Licensing & Maintenance.
7. Locate an unregistered Virtualization Manager activation key in your license
list.
8. Click Manually Register License to the right of the activation key.
9. Enter your name, email address and phone number in the associated fields.
10. In the Computer Name field, enter localhost.
11. In the Unique Machine ID field, paste the machine ID you copied from
SolarWinds Virtualization Manager.
71
Chapter 2: Installing SolarWinds Virtualization Manager
12. Click Generate License File.
13. Click the license download link to download the license file.
14. Transfer the license file to the computer you are using to access SolarWinds
Virtualization Manager.
15. Click Upload License File.
16. Select your license file, and then click Open.
Excluding hosts from monitoring
If you do not have enough SolarWinds Virtualization Manager licenses to cover
every powered on virtual machine managed by a vCenter server, you can change
the access permissions of the vCenter user account to limit what it can access.
Restricting the VMs accessible by the user account reduces the number of VMs,
or sockets, SolarWinds Virtualization Manager can collect data from, and allows
you to control which VMs are being monitored.
You can typically control access permissions in the VMware client by assigning
the "No Access" role to the vCenter account for the hosts and VMs you want to
restrict.
To exclude a host:
1. Expand the "Host & Clusters" until you locate the host you want to exclude.
2. Right-click the host, and then click Add Permission.
3. Add the user performing SolarWinds Virtualization Manager data collection
but assign the role No Access. This eliminates the host from all data
collection including WMI.
For more information, search for the basic system administration guide on the
VMware documentation site.
72
Chapter 3: Administration and setup
This topic contains information about administration and setup activities in two
parts:
Basic setup
Basic setup is the process required to initiate the first Data Collection
operations to populate the data repository. Data Collection is the
enumeration of objects, such as VMs, on data sources, such as vCenter
Servers or ESX hosts, and the process of gathering configuration and
sample data from the enumerated objects.
Advanced setup
By using advanced setup, you can fine tune data collection, configure
SNMP and SMTP, and manage user access to SolarWinds Virtualization
Manager.
Basic setup
The result of basic setup is a well-populated repository of virtual infrastructure
information on which you can conduct searches, show data center trends, and
graph performance data. In order to reach this goal, at least one Configuration
Data and one Sample Data job must be scheduled and executed to completion
on a licensed server. This is done by specifying endpoints such as VMware
vCenter servers or unmanaged ESX hosts that need to be interrogated for virtual
machine information. To extract information from such endpoints, proper
credentials must be supplied to pass authentication requirements.
The Configuration Wizard guides you through the basic steps to enable your
SolarWinds Virtualization Manager installation for data collection.
73
Chapter 3: Administration and setup
To run the Configuration Wizard:
1. Log on to SolarWinds Virtualization Manager.
2. Click Setup.
3. Click Configuration Wizard on the left menu.
Filling in the SolarWinds registration
The first step in basic setup requires you to register your software. Enter the email
address you provided when registering to download the software. A valid email
address is required to continue.
Configuring credentials
The next step in the Configuration Wizard is to enter a set of credentials that will
be used to access the data sources you just defined. Depending on the intended
usage, provide the following types of credentials:
l
Administrator credentials to any Virtual Center endpoints.
l
Root credentials to ESX hosts (whether managed or unmanaged).
l
Windows Domain Administrator credentials for Hyper-V hosts or virtual
machines which are Windows Domain members and also open to data
collection via Windows Management Instrumentation (WMI).
Note: Instead of assigning credentials to each data source, in SolarWinds
Virtualization Manager, you enter all of your credentials in one place. During the
initial data collection, SolarWinds Virtualization Manager attempts to authenticate
each credential with a data source until it finds one that works. That credential is
then automatically cached with an association to that data source.
Click Add to enter a new credential. For each credential set, provide the following
information:
l
Credential Type: Select Virtual Center, Host, or Hyper-V and WMI
depending on the intended usage of this credential.
74
Configuring data sources
l
Username: The login name or user ID of the account. This is usually root,
administrator, or some domain administrator account.
l
Password: The password for the given user name.
l
Domain: A domain associated with the credentials.
l
Description: A description of the credential set.
After you entered the necessary information, click Save to add the credential to
the Credential Pool. This returns you to the Credentials screen.
After you entered all your credentials, click Next to continue.
Note: For enhanced security, it is recommended that you change the default
admin credentials.
To change the default credentials of the admin account:
1. Connect to the Virtualization Manager Administration Console through
https://IP_address:5480 where IP_address is the IP address of your
appliance.
2. Navigate to SolarWinds Mgmt > Change Password, and then type the
new password.
3. Click Change.
Configuring data sources
Click Add to enter a new data source. For each data source you enter, provide
the following information:
l
l
Host Type: A Virtual Center, Unmanaged Host, or Hyper-V host.
Network Address: The static IP address or fully qualified domain name of
the data source.
l
TCP Port: The HTTPS port of the admin page for this data source.
l
Description: A brief description of the data source.
75
Chapter 3: Administration and setup
l
l
Collector: If you have set up a federated data collector to use for this
collection, select the federated collector. In other cases, select localhost.
Validate Connections: An optional step to confirm that the data source is
reachable.
If you selected Hyper-V, provide the following information:
l
Group Name: A description of the Hyper-V host groups.
l
Network Address: The static IP address or fully qualified domain name of
the data source.
l
CIDR or Range: The range where the host is located (if applicable).
When you add a Hyper-V data source, a discovery job is automatically created
and enabled. The hosts discovered by this job are then subject to configuration
and performance data collection as configured in Configuring collection
schedules.
After entering the necessary information, click Save to add the endpoint to the
data source list.
After you entered all your data sources, click Next to continue.
Configuring collection schedules
The Collection Schedules screen should be predefined with a pair of default
schedules for each data source you have defined. One collection schedule for
configuration data and one collection for sample (performance) data per data
source is defined in the collection schedule.
Select the Configuration and Performance collection schedules, and then click
Enable to start the data collection. Hold the Shift, Ctrl, or Command keys to select
multiple schedules and enable them all at once.
To modify the default schedules for timings and interval of execution preferences,
select a schedule, and then click Change Schedule.
76
Infrastructure aging
Note: Configuration jobs should not occur more often than once per hour. For all
practical purposes, the default setting of collection once every 12 hours is
sufficient. Sample schedules default to run every 10 minutes and this is fast
enough for most practical applications.
For each collection schedule, you can modify the following information by clicking
Change Schedule:
l
l
l
Start Time: Indicates the date and time from which to begin the data
collection job.
Performance Interval: Indicates the time interval on which the job is
performed.
Enable Schedule: Indicates whether the job is enabled or disabled for data
collection.
Note: For each data source, schedule two jobs to provide configuration,
performance, and state information for virtual machines, a configuration data
collection job and a sample data collection job. This includes VirtualCenters,
unmanaged ESX hosts, and Hyper-V hosts.
After all of the data collection jobs have been scheduled and enabled, the
scheduler executes each job at the specified start time and continues to run them
at the specified interval. The time it takes for a job to complete varies widely
based on the size of the environment to be collected from. To execute a collection
schedule immediately, select the schedule on the Collection Schedules screen,
and then click Run Now.
For more information about the way Virtualization Manager collects data and
calculates rollup information, see Collecting data and calculating rollup
information.
Infrastructure aging
The entities in Virtualization Manager go through the following life cycle:
77
Chapter 3: Administration and setup
Active VMs
Virtual machines which are accessible for data collection and are registered
with their hosts or Virtual Center. This is the normal state for virtual machine
records. These machines are searchable in the current and historical time
frames.
Stale VMs
Virtual machines which are either inaccessible for data collection or
unregistered with their hosts or Virtual Center for the defined "Active to
Stale" interval. These virtual machines are searchable, however, they
appear dimmed to indicate their stale status.
Decommissioned VMs
Virtual machines which have been "Stale" for the defined "Stale to
Decommissioned" interval. These virtual machines are no longer
searchable in the current time frame. These virtual machines still exist in the
data repository as historically searchable records.
The interval between these life cycle changes is controlled by system properties
which are accessible from Setup > System Properties in Virtualization Manager.
For more information, see Configuring system properties.
Configuring SMTP settings
SolarWinds Virtualization Manager uses email to deliver alert notifications. In
addition, reports can be delivered as attachments to emails to interested parties
either as needed or on a scheduled basis. However, email can only be delivered
if you configure an SMTP server to send outgoing emails.
Provide the following information on the SMTP Configuration page of the
Configuration Wizard:
l
Hostname: The IP address or host name of the SMTP server.
l
TCP Port: Port that the email server expects SMTP connections.
l
Authentication Username: The email account used to send emails from
this SMTP server.
78
Configuring the Storage Manager installation details
l
l
l
Authentication Password: The password for the email account used to
send emails from this SMTP server.
From Address: Sent emails arrive from this email address.
Email Subject Prefix: Sent emails have this text as the beginning of their
subject line. More text will be added after this prefix to describe the purpose
of the email.
Click Next after entering this information.
Configuring the Storage Manager installation details
If you have SolarWinds Storage Manager installed, you can link data stores on
the details page to open their corresponding Storage Manager web pages. If you
do not have SolarWinds Storage Manager installed, you can leave these fields
blank.
All NFS target volumes have links to the STM view, and all NFS target volume
information is searchable. For example, if the target name is /vol/lab_Vcenter_
41_NFS_Vol01, you can paste that string in the Search resource and filter based on
it.
Provide the following information on the Storage Manager configuration page:
l
l
Network Address: The IP address or host name of the Storage Manager
server.
TCP Port: The port used for the Storage Manager web server. The default
port is 9000.
l
l
Storage Manager Username: The user you want to automatically log on as
when requesting a Storage Manager page
Storage Manager Password: The password corresponding to your
Storage Manager user name.
Click Test to verify that you can successfully connect to Storage Manager, and
then click Finish.
79
Chapter 3: Administration and setup
At the end of the Configuration Wizard, the Configuration Summary screen is
displayed. This screen displays the data collection schedules that are in progress
and provides information about how the collections are performing.
This completes the basic configuration of Virtualization Manager and if all
collections are completed as scheduled, you will be able to query for virtual
machine data shortly from the main interface by clicking Home and entering a
query in the search interface.
Configuring HTTPS access only
You can block HTTP access to the web console. By doing this you can make
HTTPS the only allowed protocol through which to access the console.
To block HTTP access:
1. Log on to the administration website of the installation
(https://ipAddress:5480) as user admin with the password admin .
2. Navigate to SolarWinds Mgmt.
3. Click Block HTTP access.
4. Restart the virtual appliance by clicking Restart Virtualization Manager.
Enabling Dynamic Memory on Hyper-V 2008 servers
Virtualization Manager requires using Dynamic Memory in Hyper-V. A system
such as Windows Server 2008 without SP that does not have the capability of
providing dynamic memory usage will report memory utilization at 100%. To
ensure that correct memory utilization values are shown in memory calculations
and alerts, enable Dynamic Memory.
To enable Dynamic Memory:
1. Launch the Hyper-V Manager.
2. Shut down the virtual machine.
3. Right-click the virtual machine, and then click Settings.
4. Navigate to Hardware > Memory.
80
Advanced setup
5. Under Memory Management, click Dynamic.
6. Set the amount of memory for Startup RAM and Maximum RAM.
7. Turn on the virtual machine.
8. If the guest operating system is Windows 7, log on to the virtual machine to
complete the configuration.
Advanced setup
The yellow Advanced Setup link on the left menu of the Administration page
opens the advanced setup menu.
Typical elements that require advanced setup include the following:
l
l
Administering users and access
Adding or modifying user credentials when passwords are updated or
staffing changes occur
l
Setting up default dashboards for users
l
Configuring guest (WMI) inclusion masks to accommodate changes in WMIaccessible infrastructure
l
Creating and managing searchable labels
81
Chapter 3: Administration and setup
l
l
Configuring a mail server to send email alerts
Configuring SNMP traps to integrate with a third party systems management
tool
l
Configuring low-level system properties
l
Initiating tasks that perform maintenance
You can accomplish these tasks by selecting their corresponding menu item
under Advanced Setup on the Configuration page.
User management
To control user access to SolarWinds Virtualization Manager, select the Users
menu option. Here you can add, edit, or delete users from the internal credential
store.
To add a new user, click Add, and then provide the following information:
l
Username: The login name of the user.
l
Role: User or Admin roles are available to any user.
l
l
l
User Role: Has access only to the user side of SolarWinds
Virtualization Manager.
Admin Role: Can access both the user and administrator sides of
SolarWinds Virtualization Manager.
Enabled: Whether this account is currently enabled. Disabled accounts
cannot log on.
l
Local Auth: Accounts with local authentication use the internal
authentication of SolarWinds Virtualization Manager. Otherwise, LDAP
pass-through authentication is used to verify credentials using sources such
as Active Directory.
l
Password: The password of the user with a second box to confirm.
l
Full Name: The full name of the user.
82
Setting default dashboards for users
l
Email: The email address for the user.
l
Description: A brief description of the user.
Click Save to finish the process.
Click Edit to edit the full name, email address, and description of the selected
account.
Click Change Password to enter and verify a new password for the selected
account.
Setting default dashboards for users
New users get the standard default dashboards of SolarWinds Virtualization
Manager. However, you can specify exact dashboards for the user by clicking
Dashboard.
Select up to five available dashboards from the left column, and then click the
right arrow to make those dashboards the default for a user. This feature is useful
for making dashboards relevant to the user's position in the company. For
example, you can give storage administrators storage dashboards by default,
while giving managers the manager dashboard.
Using inventory filters
In the Inventory Filters configuration page you can limit the scope of data
collection activities by restricting the virtual machines that SolarWinds
Virtualization Manager interrogates for WMI information.
The default filter includes all guests for WMI. This is done by making a "filter" with
the subnet address 0.0.0.0 and a subnet mask of 0.
To create additional filters:
1. Provide the IP address or range that you want to include. This process is
described at the CIDR Calculator.
2. Click Add.
83
Chapter 3: Administration and setup
3. Enter the Network address and Mask for your new inclusion list.
4. Click Save.
You can add as many filters as you want to include multiple ranges of IP
addresses.
Using labels
The Labels configuration page provides you with a quick way of creating a series
of custom labels that you can apply to VMs and hosts.
To create a label, click Add Label.
For more information, see Custom labels.
Configuring SNMP
SolarWinds Virtualization Manager can send SNMP traps for events that occur in
the system such as the following:
l
New VMs are discovered
l
Alerts are raised or lowered
To configure SNMP traps, click SNMP Configuration.
To specify a new host that will receive SNMP traps, click Add Trap Host. Enter
the following information to configure a new SNMP integration.
l
l
l
l
l
Host Address: The IP address or FQDN of the receiver of SNMP alerts.
Community String: The SNMP community string which is used for readonly access to SolarWinds Virtualization Manager alerts.
UDP Port: The port the SNMP receiver expects SNMP UDP traffic.
Retries: The number of times to resend the SNMP trap if no
acknowledgment is received.
Timeout (ms): The amount of time to wait for acknowledgment before
attempting a retry.
84
Configuring authentication servers
After saving a new Trap Host, click Send Test Trap to test the integration.
SNMP trap receivers may need details of the Manager alert MIB (Management
Information Base). Click MIB to view the entire SolarWinds Virtualization
Manager MIB.
Configuring authentication servers
In the Authentication Server configuration page you can configure the Active
Directory servers (Domain Controller), or LDAP servers that are used to
authenticate Active Directory (AD) or LDAP users.
You can configure multiple authentication servers, based on the domain prefix
you specify. You can configure a default domain entry, or configure an entry for
each domain prefix.
Virtualization Manager also supports the use of mixed mode authentication.
Adding an Active Directory authentication server
To add an Active Directory authentication server, perform the following steps:
1. Click Add.
2. From the Authentication Type list, select Active Directory.
3. If you want this to be the authentication server for users who log in to
Virtualization Manager without specifying a domain prefix, click Use for all
accounts where a domain is not specified.
4. If you want this to be the authentication server for users who specify a
domain prefix, click Use for this domain only, and then enter the specific
domain in the text field. The domain name prefix is case-sensitive.
5. In the Server field, type the IP address of the Active Directory server.
6. In the Port field, type the port used for AD authentication. The default port is
389.
7. Optionally, provide a description for the Active Directory server.
85
Chapter 3: Administration and setup
8. Optionally, to test the IP address of the server for connectivity, select the
Validate Connections check box.
9. In the Realm Name field, type in uppercase the realm configuration name
that was used when setting up the Active Directory server. You can obtain
the realm name from your Active Directory administrator.
10. Click Save.
Note: If you cannot log on, check the log file, and look for the following error
message:
[http-8080-5] INFO
com.hyper9.security.auth.Hyper9AuthLoginModule:121 - Login
failed: Clock skew too great (37).
This error occurs when there is more than a couple of minutes difference between
the system times of the client machine and the Content Engine server. Make sure
you synchronize the time on both systems.
Adding an LDAP authentication server
To add an LDAP authentication server, perform the following steps:
1. Click Add.
2. From the Authentication Type list, select LDAP.
3. If you want this to be the authentication server for users who log in to
Virtualization Manager without specifying a domain prefix, click Use for all
accounts where a domain is not specified.
4. If you want this to be the authentication server for users who specify a
domain, click Use for this domain only, and then enter the specific domain
in the text field.
5. In the Server field, type the IP address of the LDAP server.
6. In the Port field, type the port used for LDAP authentication. The default port
is 3268.
7. Optionally, provide a description for the LDAP server.
86
Synchronizing the time of the AD and LDAP server and the SolarWinds
8. Optionally, to test the IP address of the server for connectivity, select the
Validate Connections check box.
9. In the Search Filter field, type the LDAP query filter you want to use to map
user accounts to the LDAP server entries. For example: (cn=*).
10. In the Search Base field, type the portion of the directory tree you want to
search for LDAP users. For example: dc=example,dc=com.
11. In the Bind User field, specify a user with LDAP search permissions. The
bind user is used to connect to the LDAP server. For example:
[email protected].
12. In the Bind Password field, enter the password of the bind user. You can
obtain the bind user ID and bind password from your LDAP administrator.
13. Click Save.
Synchronizing the time of the AD and LDAP server and the SolarWinds Virtualization Manager server
For security reasons, you must synchronize the system times of the SolarWinds
Virtualization Manager server and the AD or LDAP server. Authentication fails if
the two clocks vary by more than five minutes.
If you deployed SolarWinds Virtualization Manager on Microsoft Windows, you
can synchronize the system time from the Internet Time tab of the Date and Time
dialog box.
If you deployed the virtual appliance, the built-in NTP server support
automatically maintains time synchronization.
To customize the NTP synchronization settings (optional):
1. Log on to the Management UI at https://applianceHostName:5480.
2. Click the SolarWinds Mgmt tab.
3. If you have recently upgraded and the NTP Status is empty, click Restart
ntpd.
87
Chapter 3: Administration and setup
4. Click Edit Configuration.
5. Select ntp.conf, and then click Edit.
6. Customize the NTP settings, and then click Save.
Adding AD and LDAP users to SolarWinds Virtualization Manager
To automatically add the AD or LDAP users who log on to SolarWinds
Virtualization Manager as authorized users, select Auto create New Users upon
Authentication.
If you do not select this option, you must manually create user entries in
SolarWinds Virtualization Manager for your AD or LDAP users before they can
log on. Create a user identically named as the AD or LDAP user with a blank
password. For example, if Bob Smith's AD user name is bsmith, you must create
a bsmith user in SolarWinds Virtualization Manager with no password. Make sure
Local Auth is not enabled for that user.
Configuring system properties
Most internal settings for the SolarWinds Virtualization Manager system can be
edited on the System Properties page. These properties fall into two categories.
The first category is for properties that can be edited to tune SolarWinds
Virtualization Manager according to your needs. The other category is for
properties that should NOT be modified unless you are instructed to by
SolarWinds Technical Support.
Editing system properties
You can edit each of the following properties by clicking the value of the property
and entering a new value. Most of the new entries are automatically picked up by
the system, and no restart is necessary. If a restart is required, it is indicated in
front of the particular system property.
Active to Stale Interval, Stale to Decommissioned Interval
These properties define how entities (virtual machines, hosts, data stores,
clusters, and applications) are treated when they are made unavailable in
88
Editing system properties
successive data collection jobs. The Active to Stale Interval defines the
number of hours before a virtual machine goes from Active to Stale state.
The Stale to Decommissioned Interval defines the number of hours before a
virtual machine goes from Stale to Decommissioned state.
create.private.content.only
This property defines whether non-admin users can create content that is
world readable and world writable. If this property is set to true, non-admin
users can only create private content, but they can still modify world
readable and world writable content that was created by other users.
Days to Retain Raw Performance Data, Days to Retain Performance Data
Hourly Rollups
SolarWinds Virtualization Manager frequently collects a large amount of
performance data. This data makes up the majority of information in the
database. The Days to Retain Raw Performance Data property defines how
long to keep the raw data in the system before purging it. Every hour, the
raw data is consolidated into an hourly value that represents the average of
all values in that hour. The Days to Retain Performance Data Hourly
Rollups property defines how long to maintain those hourly values before
purging them. Both of these properties are major inputs to the disk sizing
spreadsheet and can be tuned according to the needs of your environment.
Hourly Interval for Trend Execution
Trends run periodically to track historic changes in your environment. By
default, they run every four hours, but you can increase or decrease this
value to get more or less granularity in your historic trend data.
Allow Application to Contact SolarWinds
SolarWinds Virtualization Manager periodically pulls information from
SolarWinds for RSS updates and to deliver non-identifiable usage data
about installations. If your installation does not have external access to the
internet, set this property to false.
89
Chapter 3: Administration and setup
collection.vmware.skip_storagepath_samples
If the value of this property is set to true, the storagePath related samples
will not be collected in a VMware environment. Turning off the collection of
storagePath samples results in improved performance.
List of properties that may not be edited
The following list contain system properties that should NOT be modified unless
you are instructed to by SolarWinds Technical Support.
Resource Depletion Percent Threshold
Default setting for the resource depletion calculations. Changing this value
results in alerts on resource depletion at the specified percentage instead of
the default 100%.
fitment.memory.waste
Default setting for capacity planning. This should not be changed because
this field is editable in the capacity planning section of SolarWinds
Virtualization Manager.
How many days to use for Resource Depletion
Default setting for capacity planning. This should not be changed because
this field is editable in the capacity planning section of SolarWinds
Virtualization Manager.
fitment.memory.oversub
Default setting for capacity planning. This should not be changed because
this field is editable in the capacity planning section of SolarWinds
Virtualization Manager.
fitment.sizing.target
Default setting for capacity planning. This should not be changed because
this field is editable in the capacity planning section of SolarWinds
Virtualization Manager.
90
Configuring system maintenance
Perform DNS Resolution to Validate VMs
Dictates whether a reverse DNS lookup occurs before collecting data from
VM guests. This setting is deprecated.
data.multiplication
Used for scalability testing and should NEVER be changed in a deployed
system.
Configuring system maintenance
The System Maintenance configuration page contains functions for enhancing,
maintaining, and troubleshooting the SolarWinds Virtualization Manager server.
You can perform the following actions of this configuration page.
Run Trends
Recalculates trends immediately, ahead of the regular maintenance
schedule.
Run Depletions
Recalculates resource depletion estimates immediately, ahead of the
regular maintenance schedule.
Clear Job Trackers
Clears the tracking data from the collection summary page. Clear the
tracking data if you have reason to believe the jobs listed on the summary
page are inaccurate. Clearing the job trackers does not cancel data
collection jobs that are running.
Rebuild Indexes
Rebuilds the search indexes. This may take a long time. While rebuilding,
you do not have access to historical data.
Enable Plugin / Disable Plugin
Enables and disables the vSphere 4.0 client plug-in. The vSphere 4.0 plugin adds a SolarWinds menu to the vSphere client that can launch
SolarWinds Virtualization Manager modules from vCenter inventory items.
Note: This plug-in only supports vSphere 4.0 and higher.
91
Chapter 3: Administration and setup
The following modules are available:
l
Add to App
l
View Notes
l
Export
l
Compare
l
Add to Chart
l
Map
l
Label
l
Plan
l
View Collected Data
For example, if you right-click a virtual machine, and then click SolarWinds >
Add to Chart, vSphere opens a performance analyzer window for that virtual
machine.
This plug-in also adds a SolarWinds option to the Management panel. This
option, available on the Home Page or in the View menu under Management >
SolarWinds, opens Virtualization Manager inside your vSphere client.
Note: Only one SolarWinds Virtualization Manager can register this plug-in for
each vCenter. If you have more than one SolarWinds Virtualization Manager
collecting data, you must disable the plug-in on one before enabling it for the
other.
Recalc License
Recalculates the license status immediately, ahead of the regular
maintenance schedule.
Open Orion Web Console
Opens the Orion Web Console, if the integration with the SolarWinds Orion
server is enabled.
92
Configuring server logging
Configuring server logging
On the Server Logging configuration page you can enable debug-level verbose
logging for several categories of loggable events. Reserve debug logging for
troubleshooting only, as debug-level logging can fill up a disk very quickly.
To enable debug-level logging, click Choose a Logging Category, and then
select a category from the list.
To disable debug-level logging, select a category in the Enabled Debug Logging
Categories section, and then click Clear.
Viewing the log files
On Windows, the log file is located at C:\Program files (x86)
\Hyper9\Server\logs\hyper9.
On the appliance, the log file is accessible from the maintenance website.
To access the log file on the maintenance website:
1. Log on to the administration website of SolarWinds Virtualization Manager
with your administrator credentials.
Note: Typically, this is https://hostname:5480 where hostname is the host
name or IP address of your appliance. Acknowledge the security certificate
warning and continue to the website.
2. Click the SolarWinds Mgmt tab.
3. Click View Recent Log Activity.
Adding an SSL certificate to Virtualization Manager
You can replace the SSL certificate included with Virtualization Manager with one
of your own.
Warning: When you use the su command (switch user), you open the computer to
security risks. It is not good practice for numerous people to know the root
password. When you log in as root, you have full system privileges, and you can
perform any and all commands. Some of these commands are destructive.
93
Chapter 3: Administration and setup
Inexperienced users could cause serious damage to the system. When a user
leaves the company, or otherwise should no longer have access to the root
account, the system administrator should change the root password.
Adding a self-signed SSL certificate
To add a self-signed SSL certificate, perform the following steps.
1. Log on to the virtual appliance by using the console or an SSH connection.
2. Enter the following command: sudo su - root.
3. Navigate to the java bin folder on the virtual appliance. This is generally
found in the /usr/java/jdkX/bin folder, where X represents the jdk version
number.
4. Enter the following command, where mykeystore is the name of your new
keystore and daysvalid is the number of days the certificate is valid:
./keytool -genkey -alias tomcat -keyalg RSA -keystore
/etc/hyper9/mykeystore -validity daysvalid
Note: If you use the default keystore, hyper9-keystore, you do not need to
modify the server.xml file.
5. When prompted, enter a new keystore password. This information is
necessary for a later step.
6. Enter the information necessary for the new certificate. Provide the following
information:
l
Your domain name instead of the first and last name
l
The name of your organizational unit
l
The name of your organization
l
The name of your city or locality
l
The name of your state or province
l
Your two letter country code
This information is displayed to users who attempt to access Virtualization
Manager through a secure connection.
94
Adding a self-signed SSL certificate
If you do not use the domain name for the name, you will continue to receive
certificate errors.
7. Type yes when prompted to confirm your new key information.
8. When prompted for the key password, enter the keystore password you
entered before.
9. Modify the owner of the keystore by entering the following command, where
mykeystore is the name of your keystore:
chown hyper9.hyper9 /etc/hyper9/mykeystore
10. Change the permissions on the keystore by entering the following
command, where mykeystore is the name of your keystore:
chmod 755 /etc/hyper9/mykeystore
11. Navigate to /usr/share/tomcat-X/conf, and create a backup of the
server.xml file.
Note: If you use the default keystore, hyper9-keystore, you do not need to
modify the server.xml file.
12. Open the server.xml file.
13. Edit the connector entity to include the keystore location. The entity should
look similar to the following:
<Connector port="8443"
protocol="org.apache.coyote.http11.Http11Protocol"
keystoreFile="../../conf/hyper9-keystore"
keystorePass="h9keystore"
SSLEnabled="true"
maxThreads="150"
scheme="https"
secure="true"
clientAuth="false"
sslProtocol="TLS" />
14. Save the server.xml file.
Note: After an upgrade, the certificate configuration reverts back the default
95
Chapter 3: Administration and setup
self-signed certificate. To preserve your configuration, create a backup of
the server.xml file located in /usr/share/tomcat-X/conf under a different
name (for example, server.xml.beforeupgrade).
15. Restart Tomcat by entering the following command:
service tomcat6 restart
If you receive "Untrusted site" errors after adding your certificate, see the KB
article about Accepting an Unsigned Certificate.
Adding a certificate from a certificate authority
Warning: Even though you can add a certificate from a certificate authority,
SolarWinds Technical Support only assists you with adding a self-signed
certificate.
If you need clarification, see the Tomcat help page, or the help page of your
certificate authority.
To add a certificate from a certificate authority:
1. Log on to the virtual appliance by using the console or an SSH connection.
2. Enter the following command: sudo su - root.
3. Navigate to the java bin folder on the virtual appliance. This is generally
found in the /usr/java/jdkX/bin folder, where X represents the jdk version
number.
4. Enter the following command, where mykeystore is the name of your new
keystore:
./keytool -genkey -alias tomcat -keyalg RSA -keystore
/etc/hyper9/mykeystore
5. When prompted, enter a new keystore password. This information is
necessary for a later step.
6. Enter the information necessary for the new certificate. Provide the following
information:
96
Adding a certificate from a certificate authority
l
Your domain name instead of the first and last name
l
The name of your organizational unit
l
The name of your organization
l
The name of your city or locality
l
The name of your state or province
l
Your two letter country code
7. Enter yes when prompted to confirm your new key information.
8. When prompted for the key password, enter the keystore password you
entered before.
9. Modify the owner of the keystore by entering the following command, where
mykeystore is the name of your keystore:
chown hyper9.hyper9 /etc/hyper9/mykeystore
10. Change the permissions on the keystore by entering the following
command, where mykeystore is the name of your keystore:
chmod 755 /etc/hyper9/mykeystore
11. Enter the following command, where mykeystore is the name of your new
keystore:
keytool -certreq -keyalg RSA -alias tomcat -file certreq.csr keystore mykeystore
12. Submit the CSR to your certificate authority (CA).
13. After the CA replied to you, copy the certificate and chain certificate to a
permanent location in the virtual appliance.
14. Navigate to the java bin folder.
15. Import the chain certificate by entering the following command, where
mykeystore is the name of your new keystore and chain_certificate_
filename is the name of your chain certificate:
keytool -import -alias root -keystore mykeystore -trustcacerts file chain_certificate_filename
97
Chapter 3: Administration and setup
16. Import the new certificate be entering the following command, where
mykeystore is the name of your new keystore and certificate_filename is
the name of your certificate:
keytool -import -alias tomcat -keystore mykeystore -file
certificate_filename
17. Navigate to /usr/share/tomcat-X/conf, and create a backup of the
server.xml file.
18. Open the server.xml file.
19. Edit the connector entity to include the keystore location. The entity should
look similar to the following:
keystoreFile="../../conf/hyper9-keystore"
keystorePass="h9keystore"
SSLEnabled="true"
maxThreads="150"
scheme="https"
secure="true"
clientAuth="false"
sslProtocol="TLS" />
20. Save the server.xml file.
21. Restart Tomcat by entering the following command:
service tomcat6 restart
Collecting data and calculating rollup information
Data in Virtualization Manager is collected in intervals based on collection
schedules.
The two primary types of data collection are the following:
l
Configuration
l
Performance
98
Sample collection in a VMware environment
Configuration data includes properties such as CPU speed, CPU or network
interface count, and host name. By default, configuration data is collected in 12
hour intervals.
Performance data includes properties such as total latency, CPU idle, and
throughput. By default, performance data is collected in 10 minute intervals.
Performance data is collected for new data sources immediately, but is not
displayed until configuration data is collected.
If you have calculations based on both configuration and performance data, the
configuration data will be older than the performance data and may affect your
expected calculations. For example, if you just added a cluster, it may take up to
12 hours (or your configuration collection interval) for the information to appear.
To immediately collect configuration information, click Run Now in the Collection
Schedules section of Virtualization Manager.
To see how specific properties are collected, see the KB article about
Virtualization Manager Properties.
You can change the frequency of individual collections by modifying the
collection schedule on the Setup tab in the Collection Schedules section.
Sample collection in a VMware environment
The VMware API provides Virtualization Manager with recent sample values
every 20 seconds, from approximately the previous hour. The sample data is
collected every 20 seconds. This data represents the average value during the
given 20 second period.
If the data collection interval in Virtualization Manager is set to the default 10
minutes, Virtualization Manager collects the 20 second samples from the last 10
minutes. This way it gets 30 values for each performance counter. According to
the type of the sample value, the average, maximum, or last value is used as the
value presented in Virtualization Manager.
Most of the raw values stored in Virtualization Manager are the average values
from the data collection interval, that is, the average values during the last 10
minutes by default.
99
Chapter 3: Administration and setup
Virtualization Manager also calculates peak sample values. Peak values are the
maximum values from the 20 second samples. For example, if the default 10
minute data collection interval is used, the peak value is the maximum value from
the 30 values received in the previous 10 minutes. The sample values collected
every 20 seconds are not stored in Virtualization Manager, because they
represent a big amount of data. These values are used to compute the average or
maximum value from out of the raw values.
Sample collection in a Hyper-V environment
Virtualization Manager collects two sets of samples for hosts, clusters, and data
stores, with one minute delay between the two sample sets. The average values
are calculated from the difference between the two sample sets, and from the time
that elapsed between them.
For VMs, the current values are collected, that is, the values that are available at
the moment of the request.
As opposed to VMware, there are no peak values calculated for a Hyper-V
environment.
Data rollup
Raw performance data is rolled up over time, to provide hourly, daily, weekly,
monthly and quarterly averages, maximal, and other statistics. The rollup periods
are based on the local server time and do not take business hours into account.
The raw and hourly performance data consumes large amounts of storage
capacity, and it is discarded after a configurable amount of time. Higher level
rollups are retained indefinitely for record keeping purposes, cost accounting, and
to act as a data warehouse. This information provides administrators with long
term trends in resource consumption.
Peak values are calculated in the following way:
l
Latest Value (peak): The highest values of each sample collected from
VMware. VMware collects raw data in 20 second intervals.
100
Data retention
l
l
l
l
l
Hourly Rollup (peak): The highest values from the data collected during the
last hour.
Daily Rollup (peak): The highest values from the hourly rollups during the
last 24 hour period.
Weekly Rollup (peak): The highest values from the daily rollups during the
last seven days.
Monthly Rollup (peak): The highest values from the daily rollups during the
last calendar month.
Quarterly Rollup (peak): The highest values from the monthly rollups during
the last quarter.
Note: Monthly and quarterly rollups are not generated daily, as this operation
would generate a considerable computation load every day.
Although average and peak are the two most common metrics, other metrics
collected by the performance job use different rollups. For example, when the
Powered On status is rolled up, Virtualization Manager only retains whether the
system was mostly on or off during the rollup period.
Data retention
Raw performance data is saved for 14 days, and hourly rollups are saved for 90
days by default. You can change how long Virtualization Manager retains this
data under Setup > Advanced Setup > System Properties. Increasing the
length of time data is retained may slow down the application or the database if
you do not provide adequate storage resources. However, any increase to the
raw performance data and hourly rollup retention will significantly impact your
database size.
This can be configured in Setup > Advanced Setup > System Properties.
The following table provides data retention information per rollup period.
101
Chapter 3: Administration and setup
Period
Default retention period
Latest values (raw data) 14 days (configurable)
Hourly rollup
90 days (configurable)
Daily rollup
Indefinite
Weekly rollup
Indefinite
Monthly rollup
Indefinite
Yearly rollup
Indefinite
Aggregation
Aggregation combines the performance data collected during the same time
across your virtual environment. To calculate overall performance and load
statistics for data stores, for example, Virtualization Manager collects partial data
from each individual host and VM which accesses the data store, and then
aggregates that data to get a complete picture of the load and performance of that
data store.
Raw data is aggregated by the collection job in real time. When there are
aggregate raw data points, they are stored, processed, indexed, and rolled up by
Virtualization Manager.
Infrastructure aging
If no data is collected against a piece of your virtual infrastructure after 24 hours,
that piece, or configuration item (CI), is considered "stale," and data relating to it is
grayed out. After 48 hours with no data collected, Virtualization Manager
considers that CI to be removed from your infrastructure and stops displaying
information about it. The data is not deleted from the database, and if the CI
reappears in your virtual environment, Virtualization Manager links the new
information to the information already gathered in the database.
102
Chapter 4: Key features
SolarWinds Virtualization Manager is a comprehensive virtual environment
management solution that helps you solve VM sprawl, identify performance
bottlenecks, plan for changing capacity requirements, and illustrate showback
and chargeback. Virtualization Manager is pre-populated with industry best
practice-based tools to enable you to more efficiently manage your virtual
environment.
Dashboard
The Dashboard area uses widgets to bring you information at a glance regarding
performance, capacity planning, VM sprawl, and more. You can customize both
dashboards and dashboard widgets to display what is most important to your
environment. The dashboard answers high-level questions such as the following:
l
Which VMs are experiencing the most latency?
l
Which clusters have memory ballooning issues?
l
What is my average uptime?
l
What is the estimated cost of running a set of VMs in the cloud (EC2)?
Dashboard information is frequently used as a starting point in investigating
environmental issues.
Explore
In the Explore area you can quickly view items in your environment, including
historical information collected by Virtualization Manager. You can view your
environment in the Map, the content stored in Virtualization Manager, historical
information for alerts and resources, and more. Information in the Explore tab helps answer questions such as the following:
103
Chapter 4: Key features
l
What did my environment look like in the past?
l
What details are collected per resource?
l
How similar are two resources?
Capacity planning
By using the Capacity Planner tool you can create capacity plans. You can create
what-if scenarios, visualize how long you can continue with your current load, or
plan when to procure new resources. The Capacity Planner answers questions
such as:
l
When will I run out of resources?
l
What are my resource constraints?
l
How many more VMs can I add?
Search
The search engine is the underpinning of many of the tools and customizations
that you can perform. Saved search queries can be used to create new reports,
alerts, trends, and more.
Common capacity management questions
The following sections briefly demonstrate how to answer management questions
with Virtualization Manager. Usually, several tools are used in conjunction to
answer questions such as the following:
l
How do I find performance bottlenecks?
l
How can I diagnose historic performance issues?
l
How do I create a virtualization capacity plan?
l
l
How can I solve VM sprawl, reclaim resources, and rightsize my virtual
environment?
How much would it cost to move my virtual infrastructure to Amazon EC2?
104
How do I find performance bottlenecks?
How do I find performance bottlenecks?
Bottlenecked areas, where a single or limited number of items restrict the
performance of a resource, can be identified using the administrator dashboard,
alerts, or the Capacity Planner. The administrator dashboard hosts widgets that monitor various performance
contention metrics such as CPU, memory, disk, I/O, and storage metrics. By using
the dashboard, you can quickly view which areas per resource may need to be
addressed. You can create alerts for other areas that you want to monitor that are
not included in the default alerts. By using the Capacity Planner you can
proactively identify what will become a bottleneck in the future. For more
information, see Capacity planning.
How can I diagnose historic performance issues?
Virtualization Manager collects data and stores it to compile historical information
about the resources, which is most effective when enough time has elapsed to
create a large base of comparison.
For example, I/O latency data is not available until data has been collected for
some time, and the accuracy of the information increases as more data is
gathered. You can use the dashboard to look at current trend information, while
the historical performance analyzer charts allow more in-depth views to issues
and trends in your resources. For more information, see Historical performance analyzer charts.
How do I create a virtualization capacity plan?
You can use the Capacity Planner to view potential bottlenecks, plan additions to
your current infrastructure, or determine when you need to expand your capacity.
Information is drawn from you current environment and data sources to compile
your current capacity and to predict the potential capacity.
Additionally, you can use the dashboards and alerts to monitor your current
capacity for spikes that indicate changing needs.
For more information, see Capacity planning.
105
Chapter 4: Key features
How can I solve VM sprawl, reclaim resources, and rightsize my
virtual environment?
Virtualization Manager includes a VM sprawl dashboard that displays the number
of unused, oversized, and undersized VMs over time along with other metrics
useful in effectively utilizing your virtual environment. You can use business
views to gather more information about which resources are overallocated and
underallocated, which VMs are sized incorrectly, and which VMs are stale.
For more information, see Business views.
How much would it cost to move my virtual infrastructure to
Amazon EC2?
Virtualization Manager contains a Cloud Cost (EC2) dashboard which displays
data about what it would cost to move your current virtual infrastructure or a
specific part of it to Amazon EC2.
Because the costs of using cloud services depend on unique factors, such as the
location of the servers, Virtualization Manager does not cover all the possibilities
by default in its cloud cost calculation. However, you can modify the algorithm
Virtualization Manager uses for the cloud cost calculations to fit your needs.
To find and modify the criteria based on which the cloud costs are
calculated:
1. Navigate to Explore > Content.
2. Under Filter content, open the by type accordion, and then select Trends.
3. Search for EC2 to find the relevant EC2 trends you want to modify.
4. Click on the trend you want, and then click Configure on the bottom of the
screen.
5. Select the Criteria tab of the trend to see the XPath query that is used for
calculating the cloud cost.
For example, the criteria for the EC2 Average Monthly Windows VM Cost trend
is the following:
if (/virtualMachine/memory <= 1740.8 and /virtualMachine/cpuCount <=1)
then 87.6 else if
106
How much would it cost to move my virtual infrastructure to Amazon EC2?
(/virtualMachine/memory <= 1740.8 and /virtualMachine/cpuCount <=5) then
211.7 else if
(/virtualMachine/memory <= 7680 and /virtualMachine/cpuCount <=4) then
350.4 else if
(/virtualMachine/memory <= 17510.4 and /virtualMachine/cpuCount <=6.5)
then 452.6 else if
(/virtualMachine/memory <= 15360 and /virtualMachine/cpuCount <=8) then
700.8 else if
(/virtualMachine/memory <= 7168 and /virtualMachine/cpuCount <=20) then
846.8 else if
(/virtualMachine/memory <= 35020.8 and /virtualMachine/cpuCount <=13)
then 1051.2 else 2102.4
The first line represents Windows on m1.small instance with 1.8 GiB of memory
and one vCPU. The last number is the price per month. To adapt the query to
your needs, modify the numbers according to the output of the cloud cost
calculator provided by Amazon or other cloud providers.
107
Chapter 5: Dashboards
Dashboards form a single pane of glass to highlight important information about
your virtual environment. Dashboards are customizable.
SolarWinds Virtualization Manager contains a number of default dashboards.
Depending on your data sources, not all dashboards are available. To view a
different dashboard, select it from the More Dashboards list.
To prevent users from modifying dashboards, make the dashboards
world readable only: Navigate to Explore > Content, and then search
for the dashboard whose permission level you want to modify. Select
the dashboard, and then click Edit (pencil icon) in the lower left.
Change the permission to World Readable, and then click Save.
SolarWinds Virtualization manager contains the following default dashboards.
108
Chapter 5: Dashboards
Admin - Desktop
Provides a high level view of VMs running a desktop OS and related
infrastructure.
Administrator
Provides a quick view of alerts, depleted resources, and virtual environment
health for VMware, Hyper-V, or mixed environments.
Capacity Planning
Provides details about resources that are nearly depleted, and provides an
overview of the capacity in the virtual infrastructure.
Cloud Cost (EC2)
Provides information about the cost of moving the current virtual
infrastructure to Amazon EC2. For more information, see How much would it
cost to move my virtual infrastructure to Amazon EC2?
Cluster Host Health
Provides high level details of the health statistics for cluster hosts in
VMware, Hyper-V, or mixed environments.
Manager
Provides a high level view of the size and scope of the virtual environment
and its available capacity for VMware, Hyper-V, or mixed environments.
Reporting
Provides trends about how the virtual environment is changing over time.
Showback
Provides a quick view of how the virtual machines are being used over time.
Storage
Provides insight into the virtual environment storage utilization, mostly from
the data store point of view.
VM Sprawl
Shows the resources that are currently being wasted by inactive VMs and
other virtual infrastructure.
109
Dashboard basics
Dashboard basics
You can always return to the dashboards by clicking the logo at the top left of the
SolarWinds Virtualization Manager application or by using the Recent tab to
navigate to the dashboard.
To view a different dashboard, select it from the More Dashboards list.
To create a new dashboard, click New Dashboard. After naming the new
dashboard, it is displayed as an empty dashboard. All new dashboards are empty
except for the Add Widget placeholder represented by the empty widget with a
blue plus sign (+). For information about adding widgets, see Common widget
controls and the following section.
To create a report based on the contents of the current dashboard, click Create
Dashboard Report.
Dashboards are composed of one or more widgets. A widget is a small window in
each dashboard which presents information from the SolarWinds Virtualization
Manager system. There is no limit to the number of widgets that you can place on
a dashboard. Virtualization Manager contains the following widget types:
l
Alert Monitor widget
l
Consumption widget
l
Content/Alert List
l
Facet View widget
l
Fitment widget
l
Map widget
l
Notes widget
l
Performance Chart widget
l
RSS Feed widget
l
Top N widget
l
Trend widget
110
Chapter 5: Dashboards
Each dashboard contains a final widget with a blue plus sign (+) which you can
click to add a new widget to the dashboard. This walks you through the
configuration of the new widget depending on its type. Configuration options for
each type of widget are covered in the following sections.
Dashboards are another type of content in SolarWinds Virtualization Manager.
You can view and manage all of your dashboards in the Content Manager. You
can also make a dashboard private to have a highly personalized view of your
virtual environment.
To set up a default dashboard for a user, navigate to Setup >
Advanced Setup > Users, select the user from the list, and then click
Set Default Dashboard. After selecting the default, the same
dashboard will be loaded for the user every time they log in.
Common widget controls
Regardless of the type of widget, the following common controls are displayed at
the top of each widget:
l
Move -
l
Options -
l
Open Related -
Moving widgets
To move a widget to a different location on the Dashboard, drag the Move button
to the location you want. All other widgets will be reorganized according to the
widget you moved.
Displaying widget options
Click the Options button to display the following commands:
111
Opening related content
l
Edit widget: Edit the options and properties of the widget. In most widgets
you can configure the data columns that are displayed in the widget from the
Columns tab. Other configurable options and properties are covered in the
widget descriptions.
l
Export as PNG: Create a graphics file of the current widget state.
l
Resize: Resize the widget.
l
Copy Widget Link: Create a URL for the widget and copy the URL to the
clipboard. You can paste the URL from the clipboard to share the widget
with others in an email message or web page.
l
l
Make a copy of this widget: Create a duplicate of this widget on the
dashboard. You can edit the duplicate to make a new version of the widget.
Delete: Remove the widget from the dashboard.
Opening related content
By using the Open Related button you can explore the information in your widget
on a grander scale.
For example, on the map widget, the Open Related button takes you to a fullsized map view. On a Trend widget, the button plots the data on a full-sized
business view.
Widget types
Each widget has its own unique perspective, controls, and configuration options.
This section contains information about each widget type in detail.
l
Alert Monitor widget
l
Consumption widget
l
Content/Alert List
l
Facet View widget
l
Fitment widget
l
Map widget
112
Chapter 5: Dashboards
l
Notes widget
l
Performance Chart widget
l
RSS Feed widget
l
Top N widget
l
Trend widget
Alert Monitor widget
By using Alert Monitor widgets, you can view some or all of the alerts configured
in SolarWinds Virtualization Manager.
Alerts are another form of content in the SolarWinds Virtualization Manager
system. The bulk of the configuration for an Alert Monitor widget is similar to
picking content for a Content Viewer widget.
To add a new Alert Monitor widget:
1. Click the Add Widget placeholder.
2. Enter a title and subtitle for the alert widget.
3. Navigate to the Alert tab, and then click Select an Alert.
4. Choose an alert. You can filter the number of alerts available for selection
by using tags or by searching. You can also view only alerts that you own.
To narrow down your view to a smaller set of alerts, create a custom tag in
113
Consumption widget
the Content Manager, and then select only that tag.
5. Save the alert.
The only custom control for an Alert Monitor Widget is the Refresh link at the top
of the widget. This reloads the alerts with their current status.
Consumption widget
Consumption widgets show the remaining virtualization resources based on the
default usage profile and the default resource container. You can change both the
resource container and the usage profile.
Content/Alert List
By using Content/Alert List widgets you can have any content in the SolarWinds
Virtualization Manager system available to you on your dashboard. Every piece of
content that is displayed in the widget is a link that launches into a detailed view
for that type of content.
114
Chapter 5: Dashboards
All content in SolarWinds Virtualization Manager has a type, tags, and an owner.
To add a new Content Viewer widget, click the blue plus (+) widget at the end of
every dashboard to add the widget manually. Select the type of content and
optionally select the content with a given tag to display. Then choose an attribute
to sort the content by. You can choose from the following options:
l
assetType: The type of content
l
dateCreated: The creation date of the content
l
dateModified: The last modification date of the content
l
displayName: The name of the content
You can also choose to see all content visible to you, or only content that you
own.
The only custom control for an Alert Monitor Widget is the Refresh link at the top
of the widget. This reloads the list of content in the widget in case more has been
created since the dashboard was last refreshed.
Facet View widget
To create a new Facet Visualization widget, first enter the Data center visualizer
section of Business Views and configure the pie chart. Then click Add Widget in
the top right of the screen to save the view as a widget. Pick the dashboard in
which that widget will reside, and then click Save.
115
Fitment widget
You can also click the blue plus (+) widget at the end of every dashboard to add
the widget manually. In this process, you are prompted for the Search Query from
which you want to facet, and the type of entity (VM, host, datastore, cluster, or
application) to search. You can enter the search query manually or load a saved
query by using the Load query link. Next, select the facet property that will break
down the search results into pie sections. You can enter the facet property
manually, or click Select facet to choose from a list of all facets. Click Save to
view your new widget, or click Cancel.
The process of configuring a Facet Visualization Widget is identical to the
process of creating a new one except that its current Search Query and facet will
be pre-populated.
The last control on the Facet Visualization Widget is the Explore link at the top of
the widget. Click this link to display a full screen view of that Facet Visualization
in the Data Center Visualization section of Business Views.
Fitment widget
By using fitment widgets, you can see the number of VMs that you can add to your
various clusters, given the current load on the virtual infrastructure.
116
Chapter 5: Dashboards
Fitment widgets are driven by a supply side and a demand side. The supply side
is a Resource Container and defines the computing resources that are available
in one or more hosts or all the hosts in one or more clusters. The demand side is
called a Usage Profile and it defines the set of VMs that utilize the computing
resources. For more information, see Capacity planning.
To configure a Fitment Widget, click the blue plus (+) widget at the end of a
dashboard to add the widget manually. The default view uses the Default (All
Clusters) as the resource and the Default (All VMs) as the consumption usage
profile. Edit the widget to change the resource, usage profiles, and workload size.
Click Recalculate to recompute the capacity plan in the widget.
Map widget
By using the Map widget, you can add a smaller version of the map view directly
to your dashboard.
117
Notes widget
The default map widget view displays all available VMs, hosts, datastores,
clusters, and applications. To switch object types, click the object counter at the
bottom.
Widget options
Click
> Edit Widget to change the context.
Open related
Click
to open the large map view with the current context.
The Refresh link at the top of the widget reloads the list of content in the widget in
case more has been created since the dashboard was last refreshed. The Show
in Search link at the top of the widget opens the selected map view in the search
results page.
Notes widget
By using the Notes widget, you can display any notes added to inventory items.
This is a convenient way to share team information about past activity or planned
future activity. All notes can be displayed on a widget.
Like all content in SolarWinds Virtualization Manager, all notes can be tagged.
When adding a Notes Widget, you can select to show all notes in the system, or
just notes with a certain tag.
Select the tag of the notes you want to show when creating the widget.
For information about creating notes, see Notes.
118
Chapter 5: Dashboards
Performance Chart widget
By using the Performance Chart widget you can place metrics on your dashboard.
Note: New chart widgets are empty until you configure the chart details in the
options.
Widget options
Click
> Edit Widget > Chart to select the asset type, the asset, and the metric.
Open related
Click
to plot the current metric on the larger chart view.
RSS Feed widget
By using the RSS Feed widget you can view any RSS feed on the dashboard.
This widget is included by default on the Administrator Dashboard to inform you
about company news and product updates.
119
Top N widget
To configure the RSS Feed Widget, click the blue plus (+) widget at the end of a
dashboard, and then provide the URL of the RSS feed you want to view in the
widget. Click Save to view your new widget.
The only custom control on the RSS Feed widget is the Refresh link at the top.
Click this link to get a fresh version of the RSS feed and refresh the widget with
new content.
Top N widget
Top N widgets display a short list of virtual entities (VMs, hosts, clusters, data
stores, or applications) that are using more resources than their counterparts. Top
N widgets without graphs provide more real estate for more results.
Top N widgets with graphs display both the value of the resource consumed and
a historical chart of the consumption of the given resource over time.
120
Chapter 5: Dashboards
To configure a Top N widget, click the blue plus (+) widget at the end of a
dashboard to add the widget manually. Then specify the title of the widget, select
the type of entity to display, and enter the search query used to get those items.
This lets you see all or just a subsection of your virtual environment. You can
enter the search query manually, or load a saved query by using the Load query
(optional) link. Next, select Pick a sort field to pick a field that determines how
the results are ordered in your Top N widget (ascending or descending).
You can select which columns are displayed by clicking the plus button and
adding an attribute. You can reorder or edit the columns after they have been
added to the widget. You can optionally select to include a graph with the Top N
results by clicking the Overlay Graph (optional) link. This displays all the graphs
available to display in the widget.
If you create dashboard reports from dashboards with Top-N widgets, you can
also choose how many results are displayed in the widget.
By using the custom controls for a Top N widget, you can add the virtual entities
to the active list, view the items in the performance analyzer, and run the search in
the search results view. The Graph link opens the entities in the Performance
Analyzer to give you a full screen view of the entities and their resource
consumption over time.
Trend widget
By using trend widgets, you can embed a historical trend graph or a multi-trend
table into a dashboard.
Historical trend graphs look like the following image:
121
Trend widget
Multi-trend tables provide a tabular view of trend data:
To create a new Facet Historical Chart widget, find the trend in the Business
Views section of SolarWinds Virtualization Manager. When you are viewing the
trend, click Add Widget in the top right of the screen to save the trend as a
widget. Pick the dashboard in which you want to place the widget, and then click
Save.
You can also click the blue plus (+) widget at the end of a dashboard to add the
widget manually.
On the Mode tab, select Historical Chart or Multi-Trend Table to determine the
widget type.
l
Segments to display: The maximum number of items to identify in the chart
or table.
122
Chapter 5: Dashboards
l
Trailing Window (days): The amount of history to show on the historical
chart.
On the Trends tab, click Add Trend to add one or more trends. You can filter the
list of trends by tag, ownership, or by a search term.
For Historical Charts, you can choose to View the trend in detail. This launches
into the trends of Business Views and displays a full screen version of the trend.
Customizing widgets
You can customize widgets from existing widget types. Some widgets can be
customized directly from the widget, such as the RSS Feed widget, and some
widgets need a custom search query, such as the Top N widget.
For widgets that do not rely on a modifiable query, add the widget and use the
Edit control to make any necessary changes.
For widgets that rely on a selectable query, first create the query. You can save
the query, create a trend from the query, or do both. When you customize the
widget, you can select the custom query or the custom trend.
Portal integration
Widgets can be viewed outside of the SolarWinds Virtualization Manager
application.
To obtain the URL to embed or link to a widget, click the arrow on the top right of
the widget, and then select Copy widget link.
123
SolarWinds Orion server
This option provides a direct URL to a read-only view of the widget as well as the
HTML source code to embed the widget in another web page. The URL is valid
for the specific widget spot, not for the specific widget. For example, if you get the
URL for the first widget, which could be a Top-N widget, and then you later put a
Trend widget in the first spot, the URL will show the Trend widget.
When you embed widgets in other HTML pages, provide at least 354 pixel width.
A narrower width may result in scroll-bars placed over the widget.
If you use localhost, the URL you receive is also from localhost, and it is not
accessible from the outside. In this case, replace localhost with the real server
host name or IP address.
SolarWinds Orion server
SolarWinds Virtualization Manager can integrate with Orion platform products by
embedding a widget on a page.
To embed a widget on the SolarWinds Orion server:
1. In Virtualization Manager, click Copy Widget Link above the widget.
2. Copy the HTML code.
3. Open your SolarWinds Orion product and navigate to the page from which
you want to view your Virtualization Manager widget.
4. Click Customize Page.
5. Click the plus sign icon in a column.
124
Chapter 5: Dashboards
6. Group the available resources by type, and then select Custom
Resources.
7. Select Custom HTML, and then click Add selected resources.
8. Click Done in the Customize Page screen.
9. Click Edit on the Custom HTML widget.
10. Paste the HTML code copied from Virtualization Manager.
11. Click Submit.
OpenSocial portals
The OpenSocial dashboard standard of Google is a common way to share
gadgets. The widgets of SolarWinds Virtualization Manager can be displayed
inside of an OpenSocial Gadget. This example uses the Atlassian JIRA project.
To use a Virtualization Manager widget in an OpenSocial portal:
1. Add the gadget to your directory of gadgets.
2. In JIRA, click Add Gadget at the top of any dashboard.
3. Click the Add Gadget to Directory.
4. Provide your gadget URL.
Now the SolarWinds Virtualization Manager gadget is ready to be used on your
OpenSocial compliant dashboard. In JIRA, click the Add it Now button to place
an empty gadget on your dashboard, and then complete the following steps to
configure the gadget.
1. Click Edit at the top of the widget
2. Configure the following two fields:
l
SWF URL: This field is where the gadget should look for the flash
movie. Use the Widget URL retrieved from Virtualization Manager, but
remove everything after the ConsoleContainer.swf. For example,
http://hyper9.example.com:8983/hyper9/ConsoleContainer.swf.
125
Microsoft SharePoint
l
Widget Token: This field is for the unique token for the widget. This is
the last section of the widget URL after the = symbol.
3. Click Save to display the gadget.
The result is a Virtualization Manager widget inside an OpenSocial portal.
Microsoft SharePoint
Microsoft SharePoint restricts flash content that can be placed into a generic
HTML page editor. Complete the following steps to add the widget flash movie to
your SharePoint page as a Web Part. These directions were constructed using
SharePoint 2010, but they also apply loosely to SharePoint 2007 in the sense
that you must edit the HTML source of a Content Editor Web Part.
1. Open the page in SharePoint that you will be editing.
2. Go to Site Actions > Edit Page.
3. Under Editing Tools at the top of the screen, click Insert.
4. From the Insert menu, select Web Part.
5. Select Media and Content, and then add a Content Editor type to your
page.
6. Highlight the Content Editor on your page, and then click Format Text
under the Editing Tools header.
7. Select HTML > Edit HTML Source.
8. Use the embeddable HTML source code from the Get Widget URL window
to embed your widget in your SharePoint page as a Web Part.
126
Chapter 6: Business views
Business Views provide graphical representations of virtual infrastructure trends,
historical performance, and make-up. They give a high level overview of the
current performance and composition of your data center so that you can make
business decisions about capacity planning, chargeback, and system security.
Business Views have the following two aspects:
l
Trends -
l
Data center visualizer -
To reach the Business Views, click the Reporting tab, and then click Business
Views in the top menu.
Note: The Historical performance analyzer charts are no longer a section of the
Business Views. You can see performance charts from anywhere by clicking Add
to Chart when you have one or more objects selected.
Trends
Data centers undergo constant change, and SolarWinds Virtualization Manager
constantly collects and monitors configuration and performance data over time.
The Global Trends aspect displays high level changes of your environment over
time. Upon installation, the SolarWinds Virtualization Manager system begins
tracking over 70 trends that are contained within the product.
To access the Global Trends:
1. Click Reporting > Business Views.
2. Click the line chart icon on the top left.
By default, each trend runs a search every four hours and records the result. The
result may be a count of the number of results returned, or a value based on data
127
Chapter 6: Business views
within each search result. You can change the default four hour interval to run
searches more or less often, but this value typically should be the same as the
configuration collection interval, because most trends are based on configuration
data. You can change the default interval for the Hourly Interval for Trend
Execution property in the System Properties screen. For more information, see
Configuring system properties.
Trend operations
You can perform the following operations with the currently loaded trend using the
links in the top right corner of the Trend screen:
l
l
l
l
Add Widget: Creates a widget view of the trend, showing a maximum of
four segment lines, on a dashboard of your choice.
Save Report: Generates an Excel spreadsheet that contains all data points
for all segments in the current view of the trend.
Search: Executes the search that powers the trend, and shows the results
on the Search page.
Configure: Opens the configuration page where you can edit the trend. For
more information about the configuration options of trends, see Creating
trends.
Creating trends
Apart from the trends that are available by default, you can also create your own
trends.
To create a trend:
1. Perform a search.
2. Click Trend Results to access the Trend creation screen.
128
Creating trends
To avoid building trends from scratch, you can base new trends on
already existing ones. Choose a trend under Explore > Content, and
then modify the evaluation criteria to suit your needs.
The Trend creation screen consists of the following tabs:
l
l
Scope: On this tab, the item type is automatically selected, and the Search
Query field is pre-populated according to the search query you used.
Criteria: To trend the number of search results over time, select Search
result count. To pull data out of each search result, instead of just using the
count of search results, you have two options:
l
l
Select Attribute in the Criteria tab, and then type the name of the
attribute you want to base the trend on. The autocomplete function
suggests options based on what you have typed so far. To select from
all the available attributes, click Find.
Use XPath in the Attribute field. This requires familiarity with the
SolarWinds Virtualization Manager configuration model, but provides
a powerful way to do math operations on multiple values to return the
attribute value.
Whether you use XPath, or select an attribute, make sure that you select the
appropriate unit from the Units list for the data you want to pull. Also make
sure that you choose a value from the Aggregation Function list to specify
whether you want to count the number of values, the total (sum) of the
values, or the minimum, maximum or average of values.
l
Segmentation: To create a trend with multiple lines that are segmented by
some attribute, type the name of an attribute in the Segmentation field, or
click Find to select from the list of available attributes. Each unique value in
the Segmentation field results in a different line in the trend. For instance,
to see the total disk space used for each operating system, create a
129
Chapter 6: Business views
segmentation for the operating system so that you see one trend line per
segmenting value.
After you finished setting up the details of the new trend, click Preview at the
bottom of the screen to see the set of values that will be saved as trend values if
you decide to run the trend. If the preview shows that the trend is set up correctly,
click Save to persist the trend with a new name and an optional description, and
begin tracking data center changes.
Data center visualizer
Some properties of the items in the virtual infrastructure have a finite number of
available options for values. These are called facets in SolarWinds Virtualization
Manager. In the Data Center Visualizer you can display pie chart breakdowns of
your inventory according to these facets.
To get to the Data Center Visualizer:
1. Click Reporting > Business Views.
2. Click the pie chart icon in the top left.
To view a different property as a facet:
1. If the list of facets is not displayed by default, click Facets under
Configuration Explorer.
2. Select the facet from the list.
A new pie chart is displayed, showing all the unique values for that particular
property in Virtualization Manager. Hover over a section of the chart to see the
corresponding value, and the number of entities that make up the section. To
bring the entities of a pie chart up as search results, click Search in the top right.
This way you can get a quick breakdown of your data center, and see what
entities make up each segment of the pie chart.
After clicking a pie section, you can use the Sort Selected Facet By controls in
the top left. These controls hold all custom labels that you defined, and they
130
Historical performance analyzer charts
display how an individual pie section breaks down according to a custom label.
For example, if you have a custom label defined for each department, you can
see the breakdown of the pie section according to this label by completing the
following steps:
1. Click a pie section in the vm.host.hostname facet.
2. Select the "Department" custom field in the top left.
3. Click Apply.
As a result, the departments that have VMs on the host that you selected in the
pie chart are displayed.
To save the newly created visualization of your data center, click Add Widget in
the top right to save it to one or more of your dashboards.
Historical performance analyzer charts
SolarWinds Virtualization Manager collects performance data frequently and
stores that data over time. As a result, all performance data can be visualized over
time. A subset of the data that is available to graph includes the following:
l
CPU Ready
l
CPU Used
l
CPU Wait
l
IOPs (Input/Output per second)
l
Memory Active
l
Memory Ballooning
l
Memory Consumed
l
Memory Swap In
l
Memory Swap Out
l
Memory Utilization %
131
Chapter 6: Business views
l
Net Packets Rx
l
Net Packets Tx
To view data for any object, select one or more objects, and then click Add to
Chart.
This takes you directly to the performance chart.
To add additional lines for comparison:
1. Click Add Line in the leftmost portion of the Performance Analyzer.
2. Select the line from the list.
To change the time frame of the chart, click the start and end dates at the bottom
of the Performance Analyzer.
Graphed objects can have additional graph controls:
l
: Click this control to open a dialog box to add lines from this VM, its
parent cluster, its parent host, or related data stores.
132
Historical performance analyzer charts
l
: Click this control to view the individual component values that determine
the overall value of this line. For example, viewing the component values for
CPU usage displays the individual vCPU cores. If the line is made up of
multiple components, only eight components are displayed on the chart.
l
: Click this control to view the component values as a stacked chart.
133
Chapter 6: Business views
Capacity planning
All lines on the performance charts include an optional "best fit" line that shows a
flat line which best fits the points for that metric. To see the best fit line, select the
Best Fit option at the top of the chart.
The best fit line is based on a classic least squares linear regression calculation
of the data points. It is only meaningful if there is an underlying long term trend in
resource utilization. For some resources, for example, disk space, this is almost
inevitable. For others, for example, CPU, it only applies if the externally applied
system load is driving a trend in the data set. The calculation is done on the data
range selected in the graph. Hover over the best fit line to see the following
values:
l
l
Gradient is the slope of the line, it displays the rate of growth of the
performance metric or trend.
r2 is the r-squared coefficient of determination. The range of possible values
is 0.0 to 1.0. A higher value means that the data better fits a straight line
projection with growth over time. Do not lend too much weight to this value if
there is only a small number of data points in the graph. For example, if
there are only two data points in the graph, the value of r2 will always be
1.0. A low value of r2 indicates either a lot of variability in the data, or that
the data do not change significantly with time. Either of these cases means
that extrapolating a "drop dead" date on the specific resource is invalid.
For any metric that is a percentage of total resources, the best fit line also
includes an estimate for when that value will reach 100%. This gives you a
predictive analysis of how your resources are trending over time, so that you can
plan when to insert more resources.
Overlays
At the top of the Performance Analyzer chart there are other options that control
data that can be overlaid on top of the time line in context of the lines being
displayed.
134
Overlays
l
Config Collections: Displays an overlay of the configuration collection
times.
l
Notes: Displays an overlay of notes.
l
Alerts: Displays a historical overlay of alert notifications.
135
Chapter 7: Search
The search engine of Virtualization Manager has been specifically tailored to
handle the challenges posed by searching large, in-depth, unstructured
information sets, such as the data created from an operational virtualized
environment. You can create search queries for any items of interest within the
entire scope of the virtualized environment. This includes searching for both the
performance and configuration details of the following item types:
l
vCenters
l
clusters
l
data stores
l
hosts
l
applications
l
virtual machines
The installation and configuration process facilitates the establishment of a data
collection process for the defined Virtual Center servers and unmanaged hosts.
This process consists of the following parts:
l
It leverages the vendor supplied APIs to access all available data provided
for these objects.
l
l
A discovery process enumerates and explores the configurations of virtual
machines, hosts, data stores, and clusters.
A Windows Management Instrumentation (WMI) interrogation of the virtual
machines augments this data set.
The entire process of data collection is repeated at periodic intervals. The end
result is a data repository that accurately represents the configuration, state,
136
Chapter 7: Search
performance, and utilization of the virtual infrastructure. This data repository is
queried by the search service of Virtualization Manager, and the data is available
for analysis.
Several items on the dashboard perform a search and show results on the search
page. The query for the search is pre-populated in the search bar. Many times,
you can edit this search to modify the results. However, you can also create
search queries from scratch. For more information, see Searching for objects in
Virtualization Manager.
Searching for objects in Virtualization Manager
The Search bar is located at the top of the Virtualization Manager user interface.
The previous image shows a simple query, “*”.
To start a search:
1. Select the type of objects from the list you want to search for. You can
search for applications, clusters, datastores, hosts, and VMs.
2. Type the search query in the search bar.
3. Click Search, or press Enter.
For example, to search for nodes which have been added to the system
recently, execute the following search query:
vm.internal.dateCreated:[now-7days TO *]
After executing the query, you can build alerts based on the search
results. For more information, see Alerts.
137
Search details
To save an executed search query:
1. Click Save as at the bottom of the main interface.
2. Specify the name, description, tags, and permissions for the search.
Use the permission settings to specify the sharing of the search query with other
Virtualization Manager users.
You can choose from the following permission types:
l
Private: Only the user saving the search query has access.
l
World Writable: All users can view and modify the query.
l
World Readable: All users can view the query.
To execute a saved search:
1. Click Load in the bottom right of the main interface. The saved queries in
your private folders are displayed by default.
2. Search for a saved query by name, or filter by tags for a saved query.
3. Click OK to execute the search.
Search details
Click any search result to open the Search Details page. For each type of search
result the details differ, but there are important details to help you understand the
importance of a particular item to the virtual environment.
The left column displays the vital performance metrics of the item, and alerts
about its performance. Click an alert to see the corresponding details. The icon
indicates the importance of the alert.
The right column displays the relationship of the particular item to the other
members of the virtual infrastructure. Click any of these items to open it on the
search details page.
138
Chapter 7: Search
Search result actions
Select the check boxes next to one or more search result to see the available
actions that you can execute on them.
The action buttons launch into a new module of Virtualization Manager with the
selected search results in context. The possible actions are the following:
l
Add to List: Adds the search results to the Active List.
l
Add Note: Places a custom note on the selected search results.
l
l
l
l
l
l
l
l
Add to Chart: Opens the Performance Analyzer with the selected search
results in context to view graphs of performance metrics over time.
Map: Displays a dependency map of the virtual infrastructure with the
selected search results in context.
View Notes: Displays any custom notes on any of the selected search
results.
Export: Performs data export to create a spreadsheet that contains details
about the properties of the selected search results.
Plan: Creates a capacity plan using the selected search results.
Add to App: Groups the VM search results together into an application.
This action is only applicable to VM search results.
Compare: Performs a DNA comparison between one or two selected
search results.
Label: Adds or edits the labels attached to the selected search results.
Note: The action buttons are only displayed after you select one or more search
results.
Search query actions
The search query you specify can be used to power other areas of Virtualization
Manager. Usually, the search query is entered in the search bar and executed
with the Search button. After you have found a query that you want to use as the
139
Search language
basis for other activities, such as creating trends, alerts, or performance charts, or
for data export, select an action.
The search query actions are the following:
l
Create Alert: Creates a new alert based on the search query.
l
Trend Results: Creates a new trend based on the search query.
l
l
l
Export Results: Creates a spreadsheet of properties from the search
results in the Data Export module.
Plan: Creates a capacity plan from the search results.
Explore Facets: Opens the Data Center Visualizer with the search results
from the search query in context.
Search language
The Virtualization Manager search language is a powerful search syntax with
which you can create multi-clause, proper-name, instance-based search queries.
Queries are composed of terms and operators. A term can be a single term or a
phrase. A single term is a single word such as “windows” or “west”. A phrase is a
group of words surrounded by quotation marks, such as “windows west”.
Multiple terms can be combined with Boolean operators to form more complex
queries. If there are multiple terms, they are implicitly joined together with AND
clauses meaning that all clauses must be true for the search results.
The following advanced search syntax elements are also supported:
l
Wildcards
l
Fuzzy searches
l
Proximity searches
l
Range queries
l
Term relevance boosting
140
Chapter 7: Search
Language syntax
The following sections contain information about the Virtualization Manager
search query language elements, and about their usage.
Terms
There are two types of terms: single terms and phrases. A single term is a single
word such as "vm" or "west". A phrase is a group of words surrounded by
quotation marks, such as "vm west". You can combine multiple terms together
with Boolean operators to form a more complex query.
Fields
SolarWinds Virtualization Manager supports fielded data. When performing a
search you can either specify a field, or use the default field. You can search any
field by typing the field name followed by a colon, and then the term you are
looking for.
For example, SolarWinds Virtualization Manager may contain two fields, host and
text, and text is the default field. In this case, to find the virtual machine named
"River Ranch" which contains the text "Windows Server 2008", enter either one of
the following queries:
VM:"River Ranch" AND text:”Windows Server 2008”
or
VM:"River Ranch" AND “Windows Server 2008”
Because text is the default field, the field indicator is not required.
Note: The field is only valid for the term that it directly precedes, so the query
VM:River Ranch only finds VMs named "River". It finds "Ranch" in the default
field, in this case, the text field.
Using wildcard searches
SolarWinds Virtualization Manager supports single and multiple character
wildcard searches within single terms, but not within phrase queries. To perform a
single character wildcard search, use the "?" symbol. To perform a multiple
character wildcard search, use the "*" symbol. The single character wildcard
141
Using fuzzy searches
search looks for terms that match the search term with the single character
replaced. For example, to search for "ESX3.0.1" or "ESX3.0.2" you can use the
following search:
ESX3.0.?
Multiple character wildcard searches look for 0 or more characters. For example,
to search for ESX, ESX3.0.2 or ESX3.5, you can use the following search:
ESX*
You can also use wildcard searches in the middle of a term. For example:
ESX*2
Note: You cannot use a * or ? symbol as the first character of a search.
Using fuzzy searches
SolarWinds Virtualization Manager supports fuzzy searches based on the
Levenshtein distance algorithm. The Levenshtein distance is a metric for
measuring the amount of difference between two sequences, that is, the edit
distance. The Levenshtein distance between two strings is given by the minimum
number of operations needed to transform one string into the other, where an
operation is an insertion, deletion, or substitution of a single character.
To do a fuzzy search, use the tilde (~) symbol at the end of a single term. For
example, to search for a term similar in spelling to "SQL" use the fuzzy search:
SQL~
This search finds terms such as "PQL" and "TQL". An optional parameter can
specify the required similarity. The value is between 0 and 1. If the value is closer
to 1, only terms with a higher similarity will be matched. For example:
SQL~0.8
The default that is used if the optional parameter is not given is 0.5.
Using proximity searches
By using proximity searches, you can find words that are within a specific
distance away. To do a proximity search, use the tilde (~) symbol at the end of a
phrase. For example, to search for "Microsoft" and "Server" within 10 words of
each other in a document, use the following search:
"Microsoft Server"~10
142
Chapter 7: Search
Using range searches
By using range queries, you can match documents whose field values are
between the lower and upper bound specified by the range query. Range queries
can be inclusive or exclusive of the upper and lower bounds. Sorting is done
lexicographically. For example, the following query finds documents whose mod
date fields have values between 20020101 and 20030101, inclusive:
mod_date:[20020101 TO 20030101]
You can also use range queries with non-date fields. The following query finds all
VMs whose names are in the range between DB01 and DB10, but not including
DB01 and DB10:
VM:{DB01 TO DB10}
Note: Inclusive range queries are denoted by straight brackets. Exclusive range
queries are denoted by curly braces.
Using date searches
SolarWinds Virtualization Manager supports searching for both specific dates and
relative dates.
Specific date searches can be in the following formats:
vm.internal.datecreated:YYYY-MM-DD
vm.internal.datecreated:MM-DD-YYYY
The part separator can be either a dash (-), a slash (/) or a period (.).
Searches using either format or any part separator return the same VMs.
Use the following terms to include dates relative to now:
or YEARS
l
YEAR
l
MONTH
l
DAY, DAYS, or DATE
l
HOUR
l
MINUTE
or MINUTES
l
SECOND
or SECONDS
l
MILLI, MILLIS, MILLISECOND, or MILLISECONDS
or MONTHS
or HOURS
143
Boosting a term
Boosting a term
Virtualization Manager provides the relevance level of matching documents
based on the terms found. To boost a term, use the caret (^) symbol with a boost
factor (a number) at the end of the term you are searching. The higher the boost
factor, the more relevant the term will be.
You can control the relevance of a document by boosting its term. For example, if
you are searching for Microsoft Windows, and you want the term "Microsoft" to be
more relevant, boost it by using the ^ symbol along with the boost factor next to
the term. For example:
Microsoft^4 Windows
The previous search query makes documents with the term “Microsoft” appear
more relevant. You can also boost phrase terms as in the following example:
"Microsoft Windows"^4 "Server 2003"
By default, the boost factor is 1. Although the boost factor must be positive, it can
be less than 1, such as 0.2.
Using Boolean operators
By using Boolean operators, you can combine terms through logical operators.
You can use the following Boolean operators in Virtualization Manager:
l
AND
l
+
l
OR
l
NOT
l
-
Note: Boolean operators must be all capitals.
OR
The OR operator is the default conjunction operator. This means that if there is no
Boolean operator between two terms, the OR operator is used. The OR operator
links two terms and finds a matching document if either of the terms exists in the
144
Chapter 7: Search
document. This is equivalent to a union using sets. You can use the || symbol in
place of the word OR. To search for documents that contain either "Microsoft
Windows" or just "Microsoft", use either of the following queries:
"Microsoft Windows" Microsoft
"Microsoft Windows" OR Microsoft
AND
The AND operator matches documents where both terms exist anywhere in the
text of a single document. This is equivalent to an intersection using sets. You
can use the && symbol in place of the word AND. To search for documents that
contain "Microsoft Windows" and "SQL Server", use the following query:
"Microsoft Windows" AND "SQL Server"
+
The "+" or required operator requires that the term after the "+" symbol exist
somewhere in a field of a single document. To search for documents that must
contain "Microsoft" and may contain "Windows", use the following query:
+Microsoft Windows
NOT
The NOT operator excludes documents that contain the term after NOT. This is
equivalent to a difference using sets. You can use the ! symbol in place of the
word NOT. To search for documents that contain "Microsoft Windows" but not
"SQL Server", use the following query:
"Microsoft Windows" NOT "SQL Server"
Note: The NOT operator cannot be used with just one term. For example, the
following search does not return any results:
NOT "Microsoft Windows"
The "-" or prohibit operator excludes documents that contain the term after the "-"
symbol. To search for documents that contain "Microsoft Windows" but not "SQL
Server" use the following query:
"Microsoft Windows" -"SQL Server"
145
Grouping
Grouping
You can use parentheses to group clauses to form sub-queries. This can be
useful to control the Boolean logic for a query. To search for either "Microsoft" or
"VMware" and "Server", use the following query:
(Microsoft OR VMware) AND Server
The previous query eliminates any confusion, and makes sure that a server must
exist, and that either the term Microsoft or VMware may exist.
Field grouping
You can also use parentheses to group multiple clauses to a single field. To
search for a VM that contains both the word "Server" and the phrase "Oracle
Database", use the following query:
VM:(+Server +"Oracle Database")
Escaping special characters
To escape special characters that are part of the query syntax, type a backslash
(\) before the special character. The current list of special characters is the
following:
+ - && || ! ( ) { } [ ] ^ " ~ * ? : \
Search query examples
You can search for applications, clusters, data stores, hosts, and virtual machines
in SolarWinds Virtualization Manager. The following table contains examples of
the search queries you can execute. The examples listed in the table are search
queries for virtual machines, but the search language is the same for other types
of entities.
Search query
Results
*
A list of all virtual machines in
the SolarWinds Virtualization
Manager data repository
“vm.name:rcarecords-2-test”
Returns all VMs
146
Chapter 7: Search
Search query
Results
named rcarecords-2-test
rca*
Returns all VMs with any data
containing a word starting
with rca
rcarecords-?-test
Returns VMs named rcarecordsX-test where X can be any
character
rcarecords~
Returns VMs with any data
containing strings similar
to rcarecords
vm.environmentFor.diskVolume.freeSpace: All VMs whose disk volumes
[0 TO 10000000]
have 0 to 1000000 bytes free
space, not including 0 or
1000000
"Microsoft Windows"^4 "Server 2003"
All VMs with Microsoft
Windows and Server 2003 in the
OS details, where Microsoft
Windows is 4 times as relevant
as Server 2003
Server OR Workstation
Any VMs with any data
containing the
string Server or Workstation
Server AND Mail
Any VMs with any data
containing the
string Server and Mail
147
Named fields
Search query
Results
+Mail Server
Any VMs with any data that must
contain the string Mail but may
also contain the string Server
Mail NOT Server
Any VMs with any data that may
contain the string Mail but may
not contain the string Server
-Mail Server
Any VMs with any data that must
not contain the string Mail but
may contain the string Server
(Mail OR Web) AND Server
Any VMs with any data that may
contain the string Mail or Web in
combination with the
string Server
Named fields
Named fields provide a mechanism to search over the specific attributes
associated with virtual machines, hosts, data stores, clusters, and applications.
Named fields operate as facets do, by adding attribute filters to the search
language. You can enter named fields by specifying the exact property to target in
the search. Searches for named fields use the following syntax:
CI_TYPE.PROPERTY.SUB_PROPERTY:VALUE
The CI_TYPE can be one of the following:
l
vm = Virtual Machine
l
host = Host Server
l
cluster = Cluster
l
datastore = Datastore
148
Chapter 7: Search
Not all properties have a sub-property, therefore many named field searches use
the following syntax:
CI_TYPE.PROPERTY:VALUE.
Example search queries
The following section contains examples of the search syntax.
vm.cpuCount:2 AND vm.memory:1024
This query searches for all virtual machines with two CPUs and 1024 MBs of
memory as configured. The usage of MBs as the unit of measure for the memory
field is specific to the named field implementation.
You can also use more complex named field structures. They are based on dot
notation hierarchies as in the following example:
vm.environmentFor.networkAdapters.defaultGateway.ipV4Address:192.0.2.1
This query searches for virtual machines whose network adapter’s default
gateway is set to 192.0.2.1.
Named fields can also be composed of query sub-clauses and any other
additional search language features as in the following example:
vm.cpuCount:2 AND vm.memory:(1024 OR 2048)
In this example, the query searches for all virtual machines with two (2) CPUs and
1024 or 2048 MBs of memory as configured.
If a named field value contains special characters, it must be enclosed in quotes.
For example, the following query returns disk drives that are labeled "Hard", and
not "Hard Disk 1":
vm.environmentFor.diskVolume.label:Hard Disk 1
The correct version of the previous query is the following:
vm.environmentFor.diskVolume.label:"Hard Disk 1"
The following table contains an abbreviated list of fields and their description,
including the associated unit of measure.
Named field (without “vm.” qualifier)
Description
cpuCount
Number of
149
Example search queries
Named field (without “vm.” qualifier)
Description
vCPUs
configured
diskDrives.capacity
Capacity of
configured
virtual disk in
MBs
diskDrives.label
Name of
configured
virtual disk
environmentFor.cpus.description
Description
of CPU
environmentFor.cpus.deviceId
Processor
number
environmentFor.cpus.manufacturer
Manufacturer
of CPU
environmentFor.cpus.name
Name of
CPU
environmentFor.cpus.processorId
ID of
processor
environmentFor.cpus.socket
Socket
number of
CPU
environmentFor.cpus.speed
Speed of
CPU in MHz
150
Chapter 7: Search
Named field (without “vm.” qualifier)
Description
environmentFor.networkAdapters.defaultGateway.ipV4Address IP address of
default
gateway for
NIC
environmentFor.networkAdapters.dnsServers.ipV4Address
IP address of
DNS server
associated
with NIC
environmentFor.networkAdapters.ipAddress.ipV4Address
IP address of
NIC
environmentFor.networkAdapters.macAddress
MAC
address of
NIC
environmentFor.networkAdapters.name
Name of NIC
environmentFor.networkAdapters.status
Status of NIC
environmentFor.networkAdapters.type
Type of the
NIC
environmentFor.removableDrives.attachedMedia
Label or
location of
media
present in
removable
device
environmentFor.removableDrives.removableDriveType
151
Type of
removable
Example search queries
Named field (without “vm.” qualifier)
Description
device
environmentFor.runningOS.computerName
NetBIOS
name for
Guest OS
environmentFor.runningOS.currentTimeZone
Current time
zone
enabled for
Guest OS
environmentFor.runningOS.daylightInEffect
Whether
daylight
savings time
is in effect for
the Guest OS
environmentFor.runningOS.dnsHostname
Host name in
DNS of
Guest OS
environmentFor.runningOS.ntDomain
Windows NT
domain
membership
of Guest OS
environmentFor.runningOS.oemInfo.description
Information
provided by
VMware
environmentFor.runningOS.osType
Type of
Guest OS
152
Chapter 7: Search
Named field (without “vm.” qualifier)
Description
environmentFor.runningOS.paeEnabled
Whether
physical
address
memory
extensions
are enabled
in Guest OS
environmentFor.runningOS.partOfDomain
Whether the
Guest OS is
part of a
Windows NT
domain
environmentFor.runningOS.services.displayName
Display
name for
service on
Guest OS
environmentFor.runningOS.services.name
Internal
registration
name for
service on
Guest OS
environmentFor.runningOS.services.pathName
Path name to
service
executable
for service on
Guest OS
environmentFor.runningOS.services.startMode
Start mode
153
Example search queries
Named field (without “vm.” qualifier)
Description
for service on
Guest OS
environmentFor.runningOS.services.type
Type of
service for
service on
Guest OS
environmentFor.runningOS.systemType
Type of
physical
system
provided by
virtual
machine to
Guest OS
environmentFor.runningOS.versionInfo.buildNumber
Build number
of Guest OS
environmentFor.runningOS.versionInfo.osVersion
Version of
Guest OS
environmentFor.runningOS.versionInfo.servicePack
Service pack
level of
Guest OS
environmentFor.runningOS.versionInfo.servicePackMajor
154
Major version
number of
service pack
level on
Guest OS
Chapter 7: Search
Named field (without “vm.” qualifier)
Description
environmentFor.runningOS.versionInfo.servicePackMinor
Minor version
number of
service pack
level on
Guest OS
environmentFor.runningOS.versionInfo.version
Version of
Guest OS
guestFamily
Family of
Guest OS
guestFullName
Full name of
Guest OS
guestId
ID for Guest
OS type
hostname
Host name of
virtual
machine
hostserver.hostName
Name of
ESX host for
virtual
machine
hostserver.ipAddress
IP address of
ESX host for
virtual
machine
identity.apiVersion
Version of
155
Example search queries
Named field (without “vm.” qualifier)
Description
hypervisor
identity.configFileName
Name of VM
configuration
file
identity.relativePathName
Path name of
VM folder in
storage
location
identity.vmVendorName
Vendor of
hypervisor
managedByServer
IP address of
management
server entity
managementServer.hostName
Name of
VirtualCenter
managing
ESX host
running
virtual
machine
managementServer.ipAddress
IP address of
VirtualCenter
managing
ESX host
running
virtual
156
Chapter 7: Search
Named field (without “vm.” qualifier)
Description
machine
manufacturer
Virtualization
infrastructure
vendor
memory
Memory
configured in
MBs
memoryOverhead
Memory
overhead in
bytes
model
Type of
virtualization
infrastructure
name
Name of
virtual
machine
networkAdapters.ipAddress.subnetMask
Subnet mask
of NIC
snapshotSummary.dateCreated
Date when
snapshot
was created
snapshotSummary.description
Description
of snapshot
snapshotSummary.filename
File name for
157
Example search queries
Named field (without “vm.” qualifier)
Description
snapshot
snapshotSummary.fullPath
Full path of
snapshot
snapshotSummary.name
Name of
snapshot
snapshotSummary.powerStateWhenTaken
Power state
of VM when
snapshot
was taken
snapshotSummary.quiesced
Quiescent
state of VM
when
snapshot
was taken
suspendInterval
Number of
cumulative
seconds
suspended
toolsVersion
Version of
VMtools
running on
virtual
machine
virtualDisk.capacity
Capacity for
virtual disk in
KBs
158
Chapter 7: Search
Named field (without “vm.” qualifier)
Description
virtualDisk.controllerType
Controller
type for
virtual disk
virtualDisk.location
File system
location of
virtual disk
virtualDisk.location
Location of
VMDK
virtualDisk.mode
Storage
mode for
virtual disk
virtualDisk.name
Name of
virtual disk
virtualDisk.type
File system
type of virtual
disk
virtualMediaDevice. startConnected
Connection
state of
virtual media
device when
VM is
powered on
virtualMediaDevice.connected
Connection
state of
virtual media
device
159
Example search queries
Named field (without “vm.” qualifier)
Description
virtualMediaDevice.media
Media type of
virtual media
device
virtualMediaDevice.name
Name of
virtual media
device
virtualMediaDevice.type
Type of
virtual media
device
virtualNIC.adapterType
Type of NIC
virtualNIC.connected
Connection
state of NIC
virtualNIC.macAddress
MAC
address of
NIC
virtualNIC.startConnected
Connection
state of NIC
when VM is
powered on
virtualNIC.virtualNetworkName
Name of
virtual
network
associated
with NIC
worldId
World ID
160
Chapter 7: Search
Named field (without “vm.” qualifier)
Description
number
Using the query builder
The query builder is an interactive tool with which you can construct complex
search queries without having to memorize attribute codes, or learning the
subtleties of the core query language. To start the query builder, click Advanced
Search on the search bar.
The query builder parses the text in the search bar. Each filter in the query text is
rendered as an editable block.
In some cases, Virtualization Manager can enumerate all the legal filter values for
your environment. Click the drop-down button next to the filter text to list all the
values Virtualization Manager knows about.
In addition to matching a single fixed value, filters can match ranges. For
example, “>512 MB” would specify all virtual machines which are configured for
more than 512 megabytes of memory. Filters can also specify multiple
requirements. “>512 MB <2 GB -1 GB” matches all virtual machines with more
than 512 MB and less than 2 GB of memory, but excludes those with exactly 1 GB
of memory.
Adding new filters
To add new filters, perform the following steps:
1. Click Add Attribute Filter or Add Label Filter.
2. Select the filter you want to add from the list.
3. Click OK.
With the Add Attribute Filter you can add a filter based on Virtualization
Manager collected data. You can further filter these attributes based on the
environment.
161
Common use cases
With the Add Label Filter you can add a filter based on the custom labels defined
in Virtualization Manager. For more information, see Custom labels.
By default, the query builder starts in form mode. Click Editor Mode to switch to
edit mode, which shows the core query language, but still provides access to
attribute search and sorting.
After designing the search query, click Test to run the query in test mode. The
summary of the results is displayed in the right panel, but the contents of the
search screen are not changed. Click Run to execute the query on the search
screen. This action overwrites any current query.
Common use cases
You can construct complex queries to solve issues that would take great manual
effort to resolve by collecting and tabulating data from various sources to reach
conclusions that could only be acted upon with the use of external tools. This
section contains examples of search queries that address specific administration
issues and questions.
Operating system
Issue
Search query
Number of Windows X
Machines
guestFullName:"Microsoft Windows Server 2003,
Enterprise Edition (32-bit)"
Number of licensed
guestFamily:windowsGuest
VMs/Windows VMs
VI3 topology
Issue
Search query
Number of VMs managed by
X
managementServer/hostname:west-vc.hyper9.com
Number of VMs on host X
hostServer/hostname:california.hyper9.com
162
Chapter 7: Search
Issue
Search query
Number of X of Y (Dell
2950s)
model:2950 AND “manufacturer: Dell, Inc.”
All 3.0.x VMs
hostServer/deviceProperties/value:3.0.*
All 3.5.x VMs
hostServer/deviceProperties/value:3.5.*
VM issues
Issue
Search query
Number of VMs with
tools version
toolsVersion:64607
Show VMs with mismatched tools
toolsVersion:64607 NOT hostServer/deviceProperties/value:*Build-64607*
VMs that have been
suspended
NOT suspendInterval:0
Show VMs with less
than 10 MB disk
space
environmentFor/diskVolume/freeSpace:[0 TO
10000000]
VMs on virtual network X
virtualNIC/virtualNetworkName:Lake-Net
VMs with image files
on X
virtualDisk/location:*Storage*
Number of Virtual
Disk is 1
$/virtualMachine/virtualDisk/colSize:1
Number of Disk
Volumes is 1
$/virtualMachine/environmentFor/diskVolume/colSize:1
163
Common use cases
Vmotion
Issue
Search query
VMs with media
attached
NOT $/virtualMachine/media/colSize:0
VMs with media
attached
virtualMediaDevice/connected:true
NICs down
NOT
environmentFor/networkAdapters/status:Connected
Cloning issues
Issue
Search query
MAC address
conflict on X
environmentFor/networkAdapters/macAddress:
75:34:44:0b:48:19 AND NOT virtualNIC/macAddress:
75:34:44:0b:48:19
Time zone mismatch
NOT environmentFor/runningOS/currentTimeZone:-300
VMs in time
zone X
environmentFor/runningOS/currentTimeZone:-300
Daylight Sav-
environmentFor/runningOS/daylightInEffect:false
ings Time not
enabled
Snapshots
Issue
Search query
VMs with snapshots
NOT $/virtualMachine/snapshotSummary/colSize:0
Non quiesced snapshots
snapshotSummary/quiesced:false
164
Chapter 7: Search
Guest OS issues
Issue
Search query
OS version is X.Y
environmentFor/runningOS/versionInfo/version:5.1.*
OS build is X
environmentFor/runningOS/versionInfo/buildNumber:2600
GuestOS MAC dif- environmentFor/networkAdapters/macAddress:
ferent than vNIC
75:34:44:0b:48:19 AND NOT virtualNIC/macAddress:
MAC
75:34:44:0b:48:19
Services and applications
Issue
Search query
VMs with
service
running
environmentFor/runningOS/services/displayName:Alerter
VMs with
application
installed
environmentFor/runningOS/installedApplications/displayableName
:VMware*
Hotfixes and updates
Issue
Search query
Patche- environmentFor/runningOS/componentUpdates/installDate:
s
[20080901 TO 20080930]
installed in the
last X
VMs
with
environmentFor/runningOS/componentUpdates/displayName:KB*
165
Common use cases
Issue
Search query
Hotfix
VMs
with
patch
conflict
environmentFor/runningOS/componentUpdates/displayName:KB111111
AND environmentFor/runningOS/componentUpdates/displayName:KB222222
166
Chapter 8: Alerts
Virtualization Manager uses alerts to monitor the environment for specified
conditions, and to notify users or external systems about those conditions. You
can configure alerts to fire when a specific condition arises, when it ceases to
exist, or both. Virtualization Manager contains over 40 alerts by default to help
you identify and highlight common problems in virtual environments.
Note: Virtualization Manager includes an alert that triggers when a VM fails to
send a heartbeat after the expected interval. For sending a heartbeat in a VMware
environment, VMware Tools has to be installed, and in a Hyper-V environment
the Integration Service has to be installed or enabled.
If no heartbeats are being received for any of the VMs on a host, it could indicate
a problem on the host itself, or that none of the hosted VMs have the required
VMware Tools or Hyper-V Integration Service installed or enabled.
To see the available alerts:
1. Click Content on the Explore tab.
2. Open the By type accordion on the left, and then select Alerts.
To create a new alert:
1. Search for a set of items that you want to alert on.
2. Click Create Alert.
To delete an alert:
1. Navigate to Explore > Content, and then filter or search for the alert you
want to delete.
2. Select the alert, and then click Delete in the top right.
After performing these steps, the alert will be removed.
167
Chapter 8: Alerts
To disable an alert without removing it, navigate to Explore > Content,
and then select an alert. Click Open at the lower left to open the Alert
details page, and then click Disable in the lower right.
The alert creation screen contains the following tabs:
l
Scope
l
Criteria
l
Notifications
l
Advanced settings
Scope
At the highest level, the scope describes what data you analyze, and defines the
importance of the alert. You can define the following details:
l
l
l
l
Severity: The importance of the alert (informational, warning, or critical).
Item Type: The type of content the alert will analyze (application, cluster,
data store, host, or VM).
Search Query: The search term that is used to retrieve the content the alert
analyzes.
Evaluate on: The frequency with which the data is to be analyzed.
Note: Every alert is analyzed as new data is collected by Virtualization Manager.
If you set up an alert to evaluate on performance data, the evaluation happens
every time new performance data are collected (10 minutes by default). If you set
up an alert to evaluate on configuration data, the evaluation happens every time
new configuration data are collected (12 hours by default).
Even though it may seem more granular to set up all alerts to evaluate on
performance data collection, many alerts only consider configuration data in their
evaluations, which does not change as frequently as performance data. Instead of
168
Criteria
setting up every alert to evaluate on performance data, set the Evaluate on scope
of the alert to match the data the alert analyzes.
Criteria
Alerts use criteria to evaluate data in the results of a search query, which is
defined in the scope of the alert. The evaluation criteria includes the following:
l
l
Base Alert On: The basis of the alert. This is either the Search result count
or the Attributes within the search results.
Triggers on: The rules based on which an alert is raised.
Search result count
Many alerts have most of the logic built into the query. This means that the alert
only needs to be evaluated based on the set of results returned from the query.
For these types of alerts, select Search result count in the Base Alert On
section of the Criteria tab.
To specify that any results should fire the alarm:
1. In the Triggers On section of the Criteria tab, select Any.
2. Click Save.
To specify that the alert is fired when the number of search results is
outside of a specified range:
1. In the Triggers On grouping of the Criteria tab, select Range.
2. Select the Less Than and Greater Than check boxes, and then define the
range.
3. Click Save.
Because virtual environments are dynamic, you may only want an alert to fire if a
condition for the alert has been met for a sustained period of time. For example,
you may not want an alert to be fired immediately the first time when a single
169
Chapter 8: Alerts
search result is returned, but only if the search result is returned over a given time
span. In this case, specify the time span in the Sustained Minutes field.
Note: Because alerts are only evaluated when new data enter the system, set the
Sustained Minutes to a period that matches the collection period for that data
type. By default, performance data is collected every 10 minutes, and
configuration data is collected every 12 hours. Check the Evaluate on settings on
the Scope tab to see whether the alert is evaluated on a performance collection
schedule, or a configuration collection schedule.
Attributes
Some alerts are based on the attributes of the search results instead of the
number of search results. This means that the alert must pluck properties from the
search results and evaluate the value of that property.
To base an alert on the attributes of search results:
1. In the Base Alert On grouping of the Criteria tab, select Attribute.
2. Click Find to see the list of attributes available for evaluation.
Note: The list of available attributes is based on the type of object your
search returns.
3. Select the unit of measure for the attribute you want to evaluate. Because
Virtualization Manager allows XPath functions, it cannot automatically
determine the correct unit.
4. Select an aggregation function to perform operations across the search
results. The following options are available:
l
Average
l
Total
l
Count
5. Define the rules used in evaluation in the Triggers On grouping. Select one
of the following options:
170
Attributes
l
l
Any: The alert fires if any attribute is returned.
Range: The alert fires when the value of the attribute is outside of a
specified range.
If you select Range, the following additional options are displayed:
l
l
l
Select Less Than and Greater Than to define the range of values for
which the alert should fire. The alert fires when the value is in the
range, not outside of the range.
Select Evaluate this range once against the entire result to base
the alert on the total value across search results, as defined in the
Aggregation Function list.
Select Evaluate this range against each VM to base the alert on the
attribute value of each search result.
Because virtual environments are dynamic, you may only want an alert to fire if a
condition for the alert has been met for a sustained period of time. For example,
you may not want an alert to be fired immediately the first time when a VM has
high CPU utilization, but only if the high CPU utilization is sustained over a
specific time span. In this case, specify the time span in the Sustained Minutes
field.
Because alerts are only evaluated when new data is collected by Virtualization
Manager, set the Sustained Minutes to a period that matches the collection
period for that data type. By default, performance data is collected every 10
minutes, and configuration data is collected every 12 hours. Check the Evaluate
on settings on the Scope tab to see whether the alert is evaluated on a
performance collection schedule, or a configuration collection schedule.
Note: Alerts often perform mathematical operations on the properties. For such
cases, you can use XPath in the Attribute field. In most cases, XPath is used to
create an average or summary of multi-value properties. For example, to get the
total free space of all disk volumes in a VM, type the following in the Attribute
171
Chapter 8: Alerts
field:
sum(/virtualMachine/diskVolume/freeSpace)
To get the cluster storage utilization, type the following in the Attribute field:
(sum(/cluster/datastore/freeSpace) div sum(/cluster/datastore/capacity))
* 100
Notifications
Configure an alert to fire a notification when it is lowered or raised or is active.
You can configure the way an alert sends notifications of status changes on the
Notifications tab.
The status of every alert is evaluated automatically as new data is collected by
Virtualization Manager. If you set up an alert to evaluate on performance data, the
evaluation happens every time new performance data is collected (10 minutes by
default). If you set up an alert to evaluate on configuration data, the evaluation
happens every time new configuration data is collected (12 hours by default).
You can also evaluate an alert manually by saving your changes on the alert
configuration page, or by clicking Evaluate now on the alert details page.
If you want to receive the notification every time the alert status is raised, lowered,
or active, select Notify on consecutive events. Otherwise, select Notify only
when raised. This way, Virtualization Manager only sends a notification when the
alert is raised.
Each alert has the following four statuses:
l
Inactive
l
Raised
l
Active
l
Lowered
The following table describes when an email notification is sent with the different
options selected.
172
Using alert actions
Selected options
Inactive Raised
None
-
Active
Email sent -
Lowered
Email sent
Notify on consecutive events -
Email sent Email sent Email sent
Notify only when raised
-
Email sent -
Both
-
Email sent Email sent -
-
To receive an alert in email, specify the email address in the Email To field. You
can enter multiple addresses separated by a comma.
Note: Virtualization Manager must be configured for SMTP before an alert can
send email notifications when it is raised or lowered. For more information, see
Basic setup.
Using alert actions
When an alert fires, it can invoke an external action that can automatically fix a
situation, or file a trouble ticket into a ticketing system. External actions are
programs or command executions that are defined by an XML manifest file. To
select an action to invoke when the alert fires, click Pick an Action. To
disassociate an action currently associated with an alert, click Remove the
Action.
Example Action
If you do not have any actions defined yet, the following sample manifest provides
an example.
To use this example, perform the following steps:
1. Save the manifest file to the data/content/externalActions folder of your
server.
2. Name it logAlert.manifest.
3. After the file is saved, click Reload on the Select an External Action
window.
173
Chapter 8: Alerts
4. Select the action from the list.
<?xml version="1.0" encoding="UTF-8"?>
<manifest xmlns="http://www.hyper9.com/ws"
xmlns:xsi="http://www.w3.org/2001/XMLSchema-instance">
<enabled>true</enabled>
<type>ALERT</type>
<uniqueId>alert-test</uniqueId>
<name>Log Alert Summary</name>
<description>Logs a summary of this alert's firing details to a
file</description>
<command>perl</command>
<command>$MANIFEST_HOME/logAlert.pl</command>
<argumentPrefix>-</argumentPrefix>
<successCode>0</successCode>
<!--Optionally specify the directory to start from -->
<!--<workingDirectory></workingDirectory>-->
</manifest>
For this example, a script was customized to run as the command, called
logAlert.pl. There are two command elements. Use a new element for every
time you have white space in your arguments.
Save the following code in the same data/content/externalActions folder as
logAlert.pl. Because it is saved in the same folder as the manifest, the
$MANIFEST_HOME variable from the previous manifest is used to describe its path.
#!/usr/bin/perl
# Author: Ryan Kruse
#
# Description: Designed to be called through the Hyper9 external actions
framework,
# this script simply uses the SOAP API to retrieve an Alert and log its
values to a file
#
use strict;
use Hyper9::Client;
use Getopt::Long;
174
Example Action
my $timestamp;
my $alertId;
my $loginToken;
get_args();
my $client = Hyper9::Client->new( host => 'localhost:8983', );
#$client->{services_path} = '/single-vm';
$client->loginWithToken( username => 'admin', token => $loginToken, ) ||
die "Login failed\n\n";
my $alert = $client->getWorkspaceAsset(assetId=>$alertId);
$client->logout();
my $status = ($alert->{raised} eq 'true') ? "RAISED" : "LOWERED";
open( LOG, ">>logAlert.log" );
print LOG $timestamp."\t".$alert->{name}."\t$status\t".$alert->
{value}."\n";
close(LOG);
sub get_args
{
my $help;
GetOptions(
"timestamp:i"
"alertId:s"
"loginToken:s"
"help"
"h"
=>
=>
=>
=>
=>
\$timestamp,
\$alertId,
\$loginToken,
\$help,
\$help,
);
usage() if ( $help || !($alertId) );
}
sub usage
{
print STDERR << "EOF";
usage: $0 -timestamp=1271186678 -alertId=404cb4f0-4732-11df-98790800200c9a66
-loginToken=62b796e0-4732-11df-9879-0800200c9a66
-timestamp : seconds since epoch
-alertId
: hyper9 ID of the alert
-loginToken : a token that can be used to login to the hyper9 web
service
EOF
exit;
}
The following arguments are passed to all commands:
175
Chapter 8: Alerts
l
l
l
timestamp: The time stamp of the alert firing instance. This can be used to
retrieve more details of this alert firing.
alertId: The ID of the alert. This can be used to retrieve more details of the
alert.
loginToken: A short-lived one time use token that can be used to log in to
the Hyper9 web service.
The previous script uses the Perl Client (Hyper9::Client) module. You must
download this module from the additional components page of the SolarWinds
Customer Portal before you can run the action. Make sure it is installed in your
Perl path. For more information, see Using Perl SDK.
Consult the Web Services Description Language (WSDL) of your system
(http://your-server:8983/swvm/ws/hyper9.wsdl) for information about all you
can do through the SOAP web services.
SNMP settings
You can use external monitoring tools to view all system alerts, because
Virtualization Manager can integrate with these systems by sending SNMP traps.
SNMP traps are automatically sent for every alert if your system is configured for
at least one trap receiver. For more information, see Configuring SNMP.
If you do not want all alerts to use the same OIDs, specify a different OID per alert
on the Advanced tab of the Alert definition. The SNMP alerts are always prefixed
by the Virtualization Manager enterprise OID.
Advanced settings
On the Advanced tab of the alert creation screen you can define the following
optional details about an alert:
l
In Context Search Link
l
In Context Performance Graph
l
SNMP Trap OID Override
176
Advanced settings
In the In Context Search Link grouping, you can define a search query which
displays additional information about the resources for which the alert is raised.
For example, if you have an alert defined on the Scope tab which is raised when
the VMs under a host do not send a heartbeat, you can additionally set up a query
on the Advanced tab for displaying the list of VMs.
For information about displaying the results of the in context search query, see
Accessing historical alert information.
To define an in context search link:
1. Select the item type from the list for which you want to define the in context
query.
2. In the Search Query field, set up the query by using one of the following
methods:
l
l
Type the search query you want to use.
Alternatively, click Query Attribute, and then select the attribute you
want to use as search query.
3. Type an informational description of the query. This information will be used
as a tooltip.
4. Click Choose Sort Field, and then select the attribute by which you want to
sort the results found by the search query.
5. Select whether you want to display the results in ascending or descending
order.
6. Click Save.
In the In Context Performance Graph grouping, you can specify the performance
graph you want to display in context with the resources the alert is raised for.
Click Choose Graph, and then select a performance metric from the list. Click
Save to persist your changes. For more information about displaying the
performance graph in context, see Accessing historical alert information.
177
Chapter 8: Alerts
In the SNMP Trap OID Override field, you can specify a different OID for an alert
if you do not want all alerts to use the same OIDs. The SNMP alerts is always
prefixed by the SolarWinds Virtualization Manager enterprise OID. Click Save to
persist your changes.
Accessing historical alert information
You can access historical alert information in the Explore module by using the
Time Travel tool of the Map, viewing the resource details, or by viewing alert
details. Time Travel information is only available when a single item is in context.
Using the Time Travel tool
To use the Time Travel tool, perform the following steps:
1. Select a resource in the map.
2. Click Context to place it in context.
3. Click View Calendar to navigate.
Note: The icons of the items change color based on whether an alert was raised
and on the severity of the alert. Hover over items to view which alerts were raised
during the selected time period.
To see which resources have an alert raised, and which resources have had an
alert raised in the past, view the history of an alert.
Viewing the history of an alert
To view the history of an alert, perform the following steps:
1. Go to Explore > Content, and then search for the alert.
2. Click the name of an alert, and then click Open.
The page displays basic information about the alert, such as its current state, and
its alert criteria. If the alert is raised for one or more resources, the affected
resources are also listed. By clicking the appropriate icons of a resource, you can
perform the following additional actions:
178
Viewing alert information for a specific resource
l
Click the Plus icon to add the resource to a list.
l
Click the Map icon to place the resource in context on the map.
l
l
If you defined an in context search query on the Advanced tab of the alert
creation screen, click the Magnifier icon to view the results returned by that
search query. If you specified a sort field on the Advanced tab of the alert
creation screen as well, the results are displayed according to the defined
sort field.
If you specified an in context performance graph on the Advanced tab of the
alert creation screen, click the Graph icon to view the performance graph for
a resource.
Viewing alert information for a specific resource
To view alert information for a specific resource, perform the following steps:
1. Search for the resource.
2. Open the detailed view by clicking the name of the resource.
3. View the alert information under Active Alerts.
Note: You can also view the history of the alert here, by clicking the name of the
alert.
179
Chapter 9: Capacity planning
Virtualization Manager includes a capacity planning module where you can see
when your current virtual infrastructure will run out of resources, you can plan to
add new VMs to your current infrastructure, and you can examine how new
hardware will increase the capacity of your virtual infrastructure.
Note: Virtualization Manager uses only shared storage in capacity planning
calculations.
Planning basics
Capacity planning is driven by a supply side and a demand side. The Capacity
Planning module contains the following sections:
l
l
l
The supply side is a Resource Container. A Resource Container defines
the computing resources available in one or more hosts, or all the hosts in
one or more clusters. In the capacity planning module, the Resource
Container is in the upper left quadrant.
The demand side is called a Usage Profile. A Usage Profile defines the set
of VMs that use the computing resources. It is in the upper right quadrant.
The bottom portion of the module displays the results from the capacity
planning analysis.
For more information, see Using resource containers and Using usage profiles.
Using resource containers
A resource container is a group of hosts that provide computing resources.
A resource container considers the following primary resources:
l
CPU
l
memory
180
Chapter 9: Capacity planning
l
disk space
You can enter a resource container either directly from the Capacity Planning tab,
or by running a search query.
To define a resource container through search:
1. Search for hosts in the Search field.
2. Select one or more of the results.
3. Click Plan to enter the Capacity Planning module. The resource container
is in the upper left of the Capacity Planning module.
The resource container includes the following options:
l
Click Load to load a resource container that you previously saved.
l
Click Edit to modify, and then save the current resource container.
l
l
Click Pick Cluster to define a resource container more generally, by
specifying all hosts in a cluster.
Click All Clusters to define a resource container more generally, by
specifying all hosts in all clusters.
After clicking Edit, you can specify the members of a resource container in the
following ways:
l
l
By creating a static list of resources in the container.
By creating a dynamic set of resources, by compiling a search query to
search for either hosts or clusters. This query is executed in real time for all
capacity planning operations. The benefit of this approach is that you can
constantly update your capacity plan based on a dynamic query. The
disadvantage is that the calculations only happen after the query is
executed.
Note: If you choose to use a cluster, all hosts in that cluster are considered as
resources.
181
Using resource containers
This window provides the following options:
l
Click Show Profile to toggle screens to edit the Usage Profile in context.
l
Click Load to load a Resource Container that you saved previously.
l
l
Click Save or Save as to save the resource container for future use.
Resource containers are not saved by default.
Click Show Details to get more details about the members of a resource
container.
To get different views of the capacity plan, click the links at the bottom of the
window:
l
l
l
l
l
Click Capacity to open the utilization graphs that display the actual
consumed capacity within the Resource Container.
Click Consumption to view the dates when the resource will cross the
configure warning and outage thresholds. For more information about
configuring warning and outage thresholds, see Advanced options.
Click Details to view all the calculations that went into the capacity plan. For
more information about capacity planning details, see Showing the
calculations and variables.
Click Scatterplot to view the scatterplot graphs of IOPS.
Click Summary to return to the Capacity Planning summary view which
contains an overview of the resource container, the Usage Profile, and the
Capacity Planning Results. If the calculation results are not displayed, click
Calculate in the upper right of the Capacity Planning module.
Note: The total and average percentage values displayed in the resource
container are the same by design. The VmAverage value can be lower if the load
on the host or cluster includes non VM-related load.
182
Chapter 9: Capacity planning
Using usage profiles
A usage profile is a group of Virtual Machines (VMs) that consume computing
resources. The following primary resource consumptions are considered:
l
CPU
l
memory
l
disk space
To define a usage profile, you can enter the Capacity Planning module directly
from the Capacity Planning tab, or by running a search query.
To define a usage profile through search:
1. Search for VMs in the Search field.
2. Select one or more of the results.
3. Click Plan to enter the Capacity Planning module. The usage profile is in
the upper right of the Capacity Planning module.
Note: SolarWinds does not recommend creating usage profiles with more than
500 VMs. Usage profiles with more than 500 VMs negatively impact performance
during capacity planning calculations.
The usage profile provides the following options:
l
Click Load to load a usage profile that you previously saved.
l
Click Edit to modify and save the current usage profile.
l
l
Click Cluster Average to define a usage profile more generally, by
specifying all VMs in a cluster.
Click All Clusters Avg to define a usage profile more generally, by
specifying all VMs in all clusters.
After clicking Edit, you can specify the members of a usage profile in the following
ways:
183
Using usage profiles
l
l
By creating a static list of VMs in the profile.
By creating a dynamic set of VMs, by compiling a search query to search for
either VMs or clusters. This query will be executed in real time for all
capacity planning operations. The benefit of this approach is that you can
constantly update your capacity plan based on a dynamic query. The
disadvantage is that the calculations only happen after the query is
executed. This means that the details of the average CPU, memory and
usage utilization are not displayed in the Edit screen of the usage profile.
Note: If you choose to use a cluster, all VMs in that cluster are considered as
members of the usage profile, and they are considered when calculating resource
utilization.
The window provides the following options:
l
l
l
l
Click Show Container to toggle screens to edit the resource container in
context.
Click Load to load a usage profile that you saved previously.
Click Save or Save as to save the usage profile for future use. Usage
profiles are not saved by default.
Click Show Details to get more details about the members and the resource
utilization of the usage profile members.
To get different views of the capacity plan, click the links at the bottom of the
window:
l
l
Click Capacity to open the utilization graphs that display the actual
consumed capacity within the Usage Profile.
Click Consumption to view the dates when the resources will cross the
configured warning and outage thresholds. For more information about
configuring warning and outage thresholds, see Advanced options.
184
Chapter 9: Capacity planning
l
l
l
Click Details to view all the calculations that went into the capacity plan. For
more information about capacity planning details, see Showing the
calculations and variables.
Click Scatterplot to view the scatterplot graphs of IOPS.
Click Summary to return to the Capacity Planning summary view which
contains an overview of the resource container, the usage profile, and the
capacity planning results. If the calculation results are not displayed, click
Calculate in the upper right of the Capacity Planning module.
Note: The total and average percentage values displayed in the resource
container are the same by design. The VmAverage value can be lower if the load
on the host or cluster includes non VM-related load.
When will I run out?
One of the most common questions around capacity planning is "When will I run
out of resources." The answer depends on the deployment of new VMs and
applications that consume resources. SolarWinds Virtualization Manager can
predict when you will run out of resources based on how your environment has
grown historically.
To answer this question, load a resource container in the Capacity Planning
module. The resources within the specific container are considered when
calculating when you will run out of resources.
The calculations examine the historical trending of the following values, and also
project when one of these values will reach 100%:
l
CPU utilization
l
memory utilization
l
disk space consumption and disk IOPs
l
network consumption
Note: 100% is the default threshold, but you can customize this in the Capacity
Manager. For more information, see Advanced options.
185
How much more can I add?
To generate a graph of the historic performance of CPU, memory, and disk
utilization, click Consumption at the bottom of the Capacity Planning module.
The utilization graph shows the actual consumed capacity of the resources within
the Resource Container.
The Consumption view consists of two parts:
l
l
The large graphs show the historic values, and a best fit line.
The table below the graph contains the calculated dates when each
resource hits certain thresholds based on their current course and speed.
The table contains the following information for each resource:
l
Warn at: The utilization percentage when a warning will be raised.
l
Warning Date: The date when the metrics will reach the Warn at threshold.
l
l
Out at: The utilization percentage when the resource is considered to be
out.
Outage Date: The date when the metrics will reach the Out at threshold.
Note: You can configure both the Warn at and Out at thresholds in the Capacity
Manager. For more information, see Advanced options.
To return to the Capacity Planning summary page, click Summary in the lower
right.
How much more can I add?
Based on your current host resources, Virtualization Manager can analyze how
many more virtual machines can be added to your virtual infrastructure. To
perform this analysis, define a resource container with the hosts in consideration,
and define a usage profile containing VMs that are representative of the new VMs
you want to add.
To analyze how many more VMs you can add:
1. Load a resource container in the Capacity Planning module. The resources
contained within the specific container are considered during the analysis.
186
Chapter 9: Capacity planning
The calculations examine the availability of the following resources on
hosts within the resource container:
l
CPU utilization
l
memory utilization
l
disk space consumption and disk IOPs
l
network consumption
2. Load a usage profile that contains VMs that are representative of the new
VMs you want to add. The calculations examine the following consumption
metrics of these VMs:
l
CPU
l
memory
l
disk space
3. Click Calculate at the top right of the Capacity Planning module.
Note: The time the calculation takes is directly proportional to the number of
members in the resource container and the usage profile. Depending on the
number of members, the calculation can take a few minutes.
The Capacity Planning Results table displays the number of VMs you can add to
the hosts within the resource container. The binding resource which prevents
more VMs from being added is also displayed next to the number of VMs in
parentheses. The table contains one row for every cluster with hosts included in
the resource container, and displays the following information for each cluster:
l
l
Workload (constraint): If you specified the number of VMs you want to add
and their specifications in the Workload section of the Advanced Options,
this column displays how many times you can add all of them. For more
information, see Advanced options.
Small VMs: This column displays the number of VMs you can add if you
only add the smallest VMs within the usage profile, which consume the
least resources.
187
Calculating VM sizes
l
l
Average VMs: This column displays the number of VMs you can add,
based on the average resources consumed by VMs within the usage profile.
Large VMs: This column displays the number of VMs you can add if you
only add the largest VMs within the usage profile, which consume the most
resources.
For a more visual representation of the number of VMs you can add, click
Capacity in the bottom of the Capacity Planning module.
The bar chart on the left shows all the clusters or hosts. If the resource container
you used for the calculations holds clusters, the chart shows clusters. If the
resource container holds hosts, the chart shows hosts. Each of the consumed
resources is represented per cluster or host. The chart provides an overview of
the latest resource utilization information across the given resource container.
The Remaining Capacity bars of the bar charts on the right show the number of
VMs that may be added. The charts display the following information:
l
VM capacity by CPU
l
VM capacity by memory consumption
l
VM capacity by disk space consumption
l
VM capacity by storage I/O consumption
l
VM capacity by network I/O consumption
Note: The charts take into account the settings you specify in Advanced Options,
and are refreshed whenever you click Update in the Advanced Options section,
or click Calculate at the top right of the Capacity Planning module. For more
information, see Advanced options.
Calculating VM sizes
Virtualization Manager calculates the sizes of small, average, and large VMs
based on the information contained in the usage profile.
188
Chapter 9: Capacity planning
If the Usage Profile does not include clusters, the sizes are calculated based on
all the averaged values per resource included in the usage profile. You can view
these values in the Details view of the usage profile.
Small: The minimum value of all the averaged values of the resources.
Average: The average of all the averaged values of the resources.
Large: The maximum value of all the averaged values of the resources.
If the Usage Profile contains clusters, the calculation uses minimum, maximum,
and average values from cluster trends.
What if I add more resources?
For the When will I run out? and How much more can I add? use cases, you may
want to plan while considering new host resources that are not currently part of
your virtual environment. To accomplish this, click Advanced options in the
bottom left of the Capacity Planning module. For more information, see Advanced
options.
To simulate adding more hosts:
1. Open Calculation Settings within the Capacity Manager.
2. Specify the following information:
l
The number of hosts to add
l
The number of CPUs per host
l
The speed of each CPU (in MHz, not in GHz)
l
The memory per host (in GB)
l
The shared disk space per host (in GB)
l
The IOPS measurement of the disk
l
The Net I/O (Mbps)
3. Click Update to see how the new resources affect the number of VMs you
can add.
189
Overloaded hosts
Note: These options are saved in the resource container. To save your
specifications, make sure that you save the resource container. The total extra
resources that will be added to this resource container are the resources per host
multiplied by the number of hosts. Any calculations outlined in the When will I run
out? and How much more can I add? use cases consider these new resources as
available when using this resource container.
Overloaded hosts
In general, the best indicator of an overloaded datastore is the latency, or
response time, of read/write requests to the datastore. Outside of the storage
dashboard and alerts, you can determine when datastores will be overloaded
based on the current performance.
After adding your datastores to the chart, select a device latency graph or line to
see which datastores are experiencing the highest response time. You can also
plot IOPs for the datastore and the corresponding VMs to find the VMs that
generate the most IO.
Advanced options
On every screen within the Capacity Planning Module, the Advanced options
link is at the bottom left of the screen. Click this link to customize how the capacity
plan is calculated.
The advanced options column is displayed on the left of any capacity planning
screen. The options are separated into the following four sections in an accordion
control:
l
Calculation settings
l
Resource types
l
Workload
l
Sample period
190
Chapter 9: Capacity planning
Calculation settings
Any time you click Calculate, Virtualization Manager analyzes the load on the
resource container, calculates the remaining capacity, and then determines how
the usage profile would fit into the remaining capacity. You can modify the way
capacity is calculated in the Calculation Settings.
This section contains the following fields:
l
l
l
Mem Wastage: Spare memory due to non-uniform VM resource
requirements.
Mem Oversub: Amount of memory over-subscription as configured in the
VMWare Virtual Center.
Sizing Target: Defines how the CPU, memory, and disk space utilization
values are used in calculations.
l
l
l
l
Peak: Default setting which looks at the peak resource utilization.
95th Percentile: Ignores the peak, and calculates based on the 95th
percentile of resource utilization.
75th Percentile: Ignores the peaks and high spots, and calculates
based on the 75th percentile of resource utilization.
Reserved/Additional hosts
l
Failover Capacity
l
Number to add: Performs calculations assuming more host resources
than currently used in the virtual environment. For more details, see
the What if I add more resources? use case.
l
CPU (count): The number of CPUs per host.
l
x Speed (MHz): The speed of each CPU (in MHz, not GHz).
l
Memory (GB): Memory per host (in GB).
l
Shared Disk (GB): Shared disk space per host (in GB).
191
Resource types
l
Disk I/O (IOPS): The IOPS measurement of the disk.
l
Net I/O (Mbps)
To make the new settings take effect immediately, click Update at the bottom of
the custom Calculation Settings.
Resource types
When viewing the resource consumption chart as described in the When will I run
out? use case, the thresholds for a warning and an outage are configurable in the
Resource Types section of the Capacity Manager.
To make the new settings take effect immediately, click Update at the bottom of
the custom Resource Types.
Workload
In the Workload section you can define a theoretical set of new VMs to deploy in
your environment to see if your current resources can support it. This is part of the
How much more can I add? use case.
To make the new settings take effect immediately, click Update at the bottom of
the custom Workload.
Sample period
In the Sample Period section you can specify the performance data used to
calculate load on a resource container. The default is to use your average
performance data for all day over the last 30 days, but you can change the default
settings to use only data collected during business hours, or only during daylight
hours.
To use only samples pertaining to certain time periods:
1. Click the radio button next to Start.
2. Specify the daily interval when you want to collect performance data.
192
Chapter 9: Capacity planning
3. Specify the days of the week when you want to collect performance data.
4. Click Update to save your changes.
Note: The settings you specify are saved within the resource container.
Showing the calculations and variables
From the Summary page of the Capacity Planning module, you can also reach all
the calculations that go into a capacity plan.
To view the calculations:
1. Open the Capacity Planning module.
2. Click Details in the bottom right.
The Details page displays the calculations which were performed in the order
they were performed.
To view the calculation data in a spreadsheet or a text editor, click Copy in the
upper left of the Details page.
193
Chapter 10: Configuration
comparison
Virtualization Manager can retain historical data for performance, state, event, and
configuration data, and can visualize this data in a manner that helps you
understand the life cycle of virtual machines and hosts. Select one or two virtual
machines or hosts from a search query result list on the search results page, and
then click Compare for further historical analysis.
Using DNA comparison
DNA™ Comparison consists of two parts that together comprise the unique
attributes of a virtual machine or host throughout its life cycle.
The first part is the identity attributes. These make up the combination of
unchanging attributes that define what uniquely identifies a virtual machine or a
host through typical life cycle transitions.
The second component of DNA™ Comparison comprises all the remaining
attributes of virtual machines or hosts that are subject to change and that uniquely
identify it at a particular point in its life cycle. This second class of attributes is
available for historical analysis by the Compare feature.
The first step to performing comparisons is to find the VMs or hosts. Select the
objects you want on the search results page, and then click Compare.
The following screen is displayed to compare the two objects. This is an overview
of the comparison of every attribute collected for the objects at the time of the most
recent data collection interval.
194
Chapter 10: Configuration comparison
This page is comprised of several key details. The left column displays a list of
categories of attributes that you can examine for comparison on a category by
category basis. The degree of differences for each category is also displayed in a
gauge to the left of the category name. The green represents similarities and the
white space represents differences. The overall matching percentage based
score is computed and presented by the gauge on the results pane with a
comparison of the direct attribute counts below. The meaning of the colors is
similar to the attribute categories.
The majority of the results page is dedicated to the comparison of the selected
objects.
Comparing an object to itself
To compare an object to itself over time, change the time selectors to the times
you want, and then click Go. This way you can compare a virtual machine or host
to itself over time to understand configuration drift of the object and to pinpoint
configuration changes across a specific data collection interval and therefore a
specific time frame.
Comparing two objects
If you select two objects from the search results, the comparison between the two
objects occurs at the last point when data was collected for each one individually.
195
Using detailed comparison by category
Multiple virtual machine or host comparisons help you understand changes that
should have some degree of logical similarity such as parent-child relationships
in cases of VM cloning, or similarly configured VMs such as cluster members.
The Comparison overview screen also presents a graph of the degree of
difference between each of the different categories of attributes to quickly identify
attribute categories of interest. Each color on the bars for each category
represents a different comparison state. White represents attributes that are
identical between objects selected, and pink represents attributes that have
different values. Each bar also has metrics for the percentage of similar attributes
and raw attribute similarity comparisons. The gray areas are section headers.
Using detailed comparison by category
To examine a particular attribute category in more detail, select the category for a
detailed analysis of every attribute in the category. The resulting display lists the
attribute name in the left column and the resulting values for each object in the
remaining columns. The color-coding represents a different comparison state.
White represents attributes that are identical between the selected objects, and
pink represents attributes that have different values. The scroll bar to the right of
the table gives an at a glance view of the differences so that you can immediately
scroll to particular areas. The radio buttons to Show all fields or Only show
differences refresh the table to show all attributes or only the attributes that are
different in value or their presence.
196
Chapter 11: Dependency maps
By using dependency maps, you can see one item in your virtual infrastructure
and its relationship to the rest of the infrastructure. Dependency maps provide a
way to see how problems in your environment may affect applications, services,
or other areas of your virtual infrastructure.
Dependency maps start with one or more items in context. Initially, the items in
context appear in the top box. All items that depend on (or are depended on by)
the items in context then appear in the other four boxes. There are generally a
total of five boxes in a dependency map.
l
Virtual Machines
l
Hosts
l
Clusters
l
Datastores
l
Applications
The items displayed in their boxes are only the items that are related to whatever
is in context. Changing the context will change the dependencies.
Using the initial context
To see the dependency maps, perform one of the following steps:
l
l
Click Explore, and then click Map. This method opens the dependency
map with all clusters in context. By definition, this means that the
dependency map shows the entire virtual environment.
Select one or more items from search results or the active list, and then click
Map in the action bar. This method places the selected items in context.
197
Chapter 11: Dependency maps
Only those virtual infrastructure items that are related to what is in context
will be displayed on the dependency map.
Setting context
To reset the context, click Show Entire Environment on the left. This puts all
clusters in your virtual environment in context. By definition, this means that each
box contains all entities: VMs, hosts, datastores, and applications.
To set the context to just a few items currently in the map:
1. Select the small check box in the upper left corner of the items you want.
2. Click Context in the main box to put the selected items in context.
Understanding alerts
In all boxes, any entity that has an alert firing displays a colored icon. Hover over
the item to get details of the alerts that are currently firing.
The colors and their meanings are the following:
Color
Meaning
No color No alerts
Blue
Informational
Yellow
Warning
Red
Critical
This legend is displayed in the top right of the dependency map. Clear the
relevant check boxes to fade alerts into the background if you do not want to see
them.
Adding items to a chart
To add items to a chart, perform the following steps:
198
Exporting data
1. Select the small check box in the upper left of the items you want to add to a
chart.
2. Click More in the upper right, and then select Add to Chart.
3. Select the chart to which you want to add the item.
Exporting data
To export data, perform the following steps:
1. Select the small check box in the upper left of the items you want to export.
2. Click More in the upper right, and then select Export.
3. Add any attributes you want to include in the data export, or load a
predefined template.
4. Click Run Export.
Adding items to a list
To add items to a list, perform the following steps:
1. Select the small check box in the upper left of the items you want to add to
the list.
2. Click More in the upper right, and then select Add to List.
Sorting items
To sort a box, place an item in context first. Click Sort by in the lower left of the
box, and then select how to sort the items in the box. Click OK to finalize the sort.
Using Time Travel
To view the dependencies of a specific time and date, ensure that a single item is
in context. The Time Travel control switches to “ON” when a single item is in
context. Click View Calendar to browse to the date you want. The map changes
199
Chapter 11: Dependency maps
accordingly, providing a historical view of the configuration and dependencies of
your virtual infrastructure.
Any Comparison or Add to Chart commands you run on objects while in Time
Travel mode run in the context of the selected time period.
Note: The Time Travel control is only available if there is a single object in the
context box.
200
Chapter 12: Content
The Content module of Virtualization Manager has two main sections. The left
side is a content filter where you can drill down to exactly the type of content you
want based on its attributes. You can filter the content in the viewer by Tags,
Type, or User (Owner) and Permissions.
The right side of the content viewer displays the content itself based on the filters
that you have applied. You can sort any list of content, using the Sort by list on
the top right of the content viewer. You can sort content by name, type, creation
date, or modification date.
Editing content
After you have found the content you want, click it to get the details and actions
you can take with that piece of content.
The actions at the bottom of the screen are the following:
l
Edit (pencil icon): Allows you to change the name, description, or
permissions of the content.
l
Configure: Launches the editor to change the content based on its type.
l
View: Launches the viewer to see the output of the content based on its
type.
Note: Not all types of content have the same operations available to them.
Adding and removing content
Content is not static in Virtualization Manager, it can be added and removed. To
remove content, select it, and then click Delete.
201
Chapter 12: Content
Any time you create and save content of any type in Virtualization Manager, it is
displayed in the content manager with you as its owner. This is the most common
way that content is created.
SolarWinds may release periodic content updates and these new pieces of
content can be imported into your system.
Importing content
To import content, perform the following steps:
1. Click Import Content in the lower right of the content viewer.
2. Select the file to import.
3. Select the privileges (visibility) that you want to assign the new content.
Virtualization Manager content is in XML format and you can browse to
open any XML file that SolarWinds delivered to you to import it into the
system. After import, the new content is available in the content browser and
can be edited, executed, deleted, or tagged.
You can also export content to share with other Virtualization Manager users, or
to request assistance from SolarWinds Technical Support.
Exporting content
To export content, perform the following steps:
1. Select the content in the Content viewer.
2. Click Export in the upper right.
3. Click Save on the window that appears to name the export file and select its
location.
Content types
The following table lists the content types with a brief description.
202
Content types
Content
type
Description
Alerts
Monitors incoming data and triggers notifications based on
rules.
Dashboards
Collections of widgets available on the user's home page.
Lists
Collections of configuration items (CIs), such as VMs, hosts,
datastores, clusters, and applications.
Queries
Search terms to find configuration items.
Reports
MS Excel or PDF output from canned reports or data export.
Resource
Containers
Used by the capacity planning module to define the supply of
resources.
Usage Profiles
Used by the capacity planning module to define the usage of
resources.
Templates
Used by data export to define what properties of a configuration
item to export.
Trends
Periodic searches and functions to track changes in a virtual
environment over time.
Each piece of content has the following attributes:
l
Tags
l
Type
l
Owner
l
Permissions
203
Chapter 12: Content
Tags
In the Tags accordion content filter section on the left, you can filter content by
tags. By default, this view has no tags selected, so it shows all content regardless
of tags. Select one or more tags to filter the view to only show content with the
specific tag. This way you can filter content to only see pieces that can help with a
problem at hand. For instance, if you have storage issues, select the Storage tag
on the left to see all content where you can search, trend, or alert on storage
related issues.
Modifying the tags of a piece of content
To modify tags, perform the following steps:
1. Select the content, and then click Tags.
2. With the Assign button selected, click each tag you want to add to the
content.
Removing tags from a piece of content
To remove tags, perform the following steps:
1. Select the content, and then click Tags.
2. Click Remove, and then select the tag names to remove.
Creating custom tags
To create custom tags, perform the following steps:
1. Click Tags in the top right of the content viewer.
2. Click Assign.
3. In the text box next to the Plus (+) button, type the name of the new tag.
4. Click the Plus (+) button.
After clicking the Plus (+) button, the new tag can be applied to all content.
204
Owner and permissions
Owner and permissions
For administrators, all content is accessible on the content management page.
Non-administrator users only have access to their content and the publicly
readable or writable content of other users.
You can change the permissions on any content that you own or that is world
writable.
To modify permissions:
1. Select the content, and then click the Pencil button in the bottom left.
2. Select the permission type you want from the Permission list.
3. Click Save.
To change the owner of a piece of content, you must own the content, or the
content must be world writable.
To change the owner of a piece of content:
1. Select the content, and then click Set Owner.
2. Select the user you want to make the owner of the content.
205
Chapter 13: Lists
Lists, and more specifically, the Active List, provide a mechanism to group related
objects into permanent collections to be reused at any time. Lists can contain
VMs, hosts, clusters, datastores, and applications.
For example, if you search for a specific set of VMs requiring a patch, you can add
the results of the search to the Active List and save that list for future reference.
This way you can use the list as a holding pen of VMs requiring the patch update.
As VMs get patched, they can be removed from the list.
Another example is grouping a collection of hosts based on ownership, role,
geography, or any combination of attributes for the purpose of sharing these lists
with other Virtualization Manager users. You can make the lists private, publicly
readable, or publicly writable.
Lists are different from search queries in that they are static by nature. If a VM
changes characteristics that are criteria for a search query, that VM does not show
up in the result set anymore, but it remains in the list.
Note: The only exceptions are cases where the VM is unregistered with a
vCenter server or otherwise made unavailable for data collection.
Nearly every screen and module in Virtualization Manager has buttons or links to
add items to the active list. These are usually an orange "+" icon or button next to
virtual objects (VMs, hosts, and so on). Click the orange "+" to add a single object
to the active list. When there are multiple objects on a page like on search results
pages, or on dependency maps, you can select multiple items. Click Add to List
to add all these items to the active list. Likewise, some types of dashboard
widgets have an Add to List button, usually located at the top of the screen or
control, to add their contents to the active list.
Note: At any given time, there is only one active list. It is displayed in the Explore
tab under List.
206
Chapter 13: Lists
You can continuously add items to the active list from multiple pages in
Virtualization Manager. After you have completed finding and adding VM objects
to the active list, you can review the items in the active list at any time by selecting
the Explore module tab and clicking List. This brings up the current contents of
the active list.
This page works much like the search page in that each item and each group of
items has check boxes next to it. Selecting one or more items brings up a row of
action buttons to do things such as comparisons, data exports, adding notes, and
so on.
You can perform several different operations with the items on the list:
l
Remove items from the list
l
Add a note to items
l
Add items to chart
l
View items on the Map
l
View the notes pertaining to items
l
Export items
l
Plan and manage capacity
l
Add labels to items
l
Compare items
l
Add items to app
The actions you can perform with the whole list are the following:
l
Click Save as in the bottom right to save the contents of the current list for
later use. Specify the permissions, name, description, and one or more tags
when saving a new list.
l
Click Clear to remove the contents of the entire active list.
l
Click Load to load a list you saved previously.
207
Chapter 14: Reporting
There are two types of reporting possibilities in SolarWinds Virtualization
Manager, On-demand reporting and Data exports.
Reports can be configured to run on a periodic basis according to a schedule and
are known as Scheduled report jobs.
Data exports
You can export the results of any search query or list to a Microsoft Excel
spreadsheet in XLS format. When it is exported, you can download the results
immediately or save them as a report for sharing with other Virtualization Manager
users. This is particularly useful when you want to share the results of a query,
condition, or state of your virtual infrastructure with others. You can either provide
the export results in Microsoft Excel (XLS) format for emailing to others who do
not have access to Virtualization Manager such as managers, suppliers, or
vendors, or place the report in a shared folder within Virtualization Manager for
other users to see.
Generating exports
To generate an export, perform the following steps:
1. Select one or more items in the search results page, or in the active list.
2. Click Export.
3. In the left column of the Data Export screen, verify that you have selected
the appropriate objects to export data from. If you have not selected the
objects you wanted, click either Load list or Load search to reset the
Export These Items list.
4. Click Add Attribute in the right column.
208
Chapter 14: Reporting
5. Select the attributes you want to export, either from the list, or by using the
Filter field.
6. Click OK.
7. Repeat Steps 4 to 6 for every attribute that you want to export.
8. Click Run Export.
As the report runs, it is displayed in the report schedules page. When it is
completed, you can download the resulting report immediately, or you can refer to
it at any point as a piece of content.
Generating exports from a search query
To generate exports from a search query, perform the following steps:
1. Type a search query in the search field.
2. After the query is executed, click Export Results.
3. Follow Steps 3 to 8 of the previous export procedure.
You can save the attributes you selected as a standard named set by clicking
Save as at the bottom right of the data export screen. Similarly, you can load a
saved set of attributes by clicking Load at the bottom right of the data export
screen.
Virtualization Manager contains several templates for all types of objects. Click
Load Template in the right column of a fresh Data Export page, or click Load at
the bottom right of the data export screen.
On-demand reporting
On-demand reports provide a mechanism for exporting data from Virtualization
Manager. Scripted reports differ from data exports by adding additional data or
doing additional processing. While data exports enable you to create a
spreadsheet of data that has already been collected, a scripted report can collect
additional data from external sources and process it to present new insight.
209
Scheduled report jobs
To access the reporting interface:
1. Click Reporting.
2. Click On-Demand Reporting.
The following scripted reports are available in SolarWinds Virtualization
Manager:
l
Active Snapshots
l
Chargeback
l
Connected Media
l
Orphaned Files
l
Oversized VMs for a specific Cluster
l
Undersized VMs
l
Unused Templates
l
VM Aging
l
VM Free Space
To execute any of the reports, select it either directly from the reports lists, or from
the report categories listed on the right. Reports are generated from direct
connections with live data sources. Therefore a Virtual Center or Hyper-V server
instance must be specified in the selection list. The format for the report data is a
Microsoft Excel 2007 spreadsheet (XLS) file.
Besides the scripted reports, you can create your own reports as well. For more
information about creating reports, see Using custom reports.
Scheduled report jobs
After executing a report, you are redirected to the Report Schedules page. A "job"
is a generic word for any scheduled task. Scheduled reports are the most
common type of scheduled jobs. This page shows you the status of the job or jobs
210
Chapter 14: Reporting
in progress, and here you can also configure the jobs to run them on a periodic
basis.
The Report Schedules page has the following columns:
l
Scheduled
l
Running
l
Completed
When a job is being executed, it is displayed in the Running column. Usually, a
report that runs only once only stays in the Running column for a few seconds or
minutes. When it has finished running, it is moved to the Completed column. The
items marked in green in the Completed column ran successfully. Items marked
in red failed during execution.
Downloading reports
After a scheduled job is executed, it is displayed in the Completed column, and
the resulting report is available for download.
To download a report:
1. Click Download.
2. Click Save, and then specify the location where you want to save the report.
Configuring schedules
Click Configure to configure a schedule. The job configuration dialog has the
following tabs:
l
l
Information: Here you can view and change the name and description of
the job. For reports, this is the name and description of the resulting report
when it completes and is present in your content.
Schedule: Here you can configure a repeating schedule for a job. In
practice, this is most commonly used to generate daily, weekly, or monthly
reports. Select the start time and the recurrence interval (Once, Daily,
Weekly, Monthly, or Cron). If you select Cron, fill in the Cron expression in
211
Removing report jobs
GMT to describe the recurrence interval. Finally, you can choose an end
date after which no more jobs will be run on this schedule.
l
Notifications: Here you can specify the users you want to notify of the
completion of a job. You can enter multiple email addresses, separated by a
comma. If the job is a report, the users on the notification list receive an
email stating that the report completed, and the report itself is also attached
to the email.
Note: You must enable an SMTP server under Setup > Administration >
SMTP Configuration to be able to send emails.
Removing report jobs
To remove a scheduled job and prevent it from being executed again, select the
job in the Scheduled column, and then click Remove.
Note: You will not be asked for confirmation before the job is deleted.
Pausing and resuming report jobs
Pausing a scheduled job prevents it from being executed while it is in a paused
state. To pause a job, select the job in the Scheduled column, and then click
Pause.
To make the job active again, click Resume.
Using custom reports
The easiest way to create a custom report is to base it on a saved query. For
example, to report the number of VMs with more than four snapshots, perform the
following steps:
1. Type vm.snapshotSummaryCount:[4 TO *] in the search bar, or use the
Advanced Search feature.
2. After the query runs, save the query, and then navigate to Reporting > All
Reports > Queries.
3. Select the query from the list, and then click Create Excel Report.
212
Chapter 14: Reporting
4. Specify the permission, name, description, and the associated tags of the
new report.
5. Click Save.
6. To schedule when the report runs and who is notified when it has run, go to
Reporting > Report Schedules.
You can also create custom reports by using dashboard reports.
To run a dashboard report:
1. Create a custom dashboard.
2. Click Create Dashboard Report in the top right of the dashboard.
3. Specify the permission, name, description, and the associated tags of the
new report.
4. Click Save.
5. To configure when the report runs and who is notified when it has run, go to
Reporting > Report Schedules.
Notes:
l
l
Dashboard reports are published as PDFs.
Some widgets on the dashboard are not printed in the report, such as maps
or RSS feeds.
213
Chapter 15: Custom labels
Labels provide a mechanism to insert business information into Virtualization
Manager so that business data can be searched, exported, and compared. Labels
are similar to custom fields in Virtual Center. You can define both the name of the
label and assign a different value to one or more hosts or VMs. The new label
becomes a part of the host or VM data so that it can be used throughout
SolarWinds Virtualization Manager.
The most common uses for labels are to assign VMs and hosts to departments,
lines of business, applications, or resource pools. You can then create searches
based on those values. Because you can search on the data, you can also use
those searches as the basis for trends. You can use this mechanism for chargeback. In addition, all custom fields are available as facets that you can view in the
Facet Explorer or in the search results.
Creating labels
To create a label, perform the following steps:
1. Select one or more result on the search results page.
2. Click Label, and then click Add new field.
3. Specify the name of the label, and then click Create.
The Labels page also shows all of the currently defined labels and the values of
those labels on the selected search results.
Modifying labels
To modify a label, perform the following steps:
214
Chapter 15: Custom labels
1. Type the new value in the field next to the appropriate label.
2. Click Save changes.
Removing labels
To remove a label, perform the following steps:
1. Select the label from the list.
2. Click Delete a field.
Note: If you remove a label, no history of the label or its value will remain.
To search for a label, type the value of the label into the Search Query.
Alternatively, you can also type the label name and value separated by a colon.
For instance, if you have a label named "Department" and you want to find
entities in the "Finance" department, you can search for either:
Finance
or
Department:Finance
215
Chapter 16: Notes
Notes are a mechanism to document details of VMs, hosts, clusters, datastores,
and applications that cannot adequately be documented through other means. By
annotating a virtual object, you can create a journal of running commentary on the
life cycle of items in the virtual infrastructure. This is useful as it can be made to
capture the reason why something changed, as opposed to the what, when, and
how of changes. This sort of information is typically not provided in event logs or
other sources of management data.
Adding notes
To add a note, perform the following steps:
1. Select one or more objects on the search results page, the active list, or
configuration item view.
2. Click Add Note.
3. Specify the content, the permission, the tags and the expiry date of the note.
4. Click Save.
Viewing notes
To view existing notes, perform the following steps:
1. Select one or more objects on the search results page or the active list.
2. Click View Notes.
The results provide details about each note, when it was created, who created it,
and for which entity it applies. In addition, you can get a link to any of these notes
as well as provide any additional commentary on the existing notes.
216
Chapter 17: Using the SolarWinds
Integrated Virtual Infrastructure
Monitor
The following sections provide more information about the features available in
the Orion Web Console.
The section contains the following topics:
l
Account limitations
l
Virtualization thresholds
l
Using baselining
l
Understanding Object Statuses
l
Creating virtualization alerts in the Orion Alert Manager
l
Creating virtualization reports in the Orion Report Manager
l
Viewing related entities in the Orion web console
l
Viewing storage infrastructure information in the Orion web console
l
Monitoring hardware health in IVIM
Account limitations
Account limitations can be used to restrict user access to designated virtual
machines, hosts, clusters, or data stores, or to withhold certain types of
information from designated users.
The following account limitation types are available for use in the integrated
Virtualization Manager resources:
217
Chapter 17: Using the SolarWinds Integrated Virtual Infrastructure Monitor
l
Single Virtual Machine
l
Group of Virtual Machines
l
Virtual Machine Name Pattern
l
Single Virtual Host
l
Group of Virtual Hosts
l
Virtual Host Name Pattern
l
Single Cluster
l
Group of Clusters
l
Cluster Name Pattern
l
Single Datacenter
l
Group of Datacenters
l
Datacenter Name Pattern
l
Single Virtual Center
l
Group of Virtual Centers
l
Single Datastore
l
Group of Datastores
l
Datastore Name Pattern
Setting up user account limitations
To set up user account limitations, perform the following steps:
1. Log in to the Orion Web Console as an administrator.
2. Click Settings in the top right of the web console, and then click Manage
Accounts in the User Accounts grouping of the Orion Website
Administration page.
218
Virtualization thresholds
3. To limit an individual user account, complete the following steps:
a. On the Individual Accounts tab, select the account you want to limit.
b. Click Edit.
c. In the Account Limitations section, click Add Limitation.
d. Select the type of limitation you want to apply, and then click
Continue.
e. Define the limitation as directed on the Configure Limitation page that
follows.
f. Click Submit.
4. To limit a group account, complete the following steps:
a. On the Groups tab, select the group account you want to limit.
b. Click Edit.
c. Click Add Limitation in the Account Limitations section.
d. Select the type of limitation you want to apply, and then click
Continue.
e. Define the limitation as directed on the Configure Limitation page that
follows.
f. Click Submit.
Note: Limitations applied to a selected group account only apply to the
group account, and not, by extension, to the accounts of members of the
group.
Virtualization thresholds
The Virtualization Thresholds settings page lets you configure warning and
critical (high) thresholds for statistics collected for VMware objects.
219
Chapter 17: Using the SolarWinds Integrated Virtual Infrastructure Monitor
Objects with measurements that exceed the Warning Level threshold are
displayed in red text.
Objects that exceed the High Level threshold are displayed in red text with bold
type.
Using baselining
Using the baselining feature, you can display baselines on different charts in the
Orion Web Console. In the Orion Web Console, you can define general static
thresholds for every entity, and you can base alerts on the global static
thresholds. However, you can also override the global threshold, and specify a
custom dynamic baseline threshold on an entity per entity basis.
The baseline is calculated based on the normal historical distribution of data,
taking the mean and standard deviations into account. Baselines can be used to
detect and alert on deviations from the average values. Baselines can be
calculated automatically, and can be applied as soon as sufficient statistical data
becomes available. You can also recalculate baselines on demand.
Note: Some of the values that are considered during baseline calculation come
from Virtualization Manager. For this reason, baselining only works when Virtual
Integration Manager (VIM) is enabled.
The following table contains the list of statistics for which baselines are
applicable.
vNode
VIM clusters (VMware only)
VIM hosts
Statistics
l
CPULoad
l
MemLoad
l
NetworkUtilization
l
MemLoad*
l
CPULoad*
220
Defining baselines
vNode
VIM virtual machines
Statistics
l
CPULoad
l
MemLoad
l
CPUReady*
l
IOPSTotal*
l
IOPSRead*
l
IOPSWrite*
l
LatencyTotal*
l
LatencyRead*
l
LatencyWrite*
l
VIM datastores
Network Usage
Rate
l
IOPSTotal*
l
IOPSRead*
l
IOPSWrite*
l
LatencyTotal*
l
LatencyRead*
l
LatencyWrite*
* - For the statistics marked with asterisk, baselines are only available if
Virtualization Integration is enabled, and the vNodes contain data sent from
Virtualization Manager.
Defining baselines
You can define baselines for individual entities, and for multiple resources at
once.
221
Chapter 17: Using the SolarWinds Integrated Virtual Infrastructure Monitor
To define a baseline for an individual vNode:
1. Click Edit thresholds on the resource, and then select the thresholds you
want to edit.
2. Select Override Global Orion Threshold or Set Dynamic Threshold, and
then set either a static threshold, or click Use Dynamic Baseline
Thresholds to define a formula for calculating a baseline.
3. Click Submit.
To define a baseline for multiple vNodes at once:
1. Open Settings > Node & Group Management > Manage Virtual Devices
in the Orion Web Console.
2. Click the Thresholds tab.
3. Select the entity type for which you want to configure a baseline threshold
from the Show list:
l
Virtual Centers
l
Clusters
l
Hosts
l
Virtual Machines
l
Datastores
4. Select the vNodes for which you want to configure a baseline.
5. Click Edit Thresholds, and then select the thresholds you want to edit.
6. Select Override Global Orion Threshold or Set Dynamic Threshold, and
then set either a static threshold, or click Use Dynamic Baseline
Thresholds to define a formula for calculating a baseline.
7. Click Submit.
222
Understanding Object Statuses
Note: To configure thresholds for, for example, all virtual machines under a given
host, first select all vNodes, and then deselect the vNodes for which you do not
want to define thresholds.
Understanding Object Statuses
The object statuses that are displayed in IVIM are determined automatically
based on data polling.
Additionally, by configuring Warning and Critical level thresholds you can
determine when an object should reach Warning or Critical state. For information
about configuring thresholds, see Setting Orion General Thresholds in the
SolarWinds Orion Platform Administrator Guide.
The tables in this section provide information about the statuses and their
meaning, and about the status icons related to particular objects in different
contexts.
The following statuses can apply to the following configuration items.
Status
Down
Critical
Applies to
l
l
Cluster
l
Datastore
l
Warning
Virtual
Machine
Virtual
Machine
l
Host
l
Cluster
l
Datastore
l
Virtual
223
Chapter 17: Using the SolarWinds Integrated Virtual Infrastructure Monitor
Status
Applies to
Machine
Up
l
Host
l
Cluster
l
vCenter
l
Datastore
l
Unknown
l
Host
l
Cluster
l
vCenter
l
Datastore
l
Unreachable
Unmanaged
Virtual
Machine
Virtual
Machine
l
Host
l
vCenter
l
Host
l
vCenter
l
Host
The following tables provide information about the individual status icons and
their meaning.
224
vCenter
vCenter
Status
Icon Description
Up
The vCenter is connected and running without problems.
Unknown
The vCenter has not been polled recently.
Unreachable
The vCenter and the vCenter node cannot be polled. The
parent node is down and it is not possible to connect to
the vCenter.
Unmanaged
The vCenter is set as Unmanaged in the Manage Nodes
page of IVIM.
Could not
poll
The vCenter cannot be polled because of a connection
or credentials issue.
Disabled
polling
The polling of the vCenter has been set to Disabled in
the Virtualization Polling Settings of IVIM.
Datacenter
Status
Icon Description
Critical
The status is inherited from child objects. The cluster or ESX
(i) host is in a critical state.
Warning
The status is inherited from child objects. The cluster or ESX
(i) host is in a warning state.
Up
The status is inherited from child objects. The cluster or ESX
(i) host is running without problems.
Unknown
The status is inherited from the parent object. The vCenter is
in an Unknown, Unmanaged, Unreachable, or Could not
poll state.
225
Chapter 17: Using the SolarWinds Integrated Virtual Infrastructure Monitor
Cluster
Status
Icon Description
Critical
In a VMware environment, the cluster reached a critical level
threshold in vSphere. In a Hyper-V environment, the cluster
is reported as Up.
Warning
In a VMware environment, the cluster reached a warning
level threshold in vSphere. In a Hyper-V environment, the
cluster is reported as Up.
Up
There are no critical or warning level alerts active for the
cluster in vSphere.
Unknown
The status is inherited from the parent object. The datacenter or vCenter is in an Unknown, Unmanaged, Unreachable, or Could not poll state.
Disabled
polling
The status is inherited from the parent object. The polling of
the vCenter has been set to Disabled in the Virtualization
Polling Settings in IVIM.
Host
Status
Icon
for
ESX Icon for
(i)
Hyper-V Description
Critical
The host reached a critical level threshold, or
in a VMware environment, a critical alert on
the host is active in vSphere.
Warning
The host reached a warning level threshold,
or in a VMware environment, a warning alert
226
Host
Status
Icon
for
ESX Icon for
(i)
Hyper-V Description
on the host is active in vSphere.
Up
The host is connected and running without
problems.
Unknown
Either the host has not been polled recently,
or the status is inherited from the parent
object, and the parent vCenter is in an
Unknown, Unmanaged, Unreachable, or
Could not poll state.
Unreachable
The host cannot be polled. The parent node is
down and it is not possible to connect to the
host.
Unmanaged
The host is set as Unmanaged in the Manage
Nodes page of IVIM.
Could not
poll
The host cannot be polled because of a connection or credentials issue.
Disabled
Either the polling of the host has been set to
polling
Disabled in the Virtualization Polling Settings
of IVIM, or the status is inherited from the parent object, and the polling of the parent
vCenter has been set to Disabled in the Virtualization Polling Settings of IVIM.
227
Chapter 17: Using the SolarWinds Integrated Virtual Infrastructure Monitor
Virtual Machine
Status
Icon for Icon for
VMware Hyper-V Description
Down
-
The Hyper-V virtual machine is shut down
and is in a critical state.
Shutdown
The virtual machine is shut down.
Critical
The virtual machine reached a critical level
threshold, or in a VMware environment, a critical alert on the virtual machine is active in
vSphere.
Warning
The virtual machine reached a warning level
threshold, or in a VMware environment, a
warning alert on the virtual machine is active
in vSphere.
Up
The virtual machine is connected and running without problems.
Unknown
The status is inherited from the parent
objects. The ESX(i) or Hyper-V host, and the
items above are in an Unknown, Unmanaged, Unreachable, or Could not poll state.
Disabled
polling
The status is inherited from the parent
objects. The polling of the ESX(i) or Hyper-V
host, and the items above have been set to
Disabled in the Virtualization Polling Settings of IVIM.
228
AppStack Environment View and AppStack Environment resource
AppStack Environment View and AppStack Environment resource
Status
Icon Description
Down
The item is shut down or is in a critical state.
Shutdown
The item is shut down.
Critical
The item is in a critical state. The item has reached a critical level threshold.
Warning
The item is in a warning state. The item has reached a
warning level threshold.
Up
The item is running without problems.
Unknown
The item has not been polled recently.
Unreachable
The item cannot be reached and polled.
Unmanaged
The item is set as Unmanaged in the Manage Nodes
page of IVIM.
Disabled
polling
The polling of the item has been set to Disabled in the
Virtualization Polling Settings of IVIM.
Creating virtualization alerts in the Orion Alert
Manager
After integrating IVIM with Virtualization Manager, you can define alerts in the
Orion web console that are based on data collected by Virtualization Manager.
You can use virtualization alerts which are included in the product by default, and
you can also build your custom alerts in the Alert Manager.
229
Chapter 17: Using the SolarWinds Integrated Virtual Infrastructure Monitor
For information about creating and editing alerts in the Alert Manager, see
Creating New Alerts and the related topics in the SolarWinds Orion Platform
Administrator Guide.
If IVIM is not integrated with Virtualization Manager, virtualization alerts are not
available by default. However, you can create your own alerts for the following
object types:
l
Virtual cluster
l
Virtual host
l
Virtual machine
If IVIM is integrated with Virtualization Manager, virtualization alerts are available
by default. If you remove the integration, these virtualization alerts will be
disabled, but you can still create your own alerts for the following object types:
l
Virtual cluster
l
Virtual datastore
l
Virtual host
l
Virtual machine
For information about integrating IVIM with Virtualization Manager, see Integrating
IVIM with Virtualization Manager.
Creating virtualization reports in the Orion Report
Manager
After integrating IVIM with Virtualization Manager, you can define reports in the
Orion web console that are based on data collected by Virtualization Manager.
You can use virtualization reports which are included in the product by default,
and you can also build your custom report in the Report Manager.
For information about creating and editing reports in the Report Manager, see
Creating a new web-based report and the related topics in the SolarWinds Orion
Platform Administrator Guide.
230
Viewing related entities in the Orion web console
To be able to use virtualization reports in the Report Manager, IVIM and
Virtualization Manager must be integrated. If the integration is removed, the
default virtualization reports are not available in the Report Manager.
For information about integrating IVIM with Virtualization Manager, see Integrating
IVIM with Virtualization Manager.
Viewing related entities in the Orion web console
The Application Stack or AppStack Environment view provides visibility into the
relations existing between the different entities on your network. It provides an indepth perspective through the entire environment to help identify the root cause of
performance and availability issues.
AppStack is available in the following versions of Orion platform products:
l
Storage Resource Monitor 6.0
l
Integrated Virtual Infrastructure Monitor 2.0
l
Server & Application Monitor 6.2
l
Web Performance Monitor 2.2
If you own two or more of the listed products, AppStack will not function properly
unless each product is upgraded to the previously listed versions.
You can reach the AppStack Environment view by navigating to Home >
Environment in the Orion web console.
Through the AppStack Environment view, you can visualize and navigate the
entire infrastructure that an application is using. Additionally, you can see what
other loads on the infrastructure can be affecting a particular application.
The following virtualization entities are part of the AppStack Environment:
l
Virtual Centers
l
VMware datacenters
l
Virtual clusters
231
Chapter 17: Using the SolarWinds Integrated Virtual Infrastructure Monitor
l
Virtual hosts
l
Virtual machines
l
Data stores
Apart from the AppStack Environment view, you can also use the AppStack
Environment resource. The AppStack Environment resource is available on the
Details pages of individual entities, and it displays objects that are related to the
particular entity whose Details page you are viewing.
For more information about the AppStack Environment view, see Introduction to
the AppStack Environment View and the related topics in the SolarWinds Server
and Application Monitor Administrator Guide.
For more information about the AppStack Environment resource, see AppStack
Environment Resource in the SolarWinds Network Performance Monitor
Administrator Guide, and Understanding the AppStack Resource in the
SolarWinds Server and Application Monitor Administrator Guide.
Viewing storage infrastructure information in the
Orion web console
Installing Storage Resource Monitor (SRM) along with IVIM provides insight into
the physical storage environment that corresponds to the virtual environment. By
installing both IVIM and SRM, you can gain an overall view of your physical
storage infrastructure.
If SRM is installed alongside IVIM, the storage information about LUNs that is
displayed in IVIM is directly linked to the information stored in SRM. By clicking
the links displayed in IVIM resources, you can reach the corresponding Details
page of the particular storage volume and get detailed information about it.
The storage related information is only visible in IVIM if a mapping exists between
a storage volume and the virtualization volume entity, and if IVIM is integrated
with Virtualization Manager. For information about integrating IVIM with
232
Monitoring hardware health in IVIM
Virtualization Manager, see Preparing for the integration of Virtualization
Manager.
For information about installing SRM, see Installing Storage Resource Monitor in
the SolarWinds Storage Resource Monitor Administrator Guide.
For detailed information about the features of SRM, see the Storage Resource
Monitor Administrator Guide.
Note: If Virtualization Manager is integrated with Storage Manager (STM), the
links to STM are displayed in the IVIM resources even if the SRM module is not
installed. For information about integrating Virtualization Manager with STM, see
Configuring the Storage Manager installation details.
Monitoring hardware health in IVIM
By monitoring the hardware health of nodes, you can get information about the
status of hardware components such as fans, batteries, and power supplies.
If hardware health monitoring is enabled, you can use the following hardware
health resources on the Managed ESX Host Details view in IVIM. Click the links
for more information about each resource.
l
Current Hardware Health
l
Hardware Details
l
Hardware Health
The following resource is displayed on the Virtualization Summary view. Click the
link for more information about the resource.
l
Hardware Health Overview
233
Chapter 18: Integrated Virtualization
Infrastructure Monitor resources
The following sections provide detailed information about the specific Integrated
Virtualization Manager resources that are available in the Orion Web Console.
For information about integrating SolarWinds Virtualization Manager with
SolarWinds Orion Platform products, see Preparing for the integration of
Virtualization Manager.
Active Virtualization Alerts
This resource, available on the Datastore, Cluster, Host and VM detail views,
provides a running list of alerts related to a datastore, cluster, host, or VM. The list
also includes alerts raised for related entities.
The table contains the following information:
l
Time of alert
l
Name of the device
l
Additional information about the alert
Applications on this Datastore
This resource, available on the Datastore Details view, provides a table with the
following information about applications using the datastore:
l
Application Name
l
Status (up or down)
l
Node (where application is installed)
Click Edit to adjust the title or subtitle.
234
Chapter 18: Integrated Virtualization Infrastructure Monitor resources
Notes:
l
l
A datastore refers to a VMWare datastore, Hyper-V local storage, or
Hyper-V cluster shared volumes (CSV) that clusters, hosts, and VMs can be
assigned to share.
To determine associations of VMs and datastores on Hyper-V
environments, Virtualization Manager identifies what the system regards as
the default location or datastore for vm and vhd files. All VMs managed by a
hypervisor are automatically associated with this default datastore.
Component Volumes
This resource, available on the Node Details > Storage view, provides a table
with the following information about the node:
l
Mount Point
l
Capacity
l
Free Space
l
Used (%)
l
Virtual Disk
Click Edit to adjust the title and the warning and critical thresholds.
Datacenter Details
This resource displays a table of useful information about the current datacenter.
Hover over the Virtual Center Name to see additional information about the
vCenter.
Datacenter Details view
The Datacenter Details view contains resources which provide information about
the status of the particular datacenter and about how the datacenter is related to
other virtualization or storage entities in your environment.
235
Datacenters with Problems
To modify the view, click Customize Page at the top right corner of the view.
Datacenters with Problems
This resource provides a list of datacenters that experience problems, complete
with the description of the problem.
Click Edit to modify the following settings of the resource:
l
Title
l
Subtitle
l
Maximum number of objects to display
l
Filter by object status
Datastore Info
This resource, available on the Datastore Details view, provides a table with the
following data store usage information:
l
Status (online/offline)
l
Type (NAS, SAN, JBOD)
l
Location
l
Storage Full By (date)
Click Edit to adjust the title or subtitle.
Notes:
l
l
A datastore refers to a VMWare datastore, Hyper-V local storage, or
Hyper-V cluster shared volumes (CSV) that clusters, hosts, and VMs can be
assigned to share.
To determine associations of VMs and datastores on Hyper-V
environments, Virtualization Manager identifies what the system regards as
the default location or datastore for vm and vhd files. All VMs managed by a
hypervisor are automatically associated with this default datastore.
236
Chapter 18: Integrated Virtualization Infrastructure Monitor resources
Datastore IOPS and Latency
This resource, available on the Datastore Details view, provides averages for the
IOPS and latency for VMs using the datastores.
The measure for IOPS shows averages for the set intervals. By default, the
intervals are for the last hour, last 24 hours, and last 30 days. The measure for
latency shows the average for the selected interval, in milliseconds.
Clicking either the Datastore IOPS or Datastore Latency measure opens the
relevant datastore details resource.
l
IOPS (Datastore and its Top VMs)
l
Latency (Datastore and its Top VMs)
Click Edit to adjust the gauge style and size.
Note: A datastore refers to a VMWare datastore, Hyper-V local storage, or
Hyper-V cluster shared volumes (CSV) that clusters, hosts, and VMs can be
assigned to share.
Effective CPU Load
This chart displays the CPU load of the cluster as a whole.
To get a more detailed view of the CPU load of the cluster, click the zoom buttons,
or move the slider to cover the time period you want.
To view the exact CPU load percentages at a given point in time, hover over the
appropriate bar in the chart.
Click Export to get a printable and exportable version of the chart.
Effective Memory Load
This chart displays the memory load of the cluster as a whole.
To get a more detailed view of the memory load of the cluster, click the zoom
buttons, or move the slider to cover the time period you want.
237
ESX Host Details
To view the exact memory load percentages at a given point in time, hover over
the appropriate bar in the chart.
Click Export to get a printable and exportable version of the chart.
ESX Host Details
This resource presents a table providing information about the selected ESX host,
including its operational status, the physical memory installed on the host server,
the number of VMs configured on the host server, and the vCenter through which
the host is polling.
Hover over the vCenter for additional details about the vCenter.
Click Edit Host to manage the alerting threshold properties of the host.
Guests with Problems
This resource provides a list of guests that experience problems, complete with
the machine type and the description of the problem.
Click Edit to modify the following settings of the resource:
l
Title
l
Subtitle
l
Maximum number of objects to display
l
Filter by object status
l
Filter by vendor
Host Details view
The Host Details view contains resources which provide information about the
status of the particular host and about how the host is related to other
virtualization or storage entities in your environment.
To modify the view, click Customize Page at the top right corner of the view.
238
Chapter 18: Integrated Virtualization Infrastructure Monitor resources
Hosts with Problems
This resource provides a list of hosts that experience problems, complete with the
machine type and the description of the problem.
Click Edit to modify the following settings of the resource:
l
Title
l
Subtitle
l
Maximum number of objects to display
l
Filter by object status
l
Filter by vendor
IOPS (Datastore and its Top VMs)
This resource, available on the Datastore Details view, provides a graph of IOPS
against adjustable intervals.
Hold your pointer over a graph line to see details on all VMs at the data point
(IOPs at the specific date and time).
The table below the chart provides the following information:
l
VM nodes by name
l
Overall IOPS
l
Read IOPS
l
Write IOPS
l
Cluster with which the VM node is associated
Click Edit to adjust the zoom range (controlled by the slider), the amount of
historical data to load (for example, Last 1 Day), and the sample interval (for
example, 6 hours).
239
Latency (Datastore and its Top VMs)
Click Export to convert chart data into XLS or HTML format. You can adjust the
title, the default zoom range, the time period, the sample interval, and the chart
size in preparation for export.
Notes:
l
l
A datastore refers to a VMWare datastore, Hyper-V local storage, or
Hyper-V cluster shared volumes (CSV) that clusters, hosts, and VMs can be
assigned to share.
To determine associations of VMs and datastores on Hyper-V
environments, Virtualization Manager identifies what the system regards as
the default location or datastore for vm and vhd files. All VMs managed by a
hypervisor are automatically associated with this default datastore.
Latency (Datastore and its Top VMs)
This resource, available on the Datastore Details view, provides a graph of
latency against adjustable intervals of daily time.
Hold your pointer over a graph line to see details on all VMs at the data point
(latency at a specific date and time).
The table below the chart provides the following information:
l
VM nodes by name
l
Overall latency
l
Read latency
l
Write latency
l
Cluster with which the VM node is associated
Click Edit to adjust the zoom range (controlled by the slider), the amount of
historical data to load (for example, Last 1 Day), and the sample interval (for
example, 6 hours).
240
Chapter 18: Integrated Virtualization Infrastructure Monitor resources
Click Export to convert chart data into XLS or HTML format. You can adjust the
title, the default zoom range, the time period, the sample interval, and the chart
size in preparation for export.
Notes:
l
l
A datastore refers to a VMWare datastore, Hyper-V local storage, or
Hyper-V cluster shared volumes (CSV) that clusters, hosts, and VMs can be
assigned to share.
To determine associations of VMs and datastores on Hyper-V
environments, Virtualization Manager identifies what the system regards as
the default location or datastore for vm and vhd files. All VMs managed by a
hypervisor are automatically associated with this default datastore.
Learn More about VMan Roles
This resource provides a list of configurations date-time stamped with the time of
download. Clicking a configuration takes you to the configuration details.
To modify how many configuration changes to display in the list, click Edit.
Note: Orion NPM Web Console resources only display data representative of the
intersection of nodes between the Orion NPM Web Console and the Orion NCM
Web Console.
List of Virtual Hosts
This resource lists the virtual hosts that belong to the cluster, and provides a highlevel summary of their utilization.
Hover over a host name to see additional information about the virtual host.
Overall Number of Running vs. Total VMs
This resource displays a summary of how many VMs are currently running.
To get a more detailed view of the number of running VMs, click the zoom
buttons, or move the slider to cover the time period you want.
241
Percent Availability
To view the number of running or not running VMs at a given point in time, hover
over the appropriate bar in the chart.
Click Export to get a printable and exportable version of the chart.
Percent Availability
This chart displays the availability of the cluster.
To get a more detailed view of the cluster availability, click the zoom buttons, or
move the slider at the bottom of the chart to cover the time period you want.
To view the exact availability percentage at a given point in time, hover over the
appropriate bar in the chart.
Click Export to get a printable and exportable version of the chart.
Percent Memory Used
This chart displays the memory usage of the cluster as a whole.
To get a more detailed view of the memory usage of the cluster, click the zoom
buttons, or move the slider to cover the time period you want.
To view the exact used memory percentages at a given point in time, hover over
the appropriate bar in the chart.
Click Export to get a printable and exportable version of the chart.
Predicted Datastore Space Depletion
This resource, available on the Virtualization Storage Summary view, provides a
table with the following information:
l
Datastore (name)
l
Free Space (GB)
l
Capacity (GB)
l
Storage Full By (estimated date)
Hover over a datastore name to see Datastore Info.
242
Chapter 18: Integrated Virtualization Infrastructure Monitor resources
Click Edit to adjust the resource title and the maximum number of datastores to
display.
Notes:
l
l
A datastore refers to a VMWare datastore, Hyper-V local storage, or
Hyper-V cluster shared volumes (CSV) that clusters, hosts, and VMs can be
assigned to share.
To determine associations of VMs and datastores on Hyper-V
environments, Virtualization Manager identifies what the system regards as
the default location or datastore for vm and vhd files. All VMs managed by a
hypervisor are automatically associated with this default datastore.
Predicted VM Disk Depletion
This resource, available on the Virtualization Storage Summary view, provides a
table with the following information:
l
Node (VM)
l
Free (%)
l
Capacity
l
Free Space (GB)
Hover over a datastore name to see Datastore Info.
Click Edit to adjust the resource title and the maximum number of datastores to
display.
Notes:
l
l
A datastore refers to a VMWare datastore, Hyper-V local storage, or
Hyper-V cluster shared volumes (CSV) that clusters, hosts, and VMs can be
assigned to share.
To determine associations of VMs and datastores on Hyper-V
environments, Virtualization Manager identifies what the system regards as
243
Resource Utilization
the default location or datastore for vm and vhd files. All VMs managed by a
hypervisor are automatically associated with this default datastore.
Resource Utilization
This resource, available on the Virtualization Summary subview under an ESX
host detail or a VM detail, provides the resource utilization values for nodes. The
VM detail view of the resource shows the resource utilization values for a specific
VM and its host. The Host detail view shows the resource utilization values for a
specific host and for the VM with the top resource consumption under the host.
The Host detail view of this resource displays the following resource utilization
values:
l
CPU - This host
l
CPU - Top VM
l
Memory - This host
l
Memory - Top VM
l
Network utilization - This host
l
Network utilization - Top VM
l
IOPS - Top VM
l
Latency - Top VM
Note: Every top utilization value can correspond to a different virtual machine.
The VM detail view of this resource displays the following resource utilization
values:
l
CPU - This VM
l
CPU - Host
l
Memory - This VM
l
Memory - Host
244
Chapter 18: Integrated Virtualization Infrastructure Monitor resources
l
Network utilization - This VM
l
Network utilization - Host
l
IOPS - This VM
l
Latency - This VM
l
CPU Ready - This VM
Setup Virtualization Manager Integration
This resource accepts input that integrates the Virtualization Manager server into
the Orion Web Console of your Orion platform product.
To integrate Virtualization Manager:
1. Enter the appropriate information about your Virtualization Manager
instance.
a. Enter the server name or IP address of the Virtualization Manager
server.
b. Enter the port number (443 is the default) on which the Virtualization
Manager expects to service web requests.
c. Enter the user name and password that can access the Virtualization
Manager web console.
2. Click Submit.
Storage Summary
This resource, available on the Node Details > Storage view, provides the
following information about storage:
l
Host Server
l
Datastore that the host is using, including its size, free space, IOPS, latency
l
LUN ID/Path
245
Top Datastore I/O Latency
Click Edit to adjust the type of information to display.
Note: A datastore refers to a VMWare datastore, Hyper-V local storage, or
Hyper-V cluster shared volumes (CSV) that clusters, hosts, and VMs can be
assigned to share.
Top Datastore I/O Latency
This resource, available on the Virtualization Storage Summary view, provides a
graph of IO latency in milliseconds against a date or time period.
Hold your pointer over a graph line to see details on all data stores at the data
point (latency at the specific date and time).
The table below the graph provides the following information:
l
Node
l
Latency (total in ms)
l
Read (ms)
l
Write (ms)
l
Cluster with which the node is associated
Click Edit to adjust the zoom range (controlled by the slider), the amount of
historical data to load (for example, Last 1 Day), and the sample interval (for
example, 6 hours).
Click Export to convert chart data into XLS or HTML format. You can adjust the
title, the default zoom range, the time period, the sample interval, and the chart
size in preparation for export.
Notes:
l
l
A datastore refers to a VMWare datastore, Hyper-V local storage, or
Hyper-V cluster shared volumes (CSV) that clusters, hosts, and VMs can be
assigned to share.
To determine associations of VMs and datastores on Hyper-V
environments, Virtualization Manager identifies what the system regards as
246
Chapter 18: Integrated Virtualization Infrastructure Monitor resources
the default location or datastore for vm and vhd files. All VMs managed by a
hypervisor are automatically associated with this default datastore.
Top Datastore IOPS
This resource provides a graph of IOPS against a date or time period.
Hover over a graph line to see details on all datastores at the data point (latency
at the specific date and time). Hover over a node to see Datastore Info.
The table below the graph provides the following information:
l
Node
l
IOPS (total)
l
Read
l
Write
l
Cluster with which the node is associated.
Click Edit to adjust the zoom range (controlled by the slider), the amount of
historical data to load (for example, Last 1 Day), and the sample interval (for
example, 6 hours).
Click Export to convert chart data into XLS or HTML format. You can adjust the
title, the default zoom range, the time period, the sample interval, and the chart
size in preparation for export.
Notes:
l
l
A datastore refers to a VMWare datastore, Hyper-V local storage, or
Hyper-V cluster shared volumes (CSV) that clusters, hosts, and VMs can be
assigned to share.
To determine associations of VMs and datastores on Hyper-V
environments, Virtualization Manager identifies what the system regards as
the default location or datastore for vm and vhd files. All VMs managed by a
hypervisor are automatically associated with this default datastore.
247
Top VM IOPS
Top VM IOPS
This resource provides a graph VM IOPS against a date or time period.
Hover over a graph line to see details about all VMs at the data point (IOPS at the
specific date and time). Hover over a node to see VM information.
The table below the graph provides the following information:
l
Node
l
IOPS (total)
l
Read
l
Write
l
Cluster with which the node is associated
Click Edit to adjust the zoom range (controlled by the slider), the amount of
historical data to load (for example, Last 1 Day), and the sample interval (for
example, 6 hours).
Click Export to convert chart data into XLS or HTML format. You can adjust the
title, the default zoom range, the time period, the sample interval, and the chart
size in preparation for export.
Top VM Latency
This resource provides a graph VM IO latency (ms) against a date or time period.
Hover over a graph line to see details about all VMs at the data point (latency at
the specific date and time). Hover over a node to see VM information.
The table below the graph provides the following information:
l
Node
l
Read (latency in ms)
l
Write (latency in ms)
l
Cluster with which the node is associated.
248
Chapter 18: Integrated Virtualization Infrastructure Monitor resources
Click Edit to adjust the zoom range (controlled by the slider), the amount of
historical data to load (for example, Last 1 Day), and the sample interval (for
example, 6 hours).
Click Export to convert chart data into XLS or HTML format. You can adjust the
title, the default zoom range, the time period, the sample interval, and the chart
size in preparation for export.
Notes:
l
A datastore refers to a VMWare datastore, Hyper-V local storage, or
Hyper-V cluster shared volumes (CSV) that clusters, hosts, and VMs can be
assigned to share.
l
To determine associations of VMs and datastores on Hyper-V
environments, Virtualization Manager identifies what the system regards as
the default location or datastore for vm and vhd files. All VMs managed by a
hypervisor are automatically associated with this default datastore.
Top XX Datastores by Low Free Space
This resource, available on the Virtualization Storage Summary view, provides a
table with the following information:
l
Datastore (name)
l
Free (%)
l
Capacity
l
Free Space (GB)
Hover over a datastore name to see Datastore Info.
Click Edit to adjust the resource title and the maximum number of datastores to
display.
Notes:
l
A datastore refers to a VMWare datastore, Hyper-V local storage, or
Hyper-V cluster shared volumes (CSV) that clusters, hosts, and VMs can be
249
Top XX Hosts by CPU Load
assigned to share.
l
To determine associations of VMs and datastores on Hyper-V
environments, Virtualization Manager identifies what the system regards as
the default location or datastore for vm and vhd files. All VMs managed by a
hypervisor are automatically associated with this default datastore.
Top XX Hosts by CPU Load
This resource ranks hosts by CPU utilization.
Hover over a host name to see additional details about the host.
To change how many hosts are listed:
1. Click Edit.
2. Enter the number of hosts to list in the Maximum Number of Hosts to
Display field.
To filter the host list based on properties:
1. Click Edit.
2. Enter the SWQL filter in the Filter Guests field. For more information, see
the Filter Syntax Guide in the Orion Platform Administrator Guide.
Top XX Hosts by Network Utilization
This resource ranks hosts by network utilization.
Hover over a host name to see additional details about the host.
To change how many hosts are listed:
1. Click Edit.
2. Enter the number of hosts to list in the Maximum Number of Hosts to
Display field.
250
Chapter 18: Integrated Virtualization Infrastructure Monitor resources
To filter the host list based on properties:
1. Click Edit.
2. Enter the SWQL filter in the Filter Hosts field. For more information, see the
Filter Syntax Guide in the Orion Platform Administrator Guide.
Top XX Hosts by Number of Running VMs
This resource ranks hosts by how many virtual machines each runs.
Hover over a host name to see additional information about the host.
To change how many hosts are listed:
1. Click Edit.
2. Enter the number of hosts to list in the Maximum Number of Hosts to
Display field.
To filter the host list based on properties:
1. Click Edit.
2. Enter the SWQL filter in the Filter Hosts field. For more information, see the
Filter Syntax Guide in the Orion Platform Administrator Guide.
Top XX Hosts by Percent Memory Used
This resource ranks hosts by memory utilization.
Hover over a host name to see additional details about the host.
To change how many hosts are listed:
1. Click Edit.
2. Enter the number of hosts to list in the Maximum Number of Hosts to
Display field.
251
Top XX Managed Virtual Guests by Current Response Time
To filter the host list based on properties:
1. Click Edit.
2. Enter the SWQL filter in the Filter Hosts field. For more information, see the
Filter Syntax Guide in the Orion Platform Administrator Guide.
Top XX Managed Virtual Guests by Current
Response Time
This resource lists the guests with the worst response times.
To change how many guests are listed:
1. Click Edit.
2. Enter the number of hosts to list in the Maximum Number of Hosts to
Display field.
To filter the guest list based on properties:
1. Click Edit.
2. Enter the SWQL filter in the Filter Guests field. For more information, see
the Filter Syntax Guide in the Orion Platform Administrator Guide.
Top XX Managed Virtual Guests by CPU
This resource lists the guests with the most CPU usage.
To change how many guests are listed:
1. Click Edit.
2. Enter the number of hosts to list in the Maximum Number of Hosts to
Display field.
252
Chapter 18: Integrated Virtualization Infrastructure Monitor resources
To filter the guest list based on properties:
1. Click Edit.
2. Enter the SWQL filter in the Filter Guests field. For more information, see
the Filter Syntax Guide in the Orion Platform Administrator Guide.
Top XX Managed Virtual Guests by Memory
This resource lists the guests with the highest memory usage.
To change how many guests are listed:
1. Click Edit.
2. Enter the number of hosts to list in the Maximum Number of Hosts to
Display field.
To filter the guest list based on properties:
1. Click Edit.
2. Enter the SWQL filter in the Filter Guests field. For more information, see
the Filter Syntax Guide in the Orion Platform Administrator Guide.
Top XX Managed Virtual Guests by Network
Utilization
This resource lists the guests with the highest network usage.
To change how many guests are listed:
1. Click Edit.
2. Enter the number of hosts to list in the Maximum Number of Hosts to
Display field.
253
Top XX Managed Virtual Guests by % Packet Loss
To filter the guest list based on properties:
1. Click Edit.
2. Enter the SWQL filter in the Filter Guests field. For more information, see
the Filter Syntax Guide in the Orion Platform Administrator Guide.
Top XX Managed Virtual Guests by % Packet Loss
This resource lists the guests with the worst packet loss percentages.
To change how many guests are listed:
1. Click Edit.
2. Enter the number of hosts to list in the Maximum Number of Hosts to
Display field.
To filter the guest list based on properties:
1. Click Edit.
2. Enter the SWQL filter in the Filter Guests field. For more information, see the
Filter Syntax Guide in the Orion Platform Administrator Guide.
Top XX VMs by Allocated Space
This resource, available on the Datastore Details view, provides a chart of VMs
with the largest allocated storage space, plotting storage used against capacity,
and extrapolating a full storage projection based on the current trend.
The table below the chart provides the following information:
l
VM nodes by name
l
(Storage) Used (%)
l
(Storage) Capacity
l
Storage Full By (date)
Click Edit to adjust the maximum number of VMs to display.
254
Chapter 18: Integrated Virtualization Infrastructure Monitor resources
Notes:
l
l
A datastore refers to a VMWare datastore, Hyper-V local storage, or
Hyper-V cluster shared volumes (CSV) that clusters, hosts, and VMs can be
assigned to share.
To determine associations of VMs and datastores on Hyper-V
environments, Virtualization Manager identifies what the system regards as
the default location or datastore for vm and vhd files. All VMs managed by a
hypervisor are automatically associated with this default datastore.
Top XX VMs by Low Storage Space
This resource, available on the Datastore Details view, provides a chart of VMs
with the lowest available storage space, plotting storage used against capacity.
The table below the chart provides the following information:
l
VM nodes by name
l
(Storage) Used (%)
l
(Storage) Capacity
l
Cluster with which a VM node is associated
Click Edit to adjust the maximum number of VMs to display.
Notes:
l
A datastore refers to a VMWare datastore, Hyper-V local storage, or
Hyper-V cluster shared volumes (CSV) that clusters, hosts, and VMs can be
assigned to share.
l
To determine associations of VMs and datastores on Hyper-V
environments, Virtualization Manager identifies what the system regards as
the default location or datastore for vm and vhd files. All VMs managed by a
hypervisor are automatically associated with this default datastore.
255
Top XX VMs by Overallocated CPU
Top XX VMs by Overallocated CPU
This resource, available on the Sprawl view, provides a table with the following
information about VMs with overallocated CPU:
l
Node
l
CPU (%)
l
CPU Recommendation (increase/decrease by)
Hover over a VM to see details.
Click Edit to adjust the number of VMs to display.
Top XX VMs by Overallocated Memory
This resource, available on the Sprawl view, provides a table with the following
information about VMs with overallocated memory:
l
Node
l
Mem (%)
l
Mem Recommendation (increase/decrease by)
Hover over a VM to see details.
Click Edit to adjust the number of VMs to display.
Top XX VMs by Snapshot Disk Usage
This resource, available on the Sprawl view, provides a table with the following
information about VMs:
l
Node
l
Snapshots (GB)
l
Cluster with which node is associated
l
Datastore with which node is associated
Hover over a VM or datastore to see details.
256
Chapter 18: Integrated Virtualization Infrastructure Monitor resources
Click Edit to adjust the number of VMs and datastores to display.
Notes:
l
l
A datastore refers to a VMWare datastore, Hyper-V local storage, or
Hyper-V cluster shared volumes (CSV) that clusters, hosts, and VMs can be
assigned to share.
To determine associations of VMs and datastores on Hyper-V
environments, Virtualization Manager identifies what the system regards as
the default location or datastore for vm and vhd files. All VMs managed by a
hypervisor are automatically associated with this default datastore.
Top XX VMs by Storage Consumed
This resource, available on the Virtualization Storage Summary view, provides a
table with the following information:
l
Node
l
Free Space (GB)
l
Capacity (GB)
l
Storage Full By (estimated date)
Hover over a datastore name to see Datastore Info.
Click Edit to adjust the resource title and the maximum number of datastores to
display.
Notes:
l
l
A datastore refers to a VMWare datastore, Hyper-V local storage, or
Hyper-V cluster shared volumes (CSV) that clusters, hosts, and VMs can be
assigned to share.
To determine associations of VMs and datastores on Hyper-V
environments, Virtualization Manager identifies what the system regards as
the default location or datastore for vm and vhd files. All VMs managed by a
hypervisor are automatically associated with this default datastore.
257
Top XX VMs by Underallocated CPU
Top XX VMs by Underallocated CPU
This resource, available on the Sprawl view, provides a table with the following
information about VMs with underallocated CPU:
l
Node
l
CPU (%)
l
CPU Recommendation (increase/decrease by)
Hover over a VM to see details.
Click Edit to adjust the number of VMs to display.
Top XX VMs by Underallocated Memory
This resource, available on the Sprawl view, provides a table with the following
information about VMs with underallocated memory:
l
Node
l
Mem (%)
l
Mem Recommendation (increase/decrease by)
Hover over a VM to see details.
Click Edit to adjust the number of VMs to display.
Top XX VMs by Used Space
This resource, available on the Datastore Details view, provides a chart of VMs
with the most storage space used, plotting storage used against capacity, and
extrapolating a full storage projection based on the current trend.
The table below the chart provides the following information:
l
VM nodes by name
l
(Storage) Used (%)
258
Chapter 18: Integrated Virtualization Infrastructure Monitor resources
l
(Storage) Capacity
l
Storage Full By (date)
Click Edit to adjust the maximum number of VMs to display.
Note: A datastore refers to a VMWare datastore, Hyper-V local storage, or
Hyper-V cluster shared volumes (CSV) that clusters, hosts, and VMs can be
assigned to share.
Usage MHz
This chart displays how many CPU cycles are used by the cluster as a whole.
To get a more detailed view of the CPU cycles of the cluster, click the zoom
buttons, or move the slider to cover the time period you want.
To view the exact CPU usage at a given point in time, hover over the appropriate
bar in the chart.
Click Export to get a printable and exportable version of the chart.
Virtual Cluster Details
This resource provides a table of vital statistics regarding the cluster.
Click Edit to modify the resource title and subtitle.
Click Edit Cluster to modify the alerting thresholds corresponding to the cluster.
Virtual Disks and Related Storage Infrastructure
This resource, available on the Node details > Storage view, provides
information about the virtual disks connected to a particular virtual machine, and
about their capacity.
By expanding the details of a specific virtual disk, you can see information about
the volumes, data stores, and LUNs connected to the virtual disk.
If your product is integrated with SolarWinds Storage Resource Monitor (SRM),
you can click the name of the LUN for detailed information.
259
Virtual Machine Details view
Virtual Machine Details view
The Virtual Machine Details view contains resources which provide information
about the status of the particular virtual machine and about how the virtual
machine is related to other virtualization or storage entities in your environment.
Besides viewing the status information, you can perform virtual machine
management actions through the resources located in this view.
To modify the view, click Customize Page at the top right corner of the view.
Virtual Machine IOPS
This resource, available on the Node Details > Storage view, provides a graph
of IOPS against adjustable intervals.
Select the VM or host to see IOPS charted for the VM, host, or both.
Hold your pointer over a graph line to see details on all VMs at the data point
(IOPs at the specific date and time).
Click Edit to adjust the zoom range (controlled by the slider), the amount of
historical data to load (for example, Last 1 Day), and the sample interval (for
example, 6 hours).
Click Export to convert chart data into XLS or HTML format. You can adjust title,
default zoom range, time period, sample interval, and chart size in preparation for
export.
Virtual Machine IOPS and Latency
This resource, available on the Node Details > Storage view, provides averages
for the IOPS and latency for the selected VM.
The measure for IOPS shows averages for the set intervals (by default, last hour,
last 24 hours, last 30 days). The measure for latency shows the average (in
milliseconds) for the selected interval.
Clicking either the VM IOPS or VM Latency measure opens the relevant VM
details resource.
260
Chapter 18: Integrated Virtualization Infrastructure Monitor resources
l
IOPS (Datastore and its Top VMs)
l
Virtual Machine Latency
Click Edit to adjust the gauge style and size.
Virtual Machine Latency
This resource, available on the Node Details > Storage view, provides a graph
of latency against adjustable intervals.
Select the VM or host to see latency charted for the VM, host, or both.
Hold your pointer over a graph line to see details about all VMs at the data point
(IOPs at the specific date and time).
Click Edit to adjust the zoom range (controlled by the slider), the amount of
historical data to load (for example, Last 1 Day), and the sample interval (for
example, 6 hours).
Click Export to convert chart data into XLS or HTML format. You can adjust the
title, the default zoom range, the time period, the sample interval, and the chart
size in preparation for export.
Virtualization Assets
This resource displays the virtual servers monitored by SolarWinds and also lists
the individual virtual machines they host.
To add VMs from the Virtualization Assets Resource:
1. Click the [+] next to any virtual server listed in the Virtualization Assets
resource to expand the list of virtual machines.
2. Click a virtual machine that is not currently managed by SolarWinds.
Unmanaged VMs are listed in italic type.
3. Click Yes, Manage this Node.
4. If the VM is not running Virtual Tools, manually enter the IP address of the
VM in the Hostname or IP Address field.
261
Virtualization Asset Summary
5. Select any additional options required to monitor the VM, and then click
Next.
6. Follow the remainder of the Add Node wizard to completion, and then click
OK, Add Node.
Virtualization Asset Summary
This resource presents a table providing a high-level summary of your virtualized
infrastructure. The information is broken down into the following sections,
depending on your virtual environment.
Overall
Number of Hosts
Indicates the total number of hosts you are monitoring.
Number of VMs
Indicates the total number of VMs you are monitoring, including information
about the number of running VMs.
Total Number of Physical CPU Cores
Indicates the total number of CPU cores in your virtual infrastructure.
Total RAM
Indicates the total amount of memory in your virtual infrastructure.
Last Poll
Indicates the age of the summary information in your virtual infrastructure.
VMware
Number of Virtual Centers
Indicates the total number of servers you are monitoring.
Number of Clusters
Indicated the total number of clusters you are monitoring.
262
Chapter 18: Integrated Virtualization Infrastructure Monitor resources
Resource Pools
Indicates the total number of non-clustered hosts.
ESX Hosts
Indicates the total number of ESX hosts you are monitoring.
Number of VMs
Indicates the total number of VMs you are monitoring in your VMware
environment, including information about the number of running VMs.
Total Number of Physical CPU Cores
Indicates the total number of CPU cores in your VMware infrastructure.
Total RAM
Indicates the total amount of memory in your VMware infrastructure.
Last Poll
Indicates the age of the summary information in your VMware infrastructure.
Hyper-V
Number of Hosts
Indicates the total number of Hyper-V hosts you are monitoring.
Number of VMs
Indicates the total number of VMs you are monitoring in your Hyper-V
environment, including information about the number of running VMs.
Total Number of Physical CPU Cores
Indicates the total number of CPU cores in your Hyper-V infrastructure.
Total RAM
Indicates the total amount of memory in your Hyper-V infrastructure.
Last Poll
Indicates the age of the summary information in your Hyper-V infrastructure.
Virtualization Manager Alerts
This resource provides a rolling list of alerts that pertain to the selected datastore.
263
Virtualization Manager Tools
Click Edit to adjust the number of items to display.
Virtualization Manager Tools
This resource provides links that directly navigate to Virtualization Manager tools
such as the Virtualization Performance Explorer and the Virtualization Map, and
put the selected object (datastore or virtual machine) in the context of the selected
tool.
Additionally, basic management actions can also be performed directly from the
Orion web console, without accessing your vSphere Client or SCVMM. You can
perform the following power and snapshot management actions in the Orion web
console:
l
Power off virtual machines
l
Suspend virtual machines
l
Pause virtual machines
l
Reboot virtual machines
l
Take snapshots of virtual machines
l
Delete snapshots of virtual machines
The availability of these options is controlled by Orion account limitations. If an
option is not accessible, make sure that your account has the appropriate
permission levels.
The availability of the options also depends on the current state of the virtual
machine in context. For example, if the virtual machine is offline, the Power off VM
option is not present.
Modifying the permissions
To modify the permissions, perform the following steps:
1. Navigate to Settings > Manage Accounts in the Orion web console.
2. Select the user whose permissions you want to modify, and then click Edit.
264
Chapter 18: Integrated Virtualization Infrastructure Monitor resources
3. Expand the Integrated Virtual Infrastructure Monitor Settings grouping.
4. Modify the Virtual Machine Power Management and the Snapshot
Management options, and then click Submit.
Virtualization Storage Summary
This resource, available on the Virtualization Storage Summary view, provides
the following information about datastores and VMs:
Datastores:
l
Number of datastores
l
Total space
l
Free space
l
Oversubscribed
l
Storage full (%)
Virtual Machines:
l
Number of virtual machines
l
Number of virtual machines powered on
l
Average size
l
Average IOPS
l
Average latency
Notes:
l
l
A datastore refers to a VMWare datastore, Hyper-V local storage, or
Hyper-V cluster shared volumes (CSV) that clusters, hosts, and VMs can be
assigned to share.
To determine associations of VMs and datastores on Hyper-V
environments, Virtualization Manager identifies what the system regards as
265
Virtualization Volume Details
the default location or datastore for vm and vhd files. All VMs managed by a
hypervisor are automatically associated with this default datastore.
Virtualization Volume Details
This resource is available on the storage volume details page, and provides the
following information about the virtualization volume that is mapped to the storage
volume:
l
Volume name
l
Datastore
l
Virtual Disk
The resource also provides direct access to the Virtualization Storage Summary
view.
Note: The resource is only displayed if a mapping exists between a storage
volume and the virtualization volume entity, and if the integration with
Virtualization Manager is enabled. For information about integrating IVIM with
Virtualization Manager, see Preparing for the integration of Virtualization
Manager.
VMs Idle for the Last Week
This resource, available on the Sprawl view, provides a table with the following
information about VMs idle for the last week:
l
Node
l
Week Average CPU
l
Week Average IOPS
l
Week Average Net
Hover over a VM to see details.
Click Edit to adjust the number of VMs to display.
266
Chapter 18: Integrated Virtualization Infrastructure Monitor resources
VMs Powered Off for More Than 30 Days
This resource, available on the Sprawl view, provides a table with the following
information about VMs that have been powered off for more than 30 days:
l
Node
l
Configured Memory
l
Total Storage
l
Last Powered on (Date/Time)
Hover over a VM to see details.
Click Edit to adjust the number of VMs to display.
VMs that might benefit from decreasing vCPUs
This resource, available on the Sprawl view, provides a table with the following
information about VMs that can benefit from decreasing vCPUs:
l
Node name
l
CPU load
l
Number of current vCPUs
l
CPU costop
Hover over a VM to see its details.
Click Edit to edit the name and description of the resource.
Note: The costop counter information is only collected for VMware VMs. The
CPU costop counter is available for API version 5.0 or later.
VMware vCenters with Problems
This resource provides a list of vCenters that experience problems, complete with
the description of the problem.
Click Edit to modify the following settings of the resource:
267
VMware Clusters with Problems
l
Title
l
Subtitle
l
Maximum number of objects to display
l
Filter by object status
VMware Clusters with Problems
This resource provides a list of clusters that experience problems, complete with
the description of the problem.
Click Edit to modify the following settings of the resource:
l
Title
l
Subtitle
l
Maximum number of objects to display
l
Filter by object status
268
Appendix A: Troubleshooting Hyper-V discovery
The following section provides troubleshooting information for Hyper-V discovery
and collection on Virtualization Manager.
Why does Virtualization Manager not receive
information from Hyper-V Hosts?
If you have never been able to discover or collect information from Hyper-V hosts,
one of the following conditions may be true:
l
Missing administrative credentials
l
WMI is not enabled
l
WMI Counters must be reset
l
Firewall is misconfigured
l
DCOM is not enabled
l
UAC is enabled
l
RPC in not enabled
If these conditions are not met, Virtualization Manager cannot collect information
from the Hyper-V host.
If data collection stops after the initial setup, it can be related to new security
policies or a group policy that supersedes your changes. This document is not
intended to troubleshoot this scenario.
For further troubleshooting information, see the Microsoft TechNet and the
Microsoft Developer Network websites, and search for WMI troubleshooting.
269
Appendix A: Troubleshooting Hyper-V discovery
Testing local WMI services
Testing the local WMI ensures that the Hyper-V host can be monitored and
queried remotely. The test software, WBEMTest, is included with Microsoft
Windows operating systems.
Testing WMI on the target server
Complete the following procedure to check whether WMI on the target server is
functioning correctly:
1. Log on to the target server with an administrator account.
2. Click Start > Run, type wbemtest.exe, and then click OK.
3. Click Connect on the Windows Management Instrumentation Tester
window.
4. Type root\cimv2 in the field at the top of the window next to the Connect
button.
5. Click Connect.
6. Click Enum Classes.
270
Resetting the WMI counters
7. Select the Recursive radio button without entering a superclass name, and
then click OK.
8. If the WMI class you are querying appears in this list, local WMI services are
functioning correctly. Skip to the next topic and test remote WMI.
9. If the list does not appear or does not contain the WMI class you want, WMI
is not functioning correctly. Continue reading this section to repair WMI
services on the target server.
10. Click Close, and then click Exit.
Resetting the WMI counters
At times, the WMI performance counters may not get transferred to WMI because
services were delayed or started out of order. For more information, see the article
271
Appendix A: Troubleshooting Hyper-V discovery
at the Microsoft Knowledge Base.
To manually reset the WMI counters:
1. Stop the Windows Management Instrumentation service.
2. Click Start, click Run, type cmd, and then click OK.
3. At the command prompt, type winmgmt /resyncperf, and then press enter.
4. At the command prompt, type wmiadap.exe /f, and then press enter.
5. Type exit, and then press enter to close the command prompt.
6. Start the Windows Management Instrumentation service.
7. After resetting the WMI counters, retest WMI.
Note: For further troubleshooting information, see the Microsoft TechNet and the
Microsoft Developer Network websites, and search for WMI troubleshooting.
Testing remote WMI connectivity
Testing the remote WMI connectivity of the target server helps you isolate faults
that could prevent the target server from receiving or responding to remote WMI
requests. The test software, WBEMTest, is included with Microsoft Windows
operating systems.
Remotely testing WMI on the target server
Complete the following procedure to check whether the target server is
responding appropriately to remote WMI requests that originate from SolarWinds
Virtualization Manager:
1. Log on to a different Windows server with an administrator account.
2. Click Start > Run, type wbemtest.exe, and then click OK.
3. Click Connect on the Windows Management Instrumentation Tester
window.
4. Type \\Target_Primary_IP_Address\root\cimv2 in the field at the top of the
dialog box, where Target_Primary_IP_Address is the host name or primary
272
Verifying the administrator credentials
IP address of the target server.
5. Type the user name and the password in the relevant fields, and type
NTLMDOMAIN:NameOfDomain in the Authority field, where NameOfDomain is the
domain of the user account specified in the User field.
6. Click Connect.
7. Click Enum Classes.
Verifying the administrator credentials
Only credentials that have administrator rights on the Hyper-V host have the
necessary permissions to access the WMI services of the host. Make sure that the
user name and password you use belongs to an administrator on the target
server.
If the administrator credential is a domain member, specify both the user name
and the domain in the standard Microsoft syntax. For example:
DOMAIN\Administrator.
Complete the following procedure on each Hyper-V host server to ensure that the
account specified in the credential store has the appropriate permissions.
273
Appendix A: Troubleshooting Hyper-V discovery
Note: If you use a local user account that is added to the administrator group, you
need to explicitly grant permissions in the WMI section.
To add your monitor account to the local administrator group of a Windows
Server 2008 computer:
1. Log on to the computer you want to monitor with an administrator account.
2. Navigate to Start > Control Panel > Administrative Tools > Computer
Management > Local Users and Groups > Groups. Switch to the Classic
View of the Control Panel to use this navigation path.
3. Right-click Administrators, and then click Add to group.
4. If the account you want to use is not currently a member of this group,
complete the following procedure:
a. Click Add on the Administrators Properties window.
b. Type the name of the account you want to use to gather WMI statistics,
and then click OK. This is the account you specify in the credentials
section.
Note: If you add an account to a workgroup computer, you cannot add
a domain account. You must use a local account.
5. Click OK on the Administrators Properties window, and then close the
Computer Management window.
Enabling Remote Procedure Call (RPC)
Remote WMI connections use RPC as a communications interface. If the RPC
service is disabled on the target server, remote WMI connections cannot be
established.
To enable the RPC service:
1. Log on to the target server with an administrator account.
2. Click Start, click Run, type services.msc, and then press enter.
3. Scroll the list to Remote Procedure Call (RPC).
274
Enabling Remote Procedure Call (RPC)
4. Right-click Remote Procedure Call (RPC), and then click Start on the
context menu.
5. Select Recursive without entering a superclass name, and then click OK.
6. If the WMI class list appears, remote WMI is functioning correctly. Go to
Verifying the firewall settings, and then test your Virtualization Manager
credentials.
7. If the list does not appear, remote WMI is not functioning correctly. Continue
reading this topic for guidance on restoring remote WMI connections on the
target server, and retest remote WMI after completing each troubleshooting
step.
8. Click Close, and then click Exit.
275
Appendix A: Troubleshooting Hyper-V discovery
Verifying the firewall settings
To allow Virtualization Manager to collect data, the following firewall rules must
be enabled:
l
Core Networking
l
WMI DCOM-In
If you connect to the Hyper-V host over a DMZ or otherwise employ a hardware
firewall, you must make corresponding changes to your hardware firewall.
If the Hyper-V host cannot respond to ping, either open port 7 or follow the
instructions in Disabling ping discovery to disable ping.
Adding the Windows Firewall snap-in
If you use a Server Core installation, you can connect to the host using an MMC
connection to the host to modify the firewall.
1. Log on to a remote server that can connect to the Server Core installation
with administrative credentials.
2. Press Windows Key + R, and then type mmc.
3. In the File menu, click Add/Remove Snap-in.
4. Select Windows Firewall with Advanced Security.
5. Click Add.
6. Select Another computer, and then enter the IP address or computer name
of the Server Core installation.
7. Click OK.
8. Click OK again.
After the snap-in is added, complete the following instructions.
276
Enabling the core networking rules
Enabling the core networking rules
Ensure that the core networking rules are enabled to collect information
successfully from Hyper-V hosts.
Note: These may be enabled by default.
To allow core networking traffic through the Windows Firewall on Windows
2008 R2:
1. Log on to the computer you want to monitor with an administrator account.
2. Navigate to Start > Administrative Tools > Windows Firewall with
Advanced Security.
3. Click Inbound Rules in the left navigation pane.
4. Ensure that all Core Networking rules are enabled. If not, select the
disabled rule, and then click Enable Rule in the Action menu.
To allow core networking traffic through the Windows Firewall on Windows
2008:
1. Log on to the computer you want to monitor with an administrator account.
2. Navigate to Start > Control Panel > Windows Firewall. Switch to the
Classic View of the Control Panel to use this navigation path.
3. Click Allow a program through Windows Firewall in the left navigation
pane.
4. Select Core Networking.
5. Click OK.
Enabling the Windows Management Instrumentation (DCOM-In) rule
Ensure that the Windows Management Instrumentation (DCOM-In) rule is
enabled to successfully collect information from Hyper-V hosts.
Note: After enabling the Windows Management Instrumentation (DCOM-In) rule,
common WMI checks indicate that WMI is not enabled. This is expected behavior.
277
Appendix A: Troubleshooting Hyper-V discovery
To allow WMI traffic through the Windows Firewall on Windows 2008 R2:
1. Log on to the computer you want to monitor with an administrator account.
2. Navigate to Start > Administrative Tools > Windows Firewall with
Advanced Security.
3. Click Inbound Rules in the left navigation pane.
4. Click Windows Management Instrumentation (DCOM-In), and then click
Enable Rule in the Action menu.
To allow WMI traffic through the Windows Firewall on Windows 2008:
1. Log on to the computer you want to monitor with an administrator account.
2. Navigate to Start > Control Panel > Windows Firewall. Switch to the
Classic View of the Control Panel to use this navigation path.
3. Click Allow a program through Windows Firewall in the left navigation
pane.
4. Select Windows Management Instrumentation (WMI).
5. Click OK.
Creating a new firewall rule to open the RPC ports
Open the RPC ports to successfully collect information from Hyper-V hosts. This
is best done by creating a new firewall rule.
To open the RPC ports on Windows 2008 R2:
1. Log on to the computer you want to monitor with an administrator account.
2. Navigate to Start > Administrative Tools > Windows Firewall with
Advanced Security.
3. Click Inbound Rules in the left navigation pane.
4. Click Actions > New Rule.
5. In Rule Type, select Custom, and then click Next.
278
Creating a new firewall rule to open the RPC ports
6. Select This program path, and then type
%SystemRoot%\System32\dllhost.exe.
7. In Services, click Customize to ensure that Apply to all programs and
services is selected, and then click OK.
8. Click Next
9. In Protocol type, select TCP.
10. In Local port, select RPC Dynamic Ports.
11. In Remote port, select All Ports.
12. Click Next.
13. Apply to any local and remote IP addresses, and then click Next.
14. In Action, ensure that Allow the connection is selected, and then click
Next.
15. Select all profiles (Domain, Private, and Public), and then click Next.
16. Type a name, such as Virtualization Manager WMI Dynamic Ports.
17. Click Finish.
The new rule now appears in the list of inbound rules.
To open the RPC ports on Windows 2008:
1. Log on to the computer you want to monitor with an administrator account.
2. Navigate to Start > Control Panel > Windows Firewall. Switch to the
Classic View of the Control Panel to use this navigation path.
3. Click Allow a program through Windows Firewall in the left navigation
pane.
4. Click Add program.
5. Type %SystemRoot%\System32\dllhost.exe in the program path.
6. Click Change Scope to ensure that Any computer is selected.
7. Click OK.
279
Appendix A: Troubleshooting Hyper-V discovery
8. Click Add Port.
9. Enter the RPC port range.
10. Click Change Scope, and then select Any computer.
11. Click OK.
12. Click OK again.
Disabling ping discovery
Virtualization Manager pings hosts before collection to quickly find or skip hosts. If
port 7 is blocked, Virtualization Manager may fail to discover and collect
information from Hyper-V sources. You can either open port 7 or disable the ping.
To disable the ping:
1. Log on to the administration website of the installation
(https://ipAddress:5480) as user admin and password admin.
2. Navigate to SolarWinds Mgmt.
3. Click Edit Configuration.
4. Select hyper9-config.xml, and then click Edit.
5. Search for wmiexec.ping.enabled and wmiexec.rpccheck.enabled, and then
set both keys to false. For example:
<entry key="wmiexec.ping.enabled">false</entry><entry
key="wmiexec.rpccheck.enabled">false</entry>
6. Click Save.
7. Restart the virtual appliance.
Configuring Virtualization Manager to identify ESX hosts by name
Virtualization Manager uses SMBIOS IDs to keep track of ESX hosts. Based on
SMBIOS IDs Virtualization Manager builds its internal globally unique identifiers
(GUIDs).
280
Configuring Distributed Component Object Model (DCOM) and User Account
Though SolarWinds does not recommend altering this standard configuration, if
you have a business case for doing so, then you can configure Virtualization
Manager to omit SMBIOS IDs and build GUIDs based on ESX host names.
Note: If you configure Virtualization Manager to omit SMBIOS IDs, you cannot
rename hosts monitored by Virtualization Manager without creating an error state.
Virtualization Manager will not be able to recognize the new GUID that is autogenerated.
To omit SMBIOS IDs:
1. Log on to the administration website of the installation
(https://ipAddress:5480) as user admin and password admin.
2. Navigate to SolarWinds Mgmt.
3. Click Edit Configuration.
4. Select hyper9-config.xml, and then click Edit.
5. Insert the following line: <entry
key=”identity.hostServer.omitSMBIOS”>true</entry>.
6. Click Save.
7. Restart the virtual appliance by clicking Restart Virtualization Manager.
Configuring Distributed Component Object Model (DCOM) and
User Account Control (UAC)
Some user types and operating systems require setting changes to allow remote
WMI requests. For more information, see Connecting to WMI Remotely on the
Microsoft Developer Network.
Item
Need
DCOM
Default and Limits permissions edited to allow the following
actions:
l
Local launch (default permission)
281
Appendix A: Troubleshooting Hyper-V discovery
Item
Need
l
Remote launch (default permission)
l
Local activation (limits permission)
l
Remote activation (limits permission)
WMI
Modify the CIMV2 security to enable and remote enable the
Namespaces account used to access the server or workstation through WMI.
Ensure the security change applies to the current namespace
and subnamespaces.
User
Account
Control
Remote UAC access token filtering must be disabled when
monitoring within a workgroup environment.
Enabling DCOM
WMI uses DCOM to communicate with monitored target computers.
To enable DCOM permissions for your Virtualization Manager credentials:
1. Log on to the target server with an administrator account.
2. Navigate to Start > Control Panel > Administrative Tools > Component
Services. Switch to the Classic View of the Control Panel to use this
navigation path. You can also launch this console by double-clicking
comexp.msc
in the /windows/system32 directory.
3. Expand Component Services > Computers.
4. Right-click My Computer, and then select Properties.
5. Select the COM Security tab, and then click Edit Limits in the Access
Permissions grouping.
6. Ensure that the user account you want to use to collect WMI statistics has
Local Access and Remote Access, and then click OK.
282
Enabling account privileges in WMI
7. Click Edit Default, and then ensure the user account you want to use to
collect WMI statistics has Local Access and Remote Access.
8. Click OK.
9. Click Edit Limits in the Launch and Activation Permissions grouping.
10. Ensure that the user account you want to use to collect WMI statistics has
Local Launch, Remote Launch, Local Activation, and Remote Activation,
and then click OK.
11. Click Edit Default, and then ensure that the user account you want to use to
collect WMI statistics has Local Launch, Remote Launch, Local Activation,
and Remote Activation.
12. Click OK.
Enabling account privileges in WMI
The account you specify in the Credentials Library must possess security access
to the namespace and subnamespaces of the monitored target computer. To
enable these privileges, complete the following procedure.
To enable namespace and subnamespace privileges:
1. Log on to the computer you want to monitor with an administrator account.
2. Navigate to Start > Control Panel > Administrative Tools > Computer
Management > Services and Applications. Switch to the Classic View of
the Control Panel to use this navigation path.
3. Click WMI Control, and then right-click and select Properties.
4. Select the Security tab, expand Root, and then click CIMV2.
5. Click Security, select the user account used to access this computer, and
ensure you grant the following permissions: Enable Account, Remote
Enable.
6. Click Advanced, and then select the user account used to access this
computer.
283
Appendix A: Troubleshooting Hyper-V discovery
7. Click Edit, select This namespace and subnamespaces in the Apply to
field, and then click OK.
8. Click OK on the Advanced Security Settings for CIMV2 window.
9. Click OK on the Security for Root\CIMV2 window.
10. Click Services in the left navigation pane of Computer Management.
11. Select Windows Management Instrumentation in the Services result
pane, and then click Restart.
Disabling remote User Account Control for workgroups
If you are monitoring a host in a workgroup, modify the User Account Control
(UAC) settings so that local administrators do not run in Admin Approval Mode.
To modify UAC settings for a workgroup computer:
1. Log on to the computer you want to monitor with an administrator account.
2. Navigate to Start > Administrative Tools > Local Security Policy for
Windows 2008 R2, or navigate to Start > Control Panel > Administrative
Tools > Local Security Policy for Windows 2008.
3. Expand Local Policies > Security Options.
4. In Security Options, select User Account Control: Run all
administrators in Admin Approval Mode.
5. In the Action menu, select Properties.
6. Select Disabled, and then click OK.
7. Restart the computer to apply the change.
Verifying credentials in Virtualization Manager
Virtualization Manager must have the correct credentials to access the Hyper-V
host.
284
Testing the connection between the Hyper-V host and Virtualization Manager
To verify the credentials, perform the following steps:
1. Log on to Virtualization Manager as an administrator.
2. Navigate to Setup > Credentials.
3. Select the Hyper-V credentials.
4. Click Edit.
5. Ensure that the user name, password, and domain are entered correctly.
6. Click Save.
Testing the connection between the Hyper-V host and
Virtualization Manager
Testing the connection between the Hyper-V host and Virtualization Manager
ensures that Virtualization Manager can connect to and gather relevant data from
the Hyper-V host.
You can test the connection by creating a discovery job specifically for each
target Hyper-V host. Run the discovery job after each change to test the
connection.
Note: If you use different credentials for different hosts, you can request a domain
administrator account to perform these tests.
Adding a new discovery job
To add a new discovery job, perform the following steps:
1. Log on to Virtualization Manager as an administrator.
2. Navigate to Setup > Credentials.
3. Ensure that the correct Hyper-V credentials are entered. Each credential
must be added separately.
4. Navigate to Setup > Data Sources.
5. Click Add.
6. Click Add Hyper-V hosts.
285
Appendix A: Troubleshooting Hyper-V discovery
7. Enter a group name, and click Add Hosts.
8. Enter the IP address of the monitored Hyper-V host.
9. Click Save.
10. Click Save again to begin the first discovery job.
The first time you add the host, discovery runs automatically.
Running an existing discovery job
To run an existing discovery job, perform the following steps:
1. Navigate to Setup > Discovery Jobs.
2. Select the discovery job you made.
3. Click Run Now.
If Virtualization Manager can discover VMs, run the associated collection
schedule to begin the information gathering process.
This guide depicts the most common scenarios that can prevent data collection
by Virtualization Manager. If you are unable to start collecting data, see the
Microsoft articles about this topic.
286
Appendix B: Using PowerCLI
SolarWinds Virtualization Manager Power CLI enables you to leverage the power
of SolarWinds Virtualization Manager using Microsoft PowerShell. This section
contains information about the following:
l
Installing PowerShell
l
Cmdlets and scripts
l
Using cmdlets
Installing PowerShell
Download the PowerShell Client installer from the SolarWinds Customer Portal.
To download and install the PowerShell Client Installer:
1. Log on to the SolarWinds Customer Portal.
2. Under the Licensing & Maintenance tab, click License Management.
3. Select Virtualization Manager from the list of products, and then click
Choose download.
4. Download the PowerShell Client for Virtualization Manager from the Agent
Downloads section.
5. When the download is completed, install PowerCLI by double-clicking on
the installer file.
You can also install the VMware vSphere PowerCLI for additional functionality if
you want to take advantage of the integration of SolarWinds Virtualization
Manager and VMware. You can download the VMware vSphere PowerCLI from
the VMware website.
287
Appendix B: Using PowerCLI
When the installation is complete, select the SolarWinds Virtualization Manager
PowerCLI in the start menu (or on your desktop, or QuickLaunch bar if you
selected either of those options during installation), and double-click it.
The following sections detail some of the tasks you can accomplish by using
Microsoft PowerShell and SolarWinds Virtualization Manager.
Connecting to Virtualization Manager
To connect to your SolarWinds Virtualization Manager server, use the ConnectH9Server cmdlet. For example:
Connect-H9Server akutz-hyper9 admin admin
The preceding example creates a connection to the SolarWinds Virtualization
Manager server akutz-hyper9 using the credentials admin/admin.
Searching in Virtualization Manager
While you are connected to a SolarWinds Virtualization Manager instance, you
always have an active query. At first, the query is empty, and returns no results.
Run Set-H9Query to set your active query and return a set of results. For
example:
Set-H9Query * VirtualMachine
The preceding example sets your active query to all known virtual machines, and
returns the number of results found. The first parameter is a query, just like the
query you type into the search bar. The optional second parameter is the object
type. In addition to virtual machines, you can search for any managed object that
SolarWinds Virtualization Manager knows about. After defining the query, you
can view the results with the following command:
Show-H9Results 1 20
The preceding example prints a list of items 1 through 20 in the current search
result set.
All Virtualization Manager cmdlets are pipeline-aware. The following command
achieves the same result as the previous example:
Show-H9Results | Select-Object -first 20
288
Using configuration item references
Note: The parameters are optional, meaning that you can show all the items in
your result set. However, it can take a long time to display very large result sets.
Using configuration item references
Many of the operations you can perform with Virtualization Manager can involve
hundreds or even thousands of virtual machines, host computers, and so forth.
Because of this, most Virtualization Manager cmdlets accept and return
"configuration item references." These are pointers to the actual data stored by
SolarWinds Virtualization Manager.
To perform deep inspection of the actual data, use the Get-H9Doc cmdlet:
$xml = Get-H9Result 1 1 | Get-H9Doc
This returns an [xml] object, which can then be traversed and inspected:
PS C:\> $xml.virtualMachine.cpuAllocation
limit
reservation
shares
sharesLevel
-----
-----------
------
-----------
45351
0
500
low
Working with the vSphere PowerCLI
If your are working with both the vSphere and the SolarWinds Virtualization
Manager PowerShell snap-ins, for managed objects that SolarWinds
Virtualization Manager understands (virtual machines, host servers, clusters, data
stores, and applications), you can use the ConvertTo-H9Ref command to retrieve
a configuration item reference for a VMware object. For example:
Get-Vm | ConvertTo-H9Ref | Add-H9List
The previous command retrieves all known virtual machines through the vSphere
PowerCLI, converts each to a SolarWinds Virtualization Manager reference, and
then adds them to the active list.
Cmdlets and scripts
The SolarWinds Virtualization Manager PowerCLI contains several cmdlets that
provide access to a SolarWinds Virtualization Manager server.
289
Appendix B: Using PowerCLI
Use the Get-Command built-in cmdlet to retrieve SolarWinds Virtualization Manager
commands. You can also use the more precise Get-Command -pssnapin
Hyper9.Powershell.Core or the shortcut Get-Command *h9*.
For more information about a command, use the Get-Help built-in, or see Using
cmdlets.
The following product features are accessible through cmdlets:
l
Basic session management (Connect-H9Server, Disconnect-H9Server)
l
Basic collection setup (Add-H9Credential, Add-H9Datasource, GetH9Collector, Get-H9Credentials)
l
Search and facet browsing (Set-H9Query, Get-H9Result, Get-H9Facet)
l
Active list integration (Add-H9List, Set-H9List, Show-H9List, Clear-H9List)
l
Label management (Get-H9Label, Clear-H9Label, Set-H9Label)
l
Notes (Get-H9Note, New-H9Note)
l
Document DNA (Export-H9DNA)
l
Dependency graph browsing (Get-H9Related)
l
Retrieving and managing user content (Get-H9Content, Set-H9Content,
Remove-H9Content, Get-H9Report, Get-H9AlertRefs)
l
vSphere PowerCLI integration (ConvertTo-H9Ref)
l
Property (Get-H9Property, Set-H9Property)
l
Simple document management (Get-H9Doc, Get-H9History, Set-H9Doc)
For more information about the usage of cmdlets, see Using cmdlets.
Scripts
The SolarWinds Virtualization Manager PowerCLI contains PowerShell scripts
that can help you manage your virtual environment. Scripts are located in the
Scripts directory within the SolarWinds Virtualization Manager PowerCLI
directory. By default, this is C:\Program Files\Hyper9 VEO PowerCLI.
290
Scripts
- This script synchronizes the folder and resource pool hierarchy of a
VM along with the custom fields of both VMs and hosts to SolarWinds
Virtualization Manager labels.
vi2h9.ps1
291
Appendix B: Using PowerCLI
Using cmdlets
The following table provides information about the syntax and usage of cmdlets.
Area
Cmdlet
Description
Syntax
Example
Basic session management
ConnectH9Server
Establishes a connection
to the SolarWinds Virtualization Manager. This
step is necessary before
using any other cmdlets.
Connect-H9Server [-Server]
<String> [-User] <String> [Password] <String> [<CommonParameters>]
ConnectH9Server
akutz-hyper9
admin admin
DisconnectH9Server
Disconnects PowerCLI
from the SWVM server.
You must reconnect to
Disconnect-H9Server [<CommonParameters>]
DisconnectH9Server
Get-H9Credentials [-CType]
<CredentialType> [-Verbose] [Debug] [-ErrorAction
<ActionPreference>] [-WarningAction <ActionPreference>]
[-ErrorVariable <String>] [WarningVariable <String>] [OutVariable <String>] [-
Get-H9Credentials VirtualCenter
the server before executing any further cmdlets.
Basic collection setup
Get-H9Credentials
Lists the existing credentials. The available
credential types are VirtualCenter, Host, and
WMI.
292
Using cmdlets
Area
Cmdlet
Description
Syntax
Example
OutBuffer <Int32>]
Add-H9Credential [-Endpoint]
<CredentialType> [-User]
<String> [-Password] <String>
[[-Domain] <String>] [[Description] <String>] [<CommonParameters>]
Add-H9Credential
Adds a credential set for
data collection. The available credential types are
VirtualCenter, Host, and
WMI.
Get-H9Collector
Get-H9Collector [<ComRetrieves data collector
monParameters>]
instances. In a standard
environment, there will be
only one collector. In a
federated installation,
Add-H9Credential VirtualCenter
admin Admin321
testDomain
"Virtual
Center On
192.168.1.150"
Get-H9Collector
there will be several. Pair
this command with the
Add-H9Datasource cmdlet
to associate new data
sources with a specific
collector.
Add-H9Data-
Adds a server or Virtual
293
Add-H9Datasource [-Address]
<String> [[-Description]
$col = GetH9Collector
Appendix B: Using PowerCLI
Area
Search and
facet browsing
Cmdlet
Description
Syntax
Example
source
Center to the list of targets Virtualization Manager can collect against.
<String>] [[-Collector] <Collector>] [[-Port] <Int32>] [[UnmanagedHost]] [[-StartNow]]
[<CommonParameters>]
AddH9Datasource
192.168.1.150
"Virtual
Center on
192.168.1.150"
$col[0] 443
Set-H9Query
Sets or updates the active Set-H9Query [-Query] <String>
[[-CiType] <String>] [<Comquery. You can retrieve
monParameters>]
the items returned by the
active query with the GetH9Result cmdlet. The custom items are Virtual
Machine, Host, Datastore,
An active query
for all VMs: SetH9Query * VirtualMachine
and Cluster.
Get-H9Result
Returns the configuration Get-H9Result [[-Start]
<Int32>] [[-End] <Int32>]
item references in the cur- [<CommonParameters>]
rent active search. The
configuration items are
Query for configuration items
from the active
query with result
Virtual Machine, Host,
Datastore, and Cluster.
numbers starting with 10 and
294
Using cmdlets
Area
Cmdlet
Description
Syntax
To modify the active
search, use Set-H9Query.
Example
ending with
20: Get-H9Result 10 20
Active list
integration
Get-H9Facet
Get-H9Facet [[-Path] <String>]
Retrieves a list of facets
[<CommonParameters>]
for the active query. If a
facet path is specified, the
cmdlet retrieves the values for those facets.
Get-H9Facet
Add-H9List
Adds an item to the active Add-H9List [-CiRef] <ConAdding all hosts
figurationItemReference> [<Comlist. You can retrieve the
to the active list:
monParameters>]
Set-H9Query
contents of the active list
*Hosts
with the Show-H9List command.
Get-H9Result |
Add-H9List
Show-H9List
Returns configuration
item references for the
contents of the active list.
Show-H9List [<CommonParameters>]
Show-H9List
Set-H9List
If a saved list of content
objects is specified, the
Set-H9List [-List] <ConfigurationItemList> [<CommonParameters>]
Loading a
saved list, "VM
295
Appendix B: Using PowerCLI
Area
Cmdlet
Description
Syntax
cmdlet loads the list into
the active list. You can
retrieve the contents of
the active list with the
Show-H9List command.
Label management
Example
2008 list" to the
active list: GetH9Content
SavedList "VM
2008 list" |
Set-H9List
Clear-H9List
Removes all items from
the active list.
Clear-H9List [<CommonParameters>]
Clear-H9List
Set-H9Label
Applies a label to a configuration item (Virtual
Machine, Host, Datastore,
or Cluster). If the label
Set-H9Label [-Label] <String>
[-Value] <String> [-CiRef]
<ConfigurationItemReference>
[<CommonParameters>]
Adding the "OS"
label with the
value "Windows" to the vir-
key already exists, the
cmdlet overwrites the
value for the target object.
If the key does not exist,
the cmdlet creates the
key first.
tual machine
called "Virtual
Machine Test":
Set-H9Query
"Virtual
Machine Test"
VirtualMachine
$vm = GetH9Result
296
Using cmdlets
Area
Cmdlet
Description
Syntax
Example
Set-H9Label
"OS" "Windows"
$vm
Get-H9Label
Clear-H9Label
Returns a list of labels
and values for the specified configuration item
(Virtual Machine, Host,
Datastore, or Cluster) reference.
Get-H9Label [-CiRef] <ConfigurationItemReference> [<CommonParameters>]
Removes a label or all
labels from a configuration item (Virtual
Clear-H9Label [[-Label]
<String>] [-CiRef] <ConfigurationItemReference> [<CommonParameters>]
Retrieving the
labels from virtual machines
that are saved in
the $vm variable:
Get-H9label$vm
Machine, Host, Datastore,
or Cluster).
Removing the
label "OS"
saved in the $vm
variable from
the virtual
machine: ClearH9Label "OS"
$vm
Notes
New-H9Note
Creates a new note for
the specified configuration item references
297
[-Text] <String> [-CiRef] <ConfigurationItemReference> [<CommonParameters>]
Adding the note
"Testing note" to
the virtual
Appendix B: Using PowerCLI
Area
Cmdlet
Description
Syntax
(Virtual Machine, Host,
Datastore, or Cluster).
Example
machine saved
in the $vm variable: NewH9Note"Testing
note" $vm
Get-H9Note
Retrieves notes for the
specified configuration
items (Virtual Machine,
Host, Datastore, or
Cluster).
Get-H9Note [-CiRef] <ConfigurationItemReference> [<CommonParameters>]
Retrieving notes
for the virtual
machine saved
in the $vm
variable: GetH9Note $vm
Document
Export-
Performs an on-demand
DNA
H9DNA
DNA diff of two hosts, two
VMs, or one host and VM
over time.
Export-H9DNA [-LeftCi] <ConfigurationItemReference> [RightCi] <ConfigurationItemReference> [[LeftDate] <DateTime>] [[RightDate] <DateTime>] [<CommonParameters>]
Retrieving the
differences of
two VMs saved
in the $vm and
$vm1 variables:
ExportH9DNA$vm $vm1
Dependency Getgraph brows- H9Related
Returns a list of related
configuration items of the
298
Get-H9Related [-RelatedType]
<ConfigurationItemType> [CiRef] <Con-
l
Retrieving
Using cmdlets
Area
ing
Cmdlet
Description
Syntax
Example
figurationItemReference> [<Comspecified type (Virtual
monParameters>]
Machine, Host, Datastore,
Cluster). The related
types are the following:
the host
where the
virtual
machine
from the
l
0: Virtual Machine
l
1: Host
$vm
l
2: Cluster
variable is
hosted:
l
3: Datastore
GetH9Related
1 $vm
l
Retrieving
the list of
VMs
hosted by
the host
from the
$hst
variable:
GetH9Related
299
Appendix B: Using PowerCLI
Area
Cmdlet
Description
Syntax
Example
0 $hst
Retrieving
and managing user
content
Get-H9Content
Retrieves content items
from SolarWinds Virtualization Manager
(alerts, saved searches,
lists, trends, and so on).
Get-H9Content [[-WsType] <WorkspaceAssetType>] [[-Name]
<String>] [[-OnlyMine]] [<CommonParameters>]
The Workspace Asset Types are
the following:
Retrieving the
list of saved lists
whose name
includes the
string "2008":
Get-H9Content
Set-H9Con-
l
0: ExportTemplate
l
1: ReportOutput
l
2: SavedList
l
3: SavedSearch
l
4: Alert
l
5: Trend
l
6: Dashboard
l
7: ResourceContainer
l
8: ResourceUsageProfile
Set-H9Content [-Asset]
Paired with the Get-
300
2 "2008"
Using cmdlets
Area
Cmdlet
Description
Syntax
tent
<AbstractWorkspaceAsset> [<ComH9Content cmdlet, this
monParameters>]
command makes
changes to content stored
by SolarWinds Virtualization Manager.
RemoveH9Content
Removes content items
from SolarWinds Virtualization Manager.
Remove-H9Content [-Asset]
<AbstractWorkspaceAsset> [<CommonParameters>]
Get-H9Report
Given a ReportOutput
content item, the cmdlet
downloads the related
Get-H9Report [-Report]
<ReportOutput> [<CommonParameters>]
Example
report, using the [report
name].[extension] format.
The cmdlet writes the
files to the current working directory.
Get-H9AlertRefs
Retrieves configuration
item references (Virtual
301
Get-H9AlertRefs [-Alert]
<Alert> [<CommonParameters>]
$alarm = GetH9Content 4
"High VM
Memory Util-
Appendix B: Using PowerCLI
Area
Cmdlet
Description
Syntax
ization"
Machine, Host, Datastore,
or Cluster) associated
with a currently firing
alert. The command
retrieves only the items
associated with the most
current execution of the
alert.
vSphere
PowerCLI
integration
ConvertToH9Ref
Converts a VI PowerCLI
object to a SolarWinds
Virtualization Manager
GetH9Alertrefs
$alarm
ConvertTo-H9Ref [-Target]
<Object> [<CommonParameters>]
item reference. The cmdlet works on virtual
machines, hosts, clusters,
data stores, and vapps.
Property
Get-H9Property [-PropertyGroupName] <String> [-PropertyName] <String> [-Verbose]
[-Debug] [ErrorAction
<ActionPreference>] [-WarningAction <ActionPreference>]
Get-H9Property
302
Example
Using cmdlets
Area
Cmdlet
Description
Syntax
Example
[-ErrorVariable <String>]
[WarningVariable <String>] [OutVariable <String>] [OutBuffer <Int32>]
Set-H9Property [-PropertyGroupName] <String> [-PropertyName] <String> [-Value]
<String> [-Verbose] [Debug] [ErrorAction <ActionPreference>] [-WarningAction
<ActionPreference>] [ErrorVariable <String>] [-WarningVariable <String>] [OutVariable <String>] [OutBuffer <Int32>]
Set-H9Property
Simple doc-
Get-H9Doc
ument management
Retrieves shallow documents for the specified
configuration item references. Shallow documents are documents
which do not contain
child documents.
Get-H9History
Get-H9Doc [-CiRef] <ConSet-H9Query
figurationItemReference> [<Com- "Virtual
monParameters>]
Machine test"
VirtualMachine
$vm = GetH9Result
Get-H9doc $vm
Get-H9History [[-Start]
<DateTime>] [[-End]
Retrieves all the con-
303
Appendix B: Using PowerCLI
Area
Cmdlet
Description
Syntax
figuration documents,
stored between the specified dates.
<DateTime>] [[-CiRef] <ConfigurationItemReference>]
[<CommonParameters>]
304
Example
Appendix C: Using Perl SDK
If you do not already have Perl, download and install it. For Windows systems, we
recommend using ActiveState's ActivePerl 5.16.
Module installations
The Perl Client ::Client module requires SOAP::Lite.
To install SOAP::Lite on Linux or Mac versions of Perl, run the following
command:
sudo cpan install SOAP::Lite
To install SOAP::Lite on Windows using ActivePerl 5.16, run the following
command:
ppm install http://ppm4.activestate.com/MSWin32x64/5.16/1603/P/PH/PHRED/SOAP-Lite-1.11.ppmx
Downloading the Perl Client
Download the Perl Client installer from the SolarWinds Customer Portal:
1. Log on to the SolarWinds Customer Portal.
2. Under the Licensing & Maintenance tab, click License Management.
3. Select Virtualization Manager from the list of products, and then click
Choose download.
4. Download the Perl Client for Virtualization Manager from the Agent
Downloads section.
This .zip file includes the Perl Client module (Hyper9::Client) and also a few
example scripts. Extract the archive in a place where you will be running your
scripts from.
305
Appendix C: Using Perl SDK
Using the Perl Client
The Perl Client module (Hyper9::Client) contains some inline POD (plain old
documentation). To view the POD, navigate to the place where you extracted the
Perl SDK archive and type the following command:
Perldoc Hyper9/Client.pm
Writing your first script
This example walks you through writing a script that executes a search for VMs
that are configured for less than 1 GB RAM, pulls out the configuration model for
each of those VMs, and prints the memory size and name of the VM.
1. Create a new file called searchMemory.pl and open the file for editing.
2. Set up the proper imports:
use strict;
use Hyper9::Client;
use XML::Simple;
use Data::Dumper;
my $pageSize = 20;
my $total = 0;
3. Set up your script with a Hyper9::Client reference and use it to log in. You
must substitute the host address and credentials in the setup of the client. In
the following example, it is configured to log in to a SolarWinds
Virtualization Manager server found at localhost using the admin/admin
credentials.
my $client = Hyper9::Client->new(
username => 'admin',
password => 'admin',
host
=> 'VirtualizationManagerHostnameOr',
);
$client->login() || die "Login failed\n\n";
4. Use the $client variable to run any of the web service operations. For a
complete list of operations along with their inputs and outputs, visit
http://your-server:8983/swvm/ws/hyper9.wsdl. To execute the search
operation, insert the following code into your script:
306
Writing your first script
# Search for VMs configured with less than 1GB memory and retrieve
their total
# memory and memory usage at the same time
my @results = $client->searchCustom(
ciType => 'VirtualMachine',
query => 'vm.memory:[0 TO 1023]',
pageData => {
pageSize => $pageSize,
pageNumber => 1,
},
sort =>{
sortField => 'vm.memory',
sortDescending => 0,
},
paths => ['vm.memory', 'vm.memload.latest'], # these show up in
'values' on the result
);
The result of the search call is placed into an array called @results.
5. Insert the following code into the script to iterate the result items that are
VMs and print out how much memory they actually have:
# Print out the names of the VMs and their memory size, tab
delimited
print "------------------------------------\n";
print "Memory\tUsed\tVM Name\n";
print "------------------------------------\n";
foreach my $result (@results) {
if (defined $result->{ciRef}) {
my $memory = $result->{'values'}[0]->{'value'};
my $memoryUtil = $result->{'values'}[1]->{'value'};
$memoryUtil = int($memoryUtil) if $memoryUtil;
print $memory."MB\t".$memoryUtil."%\t".$result->{ciRef}->
{displayName}."\n";
}
elsif (defined $result->{'total'})
{
$total = $result->{'total'};
}
}
print "....Showing $pageSize of $total\n";
307
Appendix C: Using Perl SDK
6. Insert the following code into the script to log out:
$client->logout();
7. Save the searchMemory.pl file and run it using perl searchMemory.pl. The
result should look something like the following:
ryankruse$ ./searchExample.pl
512MB Sarasota
768MB Jacksonville
256MB Natchitoches Parish
768MB Apalachicola
256MB Inx Lake
512MB Reunion Arena
512MB Ubuntu 64 bit
256MB Johnson Space Center
256MB Insta-Gator Ranch
768MB Clearwater
512MB Dixie Landing
512MB Lafayette
512MB Odessa
512MB River Ranch
Scripting tips
Whenever you receive a response from a Hyper9::Client call, you can place it
directly into an array or a simple scalar, depending on what the web service call
sends in its response.
Accepting a response into a scalar:
my $response = $client->methodThatReturnsSingleThing();
Accepting a response into an array:
my @response = $client->methodThatReturnsMultipleThings();
If you are not sure of the structure of the response variable, use the Data::Dumper
module in Perl for an exhaustive printout of the data structure. The Data::Dumper
is one of the most valuable modules when using the Hyper9::Client so use it often
while developing your scripts:
use Data::Dumper; print Dumper(@response);
Using the provided example
searchExample.pl
308
Using the provided example
The search example used previously is also provided in the Perl SDK .zip file,
where it is called searchExample.pl.
309