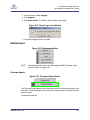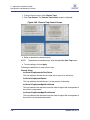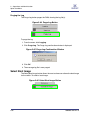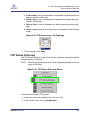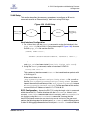
1
SilverStorm 9000 Users Guide D000003-016 Rev A S Information furnished in this manual is believed to be accurate and reliable. However, QLogic Corporation assumes no responsibility for its use, nor for any infringements of patents or other rights of third parties which may result from its use. QLogic Corporation reserves the right to change product specifications at any time without notice. Applications described in this document for any of these products are for illustrative purposes only. QLogic Corporation makes no representation nor warranty that such applications are suitable for the specified use without further testing or modification. QLogic Corporation assumes no responsibility for any errors that may appear in this document. Document Revision History Revision A, July 8, 2008 Changes Sections Affected © 2008 QLogic Corporation. All Rights Reserved Worldwide. First Published: September 2007 QLogic Corporation, 26650 Aliso Viejo Parkway, Aliso Viejo, CA 92656, (800) 662-4471 or (949) 389-6000 Page ii D000003-016 Rev A Table of Contents 1 Introduction Intended Audience . . . . . . . . . . . . . . . . . . . . . . . . . . . . . . . . . . . . . . . . . . . . License Agreements. . . . . . . . . . . . . . . . . . . . . . . . . . . . . . . . . . . . . . . . . . . Technical Support. . . . . . . . . . . . . . . . . . . . . . . . . . . . . . . . . . . . . . . . . . . . . Availability . . . . . . . . . . . . . . . . . . . . . . . . . . . . . . . . . . . . . . . . . . . . . . Contact Information . . . . . . . . . . . . . . . . . . . . . . . . . . . . . . . . . . . . . . . 2 1-1 1-1 1-2 1-2 1-2 Operations and Administration Chassis Viewer. . . . . . . . . . . . . . . . . . . . . . . . . . . . . . . . . . . . . . . . . . . . . . . Home Page . . . . . . . . . . . . . . . . . . . . . . . . . . . . . . . . . . . . . . . . . . . . . Displaying the Chassis View . . . . . . . . . . . . . . . . . . . . . . . . . . . . . . . . Displaying the Leaf/VIO and Spine Module Views . . . . . . . . . . . . . . . Leaf Module View . . . . . . . . . . . . . . . . . . . . . . . . . . . . . . . . . . . . VIO Module View . . . . . . . . . . . . . . . . . . . . . . . . . . . . . . . . . . . . Spine Module View . . . . . . . . . . . . . . . . . . . . . . . . . . . . . . . . . . . Component Details Area . . . . . . . . . . . . . . . . . . . . . . . . . . . . . . . . . . . Details Header . . . . . . . . . . . . . . . . . . . . . . . . . . . . . . . . . . . . . . Modifying Switch Component Information . . . . . . . . . . . . . . . . . Chassis View Component Information Area Tabs . . . . . . . . . . . Configuration and Monitoring Features . . . . . . . . . . . . . . . . . . . . . . . . . . . . Chassis View Menu . . . . . . . . . . . . . . . . . . . . . . . . . . . . . . . . . . . . . . . Logging . . . . . . . . . . . . . . . . . . . . . . . . . . . . . . . . . . . . . . . . . . . . . . . . Set Level. . . . . . . . . . . . . . . . . . . . . . . . . . . . . . . . . . . . . . . . . . . Reset Log Levels . . . . . . . . . . . . . . . . . . . . . . . . . . . . . . . . . . . . Maintenance . . . . . . . . . . . . . . . . . . . . . . . . . . . . . . . . . . . . . . . . . . . . Firmware Update . . . . . . . . . . . . . . . . . . . . . . . . . . . . . . . . . . . . LDAP Configuration. . . . . . . . . . . . . . . . . . . . . . . . . . . . . . . . . . . . . . . HTTP/CLI Session Configuration . . . . . . . . . . . . . . . . . . . . . . . . . . . . SNMP . . . . . . . . . . . . . . . . . . . . . . . . . . . . . . . . . . . . . . . . . . . . . . . . . Target Configuration . . . . . . . . . . . . . . . . . . . . . . . . . . . . . . . . . . Filter Status. . . . . . . . . . . . . . . . . . . . . . . . . . . . . . . . . . . . . . . . . Set Community Strings . . . . . . . . . . . . . . . . . . . . . . . . . . . . . . . . D000003-016 Rev A 2-1 2-2 2-4 2-5 2-5 2-6 2-7 2-8 2-8 2-9 2-11 2-15 2-15 2-15 2-15 2-19 2-20 2-20 2-21 2-22 2-24 2-25 2-29 2-30 Page iii S Configuration File Administration. . . . . . . . . . . . . . . . . . . . . . . . . . . . . Administer. . . . . . . . . . . . . . . . . . . . . . . . . . . . . . . . . . . . . . . . . . Host Upload/Download . . . . . . . . . . . . . . . . . . . . . . . . . . . . . . . . Trap Control . . . . . . . . . . . . . . . . . . . . . . . . . . . . . . . . . . . . . . . . Chassis Traps . . . . . . . . . . . . . . . . . . . . . . . . . . . . . . . . . . . . . . . . . . . Port Statistics. . . . . . . . . . . . . . . . . . . . . . . . . . . . . . . . . . . . . . . . . . . . Port Statistics Field Descriptions . . . . . . . . . . . . . . . . . . . . . . . . Leaf and Spine Module IB Port Statistics . . . . . . . . . . . . . . . . . . Leaf Modules . . . . . . . . . . . . . . . . . . . . . . . . . . . . . . . . . . . . . . . Spine Modules . . . . . . . . . . . . . . . . . . . . . . . . . . . . . . . . . . . . . . Set Field Thresholds. . . . . . . . . . . . . . . . . . . . . . . . . . . . . . . . . . Time Service . . . . . . . . . . . . . . . . . . . . . . . . . . . . . . . . . . . . . . . . . . . . Configuring the Switch OOB IP Address . . . . . . . . . . . . . . . . . . . . . . . Configuring the Switch Default Gateway IP Address . . . . . . . . . . . . . Fabric Manager Configuration . . . . . . . . . . . . . . . . . . . . . . . . . . . . . . . Automatically starting the Fabric Manager . . . . . . . . . . . . . . . . . The sm_query Application . . . . . . . . . . . . . . . . . . . . . . . . . . . . . . . . . . Installing sm_query from an Embedded Product CD . . . . . . . . . Running sm_query Quick Start . . . . . . . . . . . . . . . . . . . . . . . . . . Running sm_query . . . . . . . . . . . . . . . . . . . . . . . . . . . . . . . . . . . Spine View Menu . . . . . . . . . . . . . . . . . . . . . . . . . . . . . . . . . . . . . . . . . . . . . Logging . . . . . . . . . . . . . . . . . . . . . . . . . . . . . . . . . . . . . . . . . . . . . . . . Viewing the Log . . . . . . . . . . . . . . . . . . . . . . . . . . . . . . . . . . . . . Purging the Log . . . . . . . . . . . . . . . . . . . . . . . . . . . . . . . . . . . . . Select Boot Image . . . . . . . . . . . . . . . . . . . . . . . . . . . . . . . . . . . . . . . . Fabric Manager Control. . . . . . . . . . . . . . . . . . . . . . . . . . . . . . . . . . . . Accessing the Subnet Manager Control Window . . . . . . . . . . . . License Keys; Key Administration . . . . . . . . . . . . . . . . . . . . . . . . . . . . Adding a New License Key. . . . . . . . . . . . . . . . . . . . . . . . . . . . . Deleting a License Key . . . . . . . . . . . . . . . . . . . . . . . . . . . . . . . . 3 FVIC Configuration and Monitoring Features Logging. . . . . . . . . . . . . . . . . . . . . . . . . . . . . . . . . . . . . . . . . . . . . . . . . . . . . Set Level . . . . . . . . . . . . . . . . . . . . . . . . . . . . . . . . . . . . . . . . . . . . . . . Preset Tab . . . . . . . . . . . . . . . . . . . . . . . . . . . . . . . . . . . . . . . . . Reset Log Levels. . . . . . . . . . . . . . . . . . . . . . . . . . . . . . . . . . . . . . . . . Purging the Log . . . . . . . . . . . . . . . . . . . . . . . . . . . . . . . . . . . . . . . . . . Maintenance. . . . . . . . . . . . . . . . . . . . . . . . . . . . . . . . . . . . . . . . . . . . . . . . . Select Boot Image . . . . . . . . . . . . . . . . . . . . . . . . . . . . . . . . . . . . . . . . Fibre Channel Configuration . . . . . . . . . . . . . . . . . . . . . . . . . . . . . . . . . . . . Page iv 2-31 2-32 2-33 2-35 2-36 2-39 2-40 2-43 2-43 2-44 2-45 2-47 2-50 2-51 2-51 2-52 2-52 2-53 2-53 2-54 2-56 2-56 2-57 2-58 2-58 2-60 2-60 2-62 2-62 2-63 3-2 3-3 3-6 3-7 3-7 3-9 3-9 3-11 D000003-016 Rev A A FCP Port Configuration . . . . . . . . . . . . . . . . . . . . . . . . . . . . . . . . . . . . FCP Device Discovery. . . . . . . . . . . . . . . . . . . . . . . . . . . . . . . . . . . . . SRP Initiator Discovery and Configuration . . . . . . . . . . . . . . . . . . . . . SRP Map Configuration. . . . . . . . . . . . . . . . . . . . . . . . . . . . . . . . . . . . Deleting a Configured Map . . . . . . . . . . . . . . . . . . . . . . . . . . . . . Fibre Channel Virtual Port Configuration. . . . . . . . . . . . . . . . . . . . . . . Removing the Virtual Port Pool. . . . . . . . . . . . . . . . . . . . . . . . . . Statistics . . . . . . . . . . . . . . . . . . . . . . . . . . . . . . . . . . . . . . . . . . . . . . . InfiniBand Port Statistics . . . . . . . . . . . . . . . . . . . . . . . . . . . . . . . . . . . Port Statistics Field Descriptions . . . . . . . . . . . . . . . . . . . . . . . . InfiniBand Statistics: . . . . . . . . . . . . . . . . . . . . . . . . . . . . . . . . . . FCP Target Device Statistics . . . . . . . . . . . . . . . . . . . . . . . . . . . . . . . . SRP Initiator Statistics . . . . . . . . . . . . . . . . . . . . . . . . . . . . . . . . . . . . . Fibre Channel Port Statistics . . . . . . . . . . . . . . . . . . . . . . . . . . . . . . . . Fibre Channel Trap Control . . . . . . . . . . . . . . . . . . . . . . . . . . . . . . . . . 4 3-11 3-13 3-16 3-21 3-23 3-26 3-28 3-29 3-29 3-30 3-31 3-33 3-35 3-36 3-38 EVIC Configuration and Monitoring Features Logging. . . . . . . . . . . . . . . . . . . . . . . . . . . . . . . . . . . . . . . . . . . . . . . . . . . . . Set Level . . . . . . . . . . . . . . . . . . . . . . . . . . . . . . . . . . . . . . . . . . . . . . . Preset Tab . . . . . . . . . . . . . . . . . . . . . . . . . . . . . . . . . . . . . . . . . Reset Log Levels. . . . . . . . . . . . . . . . . . . . . . . . . . . . . . . . . . . . . . . . . Purging the Log . . . . . . . . . . . . . . . . . . . . . . . . . . . . . . . . . . . . . . . . . . Maintenance. . . . . . . . . . . . . . . . . . . . . . . . . . . . . . . . . . . . . . . . . . . . . . . . . Select Boot Image . . . . . . . . . . . . . . . . . . . . . . . . . . . . . . . . . . . . . . . . Configuration . . . . . . . . . . . . . . . . . . . . . . . . . . . . . . . . . . . . . . . . . . . . . . . . Virtual NIC Information . . . . . . . . . . . . . . . . . . . . . . . . . . . . . . . . . . . . 4-2 4-3 4-6 4-7 4-7 4-8 4-8 4-9 4-10 Configure Pause . . . . . . . . . . . . . . . . . . . . . . . . . . . . . . . . . . . . . . . . Configure MTU Size . . . . . . . . . . . . . . . . . . . . . . . . . . . . . . . . . . . . . . ViPort Count Configuration . . . . . . . . . . . . . . . . . . . . . . . . . . . . . . . . . VLAN Configuration. . . . . . . . . . . . . . . . . . . . . . . . . . . . . . . . . . . . . . . Port Type: Ethernet. . . . . . . . . . . . . . . . . . . . . . . . . . . . . . . . . . . Port Type: Host . . . . . . . . . . . . . . . . . . . . . . . . . . . . . . . . . . . . . . VLAN Configuration Example . . . . . . . . . . . . . . . . . . . . . . . . . . . VLAN Setup . . . . . . . . . . . . . . . . . . . . . . . . . . . . . . . . . . . . . . . . Alternative VLAN Setup . . . . . . . . . . . . . . . . . . . . . . . . . . . . . . . Link Aggregation . . . . . . . . . . . . . . . . . . . . . . . . . . . . . . . . . . . . . . . . . Maximum Packet Age . . . . . . . . . . . . . . . . . . . . . . . . . . . . . . . . . . . . . Port Mirroring. . . . . . . . . . . . . . . . . . . . . . . . . . . . . . . . . . . . . . . . . . . . 4-12 4-13 4-14 4-15 4-15 4-17 4-20 4-21 4-23 4-24 4-26 4-26 D000003-016 Rev A Page v S Statistics . . . . . . . . . . . . . . . . . . . . . . . . . . . . . . . . . . . . . . . . . . . . . . . . . . . . InfiniBand Port Statistics . . . . . . . . . . . . . . . . . . . . . . . . . . . . . . . . . . . InfiniBand Statistics: . . . . . . . . . . . . . . . . . . . . . . . . . . . . . . . . . . Port Configuration and Statistics . . . . . . . . . . . . . . . . . . . . . . . . . . . . . A Troubleshooting and Technical Reference Hardware Checks. . . . . . . . . . . . . . . . . . . . . . . . . . . . . . . . . . . . . . . . . . . . . Switch . . . . . . . . . . . . . . . . . . . . . . . . . . . . . . . . . . . . . . . . . . . . . . . . . Power Supply . . . . . . . . . . . . . . . . . . . . . . . . . . . . . . . . . . . . . . . . . . . Fan . . . . . . . . . . . . . . . . . . . . . . . . . . . . . . . . . . . . . . . . . . . . . . . . . . . OOB Ethernet RJ45 Port . . . . . . . . . . . . . . . . . . . . . . . . . . . . . . . . . . . Leaf Module IB Ports . . . . . . . . . . . . . . . . . . . . . . . . . . . . . . . . . . . . . . Troubleshooting Scenarios. . . . . . . . . . . . . . . . . . . . . . . . . . . . . . . . . . . . . . InfiniBand. . . . . . . . . . . . . . . . . . . . . . . . . . . . . . . . . . . . . . . . . . . . . . . Invalid IP Address entered via Console Port . . . . . . . . . . . . . . . Nodes cannot be seen in SilverStorm Fabric Viewer . . . . . . . . . Page vi 4-28 4-28 4-30 4-31 A-1 A-1 A-1 A-2 A-2 A-2 A-3 A-3 A-3 A-3 D000003-016 Rev A 1 Introduction This manual describes the configuration and administration tasks for the SilverStorm™ 9000 series, which includes: The SilverStorm 9024 24-port InfiniBand switch The SilverStorm Multi-Protocol Fabric Director (MPFD) series: SilverStorm 9020 SilverStorm 9040 SilverStorm 9080 SilverStorm 9120 SilverStorm 9240 This manual is organized as follows: Section 1 describes the intended audience and technical support. Section 2 describes all 9000 switch-related configuration and administration tasks. Section 3 describes all tasks related to the SilverStorm™ FibreChannel Virtual I/O Card (FVIC). Section 4 describes all tasks related to the SilverStorm™ Ethernet Virtual I/O Card (EVIC). Appendix A provides troubleshooting information. Intended Audience This manual is intended to provide network administrators and other qualified personnel a reference for configuration and administration task information for the switches. License Agreements Refer to the QLogic Software End User License Agreement for a complete listing of all license agreements affecting this product. D000003-016 Rev. A 1-1 S 1 – Introduction Technical Support Technical Support Customers should contact their authorized maintenance provider for technical support of their QLogic switch products. QLogic-direct customers may contact QLogic Technical Support; others will be redirected to their authorized maintenance provider. Visit the QLogic support Web site listed in Contact Information for the latest firmware and software updates. Availability QLogic Technical Support for products under warranty is available during local standard working hours excluding QLogic Observed Holidays. Contact Information Support Headquarters QLogic Corporation 4601 Dean Lakes Blvd. Shakopee, MN 55379 USA QLogic Web Site www.qlogic.com Technical Support Web Site support.qlogic.com Technical Support Email [email protected] Technical Training Email [email protected] North American Region Email [email protected] Phone +1-952-932-4040 Fax +1 952-687-2504 All other regions of the world QLogic Support Web Site 1-2 www.support.qlogic.com D000003-016 Rev. A 2 Operations and Administration Chassis Viewer Chassis Viewer is SilverStorm™ browser-based device management software. Chassis Viewer provides the primary management interface for the SilverStorm 9000 switches, allowing the user to perform management, configuration, and monitoring tasks related to InfiniBand networks. • Chassis Viewer runs on the Chassis Management Unit (CMU) of the 9024 and each managed spine/management module of the MPFD series (9020, 9040, 9080, 9120 and 9240). • The browser must be on a workstation which has connectivity to the RJ-45 OOB LAN port on the switch. • Management Workstation Requirements • Browser Level: Internet Explorer 6.0+ or Mozilla 1.6.x+ • To access Chassis Viewer, point a browser to the IP address of the switch. • If user authentication is enabled, the following screen is displayed: Figure 2-1 User Authentication • Enter the default user name and password: D000003-016 Rev. A Username: admin 2-1 S 2 – Operations and Administration Chassis Viewer Password: adminpass The Chassis Viewer home page is displayed. The Chassis Viewer manages: • The switch chassis. • Each MPFD leaf module. • Each MPFD virtual I/O (VIO) hardware device. • Each MPFD spine module. • Logging and monitoring functionality. Home Page Figure 2-2 SilverStorm 9024 Home Page Figure 2-3 SilverStorm 9240 Lower Hemisphere Home Page Chassis Viewer’s home page provides a high-level overview of the switch. This area is the starting point to more detailed information for the chassis and components (fans and power supplies), leaf modules, and spine modules. The selected 2-2 D000003-016 Rev. A A 2 – Operations and Administration Chassis Viewer component provides hyperlinks to related menus and information where the user can perform configuration and monitoring tasks. Figure 2-4 Help Button The ? (HELP) button displays online help. Each help screen gives the user a high-level, topic-specific description. Figure 2-5 Support Button The Support button displays key contact information for support, displayed in the following window: Figure 2-6 Support Contact Screen D000003-016 Rev. A 2-3 2 – Operations and Administration Chassis Viewer S Displaying the Chassis View There are two ways to display the chassis view for the MPFD switches: 1. Mouse over the outer region of the leaf/VIO module view. The edges of the chassis are highlighted green as shown in Figure 2-7 below: Figure 2-7 Leaf/VIO Module Chassis Mouseover Click the mouse. The chassis view will be displayed. 2. The second way is to mouse over the outer region of the spine module view. The edges of the chassis are highlighted green as shown in Figure 2-8 below: Figure 2-8 Spine Module Chassis Mouseover 2-4 D000003-016 Rev. A A 2 – Operations and Administration Chassis Viewer Click the mouse. The chassis view will be displayed. Figure 2-9 9240 Chassis View Displaying the Leaf/VIO and Spine Module Views Leaf Module View To display the leaf module views: 1. Mouse over the leaf module to display. The edges of the leaf module are highlighted green as shown in Figure 2-10 below: Figure 2-10 Leaf Module Mouseover D000003-016 Rev. A 2-5 2 – Operations and Administration Chassis Viewer S Click the mouse. The leaf module view will be displayed. Figure 2-11 Leaf Module View VIO Module View To display the VIO module views: 1. Mouse over the VIO module to display. The edges of the VIO module are highlighted green as shown in Figure 2-12 below: Figure 2-12 VIO Module Mouseover Click the mouse. The VIO module view will be displayed. Figure 2-13 VIO Module View 2-6 D000003-016 Rev. A A 2 – Operations and Administration Chassis Viewer Spine Module View To display the spine module view: 1. Mouse over the spine module to display. The edges of the spine module are highlighted green as shown in Figure 2-14 below: Figure 2-14 Spine Module Mouseover Click the mouse. The spine module view is displayed. Figure 2-15 Spine Module View D000003-016 Rev. A 2-7 S 2 – Operations and Administration Chassis Viewer Component Details Area The Component Details Area for the chassis, spine and leaf/VIO has three areas. • Details Header • Information area. • Menu Figure 2-16 Component Details Area Details Header Figure 2-17 Details Header The Details Header allows the user to execute command tasks for each hardware component. The graphic above displays the Details Header. All component Details Headers contain the following buttons: • Logout NOTE: The Logout button is only displayed if the user has set the User Authentication parameter to Login Enabled through the HTTP Session Configuration submenu. Refer to “HTTP/CLI Session Configuration” on page 2-23 for more information. • View Field Replaceable Unit (FRU) Information. • Reboot Figure 2-18 Leaf/VIO and Spine Information Area 2-8 D000003-016 Rev. A A 2 – Operations and Administration Chassis Viewer The Leaf/VIO and Spine Information Area allows the user to view high-level information for each specific leaf or spine module. The information area is comprised of fields that are tied to live data from the selected hardware component as well as live system information. Additionally, the Component Information Area has Apply and Refresh buttons, which perform the following functionality: Apply: Saves any user edits within the white fields to flash memory. Refresh: Refreshes all fields in the information areas. Figure 2-19 Chassis View Component Information Area The Chassis View Component Information Area allows the user to monitor important information for each specific hardware component, as well as important system information. The information area is comprised of two different fields: • The white fields allow the user to add or modify applicable general and system information which is specific to their environment. • The gray fields are tied to live data from the selected hardware component as well as live system information. Modifying Switch Component Information Following is the procedure for modifying the fields for switch components: 1. Select the applicable tab; LED and Sensors, System, Chassis FRU, Power, Fan, or Backplane. 2. Click on the row to be modified. 3. In the text boxes, enter information which is applicable to the existing network environment. D000003-016 Rev. A 2-9 S 2 – Operations and Administration Chassis Viewer 4. To save, click the Apply button at the bottom of the screen. Figure 2-20 System Information Area Rebooting the 9024 Switch 1. From the Chassis Details Header, click Reboot. The following window is displayed. Figure 2-21 Reboot Window 2. Click OK. Rebooting the MPFD switches using Chassis Viewer 1. From either the Details header of the Chassis Viewer home page or the chassis view Maintenance submenu, click Reboot. A screen similar to the following screen is displayed (9240 shown): Figure 2-22 Reboot Screen 2. Select the radio button of the spine(s) to be rebooted, or select the Reboot Entire Hemisphere radio button to reboot the applicable hemisphere and all spines. 3. Click Reboot. 2-10 D000003-016 Rev. A A 2 – Operations and Administration Chassis Viewer Rebooting Multiple Managed Spines using the CLI In a redundant management configuration (9080, 9120 and 9240) it may occasionally be necessary for the user to reboot both managed spines in a hemisphere. This is accomplished through the CLI of the master spine. 1. Access the master spine CLI via Telnet, SSH, or through the switch RS232 serial ports. 2. The system prompts for a user name. At the prompt enter: admin 3. The system prompts for a password. At the prompt enter: adminpass The system responds with: Welcome to the <SWITCH> CLI. Type 'list' for the list of commands. 4. To reboot multiple spines enter the following command: reboot now -m -n where: • now initiates the reboot process as soon as the user presses Enter (i.e., no system y/n prompt). • -m reboots just the management card of the master spine. This is a non-disruptive reboot (i.e., the reboot will not interfere with any switch traffic). • -n reboots just the management card of the slave spine (in a non-disruptive manner). NOTE: If accessing the CLI through Telnet or SSH, the user will need to reconnect to the CLI following the reboot. Chassis View Component Information Area Tabs The tabs along the top of the information area present information about the following components: • LED and sensor information • Overall system information • Switch Field Replaceable Unit (FRU) Information • Power supply information • Fan information • Switch backplane information LEDs and Sensors Tab The LEDs and Sensors tab displays for the applicable hemisphere: D000003-016 Rev. A 2-11 2 – Operations and Administration Chassis Viewer S • Switch component LED information for chassis status, chassis SMA, fan and power supplies. • Slot-based temperature and AC-power sensor data for the internal switching complex. Figure 2-23 LEDs and Sensors Tab NOTE: For a detailed explanation of physical LEDs on the hardware components, please refer to the section “9120 Component LEDs” on page 2-20. System Tab The System tab displays overall system information for the applicable hemisphere. This information includes the following items: Out of Band LAN IP The IP address of the switch. Note that changes to this field only take effect after a switch power cycle (i.e., shutting down the switch and powering it back up). The IP address of the switch can be changed by the administrator. Net Mask The current net mask settings for the Chassis. Note that changes to this field only take effect after a chassis power cycle (i.e., shutting down the chassis and powering it back up). The net mask of the chassis can be changed by the administrator. System Description A read-only textual description of the system. IB Node Description Assigned by the administrator, the IB node description is an IB fabric-applicable name that will be displayed within QuickSilver Fabric Viewer. Note that changes to this field will only take effect after the chassis is rebooted. To reset this field to the default setting, click the Field Default button. 2-12 D000003-016 Rev. A A 2 – Operations and Administration Chassis Viewer NOTE: If the IB Node Description field has been changed since the last reboot of either spine, the next reboot will be treated as disruptive. System Uptime The elapsed time since the master management spine was re-initialized. System Contact The textual identification of the contact person and their contact information for this system, assigned by the administrator. System Name The name for the system, assigned by an administrator. One convention is to use the system's fully qualified domain name. System Location The location of the system, assigned by an administrator. Apply Button Saves any changes made by the user in the System tab to memory. Refresh Button Refreshes all fields in the System tab. Chassis FRU Tab The Chassis FRU tab displays switch Field Replaceable Unit (FRU) information. This information includes the following items: Type The type of component. Description A description of the component, assigned by an administrator. Alias Name Name of the component, assigned by an administrator. Serial Num Component serial number Detail A button for each row that displays additional detail about the component. Additional details include: Part Number, Model, Version, Manufacturer Name, Product Name, Manufacturer Identification, and Manufactured Date. Apply Button Saves any changes made by the user in the Chassis FRU tab to memory. D000003-016 Rev. A 2-13 S 2 – Operations and Administration Chassis Viewer Refresh Button Refreshes all fields in the Chassis FRU tab. Power Tab The Power tab displays switch power supply information. This information includes the following items: Description A description of the component, assigned by an administrator. Status Displays the status of the component. Part Num Displays the part number of the component. Detail A button for each row that displays additional detail about the component. Additional details include: Decription, Status, Part Number, Manufacturing Name, Product Name and Manufacturing ID. Apply Button Saves any changes made by the user in the Power tab to memory. Refresh Button Refreshes all fields in the Power tab. Fan Tab The Fan tab displays switch fan information. For descriptions of the fields, see the Power Tab. Backplane Tab The Backplane tab displays switch backplane information. The Backplane details button includes the additional information: 2-14 Description Serial Number Part Number Model Version Manufacturing Name Product Name Manufacturing ID D000003-016 Rev. A A 2 – Operations and Administration Chassis Viewer Manufacturing Date Additionally, the user can modify the Description field, adding information specific to their network environment. D000003-016 Rev. A 2-15 2 – Operations and Administration Configuration and Monitoring Features S Configuration and Monitoring Features The following section provides, for the applicable hemisphere, detailed, task-oriented descriptions for configuring and monitoring the switch and its feature functionality. Chassis View Menu Figure 2-24 Chassis View Menu Logging The Logging submenu allows the user to set and reset levels for log message files. Figure 2-25 Logging Submenu Set Level Figure 2-26 Set Level Button 2-16 D000003-016 Rev. A A 2 – Operations and Administration Configuration and Monitoring Features The Set Level button allows the user to set log level configuration parameters for all software modules. To set log levels: 1. From the menu, select Logging. 2. From Logging, select Set Level. The Log System Configurator (Device Tab) window is displayed: Figure 2-27 Log System Configurator (Device Tab) The Device tab presents current log level configuration settings for the following software modules: • RAM = The circular log buffer contained in memory. To access the contents of this buffer, use the Chassis Viewer View Log button • Syslog = Messages that are sent to the syslog host specified on the Syslog tab. From this screen, the user can change any of the log level settings for a specific software module by clicking on the Configure button, which displays a configuration screen: Figure 2-28 Device Tab: Software Module Configurator To change any Log Level settings: 1. Click the On-Off checkbox to the right of the setting. 2. Click the Apply button to save any changes. D000003-016 Rev. A 2-17 2 – Operations and Administration Configuration and Monitoring Features S The following list describes each of the Log Level configuration parameters. • DUMP – Dump: Indicates that a problem has caused the system to produce a system dump file. In most circumstances, it is recommended that the user retrieve the dump that was produced. Support engineers may require the information contained in the dump file to diagnose the cause of the problem. • FATAL – Indicates that a non-recoverable system problem has occurred. The user should reboot the system or component and verify that the subsystem is fully functional to determine whether the fault has been corrected. If the problem persists, the user should contact the supplier. • ERROR – Indicates that a serious system error has occurred which might be recoverable. If the system exhibits any instability, the user should reboot the system or component. If errors persist, the user should immediately contact the supplier's technical support. • ALARM - Indicates that a serious problem has occurred which degrades capacity or service. If the error is recoverable, the user should correct the failure. If the alarm/failure persists, the user should reboot the system at a convenient time. If the problem is still not cleared, the user should contact the supplier. • WARNING - Indicates that a recoverable problem has occurred. The user does not need to take action. • PARTIAL - When more information is available, Partial causes additional message-related details to be displayed. • CONFIGURATION - An informational message indicating changes that a user has made to the system configuration. The user does not need to take any action. • INFO: Informational messages that occur during a system or component boot. The user does not need to take any action. • PERIODIC: An informational message containing periodic statistics. The user does not need to take action. • NOTICE: Notice is used for failures that could be a result of “frequent” user actions, such as a server reboot. Debug message levels 1 through 5: Debug messages are for supplier and/or QLogic engineering use and are not necessarily indicative of actions that an end user may need to take. • DEBUG1 – Messages that describe the states of connections and links. • DEBUG2 – Messages that describe major configuration changes or operations. • DEBUG3 – Messages that describe the I/O flow. 2-18 D000003-016 Rev. A A 2 – Operations and Administration Configuration and Monitoring Features • DEBUG4 – Messages that contain the packet dumps within an I/O flow. I/O flows contain multiple packets. • DEBUG5 – Messages that contain the packet dumps within an I/O flow. I/O flows contain multiple packets. Important: When configuring the log levels to display debug messages, care should be taken to ensure that system performance issues are weighed against troubleshooting requirements. Generally, the higher the debug number the more information is written to the log. Specifically, debug 3-5 have the most effect on system performance. Preset Tab The Preset tab allows the user to quickly change log level settings for all software modules on the switch. Figure 2-29 Log System Configurator: Preset Tab To change the log level settings: 1. Click the On-Off checkbox to the right of the setting(s). 2. Click the Apply button to save any changes. D000003-016 Rev. A 2-19 S 2 – Operations and Administration Configuration and Monitoring Features Syslog Tab Figure 2-30 Log System Configurator: Syslog Host Tab The Syslog tab allows the user to configure logging messages to be sent to a syslog host. If the Host IP address is 0.0.0.0, no syslog host is configured, otherwise log messages are sent to the syslog server at a specified IP address and port. To setup the syslog host: 1. In the Host IP text box, enter the IP address of the syslog host where the log files are to be saved. 2. Click the Apply button to save the IP address. Configure Syslog on the Syslog Server 1. Edit the /etc/sysconfig/syslog file and ensure that the -r is included in the SYSLOGD_OPTIONS. This allows logging from a remote system. For example: SYSLOGD_OPTIONS="-r -m 0" 2. Type /etc/init.d/syslog restart, and press Enter. NOTE: To centralize logging for all switches in an IB fabric, the user can configure each switch to point to the same syslog server, which has the syslog daemon (syslogd) running. Reset Log Levels The Reset Levels button resets the logging levels to their factory default values. Figure 2-31 Reset Levels Button To reset the logging levels: 2-20 D000003-016 Rev. A A 2 – Operations and Administration Configuration and Monitoring Features 1. From the menu, select Logging. 2. Click Logging. 3. Click Reset Levels. The Reset Levels window is displayed: Figure 2-32 Reset Log Levels Window 4. To reset the logging levels, click OK. Maintenance Figure 2-33 Maintenance Menu NOTE: For rebooting information, see “Rebooting the MPFD switches using Chassis Viewer” on page 2-10. Firmware Update Figure 2-34 Firmware Update Button The Firmware Update button allows the user to select an alternate firmware file for the switch. These alternate files are reflected in the drop-down lists in the Firmware Update screen. To download firmware: D000003-016 Rev. A 2-21 2 – Operations and Administration Configuration and Monitoring Features S 1. From the menu, select Maintenance. 2. Click Firmware Update. The Firmware Update screen is displayed. Figure 2-35 Firmware Update Screen 3. In the Select Target Slot Column, select the hardware component to change its firmware. NOTE: If there are multiple modules of the same type, the user can select all slots that apply. 4. From the Image to Overwrite drop-down, choose an alternate firmware file for each selected component. 5. In the Firmware Update Package: text box, enter the path to the alternate firmware file. If the path is not known, the user can use the Browse... button to locate it. NOTE: Before using the Browse... button, make certain that the browser is tied to an FTP server where the firmware files reside (i.e., if the file(s) does not reside on a local computer). 6. To have the new image become active after the next reboot, check the box in the Boot? Column. 7. Click the Update button. LDAP Configuration Figure 2-36 LDAP Configuration Button The lightweight directory access protocol (LDAP) configuration feature allows the user to set and configure authentications for the switch. The LDAP service resides on a server that has access to a usercode and password database. On the 9000 switches with LDAP enabled, when a user attempts to login to either Chassis Viewer or the CLI, the LDAP client intercepts the login attempt and rather than authenticating internally, encrypts and packages the information in an LDAP packet and sends it to a pre-configured LDAP server over TCP/IP (i.e., the out of 2-22 D000003-016 Rev. A A 2 – Operations and Administration Configuration and Monitoring Features band LAN). The LDAP server receives the request, passes it on to the authentication services, and responds to the client with a yes or no, either allowing or denying the user access to the box. When LDAP is disabled internal authentication becomes the default. To setup LDAP authentication: 1. From the menu, select Maintenance. 2. Click LDAP Configuration. The LDAP Authentication screen is displayed. Figure 2-37 LDAP Authentication Screen 3. In the LDAP Server IP Address box, enter the address of the applicable LDAP server. 4. In the LDAP Server Port box, enter the applicable server port number (the default is 389). 5. When finished, click the Apply button. HTTP/CLI Session Configuration Figure 2-38 HTTP/CLI Session Config Button The hyper text transfer protocol (HTTP) and command line interface (CLI) session configuration feature allows the user to set HTTP and CLI session timeout parameters, as well as set security requirements for the switch. The session timeout duration is the length of time that a session remains active if there is no GUI activity. If a session is inactive for a time exceeding the timeout duration, the user will be logged out. To modify the HTTP and CLI configurations: D000003-016 Rev. A 2-23 S 2 – Operations and Administration Configuration and Monitoring Features 1. From the menu, select Maintenance. 2. Click HTTP/CLI Session Config. The HTTP/CLI Session Configuration screen is displayed. Figure 2-39 HTTP/CLI Session Configuration Screen 3. To modify the session timeout duration (in seconds), click on the existing configuration. The row changes to orange. 4. In the HTTP Timeout Duration field, enter the new timeout duration (in seconds). The default is 0 seconds (i.e., no timeout). 5. In the CLI Timeout Duration field, enter the new timeout duration (in seconds). The default is 600 seconds. 6. To change the User Authentication parameter, click on the dropdown list. The following is displayed: Figure 2-40 User Authentication Dropdown List 7. Select the preferred user authentication method. These are: • Login Enabled - UserName and Password must be entered, and must match what is in the database of the local switch. • UserOnly Required - According to the local switch database, a valid username must be entered. A password is not required. • Login Disabled - Does not require username or password. • LDAP - use an LDAP server. If the user name/password validation fails to complete successfully, check in the database of the local switch. 2-24 D000003-016 Rev. A A 2 – Operations and Administration Configuration and Monitoring Features 8. To change the HTTP Mode parameter, click on the dropdown list. The following is displayed: Figure 2-41 User Authentication Dropdown List 9. Select Enabled or Disabled. 10. To change the HTTPs Mode parameter, click on the dropdown list. The following is displayed: Figure 2-42 User Authentication Dropdown List 11. Select Enabled or Disabled. 12. When finished, click the Apply button. SNMP The SNMP submenu allows the user to view and modify SNMP trap configuration information. Figure 2-43 SNMP Submenu D000003-016 Rev. A 2-25 2 – Operations and Administration Configuration and Monitoring Features S Target Configuration The Target Configuration button displays the SNMP Target Configuration Window, allowing the user to view and edit existing SNMP trap destinations. Figure 2-44 Target MIB Configuration Button To display the Target Configuration window: 1. From the menu, select SNMP. 2. Select Target Configuration. 3. The SNMP Target Configuration window is displayed: Figure 2-45 SNMP Target Configuration Window The top section of the window, SNMP Target Addresses, allows the user to determine what type of SNMP traps are sent, and where they are sent. The rows provide an area for specifying multiple trap destinations. The bottom section of the window, SNMP Target Parameters, allows the user to configure each trap destination with version, optional security information, and filtering mechanisms. The Apply button applies the current settings to either the SNMP Target Addresses or SNMP Target Parameters section. NOTE:The Target Configuration window is used for viewing and modifying existing SNMP target entries. It is not used for creating new target entries. 2-26 D000003-016 Rev. A A 2 – Operations and Administration Configuration and Monitoring Features To create a new target entry, use the following CLI command: snmpTargetAddr add -n name -a addr [-p port] [-t timeout] [-r retry_count] [-l tag_list] [-v parameters] [-s storage_type] For example: To add a trap target with the IP address 192.168.0.123 that accepts SNMP v2c style traps: snmpTargetAddr add -n traphost1 -a 192.168.0.123 -v "v2 params" Or, to add the same target except using SNMP v1traps: snmpTargetAddr add -n traphost1 -a 192.168.0.123 -v "v1 params" D000003-016 Rev. A 2-27 S 2 – Operations and Administration Configuration and Monitoring Features Target Configuration Window Field Descriptions The following are descriptions for each field in the Target Configuration window: SNMP Target Addresses: • Address Name Specifies a unique, administrator-defined name the system uses to identify a row. • Transport Domain Specifies the transport type of the address contained in the snmpTargetAddrTAddress object (e.g., 1.3.6.1.6.1.1 = udp, 1.3.6.1.4.1.1977.200.1 = tcp). • Transport Address Specifies the IP address in dotted decimal format. NOTE: The combination of the Transport Domain and the Transport Address determines the trap destination. • Port Specifies the TCP or UDP port that the SNMP trap is sent. • Timeout Specifies the time (in milliseconds) that the trap sender waits on a response before re-sending the trap. • Retry Count Specifies the number of attempts to be made to send the trap after a timeout condition occurs. NOTE: Timeout and Retry Count are SNMP v2.c and above. Not applicable for v1 traps. • Tag List Specifies which traps should be sent to this particular destination. NOTE: RFC2233 specifies the link up/down traps. Including RFC2233 in the Tag List specifies that the trap receiver will get link up/down traps. • Parameters Specifies a mapping to an entry in the SNMP Target Parameters table, determining the version of SNMP to use. • Storage Type This field determines whether or not the entry is saved for each reboot of the switch. 2-28 D000003-016 Rev. A A 2 – Operations and Administration Configuration and Monitoring Features • Nonvolatile means that the value is saved, and remains with each subsequent reboot. • Volatile or Other indicates it will not be saved. • Status Indicates the current status of the row. The row may be in one of three states: • Active • Not in service • Not Ready NOTE: A status of not in service indicates that the current row will not be used in the event a trap is generated by the system. Toggling a trap to not in service, which temporarily suspends trap forwarding, may be useful to keep values intact. SNMP Target Parameters: NOTE: Changes can only be made to rows that have a status of not in service. • Parameter Name Specifies a mapping to an entry in the SNMP Target Parameters table, determining the version of SNMP to use. • MP Model The Message Processing Model to be used when generating SNMP messages for entry. Values for this field are 0 for SNMP v1, 1 for SNMP v2 and 3 for SNMP v3. • Security Model The Security Model to be used when generating SNMP messages using this entry. Values for this field are 1 for SNMP v1, 2 for SNMP v2, or 3 for SNMP v3 • Security Name Security name identifies the entity for whom SNMP messages will be generated. NOTE: This is equivalent to the community string in an SNMP get. • Security Level One of three options: • NoAuthNoPriv: No Authentication, no privacy. • AuthNoPriv: Authentication, no privacy. • AuthPriv: Authentication and privacy • Storage Type D000003-016 Rev. A 2-29 2 – Operations and Administration Configuration and Monitoring Features S This field determines whether or not the entry is saved for each reboot of the switch. • Nonvolatile means that the value is saved, and remains with each subsequent reboot. • Volatile or Other indicates it will not be saved. • Status Indicates the current status of the row. The row may be in one of three states: • Active • Not in service • Not Ready NOTE: A status of not in service indicates that the current row will not be used in the event a trap is generated by the system. Toggling a trap to not in service, which temporarily suspends trap forwarding, may be useful to keep values intact. Filter Status The SNMP Filter Status screen allows the user to view parameters for rfc2273 (SNMP-NOTIFICATION-MIB). Figure 2-46 Filter Status Button To view SNMP filter status: 2-30 D000003-016 Rev. A A 2 – Operations and Administration Configuration and Monitoring Features 1. From the menu, select SNMP 2. Click Filter Status. The SNMP Filter Status screen is displayed. Figure 2-47 SNMP Filter Status Screen Set Community Strings The Set Community Strings screen allows the user to set two SNMP community names: • Read Only Community Name • Read/Write Community Name Figure 2-48 Set Community Strings Button To set the Community Strings: D000003-016 Rev. A 2-31 S 2 – Operations and Administration Configuration and Monitoring Features 1. Click SNMP 2. Click Set Community Strings. The Set Community Strings screen is displayed. Figure 2-49 Set Community Strings Window The first field, "Read Only Comm. Name," is the community string that when specified in an SNMP client, allows read only access to SNMP fields exported by the SNMP server. The second field, "Read/Write Comm. Name," is the community string that when specified in an SNMP client, allows read and write access to SNMP fields exported by the SNMP server. 3. In each field, enter a meaningful name (such as public and private shown above), and click on Apply. Configuration File Administration The Configuration File Administration menu allows the user to perform various administrative tasks related to the configuration files for each virtual I/O card populating the switch. Figure 2-50 Configuration File Administration Menu 2-32 D000003-016 Rev. A A 2 – Operations and Administration Configuration and Monitoring Features Administer The Administer screen allows the user to set backup and restore scenarios for the configuration file of each MPFD virtual I/O card. Figure 2-51 Configuration File Administration - Administer 1. Click the chassis view. 2. Click Config File Admin. 3. Click Administer. The Configuration File Administration screen is displayed: Figure 2-52 Configuration File Administration Screen 4. Click on the virtual I/O card to be modified. The row changes to orange. 5. In the Mode column, click the drop-down and select the configuration file administration mode for a virtual I/O card. Figure 2-53 Configuration File Administration - Mode Drop-down D000003-016 Rev. A 2-33 S 2 – Operations and Administration Configuration and Monitoring Features Following is a description of each mode option: Disabled Following an Auto Restore of a configuration file to a virtual I/O card, the system sets the virtual I/O card mode to Disabled. This allows the user to verify that the configuration file is correct, before returning the virtual I/O card to Auto Backup mode. In the Disabled mode, use the Backup and Restore buttons to either back up or restore a configuration file. Auto Backup All configuration changes to a virtual I/O card are automatically backed up. Auto Restore The most recent configuration file is restored to a virtual I/O card inserted into a specific Chassis slot. This is useful as a prerequisite to hot swapping a virtual I/O card. 6. To save, click on Apply. NOTE: The Clear button deletes the configuration file from the switch. Host Upload/Download The Host Up/Download screens allows the user to: • Upload configuration files from a server. • Download saved configuration files from the switch to a server. Figure 2-54 Configuration File Administration - Host Up/Download 1. Click the chassis view. 2. Click Config File Admin. 2-34 D000003-016 Rev. A A 2 – Operations and Administration Configuration and Monitoring Features 3. Click Host Up/Download. The Configuration File Upload/Download screen is displayed: Figure 2-55 Configuration File Upload/Download Screen To upload a configuration file from a server to the CMU: 1. For a selected module, click the Upload button. The following screen is displayed: Figure 2-56 Upload Screen 2. Type the path to the desired server location, or click Browse to locate the correct path. 3. Click Submit. To download a configuration file from the CMU to a server: 1. For a selected module, click the Download button. The File Download screen is displayed. 2. Click Save. 3. In the Save As window, locate the correct path to the desired server location, and click Save. D000003-016 Rev. A 2-35 S 2 – Operations and Administration Configuration and Monitoring Features Trap Control The Trap Control screen allows the user to set default trap scenarios related to configuration files. Figure 2-57 Trap Control 1. Click the chassis view. 2. Click Config File Admin. 3. Click Trap Control. The Trap Control screen is displayed: Figure 2-58 Configuration File Trap Control Screen 4. Select or deselect the desired trap(s). NOTE: To generate an immediate trap, click the applicable Gen Trap button. 5. To save settings, click on Apply. NOTE: If the checkbox is not checked the Gen Trap button will not generate a trap. Following are definitions for each configuration file trap: CfgSrvBackupFailed The server was instructed to backup a file for a particular slot, which failed. CfgSrvSyncError Synchronization to the slave CMU failed. The problem should be resolved and attempted manually. 2-36 D000003-016 Rev. A A 2 – Operations and Administration Configuration and Monitoring Features CfgSrvGenError A general error has occurred. CfgSrvFileRestored The configuration files have been restored to a particular slot. CfgSrvFileBackedup The configuration files have been successfully backed up for a particular slot. CfgSrvModeDisabled An event has occurred that has caused the slot mode to be set to disabled. The user should resolve the error and reset the mode to the proper value for the affected slot. NOTE: The default settings for this screen are as shown above. The user should not change the defaults unless instructed by Technical Support. Chassis Traps The Chassis Trap Control screen allows the user to set default trap scenarios related to the switch. Figure 2-59 Chassis Trap Control D000003-016 Rev. A 2-37 S 2 – Operations and Administration Configuration and Monitoring Features 1. From the Chassis menu, click Chassis Traps. 2. Click Trap Control. The Chassis Trap Control screen is displayed: Figure 2-60 Chassis Trap Control Screen 3. Select or deselect the desired trap(s). NOTE: To generate an immediate trap, click the applicable Gen Trap button. 4. To save settings, click on Apply. Following are definitions for each chassis trap: Chassis Group icsChassisTrapSystemSelfTestFailure This trap indicates that the chassis failed one or more of its self-test(s). icsChassisTrapSystemReboot This trap indicates that the chassis is in the process of rebooting. icsChassisTrapSystemMgmtSrvcStarted This trap indicates that the internal service used to support the management of the chassis is operational. icsChassisTrapSystemMgmtSrvcAborted This trap indicates that the internal service used to support the management of the chassis has terminated abnormally. 2-38 D000003-016 Rev. A A 2 – Operations and Administration Configuration and Monitoring Features icsChassisTrapSystemSwitchFailover This trap indicates that there was a fail over from one switch in the chassis to the other. Slot Group icsChassisTrapModuleNotResponding This trap indicates that a module is not responding to HEARTBEAT poll requests, that are issued by the internal chassis management service. icsChassisTrapModuleInserted This trap indicates that a module was inserted into the chassis. IcsChassisTrapModuleRemoved This trap indicates that a module was removed from the chassis. icsChassisTrapModuleFailed This trap indicates that a module has failed and is not operational. icsChassisTrapModuleSelfTestFailure This trap indicates that the module failed one or more of its self-test. icsChassisTrapModuleEEPROMReadFailure This trap indicates that an error condition was encountered when reading the EEPROM of the module. icsChassisTrapModuleFPGAReadFailure This trap indicates that an error condition was encountered when reading the Field-Programmable Gate Array (FPGA) of the module. icsChassisTrapModuleBulkPowerFailure This trap indicates that the bulk power used by a module has failed within the chassis. icsChassisTrapModuleReboot This trap indicates that the module is in the process of rebooting. Power Group icsChassisTrapPowerSupplyNotResponding This trap indicates that a power supply is not responding to HEARTBEAT poll requests, that are issued by the internal chassis management service. icsChassisTrapPowerSupplyInserted This trap indicates that a power supply was inserted into the chassis. D000003-016 Rev. A 2-39 S 2 – Operations and Administration Configuration and Monitoring Features icsChassisTrapPowerSupplyRemoved This trap indicates that a power supply was removed from the chassis. icsChassisTrapPowerSupplyFailed This trap indicates that a power supply has failed and is not operational. icsChassisTrapPowerSupplyEEPROMReadFailure This trap indicates that an error condition was encountered when reading the EEPROM of the power supply. icsChassisTrapPowerSupplyFanFailed This trap indicates that a power supply fan has failed and is not operational. Fan Group icsChassisTrapFanNotResponding This trap indicates that a fan is not responding to HEARTBEAT poll requests, that are issued by the internal chassis management service. icsChassisTrapFanTrayInserted This trap indicates that a fan was inserted into the chassis. icsChassisTrapFanTrayRemoved This trap indicates that a fan was removed from the chassis. icsChassisTrapFanFailed This trap indicates that a fan has failed and is not operational. icsChassisTrapFanTrayEEPROMReadFailure This trap indicates, that an error condition was encountered when reading the EEPROM of the fan tray. Port Statistics The Chassis View Port Statistics area provides IB port information for all of the external and internal ports of the switch. Figure 2-61 IB Port Statistics To view port statistical information, do the following: 2-40 D000003-016 Rev. A A 2 – Operations and Administration Configuration and Monitoring Features 1. From the Chassis View Port Statistics submenu, select IB Port Stats. The IB Port Statistics window is displayed: Figure 2-62 Chassis IB Port Statistics Understanding Port Naming Conventions Following is an explanation of the conventions used in the Port Name column. Leaf modules/ports: L = Leaf module number P = Leaf module port number Example: L12P01 is leaf module 12 port number 1. Interswitch Link (ISL) Ports: S = Spine module number L = Leaf leaf module number A = Spine module switch chip A B = Spine module switch chip B a, b, c = Links between a leaf module and each spine chip Example: S2AL10 is the ISL between spine module 2, switch chip A and leaf module 10. NOTE: Spine chips are referenced by the spine number and the switch chip identifier. Each spine module contains two switch chips (Switch chip A and B). Port Statistics Field Descriptions Link State: Indicates whether the InfiniBand link associated with the physical port is up or down. Possible values are no state change, down, init, armed, active, and unknown. D000003-016 Rev. A 2-41 2 – Operations and Administration Configuration and Monitoring Features S Physical State: Indicates whether the internal connection to the InfiniBand port is up or down. Possible values are No State Change, Sleep, Polling, Disabled, Training, Up, and Error Recovery. Link Down Default: Indicates the default down state as set by the Fabric Manager. Possible values are No State Change, Sleep, Polling, and Unknown. Active Link Width: Indicates the number of full duplex serial links that are currently being used on a port. The current bandwidth capability of a port is determined by multiplying this value by the Active Link Speed of this port. For instance a 4X DDR link has a bandwidth capability of 20Gb/s. NOTE:Values of 1X are possible in this field with 4X IB cables if poor cable connections or defective 4X IB cables are used. Link Width Enabled: Link Width Enabled is the allowed link width(s) that a port can arbitrate to. Normally, this defaults to the Link Width Supported value, but can be overridden by the subnet manager. Link Width Supported: Indicates the link width in terms of multipliers of 2.5 Gbit/sec full duplex serial links supported by the port. Active Link Speed: Indicates the speed of the full duplex serial link. This is either 2.5Gbps (single data rate, or SDR), or 5.0Gbps (double data rate, or DDR). Link Speed Enabled: Link Speed Enabled is the allowed link speed(s) that a port can arbitrate to. Normally this defaults to the Link Speed Supported value, but can be overridden by the subnet manager. Link Speed Supported: The supported link speed of the port. This could be 2.5Gbps (SDR), 5.0Gbps (DDR) or both. 2-42 D000003-016 Rev. A A 2 – Operations and Administration Configuration and Monitoring Features InfiniBand Statistics: Transmit 32 Bit Words: The number of 32-bit data words transmitted by the port, not including flow control and VCRC data. Receive 32 Bit Words: The number of 32-bit data words received by the port, not including flow control and VCRC data. Transmit Packets: The number of data packets transmitted by the port, not including flow control packets. Receive Packets: The number of data packets received by the port, not including flow control packets. Symbol Errors: The number of times a 8B10B encoding violation, or a disparity violation was detected. If multiple errors are detected simultaneously (in more than one lane), the counter only increments by one. The value of the counter is not incremented past 65535. The Performance Manager may reset and/or consolidate the results of this counter. Link Error Recovery: Indicates the number of times the link error recovery process happened successfully. The value of the counter is not incremented past 65535. The Performance Manager may reset and/or consolidate the results of this counter. Link Downed: The number of times the link error recovery process failed. The value of the counter is not incremented past 65535. The Performance Manager may reset and/or consolidate the results of this counter. Receive Errors: Number of errors received on the port. Remote Physical Errors Received: Indicates bit errors on a link other than the physically attached link. Transmit Discards: Number of port transmit discards. Local Link Integrity Errors: An error caused by a marginal link. Depending upon the number of code violations, physical switch problems are detected at the physical layer. These errors are based on a count of local physical errors. D000003-016 Rev. A 2-43 2 – Operations and Administration Configuration and Monitoring Features S Excessive Buffer Overrun: This error is detected when the OverrunErrors threshold is exceeded by the number of consecutive flow control update periods with at least one overrun error in each period given in the PortInfo attribute. Pkey Violations Inbound: Indicates the number of times an invalid partition key (PKey) was received. PKeys support an advanced InfiniBand feature for logically partitioning a physical subnet into logical access domains. Pkey Violations Outbound: Indicates the number of times an invalid PKey was sent. PKeys support an advanced InfiniBand feature for logically partitioning a physical subnet into logical access domains. Raw Violations Inbound: Number of times raw inbound packet discarded. Raw Violations Outbound: Number of times raw outbound packet was discarded. Leaf and Spine Module IB Port Statistics To access IB port statistics for a specific leaf or spine module, perform the following steps. Leaf Modules 1. Select a leaf module. The leaf module view is displayed. 2. From the Leaf Port Stats menu, select IB Port Stats. Figure 2-63 Leaf Port Stats Menu 2-44 D000003-016 Rev. A A 2 – Operations and Administration Configuration and Monitoring Features The leaf port statistics window is displayed: Figure 2-64 Leaf Port Statistics Window For information on the each IB port statistic field, refer to the section “Port Statistics Field Descriptions” on page 2-41 Spine Modules 1. Select a spine module. The spine module view is displayed. 2. From the Spine menu, select Spine Port Stats, then IB Port Stats. Figure 2-65 Spine Port Stats Menu The spine port statistics window is displayed: Figure 2-66 Spine Port Statistics Window D000003-016 Rev. A 2-45 2 – Operations and Administration Configuration and Monitoring Features S For information on the each IB port statistic field, refer to the section “Port Statistics Field Descriptions” on page 2-41 Set Field Thresholds The Set Field Thresholds screen allows the user to set, for a specific parameter(s), an error message threshold for the cable ports on the switch. Figure 2-67 Set Field Thresholds To change error reporting thresholds, do the following: 1. Click on Port Stats. 2. Click on Set Field Thresholds. The Set Field Thresholds screen is displayed: Figure 2-68 Set Field Thresholds Screen 3. To change a threshold value for any field: a. Click in the Threshold field. b. Enter a new threshold value. 2-46 D000003-016 Rev. A A 2 – Operations and Administration Configuration and Monitoring Features NOTE: For those fields with a “Percent of Max” time unit, the user may enter a number from 0 to 100. For those fields with a “1 Second” time unit, the user may enter a number from 1 to 65,535. c. Click Apply. NOTE: If any threshold is exceeded on any port, the port will be displayed as red on the switch map and a warning message will be logged. The following are descriptions for each field in the Set Field Thresholds area: NOTE: The thresholds for the following four fields are set as a percentage of maximum; that is the percentage of maximum port capacity, which depending upon IB fabric configuration can be: • 4X (10/20Gbps) • 1X (2.5 Gbps) portXmitDataThresh The threshold for the number of 32-bit data words transmitted by the port. portRecvDataThresh The threshold for the number of 32-bit data words received by the port. portXmitPktsThresh The threshold for the number of data packets transmitted by the port. portRecvPktsThresh The threshold for the number of data packets received by the port. NOTE: The thresholds for the following fields are set based upon the number of error message which can occur in one second. The value can be from 1 to 65,535. portSymbolErrThresh The threshold for the number of times a 8B10B encoding violation, or a disparity violation was detected on the port. portLinkErrRecvThresh The threshold for the number of times the link error recovery process happened successfully on the port. portLinkDownedThresh The threshold for the number of times the link error recovery process failed on the port. D000003-016 Rev. A 2-47 S 2 – Operations and Administration Configuration and Monitoring Features portRecvErrThresh The threshold for the number of errors received on the port. portRecvRemPhysErrThresh The threshold for the number of remote physical errors received on the port. portXmitDiscardThresh The threshold for the number of transmit discards received on the port. portPKeyViolInThresh The threshold for the number of times PKey inbound was invalid on the port. portPKeyViolOutThresh The threshold for the number of times PKey outbound was invalid on the port. portRawViolInThresh The threshold for the number of times a raw inbound packet was discarded by the port. portRawViolOutThresh The threshold for the number of times a raw outbound packet was discarded by the port. portLocalLinkIntegThresh The threshold for the number of local link integrity errors on the port. portExcBufferOverrunThresh The threshold for the number of excessive buffer overrun errors on the port. Time Service The System Time Information screen allows the user to set the system time using either network time protocol (NTP) or manual overrides. Figure 2-69 Switch Time Service To set the system time: 2-48 D000003-016 Rev. A A 2 – Operations and Administration Configuration and Monitoring Features 1. From the menu, click Time Service. 2. Click Set System Time. The System Time Information screen is displayed: Figure 2-70 System Time Information Screen To use NTP: 1. Click the Use Network Time Protocol? checkbox. 2. Enter the IP address for the NTP server. 3. To save, click on Apply. Figure 2-71 Time Service - NTP Setup To manually set the system time: 1. Make sure the Use Network Time Protocol? checkbox is unchecked. 2. Set the current date and time using the drop-downs for Month, Day, and Year as well as Hour, Minute, Seconds, and AM/PM. D000003-016 Rev. A 2-49 2 – Operations and Administration Configuration and Monitoring Features S 3. To save, click on Apply. Figure 2-72 Time Service - Manual Setup To set time zone and daylight saving time (DST) settings: 1. In the Time Zone drop-down, select the correct time zone based upon Greenwich Mean Time (GMT). 2. Using the Which, Day, and in Month drop-downs, set the start and end dates for daylight saving time. 3. To save, click on Apply. Figure 2-73 Time Service - Time Zone/Daylight Saving Time Setup Time Zone Tips: In the U.S. the following time zones are in effect: • Eastern Standard Time = GMT –5 • Central Standard Time = GMT –6 • Mountain Standard Time = GMT –7 • Pacific Standard Time = GMT -8 Daylight Saving Time Tips: 2-50 D000003-016 Rev. A A 2 – Operations and Administration Configuration and Monitoring Features For most of the United States, Daylight Saving Time in the United States begins at 2 a.m. on the second Sunday of March, and ends at 2 a.m. on the first Sunday in November. Additionally, for those US regions that do not observe DST, the start and end dates in the Which, Day, and in Month settings should be set to the exact same date. Configuring the Switch OOB IP Address To configure the Switch IP address: 1. From the OOB LAN IP submenu, click Set OOB LAN IP. Figure 2-74 Set Switch OOB IP Address Button 2. Click in the OOB IP Address field. Figure 2-75 Set OOB LAN IP Window 3. Type in the desired switch IP address. 4. Type in the desired net mask. 5. Click Apply. D000003-016 Rev. A 2-51 S 2 – Operations and Administration Configuration and Monitoring Features Configuring the Switch Default Gateway IP Address The Set Default Gateway IP address Window allows the user to configure the IP address for the default gateway to route packets from the OOB management port to an external network. To configure the Switch default gateway IP address: 1. From the OOB LAN IP submenu, click Set Default Gateway IP. Figure 2-76 Set Switch Default Gateway IP Address Button 2. Click in the OOB IP Address field. Figure 2-77 Set Default Gateway IP Window 3. Type in the correct switch default gateway IP address. 4. Click Apply. NOTE:A reboot is required to activate the new gateway IP address. Fabric Manager Configuration NOTE: This section assumes the user has purchased and activated the embedded version of the Fabric Manager. NOTE: For the SilverStorm 9020, the Fabric Manager Configuration submenu is part of the EVIC and FVIC menu. Figure 2-78 Subnet Manager Submenu 2-52 D000003-016 Rev. A A 2 – Operations and Administration Configuration and Monitoring Features Automatically starting the Fabric Manager To enable the Fabric Manager to automatically start at boot time: 1. From the menu, click Subnet Manager. 2. Click Configuration. The Subnet Manager Configuration window is displayed: Subnet Manager Configuration Window Figure 2-79 Subnet Manager Configuration Window 3. To configure the Fabric Manager to automatically start with each boot, click Enabled. NOTE: If the user wants to manually activate the Fabric Manager, click Disabled. 4. For MPFD 9080, 9120 and 9240 switches, in a redundant management configuration, the Start On Slave option should be set to Disabled. In the event that the Fabric Manager on the master spine is disabled, the Fabric Manager on the slave spine will turn on automatically when it becomes the chassis management spine. 5. Click Apply. NOTE: D000003-016 Rev. A For additional information on configuring the Fabric Manager, refer to the Subnet Management section of Appendix D, Switch Command Line Interface. 2-53 2 – Operations and Administration Spine View Menu S Spine View Menu For information on accessing the Spine View, refer to “Spine Module View” on page 2-7. Figure 2-80 Spine View Menu NOTE: For information on IB port statistics refer to the section “Port Statistics” on page 2-40. Logging The Logging submenu allows the user to view and purge the log message file. Figure 2-81 Logging Submenu 2-54 D000003-016 Rev. A A 2 – Operations and Administration Spine View Menu Viewing the Log NOTE: Each management spine maintains a separate log. The View Log button allows the user to view the message log. Figure 2-82 View Log Button To view the message log: 1. From the menu, select Logging. 2. Click View Log. The log message window is displayed: Figure 2-83 Sample Message Log To save a log message for further analysis, perform the following steps: 1. From the Messages window, select Edit, Select All (or CTRL + A). 2. Select Edit, Copy (or CTRL + C). 3. Open a text editing package, such as Notepad. 4. Select Edit, Paste (or CTRL + V). 5. Save as a plain text (.txt) file. D000003-016 Rev. A 2-55 S 2 – Operations and Administration Spine View Menu Purging the Log The Purge Log button purges the RAM, clearing the log file(s). Figure 2-84 Purge Log Button To purge the log: 1. From the menu, click Logging. 2. Click Purge Log. The Purge Log confirmation window is displayed Figure 2-85 Purge Log Confirmation Window 3. Click OK. 4. The message log file is now purged. Select Boot Image The Select Boot Image button allows the user to choose an alternative boot image for the switch. To select a boot image: Figure 2-86 Select Boot Image Button 2-56 D000003-016 Rev. A A 2 – Operations and Administration Spine View Menu 1. From the menu, select Maintenance. 2. Click Select Boot Image. The Boot Image Selection screen is displayed: Figure 2-87 Boot Image Selection Screen NOTE: By mousing over either radio button in the Boot Image Selection screen, the user can glean additional information about each file, as shown in Figure 2-88 below: Figure 2-88 Boot Image File Pop Up To choose a new boot image: 1. Click on a radio button of the new boot image. 2. Click Submit. This is the image that will run after the next reboot. D000003-016 Rev. A 2-57 S 2 – Operations and Administration Spine View Menu Fabric Manager Control NOTE: This section assumes the user has purchased and activated the embedded version of the Fabric Manager. NOTE: For the SilverStorm 9020, the Fabric Manager Control submenu is part of the EVIC and FVIC menu. Figure 2-89 Subnet Manager Submenu Accessing the Subnet Manager Control Window The Subnet Manager Control window presents status information relating to the Fabric Manager and provides a mechanism for starting, restarting, and stopping the Fabric Manager. Figure 2-90 Subnet Manager Control Button 1. From the Spine menu, click Subnet Manager 2. Click Control. The Subnet Manager Control window is displayed: Figure 2-91 Subnet Manager Control Window 3. To start the Fabric Manager, click Start. The system responds by displaying “Starting up” in the Status area of the Subnet Manager Control Window. 2-58 D000003-016 Rev. A A 2 – Operations and Administration Spine View Menu 4. To confirm that the Fabric Manager has started, click Refresh. Once the Fabric Manager is running, the system reports “Running” in the Status area and begins to increment the Uptime counter. 5. Click Close. Restarting the Fabric Manager 1. From the menu, click Subnet Manager. 2. Click Control. The Subnet Manager Control window is displayed. 3. To restart the Fabric Manager, click Restart. The system responds by displaying “Shutting Down” in the Status area of the Subnet Manager Control Window. 4. To confirm that the Fabric Manager has started, click Refresh. Once the Fabric Manager is running, the system reports “Running” in the Status area and begins to increment the Uptime counter. 5. Click Close. Stopping the Fabric Manager 1. From the menu, click Subnet Manager. 2. Click Control. The Subnet Manager Control window is displayed. 3. To stop the Fabric Manager, click Stop. The system responds by displaying “Shutting Down” in the Status area of the Subnet Manager Control Window. 4. To confirm that the Fabric Manager has shut down, click Refresh. Once the Fabric Manager has shut down, the system reports “Not Started.” 5. Click Close. D000003-016 Rev. A 2-59 S 2 – Operations and Administration Spine View Menu License Keys; Key Administration The License Key submenu allows the user to activate and deactivate feature functionality that is sold as an add-on to the switch. NOTE: For the SilverStorm 9020, the License Keys submenu is part of the EVIC and FVIC menu. Adding a New License Key 1. Click License Keys. The Key Administration button is displayed: Figure 2-92 License Key Submenu 2. Click Key Administration. The Key Management window is displayed: Figure 2-93 Key Management Window 3. To add a new license key, click the Add Key button. The License Key Management Information window is displayed: Figure 2-94 License Key Management Information Window 4. Enter the license key information in the New Key text box, and click Apply. NOTE: 2-60 A license key number is given as part of the InfiniBand Fabric Suite 2008 software package. D000003-016 Rev. A A 2 – Operations and Administration Spine View Menu Deleting a License Key 1. Click on the License Keys submenu. Figure 2-95 License Key Submenu 2. Click on Key Administration. The Key Management window is displayed: Figure 2-96 Key Management Window 3. To delete a license key, click the Delete button. The system prompts with the following: Figure 2-97 License Key Delete Prompt 4. Click OK to delete. D000003-016 Rev. A 2-61 2 – Operations and Administration Spine View Menu 2-62 S D000003-016 Rev. A 3 FVIC Configuration and Monitoring Features The following section provides detailed, task-oriented descriptions for configuring and monitoring the FVIC card and its feature functionality via the FVIC Menu. NOTE: For 9020 users, refer to the following sections for subnet management and licence key information: • “Fabric Manager Configuration” on page 2-52 • “Fabric Manager Control” on page 2-58 • “License Keys; Key Administration” on page 2-60 Figure 3-1 FVIC Menu D000003-016 Rev. A 3-1 3 – FVIC Configuration and Monitoring Features Logging S Logging The Logging submenu allows the user to view, set levels, reset levels, and purge the message log file. Figure 3-2 Logging Submenu The View Log button allows the user to view the message log. Figure 3-3 View Log Button 3-2 D000003-016 Rev. A A 3 – FVIC Configuration and Monitoring Features Logging To view the message log: 1. From the menu, select Logging. 2. Click View Log. The log message window is displayed: Figure 3-4 Sample Message Log To save a log message for further analysis, perform the following steps: 1. From the Messages window, select Edit, Select All (or CTRL + A). 2. Select Edit, Copy (or CTRL + C). 3. Open a text editing package, such as Notepad. 4. Select Edit, Paste (or CTRL + V). 5. Save as a plain text (.txt) file. Set Level Figure 3-5 Set Level Button The Set Level button allows the user to set log level configuration parameters for all software modules on the FVIC. To set log levels: D000003-016 Rev. A 3-3 S 3 – FVIC Configuration and Monitoring Features Logging 1. From the menu, select Logging. 2. From Logging, select Set Level. The Log System Configurator (Device Tab) window is displayed: Figure 3-6 Log System Configurator (Device Tab) The Device tab presents current log level configuration settings for the following software modules: • RAM = The circular log buffer contained in memory. To access the contents of this buffer, use the Chassis Viewer View Log button • Syslog = Determines which messages should be logged to the syslog server. From this screen, the user can change any of the log level settings for a specific software module by clicking on the Configure hyperlink, which displays a configuration screen: Figure 3-7 Device Tab: Software Module Configurator To change any Log Level settings: 1. Click the On-Off checkbox to the right of the setting. 2. Click the Submit button to save any changes. The following list describes each of the Log Level configuration parameters. 3-4 D000003-016 Rev. A A 3 – FVIC Configuration and Monitoring Features Logging • DUMP – Dump: Indicates that a problem has caused the system to produce a system dump file. In most circumstances, it is recommended that the user retrieve the dump that was produced. Support engineers may require the information contained in the dump file to diagnose the cause of the problem. • FATAL – Indicates that a non-recoverable system problem has occurred. The user should reboot the system or component and verify that the subsystem is fully functional to determine whether the fault has been corrected. If the problem persists, the user should contact the supplier. • ERROR – Indicates that a serious system error has occurred which might be recoverable. If the system exhibits any instability, the user should reboot the system or component. If errors persist, the user should immediately contact the supplier's technical support. • ALARM - Indicates that a serious problem has occurred which degrades capacity or service. If the error is recoverable, the user should correct the failure. If the alarm/failure persists, the user should reboot the system at a convenient time. If the problem is still not cleared, the user should contact the supplier. • WARNING - Indicates that a recoverable problem has occurred. The user does not need to take action. • PARTIAL - When more information is available, Partial causes additional message-related details to be displayed. • CONFIGURATION: An informational message indicating changes that a user has made to the system configuration. The user does not need to take any action. • INFO: Informational messages that occur during a system or component boot. The user does not need to take any action. • PERIODIC: An informational message containing periodic statistics. The user does not need to take action. • NOTICE: A message describing the number of changes the subnet manager (SM) detected on the last subnet sweep. This message includes totals for the number of switches, host channel adapters, end-ports, total physical ports and SMs that have appeared or disappeared from the fabric. This message will only be logged at the end of a subnet sweep if the SM had detected changes. Debug message levels 1 through 5: Debug messages are for supplier and/or QLogic engineering use and are not necessarily indicative of actions that an end user may need to take. • DEBUG1 – Messages that describe the states of connections and links. • DEBUG2 – Messages that describe major configuration changes or operations. D000003-016 Rev. A 3-5 3 – FVIC Configuration and Monitoring Features Logging S • DEBUG3 – Messages that describe the I/O flow. • DEBUG4 – Messages that contain the packet dumps within an I/O flow. I/O flows contain multiple packets. • DEBUG5 – Messages that contain the packet dumps within an I/O flow. I/O flows contain multiple packets. Important: When configuring the log levels to display debug messages, care should be taken to ensure that system performance issues are weighed against troubleshooting requirements. Generally, the higher the debug number the more information is written to the log. Specifically, debug 3-5 have the most effect on system performance. Preset Tab The Preset tab allows the user to quickly change log level settings for all software modules on the FVIC. Figure 3-8 Log System Configurator: Preset Tab To change the log level settings: 1. Click the On-Off checkbox to the right of the setting(s). 2. Click the Apply button to save any changes. 3-6 D000003-016 Rev. A A 3 – FVIC Configuration and Monitoring Features Logging Reset Log Levels The Reset Levels button resets the logging levels to their factory default values. Figure 3-9 Reset Levels Button To reset the logging levels: 1. From the menu, select Logging. 2. Click Logging. 3. Click Reset Levels. The Reset Levels window is displayed: Figure 3-10 Reset Log Levels Window 4. To reset the logging levels, click OK. Purging the Log The Purge Log button purges the RAM, clearing the log file(s). Figure 3-11 Purge Log Button To purge the log: D000003-016 Rev. A 3-7 S 3 – FVIC Configuration and Monitoring Features Logging 1. From the menu, click Logging. 2. Click Purge Log. The Purge Log confirmation window is displayed Figure 3-12 Purge Log Confirmation Window 3. Click OK. 4. The message log file is now purged. 3-8 D000003-016 Rev. A A 3 – FVIC Configuration and Monitoring Features Maintenance Maintenance Select Boot Image The Select Boot Image button allows the user to choose an alternative boot image for the FVIC. To select a boot image: Figure 3-13 Select Boot Image Button 1. From the menu, select Maintenance. 2. Click Select Boot Image. The Boot Image Selection screen is displayed: Figure 3-14 Boot Image Selection Screen NOTE: By mousing over either radio button in the Boot Image Selection screen, the user can glean additional information about each file, as shown in Figure 3-15 below: Figure 3-15 Boot Image File Pop Up To choose a new boot image: D000003-016 Rev. A 3-9 3 – FVIC Configuration and Monitoring Features Maintenance S 1. Click on a radio button of the new boot image. 2. Click Apply. 3-10 D000003-016 Rev. A A 3 – FVIC Configuration and Monitoring Features Fibre Channel Configuration Fibre Channel Configuration Figure 3-16 Fibre Channel Configuration Submenu The Fibre Channel configuration submenu allows the user to perform the following tasks: • Fibre Channel Protocol (FCP) Interconnect Configuration. • Discover and Configure FCP Target Devices. • Discover and Configure SRP Initiators. • Configure SRP Mapping (LUN Mapping). FCP Port Configuration The FCP Port Configuration screen allows the user to set FVIC port speed and network topologies. Figure 3-17 FCP Port Configuration To configure FCP interconnections: D000003-016 Rev. A 3-11 S 3 – FVIC Configuration and Monitoring Features Fibre Channel Configuration 1. In the main status and navigation area, click on an FVIC. 2. From the FVIC menu, click Configuration. 3. Click FC Port Configuration. The FCP Port Configuration screen is displayed: Figure 3-18 FCP Port Configuration Screen 4. Select the FVIC port to be modified. The row changes to orange. 5. To set the port speed, click the drop-down in the Speed column. Select either Auto-negotiate (Auto), 1 GB, 2 GB or 4 GB. Figure 3-19 FCP Interconnect - Set Speed 6. Make sure topology is set to either: 3-12 D000003-016 Rev. A A 3 – FVIC Configuration and Monitoring Features Fibre Channel Configuration a. Private Loop if a port is connected to a storage device supporting loop, but does not support a fabric login. b. Public Loop if a port is connected to a storage device supports loop and requires a fabric login. c. Point to Point if a port is connected to a device supporting point-to-point login. d. Fabric is the default value to use when a port is connected to a Fibre Channel switch. Figure 3-20 FCP Interconnect - Set Topology 7. To save changes, click Apply. FCP Device Discovery The FCP Device Discovery screen allows the user to discover and configure Fibre Channel devices on the fabric. NOTE: Each Fibre Channel device must first be configured here before it can be part of a SRP Map. Figure 3-21 FCP Device Discovery Button To discover and configure FCP devices: 1. In the main status and navigation area, click on a FVIC. 2. From the FVIC menu, click on Configuration. D000003-016 Rev. A 3-13 S 3 – FVIC Configuration and Monitoring Features Fibre Channel Configuration 3. Click on FCP Device Discovery. The Fibre Channel Target Device Configuration window is displayed: Figure 3-22 Fibre Channel Target Device Configuration Window Any devices listed in the Configured Devices table have been previously discovered and configured. The devices must have a status of Connected in order to be utilized by an SRP Initiator. A device will have a status of Down if it is no longer logically connected to the FVIC port listed in the Port column. For example, if the FVIC previously discovered the device through Port 1, and the Fibre Channel cable has been moved to Port 2, the device will be displayed as Disconnected. 4. If the desired device and FVIC port does not appear in the Configured Devices table, click Start. All newly discovered devices are displayed in the Discovered Devices table. NOTE:A device will appear for each FVIC port connected to the same fabric (e.g., multiple FVIC ports are connected to the same Fibre Channel switch). Figure 3-23 Discovered Devices Table 3-14 D000003-016 Rev. A A 3 – FVIC Configuration and Monitoring Features Fibre Channel Configuration 5. Click on Configure. For each discovered device, enter a name which is applicable to the user environment. Figure 3-24 Configuring a Discovered Target NOTE:The fields In Frame Size, Out Frame Size, and Class of Service are currently not supported in the GUI. Each field is set by hardware. 6. Click Submit. The configured devices are now displayed in the Configured Devices table. Figure 3-25 Configured Target Devices Table To edit the name of any configured target in the Configured Devices table: 1. Click on any row. 2. Type a new name in the Name text box. 3. Click on Apply. To delete any configured target in the Configured Devices table: 1. Click on any row. 2. Click on Delete. NOTE: Configured devices can only be deleted if they are not assigned to a SRP Map. Additionally, deleting a device only removes it from the Configured Devices table. It may still appear in the Discovered Devices table. D000003-016 Rev. A 3-15 3 – FVIC Configuration and Monitoring Features Fibre Channel Configuration S SRP Initiator Discovery and Configuration The SRP Initiator Configuration screen allows the user to discover and configure IB-enabled hosts on the fabric. There are three methods for configuring SRP Initiators. The user must decide which method best meets the needs of the network environment: Discover the SRP Initiators This method utilizes the Start button on the SRP Initiator Configuration screen to find and configure each individual SRP Initiator. This method reports on the SRP Initiators that have attempted, but have been unsuccessful in establishing an SRP connection to the FVIC since the last reboot. The advantage of this method is that each individual SRP initiator has a name, which makes debugging connection problems simpler. The disadvantage is that each SRP Initiator must be manually configured. Manually Configure each SRP Initiator Port In this method use the Click to Add Host button to individually add SRP Initiators. The advantages of this method are each individual SRP initiator has a name, which may be debugging connection problems easier, and the FVIC can be configured even if the SRP hosts are not currently connected to the IB fabric. The disadvantages are (1) the information for each SRP Initiator must be manually entered, and (2) each SRP Initiator must be configured individually. Use Wildcarding In this method the individual SRP Initiator Ports (i.e. the HCA Port GUIDs) are not used when matching a request from a host to an entry in the SRP Initiators table. Instead, only the SRP Initiator Extension from the host is matched against the SRP Extension ID on the FVIC SRP Initiators screen. Therefore, only a single SRP Initiator needs to be defined on the FVIC. This Initiator can be used by many hosts. The FVIC can be configured even when the SRP hosts are not currently connected to the IB fabric. The disadvantage is that debugging problems with individual hosts failing to connect will be difficult to perform from the FVIC. For example, if the user expects 24 hosts are connected to the FVIC, but only 23 are, it will be difficult to tell which host has not connected using only the FVIC Chassis Viewer screens. This type of debugging needs to be done using the host-based tools contained in the Fast Fabric toolset. 3-16 D000003-016 Rev. A A 3 – FVIC Configuration and Monitoring Features Fibre Channel Configuration NOTE: Before using this screen to discover hosts, the user must verify that InfiniBand connectivity has been established with each IB-enabled host connected to the switch. Figure 3-26 SRP Initiator Discovery and Configuration Button To discover and configure SRP initiators: 1. In the main status and navigation area, click on a FVIC. 2. From the FVIC menu, click on Configuration. 3. Click on SRP Initiator Discovery. The Fibre Channel SRP Initiator Configuration window is displayed: Figure 3-27 Fibre Channel SRP Initiator Configuration Window D000003-016 Rev. A 3-17 S 3 – FVIC Configuration and Monitoring Features Fibre Channel Configuration 4. Click Start. All discovered hosts are displayed in the Discovered Hosts table. Figure 3-28 Discovered Hosts Table 5. Click on Configure. For each discovered hosts, enter a name which is applicable to the user environment. Figure 3-29 Configuring a Discovered Initiator 6. Click Submit. The configured devices are now displayed in the Configured Initiators table. Figure 3-30 Configured Initiators Table To edit the name of any configured initiator in the Configured Initiators table: 1. Click on any row. 2. Type a new name in the Name text box. 3. Click on Apply. To delete any configured initiator in the Configured Initiators table: 1. Click on any row. 2. Click on Delete. 3-18 D000003-016 Rev. A A 3 – FVIC Configuration and Monitoring Features Fibre Channel Configuration In addition to using the method above, the user can click on the Click to Add Host button in the Discovered Hosts table to add and configure IB hosts. Figure 3-31 Click to Add Host Button 1. In the Discovered Hosts table, click the Click to Add Host button. The following is displayed: Figure 3-32 Add Host Window 2. In the Initiator GUID text box, enter the 16-digit SRP Initiator port GUID number. NOTE:A user can determine an HCA 7000 or HCA 9000 Port GUID by entering the following at any host prompt: p1info for port 1 p2info for port 2 3. In the SRP Extension ID text box, enter the 16-digit SRP Extension ID number. NOTE:The user can find the SRP extension ID in the ics_srp configuration file. 4. In the Name text box, enter an applicable host name. 5. Click Submit. The host will now appear in the Configured Initiators table. Using the Click to Add Host button is also useful for wildcarding IB hosts. Wildcarding allows the user to create SRP Initiators that can be utilized by multiple hosts. In the following example, the Initiator GUID will match any host using "InitiatorExtension: 20" in its session definition (as defined in the ics_srp.cfg file). D000003-016 Rev. A 3-19 3 – FVIC Configuration and Monitoring Features Fibre Channel Configuration S 1. In the Discovered Hosts table, click the Click to Add Host button. The following is displayed: Figure 3-33 Add Host Window: Wildcarding 2. In the Initiator GUID text box, enter all zeros (16-digits) as shown in Figure 3-33. An SRP port GUID of all zeros is considered a wildcard - it will match any port GUID value. 3. In the SRP Extension ID text box, enter the 16-digit SRP Extension ID number. In this example (as shown in Figure 3-33) an SRP Extension ID of 14 is the hexadecimal equivalent of an Initiator Extension of 20, which is found in the ics_srp.cfg file. NOTE:By default Initiator extensions are in decimal format in the host ics_srp.cfg files (prefacing the decimal number with 0x will make it hexadecimal), but must be entered as hexadecimal strings in the Add Host window. 4. In the Name text box, enter an applicable host name. 5. Click Submit. The host will now appear in the Configured Initiators table. NOTE:As shown in Figure 3-34, any SRP initiator that utilizes wildcarding will appear in the Configured Initiators table as an asterisk (*) in the GUID column. Figure 3-34 SRP Initiators: Wildcarding 3-20 D000003-016 Rev. A A 3 – FVIC Configuration and Monitoring Features Fibre Channel Configuration SRP Map Configuration The SRP Map Configuration screen allows the user to map discovered and configured SRP Initiators to discovered and configured Fibre Channel devices on the FC fabric. Figure 3-35 SRP Map Configuration Button To configure initiators to target devices: 1. In the main status and navigation area, click on a FVIC. 2. From the FVIC menu, click on Configuration. 3. Click on SRP Map Configuration. The SRP Initiator Map Configuration window is displayed: Figure 3-36 SRP Map Configuration Window D000003-016 Rev. A 3-21 3 – FVIC Configuration and Monitoring Features Fibre Channel Configuration S NOTE:The number in green box of the Name column represents how many sessions are active for that SRP initiator. The number in the green box in the IOC (X) Mapping column represents how many session are active for that map. Figure 3-37 Click to Add Link 4. Click the Click to Add link of the SRP Initiator and column of the IOC. The IOC is the path through the FVIC through which the IB traffic flows (i.e. it selects one of the two HCA(s) on the FVIC). The Map Configuration Wizard is displayed: Figure 3-38 Map Configuration Wizard NOTE:The FCP target device must be accessible through the IOC chosen in order for the SRP initiator to communicate with the FCP target device. 5. Enter a map name applicable to the user environment. 6. For map type, choose Direct or Explicit. This example presents an Explicit map type. NOTE:If the SRP initiator only requires access to LUN 0 of the target device as Host LUN 0, use a Direct map. In general, each disk of a JBOD must be configured as a separate LUN. Depending on how a device is configured, the user may need to configure multiple LUNs for communication with an “intelligent” target device. If a storage device has multiple virtual drives, a Direct map to that device will allow access to all virtual drives (LUNs). An Explicit map to such a device allows the user to choose which LUNs to connect. 3-22 D000003-016 Rev. A A 3 – FVIC Configuration and Monitoring Features Fibre Channel Configuration 7. Click Next. Step 2 of the Map Configuration Wizard is displayed Figure 3-39 Map Configuration Wizard - Step 2 8. Choose a Target from the drop-down list. 9. Enter a Host LUN number. Host LUNs are numbered from 0 through n. 10. Enter a Target LUN number. Target LUNs are numbered from 0 through n. 11. Click Finish. NOTE: If the user chooses a Direct mapping, Steps 9 and 10 of the above procedure would be omitted. A Direct map is essentially an Explicit map with a single row containing Host LUN 0 and Target LUN 0. Deleting a Configured Map NOTE: A map can be deleted or deactivated only if there are no active sessions associated with it. To delete a configured initiator to target map, perform the following steps: 1. In the main status and navigation area, click on a FVIC. 2. From the FVIC menu, click on Configuration. 3. Click on SRP Map Configuration. The SRP Initiator Map Configuration window is displayed. D000003-016 Rev. A 3-23 S 3 – FVIC Configuration and Monitoring Features Fibre Channel Configuration 4. Select the mapping to be deleted. The Initiator and Map configuration information is displayed in the bottom of the window. Figure 3-40 Initiator and Map Configuration Information 5. In the Map configuration information area, click the Deactivate button. NOTE:When a map is deactivated the map is still present. SRP initiators requesting to connect to the map will be rejected. Additionally, the green box in the IOC (X) Mapping column will change to yellow. Figure 3-41 Deactivate Button 3-24 D000003-016 Rev. A A 3 – FVIC Configuration and Monitoring Features Fibre Channel Configuration 6. Once the Entry Status changes to Inactive, click on the Delete Map button. Figure 3-42 Inactive Entry Status and Delete Map Button 7. The system returns the following screen: Figure 3-43 Map Deletion Successful Message D000003-016 Rev. A 3-25 3 – FVIC Configuration and Monitoring Features Fibre Channel Configuration S Fibre Channel Virtual Port Configuration The Fibre Channel Virtual Port Configuration screen allows the user to configure virtual ports that create and expanded pool of available worldwide names, which significantly increases the number of unique host connections. Figure 3-44 FC Virtual Port Configuration Button To configure virtual ports: 1. In the main status and navigation area, click on an FVIC. 2. From the FVIC menu, click on Configuration. 3. Click on FC Virtual Port Configuration. The FC Virtual Port Key window is displayed: Figure 3-45 FC Virtual Port Key Window NOTE: The key window will only be displayed if the Virtual Port has not been enabled. 4. Enter the Virtual Port Key in the text box and click Apply. 3-26 D000003-016 Rev. A A 3 – FVIC Configuration and Monitoring Features Fibre Channel Configuration NOTE: The Virtual Port Key can be found on a label attached to the FVIC. Figure 3-46 FC Virtual Port Key NOTE: Once the Virtual Port Key is entered, it becomes a part of the FVIC configuration. The configuration should be backed up using the menu options Config File Admin, Administer, Backup (see “Configuration File Administration” on page 2-32 for detailed information). Once the configuration is saved, if the FVIC is removed and replaced with a different FVIC in the same slot, the new FVIC will contain the Virtual Port Key of the initial FVIC. 5. To configure a virtual port, click on a row in the FC Virtual Port Configuration window. Figure 3-47 FC Virtual Port Key Window 6. Enter a port name in the Name text box. 7. In the Port dropdown, select an FVIC port to assign to the virtual port (choices are port 1 through 8, or Unassigned). 8. In the Status dropdown, select Active or Inactive. 9. At the bottom of the window, click Apply. D000003-016 Rev. A 3-27 S 3 – FVIC Configuration and Monitoring Features Fibre Channel Configuration Removing the Virtual Port Pool The Remove Virtual Port Pool button causes all virtual ports to be removed as well as any configured targets that were discovered through those virtual ports. Figure 3-48 Remove Virtual Port Pool Button When the user selects the Remove Virtual Port Pool button, a warning screen is displayed: Figure 3-49 Remove Virtual Port Pool Warning Screen NOTE: Once the pool is removed, re-entry of a valid key is required to use the virtual port feature again. 3-28 D000003-016 Rev. A A 3 – FVIC Configuration and Monitoring Features Fibre Channel Configuration Statistics Figure 3-50 Statistics Submenu The Statistics submenu allows the user to monitor the following: • IB Port Statistics • FCP Target Device Statistics • SRP Initiator Statistics • FC Interconnect Statistics InfiniBand Port Statistics The IB Port Statistics area provides IB port information for the FVIC. Figure 3-51 IB Port Statistics To view port statistical information, do the following: D000003-016 Rev. A 3-29 3 – FVIC Configuration and Monitoring Features Fibre Channel Configuration S 1. From the Statistics submenu, select IB Port Stats. The IB Port Statistics window is displayed: Figure 3-52 FVIC IB Port Statistics NOTE: Ports 11 and 12 of the FVIC (e.g L01P11 and L01P12) represent the ports between the switch chip on the FVIC and one of the FVIC internal HCA chips. Port Statistics Field Descriptions Link State: Indicates whether the InfiniBand link associated with the physical port is up or down. Possible values are no state change, down, init, armed, active, and unknown. Physical State: Indicates whether the internal connection to the InfiniBand port is up or down. Possible values are No State Change, Sleep, Polling, Disabled, Training, Up, and Error Recovery. Link Down Default: Indicates the default down state as set by the Fabric Manager. Possible values are No State Change, Sleep, Polling, and Unknown. Active Link Width: Indicates the bandwidth of the link on the backplane. The bandwidth is specified as a multiplier of 2.5 Gbit/sec full duplex serial links. As an example, 4X specifies a bandwidth of 10 Gbit/sec. NOTE:Values of 1X are possible in this field with 4X IB cables if poor cable connections or defective 4X IB cables are used. 3-30 D000003-016 Rev. A A 3 – FVIC Configuration and Monitoring Features Fibre Channel Configuration Link Width Enabled: Indicates actual link width as opposed to the supported link width. Link Width Supported: Indicates the link width in terms of multipliers of 2.5 Gbit/sec full duplex serial links supported by the port. Active Link Speed: Indicates the speed of the full duplex serial link. This is either 2.5Gbps (single data rate, or SDR), or 5.0Gbps (double data rate, or DDR). Link Speed enabled: Indicates the actual link speed as opposed to the supported link speed. This could be 2.5Gbps (SDR), 5.0Gbps (DDR) or both. Link Speed supported: The supported link speed of the port. This could be 2.5Gbps (SDR), 5.0Gbps (DDR) or both. InfiniBand Statistics: Transmit 32 Bit Words: The number of 32-bit data words transmitted by the port, not including flow control and VCRC data. Receive 32 Bit Words: The number of 32-bit data words received by the port, not including flow control and VCRC data. Transmit Packets: The number of data packets transmitted by the port, not including flow control packets. Receive Packets: The number of data packets received by the port, not including flow control packets. Symbol Errors: The number of times a 8B10B encoding violation, or a disparity violation was detected. If multiple errors are detected simultaneously (in more than one lane), the counter only increments by one. The value of the counter is not incremented past 255. The Performance Manager may reset and/or consolidate the results of this counter. D000003-016 Rev. A 3-31 3 – FVIC Configuration and Monitoring Features Fibre Channel Configuration S Link Error Recovery: Indicates the number of times the link error recovery process happened successfully. The value of the counter is not incremented past 255. The Performance Manager may reset and/or consolidate the results of this counter. Link Downed: The number of times the link error recovery process failed. The value of the counter is not incremented past 255. The Performance Manager may reset and/or consolidate the results of this counter. Receive Errors: Number of errors received on the port. Remote Physical Errors Received: Number of remote physical errors received on the port. Transmit Discards: Number of port transmit discards. Local Link Integrity Errors: Number of local link integrity errors. Excessive Buffer Overrun: Number of excessive buffer overrun errors. Pkey Violations Inbound: Indicates the number of times an invalid partition key (PKey) was received. PKeys support an advanced InfiniBand feature for logically partitioning a physical subnet into logical access domains. Pkey Violations Outbound: Indicates the number of times an invalid PKey was sent. PKeys support an advanced InfiniBand feature for logically partitioning a physical subnet into logical access domains. Raw Violations Inbound: Number of times raw inbound packet discarded. Raw Violations Outbound: Number of times raw outbound packet was discarded. 3-32 D000003-016 Rev. A A 3 – FVIC Configuration and Monitoring Features Fibre Channel Configuration FCP Target Device Statistics Provides statistical information on any configured FC target device. This screen enables the user to monitor how much Fibre Channel traffic is moving through the FVIC card for a given FC target. Figure 3-53 FCP Target Device Statistics Button To view FCP target device statistics: 1. In the main status and navigation area, click on a FVIC. 2. From the FVIC menu, click on Statistics. 3. Click on FCP Target Device Statistics. The FCP Target Device Statistics window is displayed: Figure 3-54 FCP Target Device Statistics Window The following is a description of each field of the FCP Target Device Statistics window: • Name Contains the name defined by the user in the Fibre Channel Target Device Configuration Screen. • Connect Status Indicates whether the FVIC port is logged into the specified target. May be one of two states: D000003-016 Rev. A Up: Indicating that the device is connected. 3-33 S 3 – FVIC Configuration and Monitoring Features Fibre Channel Configuration Down: Indicating Attention/Error - that is, the device is a configured device - but the FVIC card was unable to establish a connection to the device. • Port Number Indicates the port numbers on the FVIC. • N Port ID N Port ID is a 24-bit address that identifies the target. The Fabric Controller dynamically assigns the N Port ID to the target. The N Port ID displayed in this field is the target ID and designates the address of the target on the SAN. • Node WWN A unique 64-bit identifier that is assigned by the device vendor. • Port WWN A unique 64-bit identifier that is assigned by the device vendor. • In Frame Size Indicates the size of frames that is sent to the FVIC card from the SAN. The size is reported in bytes. Valid values are: 128 512 1024 2048 • Out Frame Size Indicates the size of frames that the FVIC card sends to the devices on the SAN. • Class of Service Indicates the Fibre Channel Class of service. May be either Class 2 or Class 3. • Total Requests Total number of requests to a target device • Succeeded Requests Total number of successful requests to a target device. • Failed Requests Total number of failed requests to a target device. • Outstanding Requests 3-34 D000003-016 Rev. A A 3 – FVIC Configuration and Monitoring Features Fibre Channel Configuration Number of requests to the target device that have not yet completed. • Data In Indicates the total bytes read from the target device. • Data Out Indicates the total bytes written to the target device. SRP Initiator Statistics The SRP Initiator Statistics screen displays information about an InfiniBand Host (SRP initiator) connected to the InfiniBand fabric. This screen enables the user to monitor for host usage information. Figure 3-55 SRP Initiator Statistics Button To view SRP initiator statistics: 1. In the main status and navigation area, click on a FVIC. 2. From the FVIC menu, click on Configuration. 3. Click on SRP Initiator Statistics. The SRP Initiator Statistics window is displayed: Figure 3-56 SRP Initiator Statistics Window The following is a description of each field of the SRP Initiator Statistics window: • Name This field contains the Node Name that was assigned to the storage device by the user and/or the manufacturer of the storage device D000003-016 Rev. A 3-35 S 3 – FVIC Configuration and Monitoring Features Fibre Channel Configuration • Initiator ID 128 bit field in which: The first 64 bits are the port GUID of the SRP initiator port. The second 64 bits are extended SRP ID. • Active Connections Indicates how many active sessions an initiator has. • Total Requests The total number of requests from an initiator. • Succeeded Requests The total number of successful requests from an initiator. • Failed Requests The total number of failed requests from an initiator. • Outstanding Requests The number of requests outstanding from an initiator. • Data In The total number of bytes read by an initiator. • Data Out The total number of bytes written by an initiator. Fibre Channel Port Statistics The FC Port Statistics screen provides general connectivity status about the ports of the FVIC line card. Figure 3-57 FC Port Statistics Button To view FC port statistics: 3-36 D000003-016 Rev. A A 3 – FVIC Configuration and Monitoring Features Fibre Channel Configuration 1. Click on FVIC. 2. Click on Statistics. 3. Click on FC Port Statistics. The FC Port Statistics window is displayed: Figure 3-58 FC Port Statistics Window Following is a description of each field of the FC Port Statistics window: • Name This field displays the name that was assigned to the connection by the system. • Set Speed The FVIC port speed setting. • Actual Speed Actual speed of the FVIC port. • Topology Type of network topology. • N PORT ID A 24-bit address that the Fabric Controller dynamically assigns to the port. When the FVIC card logs onto the Fibre Channel fabric, the Fabric Controller assigns each port on the card an N Port ID. In this field, the N Port ID displays the source ID and designates the address of the FVIC port on the SAN. • Port WWN A unique 64-bit identifier that is assigned by the target device vendor. The FVIC uses WWNs and N-Port IDs to connect to FC storage devices. • Node WWN A unique 64-bit identifier that is assigned by the device vendor. • Loss of Signal Count Monitors port signal loss. Indicates the number of times the port has lost the optical signal entirely. D000003-016 Rev. A 3-37 S 3 – FVIC Configuration and Monitoring Features Fibre Channel Configuration • Loss of Sync Count Monitors port synchronization loss. Indicates the number of times the signal from the FVIC Fibre Channel port to the FC fabric was not of sufficient quality to support synchronization with the incoming data stream. • Invalid Transmission Count Monitors port invalid transmissions. Indicates the number of invalid transmissions received. The counter is created at boot time and increments as long as the FVIC is running. • Invalid CRC Count Monitors port Cyclic Redundancy Check errors. Indicates the number of times that a CRC error occurs. • Link Status Monitors the status of the port link state. Indicates whether the port is up or down. Fibre Channel Trap Control Figure 3-59 Fibre Channel Trap Control Submenu The FC Trap Control screen allows the user to set default trap scenarios related to FVIC line card. To set Fibre Channel traps: 1. Click FVIC. 2. Click Trap Control. 3-38 D000003-016 Rev. A A 3 – FVIC Configuration and Monitoring Features Fibre Channel Configuration 3. Click FC Trap Control. The FC Trap Control screen is displayed: Figure 3-60 FC Trap Control Screen 4. Select or deselect the desired trap(s). To generate an immediate trap, click the applicable Gen Trap button. 5. To save settings, click on Apply. Following are definitions for all Fibre Channel traps: • fciouInterconnectLinkUp The connection between the FVIC and an IB host is up. • fciouInterconnectLinkDown The connection between the FVIC and an IB host is down. • fciouTargetDeviceLinkUp The connection between the FVIC and an FC Target Device is up. • fciouTargetDeviceLinkDown The connection between the FVIC and an FC Target Device is down. NOTE: D000003-016 Rev. A The FVIC uses the SNMP target specified on the applicable 9000 switch chassis. 3-39 3 – FVIC Configuration and Monitoring Features Fibre Channel Configuration 3-40 S D000003-016 Rev. A 4 EVIC Configuration and Monitoring Features The following section provides detailed, task-oriented descriptions for configuring and monitoring the EVIC card and its feature functionality via the EVIC Menu. NOTE: For 9020 users, refer to the following sections for subnet management and licence key information: • “Fabric Manager Configuration” on page 2-52 • “Fabric Manager Control” on page 2-58 • “License Keys; Key Administration” on page 2-60 Figure 4-1 EVIC Menu D000003-016 Rev. A 4-1 4 – EVIC Configuration and Monitoring Features Logging S Logging The Logging submenu allows the user to view, set levels, reset levels, and purge the message log file. Figure 4-2 Logging Submenu The View Log button allows the user to view the message log. Figure 4-3 View Log Button 4-2 D000003-016 Rev. A A 4 – EVIC Configuration and Monitoring Features Logging To view the message log: 1. From the menu, select Logging. 2. Click View Log. The log message window is displayed: Figure 4-4 Sample Message Log To save a log message for further analysis, perform the following steps: 1. From the Messages window, select Edit, Select All (or CTRL + A). 2. Select Edit, Copy (or CTRL + C). 3. Open a text editing package, such as Notepad. 4. Select Edit, Paste (or CTRL + V). 5. Save as a plain text (.txt) file. Set Level Figure 4-5 Set Level Button The Set Level button allows the user to set log level configuration parameters for all software modules on the EVIC. To set log levels: D000003-016 Rev. A 4-3 S 4 – EVIC Configuration and Monitoring Features Logging 1. From the menu, select Logging. 2. From Logging, select Set Level. The Log System Configurator (Device Tab) window is displayed: Figure 4-6 Log System Configurator (Device Tab) The Device tab presents current log level configuration settings for the following software modules: • RAM = The circular log buffer contained in memory. To access the contents of this buffer, use the Chassis Viewer View Log button • Syslog = All output messages are saved to the syslog host. If a log level is ON, that type of message is sent to a syslog server. The syslog server is defined at the switch chassis level within Syslog Host tab of the Logging/Set Level submenu. From this screen, the user can change any of the log level settings for a specific software module by clicking on the Configure hyperlink, which displays a configuration screen: Figure 4-7 Device Tab: Software Module Configurator To change any Log Level settings: 1. Click the On-Off checkbox to the right of the setting. 2. Click the Submit button to save any changes. The following list describes each of the Log Level configuration parameters. 4-4 D000003-016 Rev. A A 4 – EVIC Configuration and Monitoring Features Logging • DUMP – Dump: Indicates that a problem has caused the system to produce a system dump file. In most circumstances, it is recommended that the user retrieve the dump that was produced. Support engineers may require the information contained in the dump file to diagnose the cause of the problem. • FATAL – Indicates that a non-recoverable system problem has occurred. The user should reboot the system or component and verify that the subsystem is fully functional to determine whether the fault has been corrected. If the problem persists, the user should contact the supplier. • ERROR – Indicates that a serious system error has occurred which might be recoverable. If the system exhibits any instability, the user should reboot the system or component. If errors persist, the user should immediately contact the supplier's technical support. • ALARM - Indicates that a serious problem has occurred which degrades capacity or service. If the error is recoverable, the user should correct the failure. If the alarm/failure persists, the user should reboot the system at a convenient time. If the problem is still not cleared, the user should contact the supplier. • WARNING - Indicates that a recoverable problem has occurred. The user does not need to take action. • PARTIAL - When more information is available, Partial causes additional message-related details to be displayed. • CONFIGURATION: An informational message indicating changes that a user has made to the system configuration. The user does not need to take any action. • INFO: Informational messages that occur during a system or component boot. The user does not need to take any action. • PERIODIC: An informational message containing periodic statistics. The user does not need to take action. • NOTICE: A message describing the number of changes the subnet manager (SM) detected on the last subnet sweep. This message includes totals for the number of switches, host channel adapters, end-ports, total physical ports and SMs that have appeared or disappeared from the fabric. This message will only be logged at the end of a subnet sweep if the SM had detected changes. Debug message levels 1 through 5: Debug messages are for supplier and/or QLogic engineering use and are not necessarily indicative of actions that an end user may need to take. • DEBUG1 – Messages that describe the states of connections and links. • DEBUG2 – Messages that describe major configuration changes or operations. D000003-016 Rev. A 4-5 4 – EVIC Configuration and Monitoring Features Logging S • DEBUG3 – Messages that describe the I/O flow. • DEBUG4 – Messages that contain the packet dumps within an I/O flow. I/O flows contain multiple packets. • DEBUG5 – Messages that contain the packet dumps within an I/O flow. I/O flows contain multiple packets. Important: When configuring the log levels to display debug messages, care should be taken to ensure that system performance issues are weighed against troubleshooting requirements. Generally, the higher the debug number the more information is written to the log. Specifically, debug 3-5 have the most effect on system performance. Preset Tab The Preset tab allows the user to quickly change log level settings for all software modules on the EVIC. Figure 4-8 Log System Configurator: Preset Tab To change the log level settings: 1. Click the On-Off checkbox to the right of the setting(s). 2. Click the Submit button to save any changes. 4-6 D000003-016 Rev. A A 4 – EVIC Configuration and Monitoring Features Logging Reset Log Levels The Reset Levels button resets the logging levels to their factory default values. Figure 4-9 Reset Levels Button To reset the logging levels: 1. From the menu, select Logging. 2. Click Logging. 3. Click Reset Levels. The Reset Levels window is displayed: Figure 4-10 Reset Log Levels Window 4. To reset the logging levels, click OK. Purging the Log The Purge Log button purges the RAM, clearing the log file(s). Figure 4-11 Purge Log Button To purge the log: D000003-016 Rev. A 4-7 S 4 – EVIC Configuration and Monitoring Features Maintenance 1. From the menu, click Logging. 2. Click Purge Log. The Purge Log confirmation window is displayed Figure 4-12 Purge Log Confirmation Window 3. Click OK. 4. The message log file is now purged. Maintenance Select Boot Image The Select Boot Image button allows the user to choose an alternative boot image for the EVIC. To select a boot image: Figure 4-13 Select Boot Image Button 1. From the menu, select Maintenance. 2. Click Select Boot Image. The Boot Image Selection screen is displayed: Figure 4-14 Boot Image Selection Screen 4-8 D000003-016 Rev. A A 4 – EVIC Configuration and Monitoring Features Configuration NOTE: By mousing over either radio button in the Boot Image Selection screen, the user can glean additional information about each file, as shown in Figure 4-15 below: Figure 4-15 Boot Image File Pop Up To choose a new boot image: 1. Click on a radio button of the new boot image. 2. Click Submit. Configuration Figure 4-16 Configuration Menu The Configuration submenu allows the user to perform the following tasks: • View Virtual NIC information. • Configure PAUSE. • Configure maximum transmission unit (MTU) size. • Configure VPort counts • Configure virtural LAN (VLAN) parameters D000003-016 Rev. A 4-9 4 – EVIC Configuration and Monitoring Features Configuration S • View configured virtural LAN (VLAN) information • Configure Ethernet link aggregation • Configure maximum packet age parameters • Configure port mirroring Virtual NIC Information The Virtual NIC Info button displays detailed information for all Virtual NICs associated with the EVIC. Figure 4-17 Virtual NIC Button To view the Virtual NIC Information window: 1. From Menu, select Configuration. 2. Select Virtual NIC. The Virtual NIC Information window is displayed. Figure 4-18 Virtual NIC Information Window For each Virtual NIC, the following information is displayed: • Virtual NIC A number identifying the Virtual NIC to the user. • In Use Indicates whether the IOC is in use by the Host. A value of 1 indicates the Host GUID identified in the Last Host GUID column is utilizing this Virtual NIC. A value of 0 indicates that no host is utilizing this Virtual NIC. • Last Host Name The name of the host that last used the IOC. 4-10 D000003-016 Rev. A A 4 – EVIC Configuration and Monitoring Features Configuration • Remote Host Types Identifies the type of remote IB host (e.g., VirtualNIC). This field is valid when the In Use field has a value of 1. • Last Host GUID The GUID of the Channel Adapter of the last host that used the IOC. If the In Use field has a value of 1, this is the GUID of the host currently utilizing the Virtual NIC. • Last Host Instance An index that the Host provides to the EVIC. This index is used by the EVIC in conjunction with the Last Host GUID and the IOC Number to determine whether the Virtual NIC currently exists in the Virtual NIC Information window. If the Virtual NIC does not exist, the EVIC adds the Virtual NIC to the table and assigns it a MAC address which has not been previously used by another host. If a virtual NIC does exist, the EVIC assigns the same MAC address it had previously used. Since the maximum number of Virtual NICs supported by a EVIC is 128, the connection request from a host will be refused if the limit has been reached. • Date Last Used If the IOC is currently in use, this field indicates the time at which it connected. If the IOC is not currently in use, this field indicates when the Host disconnected from the IOC • MTU The maximum transmission unit. Valid only when the In Use field value is 1. • MAC The default unicast address of the Virtual NIC. • IOC An index into the IOC table. • Ethernet Port Identifies which of the 2 EVIC Ethernet ports a Virtual NIC is utilizing to access the Ethernet network. • Control QP The queue pair number that the control path is using. • Data QP The queue pair number that the data path is using. D000003-016 Rev. A 4-11 4 – EVIC Configuration and Monitoring Features Configuration S Configure Pause As defined by the IEEE 802.3x specification, PAUSE is a simple stop-start form of flow control. A device can temporarily halt incoming data by sending a PAUSE frame, which is a parameter indicating the length of time the sender should wait before sending additional data. If enabled, the EVIC port issues a PAUSE command across the Ethernet port when the number of receive buffers currently posted to the MAC falls below a predetermined value. The PAUSE condition is relieved when the number of receive buffers currently posted to the MAC exceeds this predetermined value. An EVIC port will always react to a received PAUSE command. Figure 4-19 Configure Pause NOTE: Pause is enabled on both Ethernet ports by default. Disabling Pause is currently not an option. To view the Pause Configuration window: 1. From Menu, select Configuration. 2. Select Configure Pause. The Pause Configuration window is displayed: Figure 4-20 Pause Capability Window 3. For each EVIC port, select ENABLED or DISABLED. 4-12 D000003-016 Rev. A A 4 – EVIC Configuration and Monitoring Features Configuration Configure MTU Size Figure 4-21 Configure MTU Size To configure MTU size, perform the following tasks. 1. From Menu, select Configuration. 2. Select Configure MTU Size. The MTU Capability window is displayed: Figure 4-22 MTU Capability Window 3. In the Next field, enter a number between 1500 and 8174 (the maximum jumbo frame size currently supported). This value should be equal to or greater than the largest MTU size of any of the VirtualNIC host connections using the EVIC. If it is not, host will be unable to connect. NOTE:Values larger than 1500 bytes are used to support Jumbo Frames. When enabling Jumbo Frames, make certain that all devices in the Ethernet network are configured to support the same MTU size. Additionally, If any of the Ethernet ports are using tagged VLANs, the MTU size should be increased by 4 bytes (even if the port is not using jumbo frames), since a VLAN tag adds 4 bytes to the message size of a packet. Additionally, an MTU value that is larger than is required may degrade performance. 4. Click Apply. NOTE:The EVIC must be rebooted for the new MTU size to be updated. D000003-016 Rev. A 4-13 S 4 – EVIC Configuration and Monitoring Features Configuration ViPort Count Configuration Configuring ViPort counts allows the user to set the number of host connections allowed below the maximum supported by the VIO hardware. Doing so allows users to have more Ethernet buffers per ViPort when not using all the host connections (i.e. ViPorts). Figure 4-23 VPort Count 1. From Menu, select Configuration. 2. Select Configure ViPort Count. The ViPort Count window is displayed: Figure 4-24 ViPort Count Window Following is a high-level description for each field in the window: Current The current number of host virtual ports in use (view only). Next Represents the number of virtual ports that will be in use following a reboot. Can be modified by the user. Max The maximum number of virtual ports available (view only). 3. If the user has updated the Next field, click Apply. The ViPort Count will be updated following a reboot. 4-14 D000003-016 Rev. A A 4 – EVIC Configuration and Monitoring Features Configuration VLAN Configuration VLAN Configuration allows the user to configure the virtual local area network as specified in IEEE 802.1p and 802.1q. NOTE:When using tagged VLANs for Ethernet ports, the MTU size should be changed to 1504 since a VLAN tag adds 4 bytes to the message size of a packet. For more information on setting MTU size, please refer to the section “Configure MTU Size” on page 4-13. Figure 4-25 VLAN Configuration 1. From Menu, select Configuration. 2. Select VLAN Configuration. The VLAN Configuration window is displayed. NOTE:If the user is configuring VLAN tagging on Ethernet ports only (and not on any host ports), all default values for PortType=Host are acceptable, with the exception of the Host Ignores VLAN field, which should be set to Enabled. Port Type: Ethernet Figure 4-26 VLAN Configuration Window: Ethernet Ports Following is a high-level description for each field in the window: Port Type A user can select between "Ethernet" and "Host". If set to Ethernet, all fields on the screen are relative to the two external Ethernet ports of the EVIC. Ext Specifies the external Ethernet port number. Alias Alias is the user assigned name for the external port. PVID The Primary VLAN ID (PVID) of a port. For any incoming frame(s) without a VLAN tag, or with a VLAN ID of 0 this column specifies which VLAN the D000003-016 Rev. A 4-15 4 – EVIC Configuration and Monitoring Features Configuration S incoming frame(s) will be associated with. By default, untagged packets or those with a VLAN ID of 0 (also known as priority tagged frames) are assigned the VLAN specified by the PVID value (which defaults to 1). The PVID of a port should between 1 and 4094. Egress Rule This is a filter on the forwarded packets on a per-port basis. The user can enable or disable the filter. If the Egress Rules field is enabled, the Egress Tagging field is enabled. If Egress Rules are set to Disabled, a frame is sent out the external Ethernet port without a VLAN tag, or with a VLAN ID of 0 if a Priority value is to be included in the frame. If the Egress Rules are set to Enabled, and the VLAN of a packet is in the VLAN Membership field of the Ethernet port, the frame is sent out the external Ethernet port. Otherwise the frame is discarded (i.e., not sent out the Ethernet port).When the Egress Rule is enabled, the user should typically include the PVID value in the VLAN Membership. Egress Tagging Indicates whether the outgoing packet should be tagged with the specified VLAN ID. The tagging is enabled only if the Egress Rule is Enabled. A user can add the port to a particular VLAN by specifying the VLAN ID in this field. Deleting a VLAN ID from this field removes the port from this VLAN. Multiple VLAN IDs should be specified as a space-separated list. The valid VLAN ID values are between 1 and 4094. If the VLAN of a packet is listed in the Egress Tagging field for a specified external Ethernet port, the packet is sent with a VLAN tag. If the VLAN of the packet is not listed in the Egress Tagging field for a specified external Ethernet Port, the packet is sent untagged. An exception to this would be if a host has specified a priority value, in which case the packet is sent with a VLAN tag but with a VLAN ID of 0. The Egress Tagging field contains a list of space-separated VLAN IDs, which should be all the VLAN IDs for devices that understand VLAN tags reachable over a specified external Ethernet port. Ingress Rule Is a filter on the incoming packets (on a per-port basis). A user can enable or disable the filter. If the rule is enabled then the VLAN Membership and Ingress Frame Type fields are enabled. If this is set to Disabled, no filtering is done based on the VLAN tag (or absence of a VLAN tag). Any packet received on the port is forwarded to the Egress Rules of the appropriate host port for possible filtering. 4-16 D000003-016 Rev. A A 4 – EVIC Configuration and Monitoring Features Configuration If the Ingress Rules are set to Enabled, the VLAN Membership and Ingress Frame Type values are checked before forwarding the frame to the Egress Rules of the appropriate host port for possible filtering. VLAN Membership Indicates which VLANs a port is member of. A user can add or delete the port to a particular VLAN by specifying the VLAN ID. Multiple VLAN IDs should be specified as a space-separated list. A valid VLAN ID is between 1 and 4094. When Ingress Filtering is enabled, the following rules apply. Tagged frames received on the Ethernet port will be forwarded if the VLAN ID of the frame is in the VLAN Membership list. Untagged and priority tagged frames received on the Ethernet link will be forwarded if the PVID of the Ethernet port is in the VLAN Membership list. Otherwise the frame is discarded. Ingress Frame Type The Ingress Frame Type is a rule controlling whether non-VLAN tagged frames are accepted. When the Ingress Frame Type is set to Admit All, all packets (both VLAN and non-VLAN tagged) are accepted. Otherwise, only packets that arrived with an explicit VLAN tag are accepted. Default Priority Indicates the 802.1p-based priority of a packet if the incoming frame does not contain a VLAN tag. The priority should be between 0 and 7. Port Type: Host Figure 4-27 VLAN Configuration Window: Host Ports Following is a high-level description for each field in the window: Port Type A user can select between "Ethernet" and "Host". If set to Host, all fields on the screen are relative to the 400 virtual ports between hosts running the VNIC driver and the EVIC. D000003-016 Rev. A 4-17 4 – EVIC Configuration and Monitoring Features Configuration S NOTE:An EVIC contains both Ethernet and "virtual" ports. A virtual port is a logical port going from the EVIC to an InfiniBand host. When a VirtualNIC host connects to an IOC of the EVIC, the EVIC assigns a virtual port to the connection. Port Range A dropdown list where a user selects virtual ports (in 6-port increments). Selecting one of the port ranges displays the information for those virtual ports. Virtual Port Displays the virtual port numbers selected in the Port Range dropdown list. PVID The Primary VLAN ID (PVID) of a port. For any frame(s) without a VLAN tag, or with VLAN ID of 0 this column specifies which VLAN the frame(s) will be associated with. By default, untagged packets or those with a VLAN ID of 0 (also known as priority tagged frames) are assigned the VLAN specified by the PVID value (which defaults to 1). Packets from a host are untagged unless the interface has been set up with a VLAN tag (e.g., through the use of the Linux vconfig command). The PVID of a port must be between 1 and 4094. Egress Rule This is a filter on the forwarded packets on a per-port basis. The user can enable or disable the filter. If the Egress Rules field is enabled, the Egress Tagging field is enabled. If Egress Rules are set to Disabled, a frame is sent out the external Ethernet port without a VLAN tag, or with a VLAN ID of 0 if a Priority value is to be included in the frame. If the Egress Rules are set to Enabled, and the VLAN of a packet is in the VLAN Membership field of the Ethernet port, the frame is sent out the external Ethernet port. Otherwise the frame is discarded (i.e., not sent out the Ethernet port).When the Egress Rule is enabled, the user should typically include the PVID value in the VLAN Membership. In general, the Egress Rules should be Enabled only if the host interface has been configured to be in a VLAN (e.g., through the use of the Linux vconfig command). Ingress Rule Is a filter on the incoming packets (on a per-port basis). A user can enable or disable the filter. If the rule is enabled then the VLAN Membership and Ingress Frame Type fields are enabled. If this is set to Disabled, no filtering is done based on the VLAN tag (or absence of a VLAN tag). Any packet received on the port is forwarded to the Egress Rules of the appropriate host port for possible filtering. 4-18 D000003-016 Rev. A A 4 – EVIC Configuration and Monitoring Features Configuration If the Ingress Rules are set to Enabled, the VLAN Membership and Ingress Frame Type values are checked before forwarding the frame to the Egress Rules of the appropriate host port for possible filtering. NOTE: A frame coming from a Linux host will have a VLAN tag only if the host interface has been configured to send vlan tags (e.g., with a 'vconfig' command). VLAN Membership Indicates which VLANs a port is member of. A user can add or delete the port to a particular VLAN by specifying the VLAN ID. Multiple VLAN IDs should be specified as a space-separated list. A valid VLAN ID is between 1 and 4094. When Ingress Filtering is enabled, the following rules apply. Tagged frames received on the Ethernet port will be forwarded if the VLAN ID of the frame is in the VLAN Membership list. Untagged and priority tagged frames received on the Ethernet link will be forwarded if the PVID of the Ethernet port is in the VLAN Membership list. Otherwise the frame is discarded. Ingress Frame Type The Ingress Frame Type is a rule controlling whether non-VLAN tagged frames are accepted. When the Ingress Frame Type is set to Admit All, all packets (both VLAN and non-VLAN tagged) are accepted. Otherwise, only packets that arrived with an explicit VLAN tag are accepted. Default Priority Indicates the 802.1p-based priority of a packet if the incoming frame does not contain a VLAN tag. The priority should be between 0 and 7. Host Ignores VLAN If set to Enabled, the host ignores the current VLAN configuration. This field should be set to Disabled if the host is specifying a VLAN (e.g., the vconfig command is used on the interface on a Linux host). Host Name For virtual ports that are currently connected, this field indicates the host name associated with a specific virtual port. IOC The IOC number of the EVIC associated with a virtual port. In an /etc/infiniband/qlgc_vnic.cfg file, each 'create' item defines a virtual port. The IOC number for a particular virtual port comes from the 'create' block for the virtual port. The Host Instance value also comes from the 'create' block for the virtual port. These fields are only valid for the virtual ports in use. D000003-016 Rev. A 4-19 S 4 – EVIC Configuration and Monitoring Features Configuration Host Instance For each instance that a host is connected to the same IOC, a unique number must be assigned. The default value is zero (range = 0-255). Host GUID The globally unique indentifier for a host port GUID. This is the port GUID of the HCA port of the virtual port specified in a 'create' block of an /etc/infiniband/qlgc_vnic.cfg file of a host. This field is only valid for the virtual port(s) in use. NOTE: For information on assigning a host connection to a specific viPort using the ethVirtAssignedHostSet command, refer to the section "Appendix D - Command Line Interface". VLAN Configuration Example An Ethernet network can be accessed via Ethernet port 1, which contains Ethernet hosts in VLAN 2 and Ethernet hosts in VLAN 4094. InfiniBand (IB) host 1 needs to be a member of VLAN 2 and IB host 2 needs to be a member of VLAN 4094. In this example, IB host 1 is virtual port 1 and IB host 2 is virtual port 2. Given these parameters, the following configuration allows communication between the IB hosts and the appropriate Ethernet hosts: Figure 4-28 VLAN Configuration Example: Ethernet Ports Figure 4-29 VLAN Configuration Example: Host Ports NOTE: 4-20 The PVID on the Ethernet port does not need to be changed since all frames received from the Ethernet network will have VLAN tags and non-zero VLAN IDs. D000003-016 Rev. A A 4 – EVIC Configuration and Monitoring Features Configuration VLAN Setup This section describes the necessary procedures to configure an IB host to communicate with an Ethernet host(s), both hosts using VLAN tags. Figure 4-30 VLAN Setup IB Host 1 using VLAN tag 11 IB EVIC Ethernet Ethernet Host using VLAN tag 11 Host Interface Configuration 1. On a Linux Host, use the vconfig command to assign the interface in the qlgc_vnic.cfg file to VLAN 11 (using the example in Figure 4-30). Assume that the qlgc_vnic file contains the line: {CREATE; NAME="eioc2"; PRIMARY={IOCGUID=0x66a02e1000110; INSTANCE=1; PORT=1; } } and qlgc_vnic has been started (/etc/init.d/qlgc_vnic start). 2. Using the vconfig command, create an interface in VLAN 11: vconfig add eioc2 11 This creates an interface named eioc2.11 that sends/receives packets with a VLAN tag of 11. Make certain there is an /etc/sysconfig/network-scripts/ifcfg-eioc2.11 file, as well as the file /etc/sysconfig/network-scripts/ifcfg-eioc2 (on some kernels the name of the directory will be /etc/sysconfig/network instead of /etc/sysconfig/network-scripts). For the remainder of this section, assume that the IP address of eioc2.11 is 172.26.48.25. EVIC Configuration Access the EVIC CLI using the rlogin <slot #> command within the switch CLI. Find the interface with the hostname (i.e., IBHost1 in this example), IOCGuid (i.e., 0x66a02e1000110 in this example), and Instance (i.e., 1 in this example) using the ethVirtInfoTable command. Assume that the host/IOC/Instance combination was found in the row for virtPort 56. The user must perform the following steps for the host ports (i.e., viPorts) and the Ethernet ports to allow VLAN tagging between the host virtual port virtPort 56 and the Ethernet D000003-016 Rev. A 4-21 S 4 – EVIC Configuration and Monitoring Features Configuration network. In the example assume that external Ethernet port 2 is connected to the Ethernet network. Host Port Configuration 1. Enable Egress rules on virtPort 56 with the command vlanEgressRuleSet command: vlanEgressRuleSet vi 56 1 2. Enable Ingress Rules on virtPort 56 with the command vlanIngressRuleSet: vlanIngressRuleSet vi 56 1 3. Allow packets in VLAN 11 to be sent to virtPort 56 with the command vlanMapMemberSet: vlanMapMemberSet vi 56 11 1 4. Remove the Ignore VLAN option on virtPort 56 with the command ethVirtIgnoreVlanSet: ethVirtIgnoreVlanSet 56 The configuration of the host ports on the EVIC is now complete. Next, the Ethernet ports of the EVIC must also be configured. Ethernet Port Configuration Ethernet ports are configured in a similar way. As in the previous example, Ethernet port 2 is used. To configure Ethernet ports, do the following: 1. Enable egress rules on Ethernet Port 2 with the command vlanEgressRuleSet: vlanEgressRuleSet eth 2 1 2. Tag packets going to Ethernet port 2 with VLAN tag 11 with the command vlanMapTaggedSet: vlanMapTaggedSet eth 2 11 1 3. Enable Ingress rules on Ethernet port 2 with the command vlanIngressRuleSet: vlanIngressRuleSet eth 2 1 4. Allow packets in VLAN 11 to be sent over Ethernet port 2 with the command vlanMapMemberSet vlanMapMemberSet eth 2 11 1 Additional Notes All of these commands are active when issued, with the exception of the ethVirtIgnoreVlanSet command. This command takes effect the next time the virtPort comes up. A virtPort comes up when the qlgc_vnic driver is started and the EVIC is also up. Therefore, either the EVIC must be rebooted or qlgc_vnic 4-22 D000003-016 Rev. A A 4 – EVIC Configuration and Monitoring Features Configuration must be restarted on the host at the other end of the virtPort. Restart qlgc_vnic as follows: /etc/init.d/qlgc_vnic restart Once done, any VLAN definitions made containing interfaces referenced in the qlgc_vnic.cfg file need to be redone. In the case of this example, the command vconfig add eioc2 11 needs to be reissued. Alternative VLAN Setup This is an example explains how to setup two interfaces on a host, each on a different VLAN. Figure 4-31 Alternative VLAN Setup EVIC Host External Port 1 VLAN 10 and VLAN 20 Traffic Network NOTE: Virtual Port 1 VLAN 10 Traffic eioc10 Virtual Port 2 VLAN 20 Traffic eioc20 For this example, eioc10 will be on VLAN 10 and eioc20 will be on VLAN 20. 1. Host configuration. Edit the file /etc/sysconfig/qlgc_vnic.cfg as follows: {CREATE; NAME="eioc10"; PRIMARY={IOCGUID=0x66a01e1000abc; INSTANCE=10; PORT=1; } } {CREATE; NAME="eioc20"; PRIMARY={IOCGUID=0x66a01e1000abc; INSTANCE=20; PORT=1; } } This sets up the two interfaces to the same external port 1 on the EVIC with a GUID of 00066A01E1000ABC. This is possible because each INSTANCE is different. The instance and name are not required to be the same as the VLAN number. The two virtual ports on the EVIC that have been setup need to be configured. 2. From the EVIC GUI, select Configuration, VLAN Configuration and Port Type as Host. Set the PVID to the VLAN number 10 or 20 for the virtual port that corresponds to the correct HostName, HostInstance, and HostGUID. Set the Host Ignores VLAN field to Enable. After enabling, either restart the VNIC module or reboot the EVIC. 3. Select Configuration, VLAN Configuration and Port Type Ethernet. Enable Ingress Rules and set the VLAN Membership to include the two desired VLANs 10 and 20. Additionally, enable Egress Rules and specify VLAN IDs (10 and 20) in the Egress Tagging field. D000003-016 Rev. A 4-23 S 4 – EVIC Configuration and Monitoring Features Configuration The EVIC will know that traffic coming from eioc10 is on VLAN 10 and eioc20 is on VLAN 20. Link Aggregation Link Aggregation (or trunking) is a method of combining physical network links into a single, logical link for increased bandwidth. Link Aggregation also provides load balancing where processing and communication activity is distributed across several links in a trunk to reduce the likelihood that a single link becomes over-subscribed. Figure 4-32 Link Aggregation 1. From Menu, select Configuration. 2. Select Link Aggregation. The Link Aggregation window is displayed: Figure 4-33 Link Aggregation Window Following is a high-level description for each field in the window: Ext The external Ethernet Port number that applies to the remainder of the settings in each row. This field is viewable only. Link Status Indicates whether the Ethernet link is up or down (viewable only). LACP Enabled Indicates whether the Link Aggregation Control Protocol (LACP , IEEE 802.3ad ) is enabled on the port. If LACP is enabled (i.e. LACP Enabled = Yes) then the current aggregation number is selected automatically and the actor key (1- 65535) should be specified (see 'actor key' definition later in this section). If LACP is disabled (i.e., LACP Enabled = No), then the aggregation index should be specified (see Manual Agg# definition below). Disabling LACP is also known as manual mode. Current Agg # 4-24 D000003-016 Rev. A A 4 – EVIC Configuration and Monitoring Features Configuration This field describes the aggregation where a port is currently located. If two rows contain the same value, they are part of the same aggregation. Manual Agg # If LACP is disabled (i.e., Lacp Enabled = No), then the user sets this field to describe which ports should be in the same aggregation. LACP State Indicates the LACP state (OK, N/A, or Fail). This field is view only. Failover The minimum number of links that must be remaining in an aggregation in order for aggregation failover to occur. When failover occurs for a port, traffic that would normally be directed over the link that went down is redistributed across the remaining links in the aggregation. Ports that are running in failover mode do not count towards the number of remaining links. For an EVIC, this value should be 0 or 1. If the value is 0, failover is disabled. In this case when a link goes down, all viPorts using that Ethernet port will receive a 'link down' event regardless of the state of other links in the aggregation. This causes the viPort to failover to the Secondary definition (this could possibly be a different EVIC). If the value is 1 and a link goes down, there must be 1 or more remaining links in the aggregation for the viPort to consider the port to still be up and can continue to send data. Actor Key If LACP is enabled, then the user inputs an identical Actor Key in each row that is to be part of the same aggregation. If LACP is disabled, this field is greyed out. Valid values are 1-65535. Actor ID This field is set by the EVIC firmware. A remote Ethernet switch uses the combination of Actor ID and Actor Key to uniquely-define an aggregation.. This field is view only. Partner Port This field is significant for only the ports having LACP Enabled. For those ports, this indicates the the port number of the remote switch at the opposite end of the Ethernet cable. This field is view only. Partner Key This field is significant for only the ports having LACP Enabled. For those ports, this indicates the partner key for the aggregation of the remote switch at the opposite end of the Ethernet cable. This field is view only. D000003-016 Rev. A 4-25 4 – EVIC Configuration and Monitoring Features Configuration S Partner ID This field is significant for only the ports having LACP Enabled. For those ports, this indicates the partner ID for the aggregation of the remote switch at the opposite end of the Ethernet cable. This field is view only. Maximum Packet Age Maximum Packet Age allows the user to view and/or set the maximum packet age value (in milliseconds). Figure 4-34 Maximum Packet Age 1. From Menu, select Configuration. 2. Select Max Packet Age. The Maximum Packet Age window is displayed: Figure 4-35 Maximum Packet Age Window 3. To change the maximum packet age, click in the Current text box and enter the new value (default equals 65,000 milliseconds). 4. Click Apply. Port Mirroring Port mirroring is used for duplicating the traffic of a port (or ports) to another port for the purpose of traffic and/or network monitoring. Figure 4-36 Port Mirroring 4-26 D000003-016 Rev. A A 4 – EVIC Configuration and Monitoring Features Configuration 1. From Menu, select Configuration. 2. Select Port Mirroring. The Port Mirroring window is displayed: Figure 4-37 Port Mirroring Window Following is a high-level description for each field in the window: Mirror Port The Mirror Port values represent the two external Ethernet ports of the EVIC. When a Mirror Port is enabled, traffic from a monitored port is sent out the Mirror Port. For example, if the mirror state for mirror port 1 is enabled, and the monitor port field for mirror port 1 has a value of 2, then traffic sent and received on ports 2 is sent out port 1 (that may have some form of traffic monitoring device attached). Mirror State Mirroring can be enabled or disabled on a port. Monitor Port External port(s) whose traffic is duplicated to another port (i.e., the Mirror Port) for network monitoring. The selections are one or two. NOTE:The monitor port must be a port different then the mirror port (e.g., port 1 cannot monitor itself). 3. Once any changes are made, click Apply. D000003-016 Rev. A 4-27 S 4 – EVIC Configuration and Monitoring Features Statistics Statistics Figure 4-38 Statistics Submenu The Statistics submenu allows the user to monitor the following • IB Port Statistics • Ethernet Port Configuration and Statistics InfiniBand Port Statistics The IB Statistics area provides IB port statistical information for the EVIC. Figure 4-39 IB Port Statistics To view port statistical information, do the following: 4-28 D000003-016 Rev. A A 4 – EVIC Configuration and Monitoring Features Statistics 1. Select an EVIC port or from the Statistics submenu select IB Port Stats. The IB Port Statistics window is displayed.: Figure 4-40 IB Port Statistics The following are descriptions for each field in the Port Statistics area: Link State: Indicates whether the InfiniBand link associated with the physical port is up or down. Possible values are no state change, down, init, armed, active, and unknown. Physical State: Indicates whether the internal connection to the InfiniBand port is up or down. Possible values are No State Change, Sleep, Polling, Disabled, Training, Up, and Error Recovery. Link down default: Indicates the default down state as set by the Fabric Manager. Possible values are No State Change, Sleep, Polling, and Unknown. Active Link Width: Indicates the bandwidth of the link on the backplane. The bandwidth is specified as a multiplier of 2.5 Gbit/sec full duplex serial links. As an example, 4X specifies a bandwidth of 10 Gbit/sec. Link Width enabled: Indicates actual link width as opposed to the supported link width. Link Width supported: Indicates the link width in terms of multipliers of 2.5 Gbit/sec full duplex serial links supported by the port. Active Link Speed: D000003-016 Rev. A 4-29 4 – EVIC Configuration and Monitoring Features Statistics S Indicates the speed of the full duplex serial link. If the link width is 4x, the speed of each link is multiplied by 4 to determine the bandwidth of the link. DDR links have a link speed of 5.0, while SDR links have a link speed of 2.5. Link Speed enabled: Indicates the actual link speed as opposed to the supported link speed. Link Speed supported: The supported link speed of the port. InfiniBand Statistics: Transmit 32 Bit Words: The number of 32-bit data words transmitted by the port, not including flow control and VCRC data. Receive 32 Bit Words: The number of 32-bit data words received by the port, not including flow control and VCRC data. Transmit Packets: The number of data packets transmitted by the port, not including flow control packets. Receive Packets: The number of data packets received by the port, not including flow control packets. Symbol Errors: The number of times a 8B10B encoding violation, or a disparity violation was detected. If multiple errors are detected simultaneously (in more than one lane), the counter only increments by one. The value of the counter is not incremented past 255. The Performance Manager may reset and/or consolidate the results of this counter. Link Error Recovery: Indicates the number of times the link error recovery process happened successfully. The value of the counter is not incremented past 255. The Performance Manager may reset and/or consolidate the results of this counter. Link Downed: The number of times the link error recovery process failed. The value of the counter is not incremented past 255. The Performance Manager may reset and/or consolidate the results of this counter. 4-30 D000003-016 Rev. A A 4 – EVIC Configuration and Monitoring Features Statistics Receive Errors: Number of errors received on the port. Remote Physical Error Received: Number of remote physical errors received on the port. Transmit Discards: Number of port transmit discards. Local Link Integrity Errors: Number of local link integrity errors. Excessive Buffer Overrun: Number of excessive buffer overrun errors. Pkey Violations Inbound: Indicates the number of times an invalid partition key (PKey) was received. PKeys support an advanced InfiniBand feature for logically partitioning a physical subnet into logical access domains. Pkey Violations Outbound: Indicates the number of times an invalid PKey was sent. PKeys support an advanced InfiniBand feature for logically partitioning a physical subnet into logical access domains. Raw Violations Inbound: Number of times raw inbound packet discarded. Raw Violations Outbound: Number of times raw outbound packet was discarded. Port Configuration and Statistics Figure 4-41 Port Configuration and Statistics Button The EVIC Port Configuration/Statistics window presents: • EVIC port configuration information. • Common RMON Ethernet Statistics (on a per EVIC port basis). To view EVIC port statistics: D000003-016 Rev. A 4-31 4 – EVIC Configuration and Monitoring Features Statistics S 1. From Menu, select Statistics. 2. Select Port Configuration/Statistics. The Port Statistics Window is displayed. NOTE:At the user’s discretion, the Port State for each EVIC Ethernet port can be enabled or disabled. Figure 4-42 Port Statistics Overview The following are high-level descriptions for the EVIC port and Ethernet Statistics (EtherStats) displayed in the EVIC Port Configuration/Statistics Window. State Values are Enabled or Disabled. Set Speed The default value is full-10,000. STP State Indicates whether Spanning Tree Protocol (STP) is enabled or disabled. Link Indicates whether the link is up or down. Actual Speed Indicates the actual performance of the link as opposed to the set speed. Type Indicates the type of link layer connection. RMON (etherStats) Drop Events The total number of events in which packets were dropped due to lack of resources. 4-32 D000003-016 Rev. A A 4 – EVIC Configuration and Monitoring Features Statistics Octets The total number of octets of data received on the network. Pkts The total number of packets (including bad packets, broadcast packets, and multicast packets) received. BroadcastPkts The total number of good packets received that were directed to the broadcast address. Multicast Pkts The total number of good packets received that were directed to a multicast address. CRCAlignErrors CRC = Cyclic Redundancy Check. The total number of packets received that had a length of between 64 and 1518 octets, inclusive, but had either a bad Frame Check Sequence (FCS) with an integral number of octets (FCS Error) or a bad FCS with a non-integral number of octets (Alignment Error). UndersizePkts The total number of packets received that were less than 64 octets long, but were otherwise well formed. OversizePkts The total number of packets received that were longer than 1518 octets, but were otherwise well formed. Fragments The total number of packets received that were less than 64 octets in length (excluding framing bits but including FCS octets) and had either a bad Frame Check Sequence (FCS) with an integral number of octets (FCS Error) or a bad FCS with a non-integral number of octets (Alignment Error). Jabbers The total number of packets received that were longer than 1518 octets (excluding framing bits, but including FCS octets), and had either a bad Frame Check Sequence (FCS) with an integral number of octets (FCS Error) or a bad FCS with a non-integral number of octets (Alignment Error). Collisions The best estimate of the total number of collisions on this Ethernet segment. D000003-016 Rev. A 4-33 4 – EVIC Configuration and Monitoring Features Statistics S Pkts64Octets The total number of packets (including bad packets) received that were 64 octets in length. Pkts65to127Octets The total number of packets (including bad packets) received that were between 65 and 127 octets in length inclusive. Pkts128to255Octets The total number of packets (including bad packets) received that were between 128 and 255 octets in length inclusive. Pkts256to511Octets The total number of packets (including bad packets) received that were between 246 and 511 octets in length inclusive. Pkts512to1023Octets The total number of packets (including bad packets) received that were between 512 and 1023 octets in length inclusive. Pkts1024to1518Octets The total number of packets (including bad packets) received that are 1024 or greater. 4-34 D000003-016 Rev. A A Troubleshooting and Technical Reference This section describes troubleshooting scenarios and technical reference information for the SilverStorm 9000 series. The document is organized in the following manner: Hardware Checks Troubleshooting Scenarios Hardware Checks Switch Problem The Switch has no power Fix Ensure that the power cord(s) is attached to the Switch and the power outlet. Ensure that the power supply(s) is seated properly. Power Supply Problem Fix DC OK LED is off Indicates DC power failure or no DC power is present AC OK LED is off Indicates AC power failure or no AC power is present D000003-016 Rev. A A-1 S A – Troubleshooting and Technical Reference Hardware Checks Fan Problem Fix Red LED is lit Call Tech Support Fan not running Ensure fan is seated properly. If fan continues to be inoperable, call Tech Support OOB Ethernet RJ45 Port Problem Fix The RJ45 Ethernet Port(s) have a RJ45 Cable with a Noise Problem: This problem would occur if there is a RJ45 cable that has poor shielding or contact of pins. Ensure that the cable is a straight-through Cat 5 cable (not a crossover cable). Absence of Ethernet link and/or intermittent Ethernet connectivity. Ensure that the Ethernet cable is Cat 5E or Cat 6 certified. If using a straight-through cable and still experiencing this problem, test with a known good cable. Leaf Module IB Ports Problem No LED Fix Make sure the IB cable is properly connected to both the leaf port and to the destination device. Make sure the other end of the connection is plugged into a functioning HCA or switch. Make sure the cable does not exceed maximum distances. Bad IB Cable A-2 Test with a known good IB cable. D000003-016 Rev. A A A – Troubleshooting and Technical Reference Troubleshooting Scenarios Troubleshooting Scenarios InfiniBand This section documents common problems seen with the SilverStorm 9000 series switches. Invalid IP Address entered via Console Port Symptoms Cannot access the Chassis Viewer browser window. The browser window times out and Chassis Viewer will not come up. Resolution / Workaround 1. Invalid IP Address entered for the chassis or spine modules via the console port. Use the showChassisIpAddr command to be sure the address has been set correctly. 2. If attempting to access the switch from a remote LAN, ensure that the default gateway/default route addresses are set correctly. Nodes cannot be seen in SilverStorm Fabric Viewer Symptoms When viewing the IB fabric with the SilverStorm Fabric Viewer, no nodes are seen. Resolution / Workaround 1. Possibly a bad IB cable(s). Ensure that there is a Blue LED illuminated on the leaf module IB ports of the switch. Make sure that all devices (nodes) can be seen in the Fabric Viewer window. 2. Check the cables and connections subnet manager and the rest of the fabric. 3. The subnet manager may not be running on the IP address specified in Fabric Viewer. Check the IP address and make sure the subnet manager is in the Active state on that node. Depending on the configuration of that node, following a reboot the subnet manager may or may not restart. D000003-016 Rev. A A-3 A – Troubleshooting and Technical Reference Troubleshooting Scenarios S Notes A-4 D000003-016 Rev. A