1
Dell PowerEdge R710
solution
VM 1 OPM
VM 2 OPM
VM 3 OPM
VM 4 OPM
VM 5 OPM
VM 6 OPM
VM 7 OPM
Minimum OPM
Run 1
Run 2
Run 3
16,218.6
17,261.6
17,012.3
17,335.5
17,537.8
17,093.4
16,029.3
16,029.3
16,233.8
17,146.0
16,887.3
17,040.7
16,795.8
17,324.7
15,360.9
15,360.9
15,036.6
16,496.1
16,289.6
16,471.6
15,901.0
16,325.2
15,697.6
15,036.6
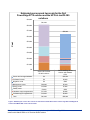
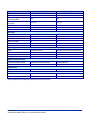
Figure 6: Individual VM scores and the minimum VM score for the Dell PowerEdge R710 solution. Higher OPM numbers are better.
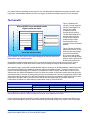
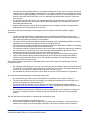
Figure 7 shows the specific power results during the median run of the Dell PowerEdge R710 server with the Dell
EqualLogic PS6000 storage array and the HP ProLiant DL385 server with the HP StorageWorks MSA30 storage
array. Lower numbers are better.
To calculate the power, we average the power we recorded during our workload measurement period, minutes 24
through 29 of the test, for both server and storage, with total power the sum of both. For the idle power, we
averaged the server and storage power and then took the sum as total. For the idle power, we allowed the system
to sit for 10 minutes after booting to the desktop and then started 2 minutes of idle power capture.
HP ProLiant DL385 solution
Dell PowerEdge R710 solution
Power (median results)
Workload
Server
Storage
Total
314
257
571
374
496
869
Server
287
223
Idle
Storage
254
475
Total
541
698
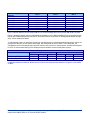
Figure 7: Median power results, in watts, for the Dell PowerEdge R710 solution and the HP ProLiant DL385 solution while running
the DVD Store workload and while idle. Results shown are from the runs that produced the OPM scores in Figure 5. Lower numbers
are better.
Principled Technologies, Inc.: Initial investment payback analysis: Dell PowerEdge R710
solution with VMware ESX vs. HP ProLiant DL385 solution
7