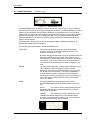
1
User Manual
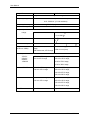
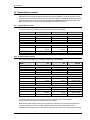
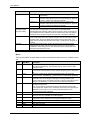
Sub-Tab
Waveforms
Cur Graph
Cur Spectrum
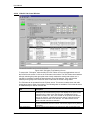
Description
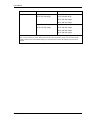
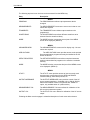
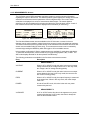
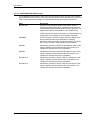
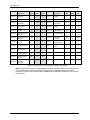
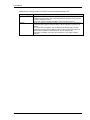
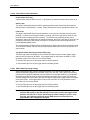
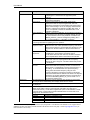
MIL-STD-704(C-F) specifications. The amount of imbalance
is displayed in % of total VA to the right of the power
1
readings.
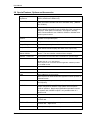
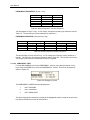
Inrush Current (A)
Displays peak current detected per phase in Amps since last
measurement was taken.
Power Factor
Displays power factor for each phase. Power factor
measurement data is compared against MIL-STD-704
Appendix A specification for both leading and lagging power
factors. When testing to rev A, the category of EUT must be
selected. Categories are defined in the MIL-STD-704A. If
one or more phases is outside the allowable limits, a Fail
indication is displayed.
Current Distortion
Displays Total Current Distortion for each phase in percent of
(%)
fundamental current. No limits are applied although the user
can set a maximum limit for this parameter if needed in the
“MS704_Distortion_Limits.ini” setting file by adding “Ithd =
n.n” in either PHASES_1 or PHASES_3 sections..
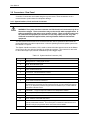
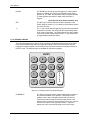
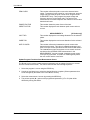
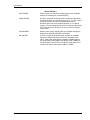
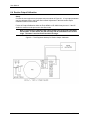
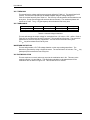
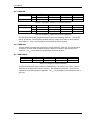
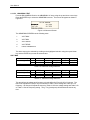
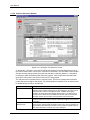
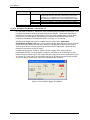
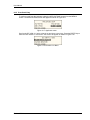
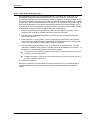
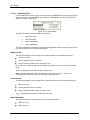
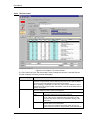
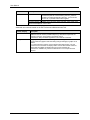
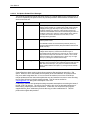
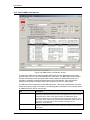
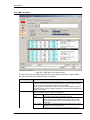
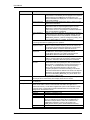
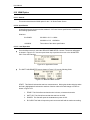
The bottom half of the Parameters tab contains user controls and a text entry field
for entering observations regarding the EUT operation.
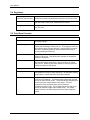
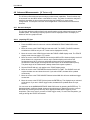
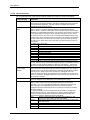
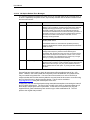
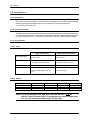
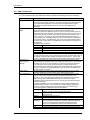
Test Frequency
The frequency selection drop down control is active only for
Dropdown control
Table SVF and TVF modes (Variable Frequency) and can be
used to set the frequency at which data from the EUT is to be
acquired. For all other modes, it is fixed to either 400 Hz or
DC.
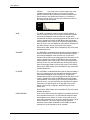
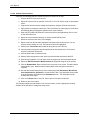
Acquire Data at all
This button causes data to be acquired at all frequencies
frequencies
available in the Test Frequency Dropdown control.
For all tables other than SVF and TVF, this button functions
like the Update Meas. Button located above the sub tabs.
Abort Meas.
This button aborts measurements in progress. In case of
Tables SVF and TVF, acquiring data at all 12 frequency
settings can take a long time. This button allows this process
to be aborted.
Read Meas. Data
This button reads measurement data from disk. Each time
from File
measurement data is acquired by the GUI, it is saved to an
ASCII text file. A separate file is used for each frequency or
DC setting. To recall data taken at a specific frequency
setting, select the desired frequency using the Test
Frequency Dropdown control before clicking on this button.
Note that all measurement data files are saved in the Reports
subdirectory of the GUI application directory using file name
convention “MeasData_MS704_nnn_Hz.txt” where „nnn‟ is
the frequency setting or DC.
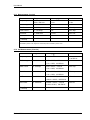
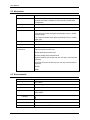
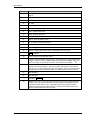
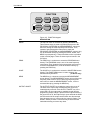
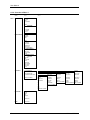
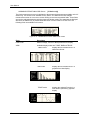
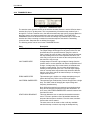
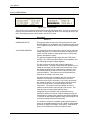
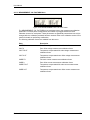
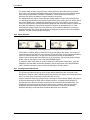
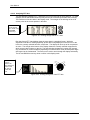
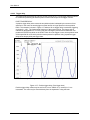
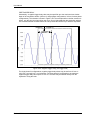
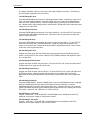
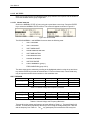
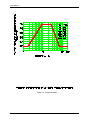
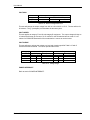
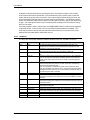
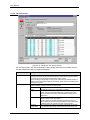
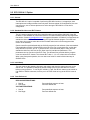
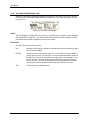
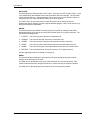
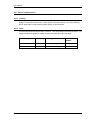
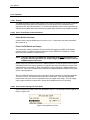
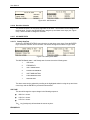
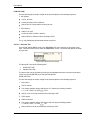
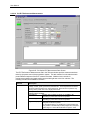
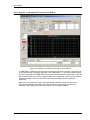
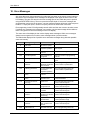
This tab displays the voltage and current waveform (time domain) for each phase.
The sample rate is automatically set to display about 20 msec of time.
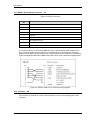
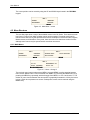
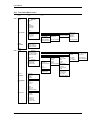
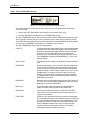
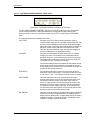
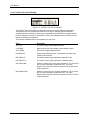
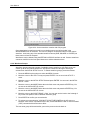
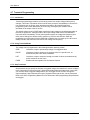
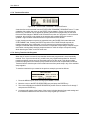
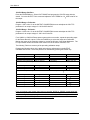
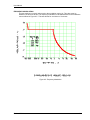
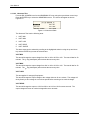
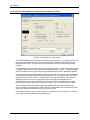
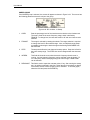
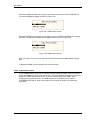
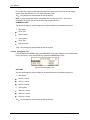
This tab displays the Current harmonics in a bar graph format. Up to 50 harmonics
are displayed.
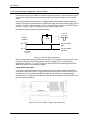
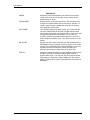
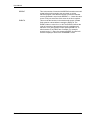
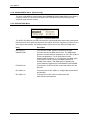
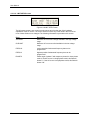
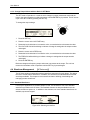
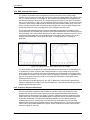
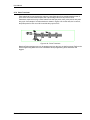
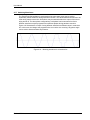
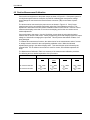
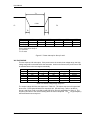
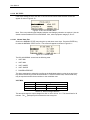
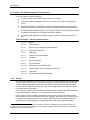
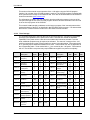
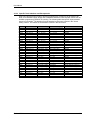
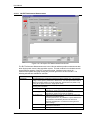
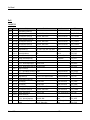
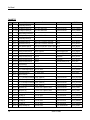
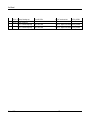
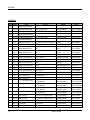
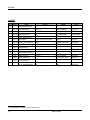
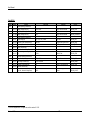
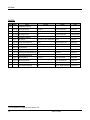
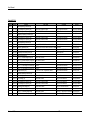
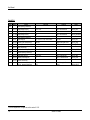
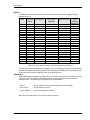
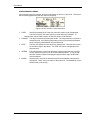
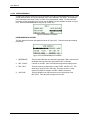
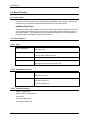
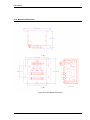
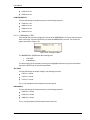
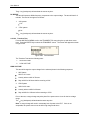
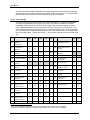
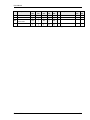
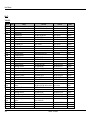
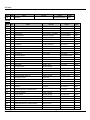
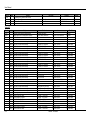
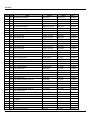
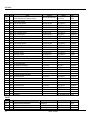
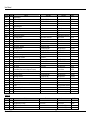
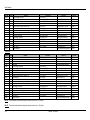
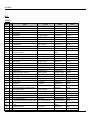
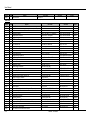
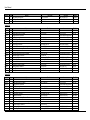
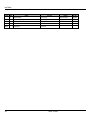
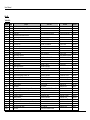
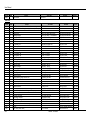
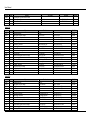
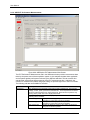
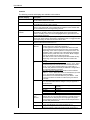
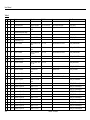
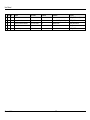
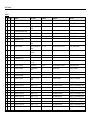
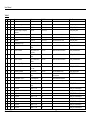
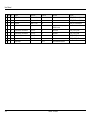
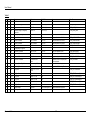
This tab displays the same current harmonics as the Current Graph tab except in a
tabular format. Data is shown in both absolute and relative from (percent of
fundamental current). A limit table is applied and a pass or fail indication is shown
in the last column. Values that exceed the allowable limits are shown with a red
background in the Pass/Fail column.
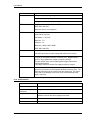
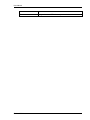
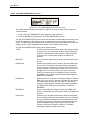
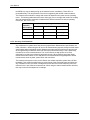
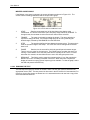
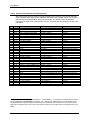
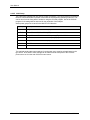
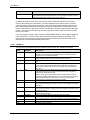
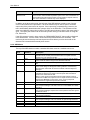
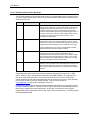
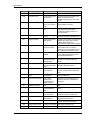
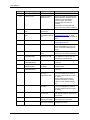
No.
Harmonic number, 1 through 50
Freq (Hz)
Frequency of harmonic in Hz.
Curr (A)
Absolute current (rms) in Amps.
% Fund.
Relative current in percent of the fundamental current (I1).
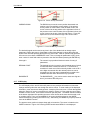
Limit
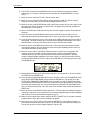
Allowable current harmonic limits per individual EUT
1
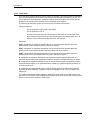
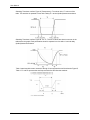
Note: Rev B data is compared against the Rev C spec per Appendix A of the MIL-STD-704 standard. The rev C graph was not
available at the time of this writing and was assumed to be the same as the rev D graph. Contact [email protected] if you
have information to the contrary.
i Series / iX Series
265