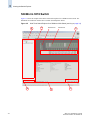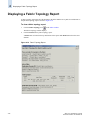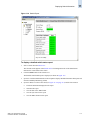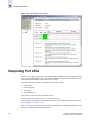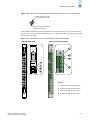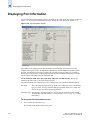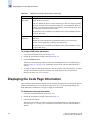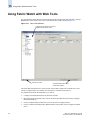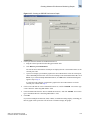
1
Web Tools
Administrator’s Guide
Supporting Fabric OS v5.0.1
Supporting SilkWorm 200E, 3014, 3016, 3250, 3850, 3900, 4012,
4100, 12000, 24000, 48000
Publication Number: 53-0000522-09
Publication Date: 07/11/05
Copyright © 2005, Brocade Communications Systems, Incorporated.
ALL RIGHTS RESERVED.
Publication Number: 53-0000522-09
Brocade, the Brocade B weave logo, Secure Fabric OS, and SilkWorm are registered trademarks of Brocade
Communications Systems, Inc., in the United States and/or in other countries. FICON, IBM
BladeCenter are
registered trademarks of IBM Corporation in the U.S. and other countries. All other brands, products, or service names
are or may be trademarks or service marks of, and are used to identify, products or services of their respective owners.
Notice: The information in this document is provided “AS IS,” without warranty of any kind, including, without
limitation, any implied warranty of merchantability, noninfringement or fitness for a particular purpose. Disclosure of
information in this material in no way grants a recipient any rights under Brocade's patents, copyrights, trade secrets or
other intellectual property rights. Brocade reserves the right to make changes to this document at any time, without
notice, and assumes no responsibility for its use.
The authors and Brocade Communications Systems, Inc. shall have no liability or responsibility to any person or entity
with respect to any loss, cost, liability, or damages arising from the information contained in this book or the computer
programs that accompany it.
Notice: The product described by this document may contain “open source” software covered by the GNU General
Public License or other open source license agreements. To find-out which open source software is included in Brocade
products, view the licensing terms applicable to the open source software, and obtain a copy of the programming source
code, please visit http://www.brocade.com/support/oscd.
Export of technical data contained in this document may require an export license from the United States Government.
Brocade Communications Systems, Incorporated
Corporate Headquarters
Brocade Communications Systems, Inc.
1745 Technology Drive
San Jose, CA 95110
Tel: 1-408-333-8000
Fax: 1-408-333-8101
Email: [email protected]
European and Latin American Headquarters
Brocade Communications Switzerland Sàrl
Centre Swissair
Tour A - 2ème étage
29, Route de l'Aéroport
Case Postale 105
CH-1215 Genève 15
Switzerland
Tel: +41 22 799 56 40
Fax: +41 22 799 56 41
Email: [email protected]
Asia-Pacific Headquarters
Brocade Communications Singapore Pte. Ltd.
9 Raffles Place
#59-02 Republic Plaza 1
Singapore 048619
Tel: +65-6538-4700
Fax: +65-6538-0302
Email: [email protected]
Document History
The following table lists all versions of the Web Tools Administrator’s Guide.
Document Title
Publication Number
Summary of Changes
Publication
Date
Web Tools User’s Guide v2.0
53-0001536-01
NA
September 1999
Web Tools User’s Guide v2.2
53-0001558-02
NA
May 2000
Web Tools User’s Guide v2.3
53-0000067-02
NA
December 2000
Web Tools User’s Guide v3.0
53-0000130-03
NA
July 2001
Web Tools User’s Guide v2.6
53-0000197-02
NA
December 2001
Advanced Web Tools User’s
Guide
v3.0 / v4.0
53-0000185-02
NA
March 2002
Advanced Web Tools User’s
Guide v4.0.2
53-0000185-03
NA
September 2002
Advanced Web Tools User’s
Guide v3.1.0
53-0000503-02
NA
April 2003
Advanced Web Tools User’s
Guide v4.1.0
53-0000522-02
NA
April 2003
Advanced Web Tools User’s
Guide v4.1.2
53-0000522-04
Insistent Domain ID Mode.
Port Swapping information.
Minor editorial changes
October 2003
Advanced Web Tools
Administrator’s Guide, v4.2.0
53-0000522-05
Updates to support new
switch types: SilkWorm
3250, 3850, 24000. Structural
changes, Support changes,
Installation changes.
December 2003
Advanced Web Tools User’s
Guide
53-0000522-06
Clarifications on software and
hardware support, minor
enhancements in procedure
text, minor rearranging of
content.
March 2004
Advanced Web Tools
Administrator’s Guide
53-0000522-07
Updates to support new
switch types (3016, 4100) and
Fabric OS v4.4.0, including
Ports on Demand, user
administration, and zoning
wizards.
September 2004
Web Tools Administrator’s
Guide
53-0000522-08
Updates to support new
switch types (200E, 48000)
and Fabric OS v5.0.1,
including switchAdmin role,
upfront login, and Web Tools
EZ.
April 2005
Web Tools Administrator’s
Guide
53-0000522-09
Updates to add additional
information about refresh and
polling rates.
July 2005
Contents
About This Document
How This Document Is Organized . . . . . . . . . . . . . . . . . . . . . . . . . . . . . . . . .
xiii
Supported Hardware and Software . . . . . . . . . . . . . . . . . . . . . . . . . . . . . . . . .
xiv
What’s New in This Document . . . . . . . . . . . . . . . . . . . . . . . . . . . . . . . . . . .
xiv
Document Conventions. . . . . . . . . . . . . . . . . . . . . . . . . . . . . . . . . . . . . . . . . .
xvi
Key Terms. . . . . . . . . . . . . . . . . . . . . . . . . . . . . . . . . . . . . . . . . . . . . . . . .
xvi
Text Formatting . . . . . . . . . . . . . . . . . . . . . . . . . . . . . . . . . . . . . . . . . . . .
xvi
Notes, Cautions, and Warnings. . . . . . . . . . . . . . . . . . . . . . . . . . . . . . . . .
xvi
Additional Information . . . . . . . . . . . . . . . . . . . . . . . . . . . . . . . . . . . . . . . . . .
xvii
Brocade Resources . . . . . . . . . . . . . . . . . . . . . . . . . . . . . . . . . . . . . . . . . .
xvii
Other Industry Resources . . . . . . . . . . . . . . . . . . . . . . . . . . . . . . . . . . . . . xviii
Chapter 1
Getting Technical Help . . . . . . . . . . . . . . . . . . . . . . . . . . . . . . . . . . . . . . . . . .
xix
Document Feedback . . . . . . . . . . . . . . . . . . . . . . . . . . . . . . . . . . . . . . . . . . . .
xx
Introducing Web Tools
Requirements, Installation, and Support. . . . . . . . . . . . . . . . . . . . . . . . . . . . .
1-1
Requirements . . . . . . . . . . . . . . . . . . . . . . . . . . . . . . . . . . . . . . . . . . . . . .
1-1
Installing a Web Tools License . . . . . . . . . . . . . . . . . . . . . . . . . . . . . . . .
1-4
Value Line Licenses . . . . . . . . . . . . . . . . . . . . . . . . . . . . . . . . . . . . . . . . .
1-6
Switch Support . . . . . . . . . . . . . . . . . . . . . . . . . . . . . . . . . . . . . . . . . . . . .
1-6
Language Support for Web Tools EZ. . . . . . . . . . . . . . . . . . . . . . . . . . . .
1-6
Launching Web Tools. . . . . . . . . . . . . . . . . . . . . . . . . . . . . . . . . . . . . . . . . . .
1-7
Web Tools EZ Switch Setup Wizard . . . . . . . . . . . . . . . . . . . . . . . . . . . .
1-8
Web Tools EZ . . . . . . . . . . . . . . . . . . . . . . . . . . . . . . . . . . . . . . . . . . . . . .
1-9
Web Tools. . . . . . . . . . . . . . . . . . . . . . . . . . . . . . . . . . . . . . . . . . . . . . . . .
1-9
Logging In. . . . . . . . . . . . . . . . . . . . . . . . . . . . . . . . . . . . . . . . . . . . . . . . . . . . 1-10
Logging Out . . . . . . . . . . . . . . . . . . . . . . . . . . . . . . . . . . . . . . . . . . . . . . . . . . 1-12
Session Management . . . . . . . . . . . . . . . . . . . . . . . . . . . . . . . . . . . . . . . . . . . 1-12
Web Tools Administrator’s Guide
Publication Number: 53-0000522-09
iii
Chapter 2
Using Web Tools EZ
Overview. . . . . . . . . . . . . . . . . . . . . . . . . . . . . . . . . . . . . . . . . . . . . . . . . . . . .
2-1
Task Bar . . . . . . . . . . . . . . . . . . . . . . . . . . . . . . . . . . . . . . . . . . . . . . . . . .
2-3
Caption Bar . . . . . . . . . . . . . . . . . . . . . . . . . . . . . . . . . . . . . . . . . . . . . . . .
2-3
Content Page . . . . . . . . . . . . . . . . . . . . . . . . . . . . . . . . . . . . . . . . . . . . . . .
2-3
Status Bar . . . . . . . . . . . . . . . . . . . . . . . . . . . . . . . . . . . . . . . . . . . . . . . . .
2-3
Monitoring the Switch . . . . . . . . . . . . . . . . . . . . . . . . . . . . . . . . . . . . . . . . . .
2-4
Switch View . . . . . . . . . . . . . . . . . . . . . . . . . . . . . . . . . . . . . . . . . . . . . . .
2-5
Port Status . . . . . . . . . . . . . . . . . . . . . . . . . . . . . . . . . . . . . . . . . . . . . . . . .
2-5
Detail View . . . . . . . . . . . . . . . . . . . . . . . . . . . . . . . . . . . . . . . . . . . . . . . .
2-6
Device Connections . . . . . . . . . . . . . . . . . . . . . . . . . . . . . . . . . . . . . . . . .
2-8
Devices . . . . . . . . . . . . . . . . . . . . . . . . . . . . . . . . . . . . . . . . . . . . . . . . . . .
2-9
Device Accessibility (Zoning) . . . . . . . . . . . . . . . . . . . . . . . . . . . . . . . . . 2-11
Performing Switch Setup . . . . . . . . . . . . . . . . . . . . . . . . . . . . . . . . . . . . . . . . 2-12
Assigning Device Aliases . . . . . . . . . . . . . . . . . . . . . . . . . . . . . . . . . . . . . . . . 2-13
Managing Basic Zoning . . . . . . . . . . . . . . . . . . . . . . . . . . . . . . . . . . . . . . . . . 2-13
Validate Device Accessibility. . . . . . . . . . . . . . . . . . . . . . . . . . . . . . . . . . 2-13
Edit Device Accessibility . . . . . . . . . . . . . . . . . . . . . . . . . . . . . . . . . . . . . 2-13
Restore Fixed Zoning . . . . . . . . . . . . . . . . . . . . . . . . . . . . . . . . . . . . . . . . 2-14
Accessing Web Tools for Advanced Management. . . . . . . . . . . . . . . . . . . . . 2-14
Logging Out of Web Tools EZ . . . . . . . . . . . . . . . . . . . . . . . . . . . . . . . . . . . . 2-14
iv
Web Tools Administrator’s Guide
Publication Number: 53-0000522-09
Chapter 3
Using Advanced Web Tools
Viewing the Switch Explorer . . . . . . . . . . . . . . . . . . . . . . . . . . . . . . . . . . . . .
3-1
SilkWorm 12000 Director . . . . . . . . . . . . . . . . . . . . . . . . . . . . . . . . . . . .
3-2
SilkWorm 24000 Director . . . . . . . . . . . . . . . . . . . . . . . . . . . . . . . . . . . .
3-3
SilkWorm 48000 Director . . . . . . . . . . . . . . . . . . . . . . . . . . . . . . . . . . . .
3-4
SilkWorm 3250 Switch. . . . . . . . . . . . . . . . . . . . . . . . . . . . . . . . . . . . . . .
3-5
SilkWorm 3016 Switch. . . . . . . . . . . . . . . . . . . . . . . . . . . . . . . . . . . . . . .
3-6
Refresh Rates . . . . . . . . . . . . . . . . . . . . . . . . . . . . . . . . . . . . . . . . . . . . . .
3-7
Fabric Tree . . . . . . . . . . . . . . . . . . . . . . . . . . . . . . . . . . . . . . . . . . . . . . . .
3-7
Fabric Toolbar. . . . . . . . . . . . . . . . . . . . . . . . . . . . . . . . . . . . . . . . . . . . . .
3-8
Switch View . . . . . . . . . . . . . . . . . . . . . . . . . . . . . . . . . . . . . . . . . . . . . . .
3-8
Switch View Button Menu . . . . . . . . . . . . . . . . . . . . . . . . . . . . . . . . . . . .
3-9
Switch Information View . . . . . . . . . . . . . . . . . . . . . . . . . . . . . . . . . . . . .
3-9
Status Legend . . . . . . . . . . . . . . . . . . . . . . . . . . . . . . . . . . . . . . . . . . . . . .
3-9
Displaying Switches in the Fabric . . . . . . . . . . . . . . . . . . . . . . . . . . . . . . . . . 3-10
Ending the Web Tools Session . . . . . . . . . . . . . . . . . . . . . . . . . . . . . . . . . . . . 3-10
Using Web Tools and Secure Mode . . . . . . . . . . . . . . . . . . . . . . . . . . . . . . . . 3-10
Web Tools Access and HTTP_POLICY . . . . . . . . . . . . . . . . . . . . . . . . . 3-11
Opening Modules in a Secure Fabric . . . . . . . . . . . . . . . . . . . . . . . . . . . . 3-11
Primary-FCS-Only Functionality . . . . . . . . . . . . . . . . . . . . . . . . . . . . . . . 3-11
Disabled Functionality . . . . . . . . . . . . . . . . . . . . . . . . . . . . . . . . . . . . . . . 3-11
Working With Web Tools: Recommendations. . . . . . . . . . . . . . . . . . . . . . . . 3-12
Chapter 4
Managing Your Fabrics, Switches, and Ports
Managing Fabrics, Switches, and Ports Using Web Tools. . . . . . . . . . . . . . .
4-1
Launching the Switch Admin Module . . . . . . . . . . . . . . . . . . . . . . . . . . .
4-3
Refreshing the Switch Admin Module . . . . . . . . . . . . . . . . . . . . . . . . . . .
4-3
Launching the Telnet Window . . . . . . . . . . . . . . . . . . . . . . . . . . . . . . . . . . . .
4-3
Configuring IP and Netmask Information . . . . . . . . . . . . . . . . . . . . . . . . . . .
4-4
Configuring a syslog IP Address . . . . . . . . . . . . . . . . . . . . . . . . . . . . . . . . . .
4-5
Web Tools Administrator’s Guide
Publication Number: 53-0000522-09
v
Configuring a Switch . . . . . . . . . . . . . . . . . . . . . . . . . . . . . . . . . . . . . . . . . . .
4-5
Enabling and Disabling a Switch . . . . . . . . . . . . . . . . . . . . . . . . . . . . . . .
4-5
Changing the Switch Name . . . . . . . . . . . . . . . . . . . . . . . . . . . . . . . . . . .
4-6
Changing the Switch Domain ID . . . . . . . . . . . . . . . . . . . . . . . . . . . . . . .
4-6
Viewing and Printing a Switch Report . . . . . . . . . . . . . . . . . . . . . . . . . . .
4-7
Rebooting the Switch . . . . . . . . . . . . . . . . . . . . . . . . . . . . . . . . . . . . . . . . . . .
4-7
Performing a Fast Boot . . . . . . . . . . . . . . . . . . . . . . . . . . . . . . . . . . . . . . .
4-7
Performing a Reboot . . . . . . . . . . . . . . . . . . . . . . . . . . . . . . . . . . . . . . . . .
4-7
Changing System Configuration Parameters . . . . . . . . . . . . . . . . . . . . . . . . .
4-8
Configuring Fabric Parameters . . . . . . . . . . . . . . . . . . . . . . . . . . . . . . . . .
4-8
Enabling Insistent Domain ID Mode (FICON only) . . . . . . . . . . . . . . . . 4-10
Configuring Virtual Channel Settings . . . . . . . . . . . . . . . . . . . . . . . . . . . 4-10
Configuring Arbitrated Loop Parameters . . . . . . . . . . . . . . . . . . . . . . . . . 4-11
Configuring System Services . . . . . . . . . . . . . . . . . . . . . . . . . . . . . . . . . . 4-11
Configuring Ports . . . . . . . . . . . . . . . . . . . . . . . . . . . . . . . . . . . . . . . . . . . . . . 4-12
Configuring Port Type . . . . . . . . . . . . . . . . . . . . . . . . . . . . . . . . . . . . . . . 4-13
Configuring Port Speed . . . . . . . . . . . . . . . . . . . . . . . . . . . . . . . . . . . . . . 4-13
Assigning a Name to a Port . . . . . . . . . . . . . . . . . . . . . . . . . . . . . . . . . . . 4-14
Disabling a Port over Reboots . . . . . . . . . . . . . . . . . . . . . . . . . . . . . . . . . 4-14
Enabling and Disabling a Port . . . . . . . . . . . . . . . . . . . . . . . . . . . . . . . . . 4-15
Activating Ports on Demand. . . . . . . . . . . . . . . . . . . . . . . . . . . . . . . . . . . . . . 4-15
Maintaining Licensed Features . . . . . . . . . . . . . . . . . . . . . . . . . . . . . . . . . . . . 4-16
Activating a License on a Switch . . . . . . . . . . . . . . . . . . . . . . . . . . . . . . . 4-17
Removing a License from a Switch . . . . . . . . . . . . . . . . . . . . . . . . . . . . . 4-18
Administering High Availability . . . . . . . . . . . . . . . . . . . . . . . . . . . . . . . . . . 4-18
Launching the Hi Availability Module . . . . . . . . . . . . . . . . . . . . . . . . . . . 4-18
Synchronizing Services on the CP . . . . . . . . . . . . . . . . . . . . . . . . . . . . . . 4-19
Initiating a CP Failover. . . . . . . . . . . . . . . . . . . . . . . . . . . . . . . . . . . . . . . 4-20
vi
Web Tools Administrator’s Guide
Publication Number: 53-0000522-09
Monitoring Events . . . . . . . . . . . . . . . . . . . . . . . . . . . . . . . . . . . . . . . . . . . . . 4-20
Displaying Fabric Events . . . . . . . . . . . . . . . . . . . . . . . . . . . . . . . . . . . . . 4-21
Displaying Switch Events . . . . . . . . . . . . . . . . . . . . . . . . . . . . . . . . . . . . . 4-22
Filtering Fabric and Switch Events. . . . . . . . . . . . . . . . . . . . . . . . . . . . . . 4-23
Displaying a Fabric Topology Report . . . . . . . . . . . . . . . . . . . . . . . . . . . . . . 4-26
Displaying the Name Server Entries. . . . . . . . . . . . . . . . . . . . . . . . . . . . . . . . 4-27
Physically Locating a Switch Using Beaconing . . . . . . . . . . . . . . . . . . . . . . . 4-28
Displaying Swapped Port Area IDs . . . . . . . . . . . . . . . . . . . . . . . . . . . . . . . . 4-29
Chapter 5
Chapter 6
Chapter 7
Maintaining Configurations and Firmware
Maintaining Configurations . . . . . . . . . . . . . . . . . . . . . . . . . . . . . . . . . . . . . .
5-1
Backing Up a Configuration File . . . . . . . . . . . . . . . . . . . . . . . . . . . . . . .
5-2
Restoring a Configuration. . . . . . . . . . . . . . . . . . . . . . . . . . . . . . . . . . . . .
5-2
Performing a Firmware Download . . . . . . . . . . . . . . . . . . . . . . . . . . . . . . . . .
5-3
Configuring Standard Security Features
Creating and Maintaining User-Defined Accounts . . . . . . . . . . . . . . . . . . . .
6-1
Configuring SNMP Information . . . . . . . . . . . . . . . . . . . . . . . . . . . . . . . . . . .
6-4
Setting SNMP Trap Levels . . . . . . . . . . . . . . . . . . . . . . . . . . . . . . . . . . . .
6-5
Configuring SNMP Information . . . . . . . . . . . . . . . . . . . . . . . . . . . . . . . .
6-6
Managing RADIUS Server . . . . . . . . . . . . . . . . . . . . . . . . . . . . . . . . . . . . . . .
6-7
Enabling and Disabling RADIUS Service . . . . . . . . . . . . . . . . . . . . . . . .
6-7
Configuring the RADIUS Server . . . . . . . . . . . . . . . . . . . . . . . . . . . . . . .
6-8
Modifying the RADIUS Server . . . . . . . . . . . . . . . . . . . . . . . . . . . . . . . .
6-8
Modifying the RADIUS Server Order . . . . . . . . . . . . . . . . . . . . . . . . . . .
6-9
Removing a RADIUS Server . . . . . . . . . . . . . . . . . . . . . . . . . . . . . . . . . .
6-9
Routing Traffic
Introducing Routing . . . . . . . . . . . . . . . . . . . . . . . . . . . . . . . . . . . . . . . . . . . .
7-1
Displaying FSPF Routing . . . . . . . . . . . . . . . . . . . . . . . . . . . . . . . . . . . . . . . .
7-2
Configuring a Static Route . . . . . . . . . . . . . . . . . . . . . . . . . . . . . . . . . . . . . . .
7-3
Enabling/Disabling Dynamic Load Sharing . . . . . . . . . . . . . . . . . . . . . . . . . .
7-3
Web Tools Administrator’s Guide
Publication Number: 53-0000522-09
vii
Chapter 8
Chapter 9
Chapter 10
Specifying Frame Order Delivery. . . . . . . . . . . . . . . . . . . . . . . . . . . . . . . . . .
7-4
Configuring Link Cost . . . . . . . . . . . . . . . . . . . . . . . . . . . . . . . . . . . . . . . . . .
7-4
Administering Extended Fabrics
About Extended Link Buffer Allocation . . . . . . . . . . . . . . . . . . . . . . . . . . . .
8-1
Configuring a Port for Long Distance . . . . . . . . . . . . . . . . . . . . . . . . . . . . . .
8-3
Administering ISL Trunking
Displaying Trunk Group Information. . . . . . . . . . . . . . . . . . . . . . . . . . . . . . .
9-2
Disabling or Reenabling Trunking Mode on a Port . . . . . . . . . . . . . . . . . . . .
9-2
Administering Zoning
Introducing Zoning . . . . . . . . . . . . . . . . . . . . . . . . . . . . . . . . . . . . . . . . . . . . . 10-1
Managing Zoning with Web Tools . . . . . . . . . . . . . . . . . . . . . . . . . . . . . . . . . 10-2
Launching the Zone Admin Module. . . . . . . . . . . . . . . . . . . . . . . . . . . . . 10-3
Refreshing the Fabric Information . . . . . . . . . . . . . . . . . . . . . . . . . . . . . . 10-4
Refreshing the Zone Admin Module Information . . . . . . . . . . . . . . . . . . 10-4
Saving Local Zoning Changes . . . . . . . . . . . . . . . . . . . . . . . . . . . . . . . . . 10-5
Closing the Zone Admin Module . . . . . . . . . . . . . . . . . . . . . . . . . . . . . . . 10-5
Zoning Views . . . . . . . . . . . . . . . . . . . . . . . . . . . . . . . . . . . . . . . . . . . . . . 10-6
Managing Zone Aliases . . . . . . . . . . . . . . . . . . . . . . . . . . . . . . . . . . . . . . . . . 10-6
Creating and Populating a Zone Alias . . . . . . . . . . . . . . . . . . . . . . . . . . . 10-7
Adding and Removing Members of a Zone Alias . . . . . . . . . . . . . . . . . . 10-7
Renaming a Zone Alias. . . . . . . . . . . . . . . . . . . . . . . . . . . . . . . . . . . . . . . 10-8
Deleting a Zone Alias . . . . . . . . . . . . . . . . . . . . . . . . . . . . . . . . . . . . . . . . 10-8
Managing Zones . . . . . . . . . . . . . . . . . . . . . . . . . . . . . . . . . . . . . . . . . . . . . . . 10-8
Creating and Populating a Zone . . . . . . . . . . . . . . . . . . . . . . . . . . . . . . . . 10-9
Adding and Removing the Members of a Zone . . . . . . . . . . . . . . . . . . . . 10-9
Renaming a Zone . . . . . . . . . . . . . . . . . . . . . . . . . . . . . . . . . . . . . . . . . . . 10-10
Deleting a Zone. . . . . . . . . . . . . . . . . . . . . . . . . . . . . . . . . . . . . . . . . . . . . 10-10
viii
Web Tools Administrator’s Guide
Publication Number: 53-0000522-09
Managing QuickLoops . . . . . . . . . . . . . . . . . . . . . . . . . . . . . . . . . . . . . . . . . . 10-10
Creating a QuickLoop. . . . . . . . . . . . . . . . . . . . . . . . . . . . . . . . . . . . . . . . 10-11
Adding and Removing Members of a QuickLoop . . . . . . . . . . . . . . . . . . 10-11
Renaming a QuickLoop . . . . . . . . . . . . . . . . . . . . . . . . . . . . . . . . . . . . . . 10-12
Deleting a QuickLoop. . . . . . . . . . . . . . . . . . . . . . . . . . . . . . . . . . . . . . . . 10-12
Managing Fabric Assist Zones . . . . . . . . . . . . . . . . . . . . . . . . . . . . . . . . . . . . 10-12
Creating a Fabric Assist Zone. . . . . . . . . . . . . . . . . . . . . . . . . . . . . . . . . . 10-13
Adding and Removing Fabric Assist Zone Members. . . . . . . . . . . . . . . . 10-13
Renaming a Fabric Assist Zone . . . . . . . . . . . . . . . . . . . . . . . . . . . . . . . . 10-14
Deleting a Fabric Assist Zone. . . . . . . . . . . . . . . . . . . . . . . . . . . . . . . . . . 10-14
Managing Zone Configurations . . . . . . . . . . . . . . . . . . . . . . . . . . . . . . . . . . . 10-15
Creating a Zone Configuration . . . . . . . . . . . . . . . . . . . . . . . . . . . . . . . . . 10-15
Adding or Removing Zone Configuration Members . . . . . . . . . . . . . . . . 10-16
Renaming a Zone Configuration. . . . . . . . . . . . . . . . . . . . . . . . . . . . . . . . 10-17
Deleting a Zone Configuration . . . . . . . . . . . . . . . . . . . . . . . . . . . . . . . . . 10-17
Enabling a Zone Configuration. . . . . . . . . . . . . . . . . . . . . . . . . . . . . . . . . 10-18
Disabling a Zone Configuration . . . . . . . . . . . . . . . . . . . . . . . . . . . . . . . . 10-18
Displaying the Enabled Zone Configuration . . . . . . . . . . . . . . . . . . . . . . 10-18
Displaying the Zone Configuration Summary . . . . . . . . . . . . . . . . . . . . . 10-20
Creating a Configuration Analysis Report . . . . . . . . . . . . . . . . . . . . . . . . 10-21
Displaying Initiator/Target Accessibility . . . . . . . . . . . . . . . . . . . . . . . . . 10-21
Managing the Zoning Database . . . . . . . . . . . . . . . . . . . . . . . . . . . . . . . . . . . 10-22
Adding a WWN to Multiple Aliases, Zones, and FA Zones . . . . . . . . . . 10-23
Removing a WWN from Multiple Aliases, Zones, and FA Zones. . . . . . 10-23
Replacing a WWN in Multiple Aliases, FA Zones, and Zones . . . . . . . . 10-24
Searching for a Zone Member . . . . . . . . . . . . . . . . . . . . . . . . . . . . . . . . . 10-24
Clearing the Zoning Database. . . . . . . . . . . . . . . . . . . . . . . . . . . . . . . . . . 10-25
Using Zoning Wizards . . . . . . . . . . . . . . . . . . . . . . . . . . . . . . . . . . . . . . . 10-25
Best Practices for Zoning . . . . . . . . . . . . . . . . . . . . . . . . . . . . . . . . . . . . . . . . 10-28
Web Tools Administrator’s Guide
Publication Number: 53-0000522-09
ix
Chapter 11
Working With Diagnostic Features
Managing Trace Dumps . . . . . . . . . . . . . . . . . . . . . . . . . . . . . . . . . . . . . . . . . 11-1
How a Trace Dump Is Used . . . . . . . . . . . . . . . . . . . . . . . . . . . . . . . . . . . 11-2
Setting Up Automatic Trace Dump Transfers . . . . . . . . . . . . . . . . . . . . . 11-2
Disabling Automatic Trace Uploads. . . . . . . . . . . . . . . . . . . . . . . . . . . . . 11-3
Uploading a Trace Dump Manually . . . . . . . . . . . . . . . . . . . . . . . . . . . . . 11-3
Displaying Switch Information. . . . . . . . . . . . . . . . . . . . . . . . . . . . . . . . . . . . 11-4
Displaying Detailed Fan Hardware Status . . . . . . . . . . . . . . . . . . . . . . . . 11-4
Displaying the Temperature Status. . . . . . . . . . . . . . . . . . . . . . . . . . . . . . 11-5
Displaying the Power Supply Status. . . . . . . . . . . . . . . . . . . . . . . . . . . . . 11-6
Checking the Physical Health of a Switch . . . . . . . . . . . . . . . . . . . . . . . . 11-6
Interpreting Port LEDs . . . . . . . . . . . . . . . . . . . . . . . . . . . . . . . . . . . . . . . . . . 11-8
Displaying Port Information . . . . . . . . . . . . . . . . . . . . . . . . . . . . . . . . . . . . . . 11-10
Chapter 12
Administering FICON CUP Fabrics
Enabling or Disabling FMS Mode . . . . . . . . . . . . . . . . . . . . . . . . . . . . . . . . . 12-1
Configuring FMS Parameters . . . . . . . . . . . . . . . . . . . . . . . . . . . . . . . . . . . . . 12-3
Displaying the Code Page Information. . . . . . . . . . . . . . . . . . . . . . . . . . . . . . 12-4
Displaying the Control Device State . . . . . . . . . . . . . . . . . . . . . . . . . . . . . . . 12-5
Configuring CUP Port Connectivity. . . . . . . . . . . . . . . . . . . . . . . . . . . . . . . . 12-6
Displaying CUP Port Connectivity Configurations . . . . . . . . . . . . . . . . . 12-6
Creating or Editing CUP Port Connectivity Configurations . . . . . . . . . . 12-7
Activating a CUP Port Connectivity Configuration . . . . . . . . . . . . . . . . . 12-9
Copying a CUP Port Connectivity Configuration . . . . . . . . . . . . . . . . . . 12-10
Deleting a CUP Port Connectivity Configuration . . . . . . . . . . . . . . . . . . 12-10
Chapter 13
Administering Fabric Watch
Introduction to Fabric Watch . . . . . . . . . . . . . . . . . . . . . . . . . . . . . . . . . . . . . 13-1
Using Fabric Watch with Web Tools . . . . . . . . . . . . . . . . . . . . . . . . . . . . . . . 13-2
x
Web Tools Administrator’s Guide
Publication Number: 53-0000522-09
Configuring Fabric Watch Thresholds . . . . . . . . . . . . . . . . . . . . . . . . . . . . . . 13-3
Configuring Threshold Traits . . . . . . . . . . . . . . . . . . . . . . . . . . . . . . . . . . 13-3
Configuring Threshold Alarms . . . . . . . . . . . . . . . . . . . . . . . . . . . . . . . . . 13-5
Enabling or Disabling Threshold Alarms for Individual Elements . . . . . 13-5
Configuring Alarms for FRUs . . . . . . . . . . . . . . . . . . . . . . . . . . . . . . . . . . . . 13-6
Displaying Fabric Watch Alarm Information . . . . . . . . . . . . . . . . . . . . . . . . . 13-7
Displaying an Alarm Configuration Report . . . . . . . . . . . . . . . . . . . . . . . 13-7
Displaying Alarms . . . . . . . . . . . . . . . . . . . . . . . . . . . . . . . . . . . . . . . . . . 13-7
Configuring Email Notifications . . . . . . . . . . . . . . . . . . . . . . . . . . . . . . . . . . 13-8
Configuring the Email Server on a Switch . . . . . . . . . . . . . . . . . . . . . . . . 13-8
Configuring the Email Alert Recipient . . . . . . . . . . . . . . . . . . . . . . . . . . . 13-8
Chapter 14
Monitoring Performance
Monitoring Performance Using Web Tools . . . . . . . . . . . . . . . . . . . . . . . . . . 14-1
Predefined Performance Graphs . . . . . . . . . . . . . . . . . . . . . . . . . . . . . . . . 14-2
User-Defined Graphs . . . . . . . . . . . . . . . . . . . . . . . . . . . . . . . . . . . . . . . . 14-4
Canvas Configurations . . . . . . . . . . . . . . . . . . . . . . . . . . . . . . . . . . . . . . . 14-4
Launching the Performance Monitor Module . . . . . . . . . . . . . . . . . . . . . . . . 14-5
Creating a Basic Performance Monitor Graph . . . . . . . . . . . . . . . . . . . . . . . . 14-5
Customizing Basic Monitoring Graphs . . . . . . . . . . . . . . . . . . . . . . . . . . . . . 14-6
Creating Advanced Performance Monitoring Graphs . . . . . . . . . . . . . . . . . . 14-8
Creating an SID-DID Performance Graph . . . . . . . . . . . . . . . . . . . . . . . . 14-8
Creating a SCSI vs. IP Traffic Graph . . . . . . . . . . . . . . . . . . . . . . . . . . . . 14-10
Creating a SCSI Command Graph . . . . . . . . . . . . . . . . . . . . . . . . . . . . . . 14-10
Creating an AL_PA Error Graph . . . . . . . . . . . . . . . . . . . . . . . . . . . . . . . 14-11
Managing Performance Graphs . . . . . . . . . . . . . . . . . . . . . . . . . . . . . . . . . . . 14-12
Saving Graphs to a Canvas . . . . . . . . . . . . . . . . . . . . . . . . . . . . . . . . . . . . 14-12
Adding a Graph to an Existing Canvas. . . . . . . . . . . . . . . . . . . . . . . . . . . 14-13
Printing Graphs . . . . . . . . . . . . . . . . . . . . . . . . . . . . . . . . . . . . . . . . . . . . . 14-13
Modifying an Existing Graph . . . . . . . . . . . . . . . . . . . . . . . . . . . . . . . . . . 14-14
Web Tools Administrator’s Guide
Publication Number: 53-0000522-09
xi
Chapter 15
Limitations
General Web Tools Limitations . . . . . . . . . . . . . . . . . . . . . . . . . . . . . . . . . . . 15-1
Platform-Specific Limitations. . . . . . . . . . . . . . . . . . . . . . . . . . . . . . . . . . . . . 15-5
Limitations When Using the Mozilla Browser . . . . . . . . . . . . . . . . . . . . . . . . 15-6
Glossary
Index
xii
Web Tools Administrator’s Guide
Publication Number: 53-0000522-09
About This Document
This document is an administrator’s guide written to help fabric administrators monitor and modify
switches and fabrics from a Web-based user interface.
“About This Document” contains the following sections:
•
•
•
•
•
•
•
“How This Document Is Organized,” next
“Supported Hardware and Software” on page xiv
“What’s New in This Document” on page xiv
“Document Conventions” on page xvi
“Additional Information” on page xvii
“Getting Technical Help” on page xix
“Document Feedback” on page xx
How This Document Is Organized
This document is organized to help you find the particular information that you want as quickly and
easily as possible.
This document provides both concepts and procedures. If you are already familiar with the Web Tools
interface, you might want to forgo reading Chapter 1, “Introducing Web Tools”.
Because this document tells you primarily how to perform administrative tasks in Web Tools, it is
arranged in a loosely chronological order, beginning with prerequisites to getting started and ending
with troubleshooting information.
The document contains the following topics:
•
Chapter 1, “Introducing Web Tools”, provides some basic information about the Web Tools
interface, including system requirements and installation instructions.
•
Chapter 2, “Using Web Tools EZ”, describes the Web Tools EZ interface, supported on some
switches, for basic management tasks.
•
Chapter 3, “Using Advanced Web Tools”, describes the Web Tools interface, for advanced
management tasks.
•
Chapter 4, “Managing Your Fabrics, Switches, and Ports”, provides information on how to manage
your entire fabric, including switches and ports, using the Web Tools interface.
•
Chapter 5, “Maintaining Configurations and Firmware”, provides information about uploading and
downloading configuration files and downloading firmware.
•
Chapter 6, “Configuring Standard Security Features”, provides information on managing user
accounts, SNMP, and RADIUS server.
Web Tools Administrator’s Guide
Publication Number: 53-0000522-09
xiii
•
•
Chapter 7, “Routing Traffic”, provides information on how to configure routes.
•
Chapter 9, “Administering ISL Trunking”, provides information on managing the optionally
licensed ISL Trunking feature.
•
Chapter 10, “Administering Zoning”, provides information on how to use the Brocade Advanced
Zoning feature to partition your storage area network (SAN) into logical groups of devices that can
access each other.
•
Chapter 11, “Working With Diagnostic Features”, provides information about trace dumps,
viewing switch health, and interpreting the LEDs.
•
Chapter 12, “Administering FICON CUP Fabrics”, provides information on how to administer and
manage FICON CUP fabrics. You can enable FMS mode, edit and create configurations, and edit
FMS parameters.
•
Chapter 13, “Administering Fabric Watch”, provides information on how to use the Fabric Watch
feature to monitor the performance and status of switches and alert you when problems arise.
•
Chapter 14, “Monitoring Performance”, provides information on how to use the Brocade Advanced
Performance Monitoring feature to monitor your fabric performance.
•
Chapter 15, “Limitations”, discusses the limitations of and provides workarounds for using Web
Tools.
•
•
The glossary defines terms used in this document.
Chapter 8, “Administering Extended Fabrics”, provides information on how to configure a port for
long distance.
The index points you to the exact pages on which specific information is located.
Supported Hardware and Software
In those instances in which procedures or parts of procedures documented here apply to some switches
but not to others, this guide identifies exactly which switches are supported and which are not.
Although many different software and hardware configurations are tested and supported by Brocade
Communications Systems, Inc. for 5.0.1, documenting all possible configurations and scenarios is
beyond the scope of this document.
This document does not support all versions. This document is specific to 5.0.1. To obtain information
about an OS version other than 5.0.1, refer to the documentation specific to that OS version.
What’s New in This Document
The following changes have been made since this document was last released:
•
Information that was added:
-
xiv
Chapter 2, “Using Web Tools EZ” describes how to use the Web Tools EZ interface.
Upfront login and the switchAdmin role are described in “Logging In” on page 1-10.
Support for the SilkWorm 48000 director and the SilkWorm 200E switch is added throughout.
Web Tools Administrator’s Guide
Publication Number: 53-0000522-09
•
Information that was changed:
-
The content of this book was rearranged to give it an organization similar to the Fabric OS
Administrator’s Guide.
-
Changes to the FICON CUP tab are described in “Configuring CUP Port Connectivity” on
page 12-6.
For further information, refer to the release notes.
Web Tools Administrator’s Guide
Publication Number: 53-0000522-09
xv
Document Conventions
This section describes text formatting conventions and important notices formats.
Key Terms
For definitions of SAN-specific terms, visit the Storage Networking Industry Association online
dictionary at http://www.snia.org/education/dictionary.
Text Formatting
The narrative-text formatting conventions that are used in this document are as follows:
bold text
Identifies command names
Identifies the names of user-manipulated GUI elements
Identifies keywords and operands
Identifies text to enter at the GUI or CLI
italic text
Provides emphasis
Identifies variables
Identifies paths and Internet addresses
Identifies document titles
code text
Identifies CLI output
Identifies syntax examples
For readability, command names in the narrative portions of this guide are presented in mixed
lettercase: for example, switchShow. In actual examples, command lettercase is often all lowercase.
Otherwise, this manual specifically notes those cases in which a command is case sensitive.
Notes, Cautions, and Warnings
The following notices appear in this document.
Note
A note provides a tip, emphasizes important information, or provides a reference to related information.
Caution
A caution alerts you to potential damage to hardware, firmware, software, or data.
Warning
A warning alerts you to potential danger to personnel.
xvi
Web Tools Administrator’s Guide
Publication Number: 53-0000522-09
Additional Information
This section lists additional Brocade and industry-specific documentation that you might find helpful.
Brocade Resources
The following related documentation is provided on the Brocade Documentation CD-ROM and on the
Brocade Web site, through Brocade Connect.
Note
Go to http://www.brocade.com and click Brocade Connect to register at no cost for a user ID and
password.
Fabric OS
•
•
•
•
Fabric OS Administrator’s Guide
Fabric OS Command Reference Manual
Fabric OS MIB Reference Manual
Fabric OS System Error Message Reference Manual
Fabric OS Options
•
•
•
Fabric Watch Administrator’s Guide
Fabric Manager Administrator’s Guide
Secure Fabric OS Administrator’s Guide
SilkWorm 200E
•
SilkWorm 200E Hardware Reference Manual (for v5.x software)
SilkWorm 3014
•
•
SilkWorm 3014 Hardware Reference Manual (for v5.x software)
SilkWorm 3014 QuickStart Guide (for v5.x software)
SilkWorm 3016
•
•
•
SilkWorm 3016 Hardware Reference Manual (for v4.2.x and later software)
SilkWorm 3016 QuickStart Guide (for v4.2.x and later software)
Brocade Enterprise and Entry SAN Switch Modules for IBM eServer BladeCenter Design,
Deployment and Management Guide (DDM)
SilkWorm 3250/3850
•
•
SilkWorm 3250/3850 Hardware Reference Manual (for v4.x software)
SilkWorm 3250/3850 QuickStart Guide (for v4.x software)
Web Tools Administrator’s Guide
Publication Number: 53-0000522-09
xvii
SilkWorm 3900
•
•
SilkWorm 3900 Hardware Reference Manual (for v4.x software)
SilkWorm 3900 QuickStart Guide (for v4.x software)
SilkWorm 4100
•
•
SilkWorm 4100 Hardware Reference Manual (for v4.4.x and later software)
SilkWorm 4100 QuickStart Guide (for v4.4.x and later software)
SilkWorm 12000
•
•
SilkWorm 12000 Hardware Reference Manual
SilkWorm 12000 QuickStart Guide
SilkWorm 24000
•
•
SilkWorm 24000 Hardware Reference Manual
SilkWorm 24000 QuickStart Guide
SilkWorm 48000
•
•
SilkWorm 48000 Hardware Reference Manual
SilkWorm 48000 QuickStart Guide
SilkWorm 12000/24000/48000
•
SilkWorm 12000/24000/48000 Migration Guide
For practical discussions about SAN design, implementation, and maintenance, you can obtain Building
SANs with Brocade Fabric Switches through:
http://www.amazon.com
For additional Brocade documentation, visit the Brocade SAN Info Center and click the Resource
Library location:
http://www.brocade.com
Release notes are available on the Brocade Connect Web site and are also bundled with the Fabric OS
firmware.
Other Industry Resources
For additional resource information, visit the Technical Committee T11 Web site. This Web site
provides interface standards for high-performance and mass storage applications for Fibre Channel,
storage management, and other applications:
http://www.t11.org
For information about the Fibre Channel industry, visit the Fibre Channel Industry Association Web
site:
http://www.fibrechannel.org
xviii
Web Tools Administrator’s Guide
Publication Number: 53-0000522-09
Getting Technical Help
Contact your switch support supplier for hardware, firmware, and software support, including product
repairs and part ordering. To expedite your call, have the following information available:
1.
General Information
•
•
•
•
•
•
•
•
•
•
2.
Technical Support contract number, if applicable
Switch model
Switch operating system version
Browser and Java Plug-in version
Error numbers and messages received
Java console window messages
Screen shots
supportSave command output
Detailed description of the problem and specific questions
Description of any troubleshooting steps already performed and results
Switch Serial Number
The switch serial number and corresponding bar code are provided on the serial number label, as
shown here:
:
*FT00X0054E9
FT00X0054E9
The serial number label is located as follows:
3.
•
•
•
•
•
SilkWorm 2000-series switches: Bottom of chassis.
•
SilkWorm 12000, 24000, and 48000 directors: Inside the front of the chassis, on the wall to the
left of the ports.
•
SilkWorm Multiprotocol Router Model AP7420: On the bottom of the chassis and on the back
of the chassis.
SilkWorm 3016 and 4012 switch: Side of switch module.
SilkWorm 200E, 3200, and 3800 switches: Nonport side of chassis.
SilkWorm 3250, 3850, and 3900 switches: Bottom of chassis.
SilkWorm 4100 switches: On the switch ID pull-out tab located on the port side and on the
inside of the chassis, near power supply 1 (on the right when looking at the nonport side).
World Wide Name (WWN)
•
SilkWorm 200E, 3016, 3250, 3600, 3850, 3900, 4012, and 4100 switches and SilkWorm 12000,
24000, and 48000 directors: Provide the license ID. Use the licenseIDShow command to
display the license ID.
•
SilkWorm Multiprotocol Router Model AP7420: Provide the switch WWN. Use the
switchShow command to display the switch WWN.
•
All other SilkWorm switches: Provide the switch WWN. Use the wwn command to display the
switch WWN.
Web Tools Administrator’s Guide
Publication Number: 53-0000522-09
xix
Document Feedback
Because quality is our first concern at Brocade, we have made every effort to ensure the accuracy and
completeness of this document. However, if you find an error or an omission, or you think that a topic
needs further development, we want to hear from you. Forward your feedback to:
[email protected]
Provide the title and version number and as much detail as possible about your issue, including the topic
heading and page number and your suggestions for improvement.
xx
Web Tools Administrator’s Guide
Publication Number: 53-0000522-09
Chapter
Introducing Web Tools
1
Brocade Web Tools is a graphical user interface (GUI) that enables administrators to monitor and
manage single or small fabrics, switches, and ports from a standard workstation. It is an optionally
licensed product that runs on Brocade Fabric OS.
Web Tools provides the administrative control point for Brocade Advanced Fabric Services, including
Advanced Zoning, ISL Trunking, Advanced Performance Monitoring, and Fabric Watch. Web Tools
also provides an interface to telnet commands to perform special switch functions and diagnostics that
are available only through the telnet interface.
For some switch models, Web Tools provides a simplified interface, Web Tools EZ, that allows lessexperienced users to perform basic management tasks.
This chapter contains the following sections:
•
•
•
•
•
“Requirements, Installation, and Support,” next
“Launching Web Tools” on page 1-7
“Logging In” on page 1-10
“Logging Out” on page 1-12
“Session Management” on page 1-12
Requirements, Installation, and Support
Before you install Web Tools on your workstation, verify that your switches and workstation meet the
Web Tools requirements listed in this chapter.
This section contains the following subsections:
•
•
•
•
•
“Requirements,” next
“Installing a Web Tools License” on page 1-4
“Value Line Licenses” on page 1-6
“Switch Support” on page 1-6
“Language Support for Web Tools EZ” on page 1-6
Requirements
Web Tools requires any browser that conforms to HTML version 4.0, JavaScript version 1.0, and Java
Plug-in 1.4.2_06 or higher.
Web Tools Administrator’s Guide
Publication Number: 53-0000522-09
1-1
1
Requirements, Installation, and Support
Brocade has certified and tested Web Tools on the platforms shown in Table 1-1.
Table 1-1
Certified and Tested Platforms
Operating System
Browser
Java Plug-In
Solaris 2.8
Mozilla 1.6
1.4.2_06
Solaris 2.9
Mozilla 1.6
1.4.2_06
Windows 2000
Internet Explorer 6.0
1.4.2_06
Windows 2003
Internet Explorer 6.0
1.4.2_06
Windows XP
Internet Explorer 6.0
1.4.2_06
In addition, Brocade has tested Web Tools on the platforms shown in Table 1-2.
Table 1-2
Tested Platforms
Operating System
Browser
Java Plug-In
Red Hat Linux 9.0
Mozilla 1.6
1.4.2_06
Note
Some browsers must be configured to work with Web Tools. For information about how to do this, refer
to “Configuring Internet Explorer,” next.
Adequate RAM is required on Windows systems:
•
•
256 MB or more RAM for fabrics comprising 15 switches or less
512 MB or more RAM for fabrics comprising more than 15 switches
A minimum of 8 MB of video RAM is also recommended.
Configuring Internet Explorer
Correct operation of Web Tools with Internet Explorer requires specifying the appropriate settings for
browser refresh frequency and process model. Browser pages should be refreshed frequently to ensure
the correct operation of Web Tools.
To set the refresh frequency
1-2
1.
Click Tools>Internet Options in the browser.
2.
Click the General tab and click Settings (under “Temporary Internet Files”).
3.
Click Every visit to the page under “Check for newer versions of stored pages,” as shown in
Figure 1-1 on page 1-3.
Web Tools Administrator’s Guide
Publication Number: 53-0000522-09
Requirements, Installation, and Support
Figure 1-1
1
Configuring Internet Explorer
Installing Java on the Workstation
Java Plug-in version 1.4.2_06 must be installed on the workstation for the correct operation of Web
Tools.
If you try to launch Web Tools without any Java Plug-in installed,
•
•
Internet Explorer automatically prompts and downloads the proper Java Plug-in.
Mozilla downloads the most recently released Java Plug-in.
If you try to launch Web Tools with an earlier version Java Plug-in installed,
•
•
Internet Explorer might prompt for an upgrade, depending on the existing Java Plug-in version.
Mozilla uses the existing Java Plug-in.
To install the JRE on your Solaris or Linux client workstation
1.
Locate the JRE on the Internet, at the following URL:
http://java.sun.com/products/archive/j2se/1.4.2_06/index.html
Note
This URL points to a non-Brocade Web site and is subject to change without notice.
2.
Follow the instructions to install the JRE.
3.
Create a symbolic link from this location...:
$MOZILLA/plugins/libjavaplugin_oji.so
...to this location:
$JRE/plugin/$ARCH/ns600/libjavaplugin_oji.so
Web Tools Administrator’s Guide
Publication Number: 53-0000522-09
1-3
1
Requirements, Installation, and Support
To install patches on Solaris
1.
Search for any required patches for your current version of the JRE at the following Web site:
http://sunsolve.sun.com/pub-cgi/show.pl?target=patchpage
Note
This URL points to a non-Brocade Web site and is subject to change without notice.
2.
Follow the link to download the patch, and exit the browser when done.
3.
Install the patch and reboot the system.
To install the Java Plug-in on Windows
1.
Click Start Menu>Settings>Control Panel and select the Java Plug-in Control Panel.
2.
Click the About tab.
3.
Determine whether the correct Java Plug-in version is installed:
•
•
•
If the correct version is installed, Web Tools is ready to use.
If no Java Plug-in is installed, point the browser toward a switch running Fabric OS v4.x,
follow the link to the Sun Microsystems Web site, download the correct Java Plug-in, and
double-click the downloaded file to install the plug-in.
If an outdated version is currently installed, uninstall it, relaunch the browser, and enter the
address of a switch running Fabric OS v4.4.0 or later. Web Tools will guide you through the
steps to download the proper Java Plug-in.
Installing a Web Tools License
You can install a Web Tools license either through telnet or over the Web.
All licenses, including Web Tools licenses, are installed on a chassis basis. For example, if you install a
Web Tools license on logical switch 0 in a SilkWorm 12000 director, you do not need to install an
additional Web Tools license on logical switch 1 of that SilkWorm 12000 director, because both are in
the same chassis.
To determine whether a license is already installed on a switch, follow the instructions provided under
“Installing a Web Tools License Through Telnet,” next. If a license is not installed, contact your switch
supplier to obtain a license key.
Installing a Web Tools License Through Telnet
Use the following procedure to determine whether a Web Tools license is installed on your switch and,
if not, install it.
To install a Web Tools license through telnet
1-4
1.
Log in to the switch via telnet (refer to the Fabric OS Administrator’s Guide for more information),
using an account that has administrative privileges.
2.
To determine whether a Web Tools license is already installed on the switch, type licenseShow on
the telnet command line.
Web Tools Administrator’s Guide
Publication Number: 53-0000522-09
Requirements, Installation, and Support
1
A list displays, showing all the licenses currently installed on the switch:
switch:admin> licenseshow
1A1AaAaaaAAAA1a: ]-- This is the license key. The installed feature is listed below.
Zoning license
1A2AaAbbbBBBA1a:
SES license
1A3AaAbcbBBCC1d:
QuickLoop license
If the Web Tools license is not included in the list or is incorrect, continue with step 3.
3.
On the command line, type...:
licenseadd key
...where key is the license key. The license key value is case-sensitive and must be entered exactly
as given.
4.
Verify that the license was added by typing the following command:
licenseshow
If the Web Tools license is listed, the feature is available. If the license is not listed, repeat step 3.
Installing a Web Tools License Through the Web
Launching Web Tools from any nonlicensed switch automatically displays the license dialog box. If the
fabric already contains at least one licensed switch, you can use Web Tools to view and license other
switches from the licensed switch.
To install the first license through the Web
1.
Launch the Web browser and type the IP address of the switch in the Location/Address field:
http://10.77.77.77
2.
Press Enter.
If a Web Tools license is already installed on the switch, Web Tools launches. If no license is
installed, a license dialog displays.
3.
If the license dialog displays, follow the instructions provided.
To install additional licenses through the Web
1.
Launch the Web browser and type the IP address of the licensed switch in the Location/Address
field:
http://10.77.77.77
2.
Press Enter.
Web Tools opens, displaying the Switch Explorer.
3.
Click the icon for the switch to which you want to add a license.
A licensing window displays.
4.
Follow the instructions provided.
Web Tools Administrator’s Guide
Publication Number: 53-0000522-09
1-5
1
Requirements, Installation, and Support
Value Line Licenses
If your fabric includes a switch with a limited switch license and you are launching Web Tools using
that switch, if the fabric exceeds the switch limit indicated in the license, Web Tools allows a 45-day
“grace period” in which you can still monitor the switch through Web Tools. However, Web Tools will
display warning messages periodically.
These messages warn you that your fabric size exceeds the supported switch configuration limit and
tells you how long you have before Web Tools will be disabled. After the 45-day grace period, you will
no longer be able to launch Web Tools from the switch with the limited switch license if that switch is
still exceeding the switch limit.
Value line fabric licensing is applicable only to SilkWorm 3250 and 3850 switches. These licenses are
indicated by “2 Domain Fabric” and “4 Domain Fabric” in the License tab of the Switch Admin
module. Refer to “Maintaining Licensed Features” on page 4-16 for more information.
Switch Support
You can use Web Tools v5.0.1 with the following hardware:
•
•
•
•
•
•
•
•
•
•
SilkWorm 200E switch
SilkWorm 3016 switch
SilkWorm 3250 switch
SilkWorm 3850 switch
SilkWorm 3900 switch
SilkWorm 4012 switch
SilkWorm 4100 switch
SilkWorm 12000 director
SilkWorm 24000 director
SilkWorm 48000 director
Web Tools is part of the Fabric OS of a switch. When you launch Web Tools on a switch, you can
manage other switches in the fabric that have lower or higher firmware versions. It is important to note
that when accessing these switches you are opening the remote switch’s version of Web Tools, and the
functionality available for those switches might vary.
Language Support for Web Tools EZ
The Web Tools EZ switch setup wizard and the Web Tools EZ interface display the languages listed
below, but the Web Tools interface does not.
•
•
•
•
•
1-6
English (default)
Brazilian Portuguese
French
German
Italian
Web Tools Administrator’s Guide
Publication Number: 53-0000522-09
Launching Web Tools
•
•
•
•
•
1
Japanese
Korean
Simplified Chinese
Spanish
Traditional Chinese
When you launch the Web Tools EZ switch setup wizard or Web Tools EZ, the interface detects the
operating system and language environment and installs and displays the appropriate language.
For example, if you set up the switch using a German operating system, Web Tools EZ installs the
German language interface and displays text, messages, and labels in that language.
If localization resources are not fully available in the user host environment, Web Tools EZ uses the
default language, English, for display.
The following are exceptions to the localization support:
•
•
•
•
No localization support for user input. User input must consist of printable ASCII characters.
Switch-based information (such as firmware version and switch name) are not localized.
Some globally accepted industry terms (such as SAN and HBA) might not be localized.
The End User License Agreement (EULA) is not localized.
Launching Web Tools
You can launch Web Tools on any workstation with a compatible Web browser installed. For a list of
Web browsers compatible with Fabric OS v5.0.1, refer to Table 1-1 and Table 1-2 on page 1-2. Web
Tools also supports HTTPS protocol, if that protocol is enabled for the switch. For more information on
enabling the HTTPS protocol on your switch, refer to the Fabric OS Administrator’s Guide.
To launch Web Tools
1.
Launch the Web browser and type the IP address of the licensed switch in the Address field:
http://10.77.77.77
or
https://10.77.77.77
2.
Press Enter.
Depending on how the switch is configured, you might be prompted to log in to the switch at this
time. Refer to “Logging In” on page 1-10 for more information.
What happens next depends on the switch type:
•
For the SilkWorm 200E and 3250 switches, one of the following launches, depending on the
switch configuration:
-
Web Tools EZ switch setup wizard
This interface launches if the switch is an out-of-box switch and is configured with Basic User
mode enabled. (If Basic User mode is enabled, then entering the switch IP address in a browser
window launches Web Tools EZ instead of Web Tools.)
Web Tools Administrator’s Guide
Publication Number: 53-0000522-09
1-7
1
Launching Web Tools
-
Web Tools EZ
This interface launches if the switch has already been set up and is configured with Basic User
mode enabled.
-
Web Tools
This interface launches if the switch is configured with Basic User mode disabled.
•
For all other switches, the Web Tools interface launches.
The following sections describe each interface.
Web Tools EZ Switch Setup Wizard
For an out-of-box SilkWorm 200E or 3250 switch configured with Basic User mode enabled, the Web
Tools EZ setup wizard launches, as shown in Figure 1-2. Follow the instructions in the wizard to set up
the switch.
At the completion of the wizard, if you choose the option to continue to monitor the switch, Web Tools
EZ launches (see Figure 1-3 on page 1-9). Chapter 2, “Using Web Tools EZ” describes how to use this
interface.
Figure 1-2
1-8
Web Tools EZ Switch Setup Wizard
Web Tools Administrator’s Guide
Publication Number: 53-0000522-09
Launching Web Tools
1
Web Tools EZ
For a SilkWorm 200E or 3250 switch that has already been set up and is configured with Basic User
mode enabled, Web Tools EZ launches, as shown in Figure 1-3. Chapter 2, “Using Web Tools EZ”
describes how to use this interface.
Web Tools EZ supports only single-switch fabrics. If your switch is connected to another switch, Web
Tools EZ displays a message and exits. If this happens, you must disconnect the switch from all other
switches and then relaunch Web Tools.
Figure 1-3
Web Tools EZ Interface
Web Tools
For the SilkWorm 200E and 3250 configured with Basic User mode disabled, and for all other switch
models, Web Tools launches, as shown in Figure 1-4 on page 1-10. Skip to Chapter 3, “Using
Advanced Web Tools” for instructions for using this interface.
Web Tools Administrator’s Guide
Publication Number: 53-0000522-09
1-9
1
Logging In
Figure 1-4
Web Tools Interface
Logging In
When you use Web Tools, you must log in before you can modify any switch information. This section
describes upfront login, which determines when you log in, and role-based access control, which is
determined by how you log in.
Prior to displaying the login window, Web Tools displays a security banner (if one is configured for
your switch), which you must accept before logging in. The security banner displays every time you log
in, regardless of whether upfront login is enabled.
Upfront Login
Depending on how your switch is configured, you are either prompted to log in once, when you launch
Web Tools (upfront login), or prompted to log in whenever you launch a switch administration module,
such as the Switch Admin or Zoning module.
By default, upfront login is disabled. Use the configure telnet command to enable or disable upfront
login. Refer to the Fabric OS Command Reference Manual for information.
1-10
Web Tools Administrator’s Guide
Publication Number: 53-0000522-09
Logging In
1
Web Tools EZ always has upfront login enabled, regardless of the configured login settings.
Table 1-3 lists different behaviors, depending on whether upfront login is enabled.
Table 1-3
Comparison of Login Modes
Upfront Login Enabled
Upfront Login Not Enabled
You must log in before you see the Switch
Explorer (shown in Figure 1-4 on page 1-10).
Switch Explorer launches with no login.
A single session is shared by the Switch Explorer
and all child windows launched from it. (Refer to
“Session Management” on page 1-12 for more
information on sessions.)
Switch Admin, Zone Admin, and other protected
modules require separate login. (These modules
are described in subsequent chapters.)
Role-based access control is enforced across the
entire session. (Refer to “Role-Based Access
Control,” next, for more information.)
Role-based access control is enforced on a permodule basis.
When you log out or close Switch Explorer, all
windows belonging to the session are invalided.
(Refer to “Logging Out” on page 1-12 for more
information.)
There is no Logout button in Switch Explorer.
Closing the Switch Explorer window does not
invalidate other windows that were opened from
it.
If you refresh the Switch Explorer window, all
Refreshing the Switch Explorer window does not
windows belonging to the session are invalidated. affect other windows that were opened from it.
Inactivity timeout (two hours) invalidates the
Switch Explorer and all windows opened from it.
Inactivity timeout applies only to protected
modules, and each module has its own session.
This means that if the Switch Admin module
times out, the Zone Admin module could still be
left open. Conversely, recent activity in the
Switch Admin module does not prevent the Zone
Admin module from timing out if there is no
activity in that module.
Role-Based Access Control
You can log in at the admin, switchAdmin, or user level. Each role gives you a different access level:
admin
You have full access to all of the Web Tools functionality.
switchAdmin
You can do everything the admin role can do, except for the following:
•
•
•
user
You cannot modify zoning configurations.
You cannot create new accounts.
You cannot view or change account information for any accounts. You can only
view your own account and change your account password.
You can view switch information but cannot access any of the switch administration
modules.
When upfront login is enabled and the security banner is set on a switch, users are required to log in at
user level or higher to launch individual modules.
When upfront login is disabled and the security banner is set on a switch, users are required to log in at
admin level to launch individual modules.
Web Tools Administrator’s Guide
Publication Number: 53-0000522-09
1-11
1
Logging Out
To log in
1.
Click OK in the security banner window, if one appears.
The login window displays.
2.
Type the user name of an account with the admin, switchAdmin, or user role.
3.
Type the password.
4.
Click OK.
Logging Out
If upfront login is enabled, you can end your Web Tools session either by logging out or by closing the
Switch Explorer browser window. All windows belonging to the session are invalidated (after a short
delay they become grayed out and unusable, but you must close them manually).
If upfront login is not enabled, each module that you have logged in to is a separate session. You need to
close each module to end each session. Closing the Switch Explorer does not invalidate these other
sessions.
To end the Web Tools session with upfront login enabled
Click Logout in the Switch Explorer.
or
Click the X in the upper-right corner of the Switch Explorer browser window to close it.
To end the Web Tools EZ session
Click Log Out at the bottom of the task bar.
Session Management
A Web Tools session is defined as the connection between the Web Tools client and its managed
switch.
A session is established when you log in to a switch through Web Tools. The scope of the session
depends on whether upfront login is enabled:
1-12
•
If upfront login is enabled, a single session is shared by the Switch Explorer and all child windows
launched from it. Closing or navigating away from the Switch Explorer ends the session and
invalidates all related child windows. Closing the child windows, however, does not end the
session.
•
If upfront login is not enabled, a session encompasses only the child window to which you are
logged in (such as the Switch Admin, Zone Admin, and other protected modules). You can open
multiple sessions from the same Switch Explorer window. Closing or navigating away from the
Switch Explorer does not close the session or affect the child windows.
Web Tools Administrator’s Guide
Publication Number: 53-0000522-09
Session Management
1
A session remains in effect until one of the following happens:
•
•
•
•
•
You log out.
You close or navigate away from the Switch Explorer window (if upfront login is enabled).
You refresh the Switch Explorer window (if upfront login is enabled).
You close the child window (if upfront login is disabled).
The session times out due to inactivity.
A session automatically times out if it has been inactive for longer than two hours. Inactivity does not
mean “no user activity” (such as keystrokes or mouse movements); it means “no information sent to the
switch” (by clicking Apply or Save buttons). For example, in the Zoning module you can spend a lot of
time setting up a zoning scheme without actually sending information to the switch. Web Tools does not
display a warning when the session is about to time out. If the session times out, you must restart Web
Tools and log in again.
Web Tools enables sessions to both secure and nonsecure switches.
Web Tools Administrator’s Guide
Publication Number: 53-0000522-09
1-13
1
1-14
Session Management
Web Tools Administrator’s Guide
Publication Number: 53-0000522-09
Chapter
Using Web Tools EZ
2
This chapter describes Web Tools EZ, the application for basic switch management. It contains the
following sections:
•
•
•
•
•
•
•
“Overview,” next
“Monitoring the Switch” on page 2-4
“Performing Switch Setup” on page 2-12
“Assigning Device Aliases” on page 2-13
“Managing Basic Zoning” on page 2-13
“Accessing Web Tools for Advanced Management” on page 2-14
“Logging Out of Web Tools EZ” on page 2-14
Overview
Web Tools EZ is a simplified version of Web Tools. It simplifies switch management by providing an
easy-to-use subset of basic switch-management tasks.
Web Tools EZ works for a single switch fabric only. It displays only the launch switch and associated
tasks, without fabric information.
Web Tools EZ supports the following switches running firmware version 5.0.1. It does not support
chassis-based switches.
•
•
SilkWorm 200E
SilkWorm 3250
The illustrations in this chapter show examples of the SilkWorm 200E switch. If you have a SilkWorm
3250 switch, your screens might vary.
You can use Web Tools EZ to do the following:
•
•
•
monitor the switch, including port and FRU status
manage basic zoning
perform basic switch configurations
Figure 2-1 on page 2-2 shows an example of the initial Web Tools EZ screen. The following sections
describe the components of the screen.
Web Tools Administrator’s Guide
Publication Number: 53-0000522-09
2-1
2
Overview
Figure 2-1
Web Tools EZ Components
A
B
D1
C
D
D2
Legend for Figure 2-1:
2-2
A
Task Bar
B
Caption Bar
C
Content Page
D
Status Bar
D1
Error and progress indicator
D2
User name and IP address
Web Tools Administrator’s Guide
Publication Number: 53-0000522-09
Overview
2
Task Bar
The left pane of Web Tools EZ is the task bar, which displays all tasks. The tasks are categorized by
switch, zoning, and device. Clicking a category displays the following:
Switch
Switch status
Zoning
Active zoning in matrix
Device
Device table
When Web Tools EZ launches, the Switch status page is shown by default.
Caption Bar
The caption bar displays the switch name and the switch time. You can modify this information by
clicking Setup in the task bar.
Click the refresh icon to update the information on the screen with the current switch information.
When you click a different task in the task bar, the display is automatically refreshed.
Content Page
Web Tools EZ displays information in pages, which are displayed on the right side of the window. A
page can contain a table or other information. Additionally, a page might contain tabs. The tabs are at
the top of the page and provide a categorized view of information about objects shown on the page. You
can click a tab to view the display for that tab.
Status Bar
The status bar is at the bottom of the window. It is divided into the following sections:
•
Error and progress indicator
This is on the left side of the status bar. When Switch Manager is sending data to or retrieving data
from the Multiprotocol Router, this indicator is animated. The indicator turns red if there are any
errors during the retrieval process. Clicking this indicator opens the Error Log window.
•
User name and IP address
The right side of the status bar lists your user ID, your role, and the IP address of the switch to
which you are connected.
Web Tools Administrator’s Guide
Publication Number: 53-0000522-09
2-3
2
Monitoring the Switch
Monitoring the Switch
Using Web Tools EZ, you can view the following:
•
•
•
•
•
switch status, including port status
temperature, fan, and power supply status
HBA and storage connections to the switch
information about devices connected to the switch
accessibility between HBAs and storage
To view switch information
1.
Click Switch in the task bar.
2.
Click the Summary tab to display the Switch View, as shown in Figure 2-2. The Switch View
differs depending on the type of switch.
3.
Click the Details tab to display switch information in tabular format (see Figure 2-6 on page 2-7).
Figure 2-2
2-4
Graphical View of Switch
Web Tools Administrator’s Guide
Publication Number: 53-0000522-09
Monitoring the Switch
2
Switch View
The Switch View is a real-time view of switch and port status. The display is updated approximately
once every 15 seconds. From the display you can determine the following:
•
•
•
•
fan status
temperature status
power supply status
status and type of each port
The background color of the Fan, Temp, and Power icons indicate the overall status of the fan,
temperature, and power supply as follows:
•
•
•
green (healthy)
yellow (marginal)
red (critical)
Port Status
The Switch View displays port graphics with blinking LEDs, simulating the physical appearance of the
ports. Two LEDs are associated with each port: one of the LEDs indicates port status; the other
indicates port speed. For LED information, refer to the hardware documentation for the switch you are
viewing.
The background color of the port icon indicates the port status, as follows:
•
•
•
•
green (healthy)
yellow (marginal)
red (critical)
gray (unmonitored)
If the entire port icon is blue, the port is buffer-limited.
If a group of port icons is grayed out, those ports are not licensed.
Figure 2-3 shows port icons and associated LEDs from a SilkWorm 200E switch. The SilkWorm 3250
has a similar layout.
Figure 2-3
Port and LED Status Color-Coded Information in the Port Icon in Switch View
The background color of the
port icon indicates port status.
The blinking LEDs indicate port
status and port speed.
Web Tools Administrator’s Guide
Publication Number: 53-0000522-09
2-5
2
Monitoring the Switch
Holding your mouse over the port icon displays the port number, port type, and port status, as shown in
Figure 2-4.
Figure 2-4
Displaying Port Information
Holding your mouse over the LEDs provides details about the port state and port speed, as shown in
Figure 2-5.
Figure 2-5
Port State and Port Speed LEDs.
Detail View
Click the Detail tab to display switch information in tabular format, as shown in Figure 2-6 on page 2-7.
2-6
Web Tools Administrator’s Guide
Publication Number: 53-0000522-09
Monitoring the Switch
Figure 2-6
2
Detail View of Switch Information
In addition to switch information, the Detail page also shows information for the temperature sensors,
fans, power supply, and ports. The Detail page displays:
•
•
•
state and temperature of each temperature sensor
state and speed of each fan
state of each power supply
Scroll down in the page to view the port information, as shown in Figure 2-7 on page 2-8. The Detail
page displays the following for each port:
•
•
•
•
•
•
port number
port name
state of the port
port type
status (health) of the port
indication of whether the port is licensed
Web Tools Administrator’s Guide
Publication Number: 53-0000522-09
2-7
2
Monitoring the Switch
Figure 2-7
Detail View, Showing Port Information
Device Connections
Web Tools EZ allows you to view a graphical representation of the switch and the devices that are
connected to each port.
To view the device connections
1.
Click Display Connections in the task bar.
A graphical representation of the switch and connections displays, as shown in Figure 2-8 on
page 2-9. This is a real-time display; the connections are automatically updated as you connect and
disconnect HBAs and storage.
If fixed zoning is set on the switch, Web Tools EZ validates the connections and displays whether
the connections are valid or invalid.
2-8
Web Tools Administrator’s Guide
Publication Number: 53-0000522-09
Monitoring the Switch
Figure 2-8
2
Display Connections Page
Devices
Click Devices in the task bar to display a table of information for all of the connected devices (see
Figure 2-9 on page 2-10). The entries in the table are based on the device WWNs, so a single physical
device can have more than one entry in the table.
The Devices page displays the following information:
•
•
•
•
•
whether the device is an HBA or a storage device
device alias name, if one exists
vendor name
device name
WWN of the device port
This is a hyperlink that, when clicked, displays additional information about the device, as shown
in Figure 2-10 on page 2-11.
•
switch and port to which the device is connected.
Web Tools Administrator’s Guide
Publication Number: 53-0000522-09
2-9
2
Monitoring the Switch
Figure 2-9
2-10
Devices Page
Web Tools Administrator’s Guide
Publication Number: 53-0000522-09
Monitoring the Switch
2
Figure 2-10 Detailed Device Information
Device Accessibility (Zoning)
Device accessibility depends on how zoning is set up on the switch. Zoning enables you to partition
your storage area network (SAN) into logical groups of devices that can access each other.
To view device accessibility
1.
Click Zoning in the task bar.
The device accessibility matrix displays (shown in Figure 2-11 on page 2-12), indicating which HBAs
can access which storage devices.
The HBA and storage device names displayed in the matrix are the alias names of the devices (refer to
“Assigning Device Aliases” on page 2-13 for additional information).
Web Tools Administrator’s Guide
Publication Number: 53-0000522-09
2-11
2
Performing Switch Setup
Figure 2-11 Zoning Page (Device Accessibility Matrix)
Performing Switch Setup
Using Web Tools EZ, you can relaunch the switch setup wizard to perform the following tasks:
•
•
•
•
change the switch name
change the switch time
change the admin password
change the zoning configuration type
This is the same wizard that was launched the first time you set up the switch.
To perform basic switch setup tasks
1.
Click Setup in the task bar.
The Web Tools EZ switch setup wizard launches.
2.
Follow the instructions in the wizard.
You can optionally change the switch name, switch time, and admin password. When prompted,
you must select a zoning configuration.
2-12
Web Tools Administrator’s Guide
Publication Number: 53-0000522-09
Assigning Device Aliases
2
Assigning Device Aliases
Every device has a device name and an alias name. Alias names make it easier to reference the devices.
Alias names are displayed in the device accessibility matrix on the Zoning page. You can assign or
rename the alias names using the following procedure.
To assign or rename device aliases
1.
Click Name Alias in the task bar.
This launches the Define Device Alias wizard.
2.
Double-click in the New Alias column to edit the alias field.
3.
Click OK.
The wizard also prompts you to delete the aliases of any offline devices. Follow the instructions in the
wizard.
Managing Basic Zoning
Basic zoning allows you to customize which HBAs can access which storage devices. This section
describes how you can validate and modify the device accessibility and restore zoning to the factory
default (fixed zoning) setting.
Validate Device Accessibility
You can validate the current zoning configuration against the following rules:
•
•
•
Every HBA has access to at least one storage device.
Every storage device is accessible by at least one HBA.
No offline devices exist in the zoning configuration.
To validate the zoning configuration and remove offline devices
1.
Click Validate in the task bar.
The Validate Zoning wizard launches.
2.
Follow the instructions in the wizard.
3.
Note any devices that are not zoned properly and, after exiting the wizard, click Edit to update the
device accessibility matrix.
Edit Device Accessibility
You can customize which HBAs can access which storage devices.
Web Tools Administrator’s Guide
Publication Number: 53-0000522-09
2-13
2
Accessing Web Tools for Advanced Management
To edit device accessibility
1.
Click Edit in the task bar.
The Edit Device Accessibility (Zone) wizard launches.
2.
Follow the instructions in the wizard to modify the device accessibility. Every HBA should access
at least one storage device, and every storage device should be accessible by at least one HBA.
The wizard automatically verifies device accessibility, generates the appropriate zones based on your
modifications to the matrix, and displays the zoning summary when you are done.
Restore Fixed Zoning
Fixed zoning is a preconfigured default zoning setup that is set at the factory. It enforces the rule of one
HBA port zoned with one storage port. Fixed zoning is hard zoning; each zone member is identified by
the default switch domain (1) and a port number. Fixed zoning is set up based on fixed port usage,
which means that a set of switch ports is designated to be used as HBA (host) ports and a set of ports is
designated to be used as storage ports.
To restore fixed zoning
1.
Click Restore Fixed Zoning in the task bar.
2.
Click Yes in the confirmation window.
When this task is complete, the matrix in the Zoning page is automatically updated to reflect the
changes.
Accessing Web Tools for Advanced Management
To manage the switch using the full power of Web Tools, ensure that you have completed all Web
Tools EZ tasks and then click Advanced Management at the bottom of the task bar. The Web Tools
EZ session will be closed. Any editing in Web Tools EZ that has not been applied is lost.
After entering Web Tools, you must re-log in to manage the switch.
You cannot return to Web Tools EZ unless you close and re-open your browser window and relaunch
Web Tools.
The remainder of this document describes the Web Tools interface.
Logging Out of Web Tools EZ
To log out of Web Tools EZ and log in as another user, click Log Out at the bottom of the task bar.
Web Tools EZ exits, and a new login window appears.
2-14
Web Tools Administrator’s Guide
Publication Number: 53-0000522-09
Chapter
Using Advanced Web Tools
3
This chapter contains the following sections:
•
•
•
•
•
“Viewing the Switch Explorer,” next
“Displaying Switches in the Fabric” on page 3-10
“Ending the Web Tools Session” on page 3-10
“Using Web Tools and Secure Mode” on page 3-10
“Working With Web Tools: Recommendations” on page 3-12
Viewing the Switch Explorer
The first thing you see when you log in to a switch with Web Tools is the Switch Explorer (see
Figure 3-1 on page 3-2). The Switch Explorer is divided into several areas that provide access to and
information about the switch and fabric. You should familiarize yourself with these areas, as the
procedures in this guide refer to them as follows:
•
•
Fabric Tree, which displays a list of all the switches in the fabric
•
•
Switch View, which displays an interactive graphical representation of the switch
•
Switch Information View, which displays information about the switch such as name, status,
Fabric OS version, domain ID, IP address, and WWN
•
Status Legend, which defines the meaning of the colors visible in the background of various icons
in the Switch Explorer
Fabric Toolbar, which provides access to fabric-wide management interfaces, such as Name
Server, zoning, and events
Switch View Button Menu, which displays buttons providing switch information such as status,
event information, access to telnet, switch administration, switch performance, beaconing, and
much more
These areas are described further in the sections that follow.
Clicking some of the buttons and icons in the Switch Explorer opens up a separate module, from which
you can perform management tasks. In this document, a module is a collection of related tabs or
“views” that display in a single browser window. The zoning module and the Switch Admin module
require you to log in, if upfront login is not enabled.
The format of the Switch Explorer varies, depending on the hardware type. Figure 3-1 on page 3-2
through Figure 3-5 on page 3-6 show Switch Explorer examples for several SilkWorm switches.
Note that the figures are grayed out so that you can more easily see the areas of the Switch Explorer.
In Figure 3-1 through Figure 3-5, the letters A through F call out the different areas within the Switch
Explorer. Table 3-1 on page 3-2 is a key for these callouts.
Web Tools Administrator’s Guide
Publication Number: 53-0000522-09
3-1
3
Viewing the Switch Explorer
Table 3-1
Key to Figure 3-1 Through Figure 3-5
Callout Letter
Area of Switch Explorer View
A
Fabric Tree
B
Fabric Toolbar
C
Switch View
D
Switch View Button Menu
E
Switch Information View
F
Status Legend
SilkWorm 12000 Director
Figure 3-1 shows an example of the Web Tools Switch Explorer for a SilkWorm 12000 director.
Figure 3-1
Web Tools Switch Explorer for a SilkWorm 12000 Director
A
B
3-2
C
E
D
Active CP Arrow
F
Web Tools Administrator’s Guide
Publication Number: 53-0000522-09
3
Viewing the Switch Explorer
In this figure, the SilkWorm 12000 director has two domains; however, only one domain is displayed.
You can view and manage only one domain at a time, even though both domains are enclosed in the
same chassis. To manage the other domain, you must log in to it separately.
The active CP in the SilkWorm 12000 director is labeled with a small arrow at the bottom of the CP.
SilkWorm 24000 Director
Figure 3-2 shows an example of the Web Tools Switch Explorer for a SilkWorm 24000 director. In this
figure, the SilkWorm 24000 director has two domains; however, only one domain is displayed. You can
view and manage only one domain at a time, even though both domains are enclosed in the same
chassis. To manage the other domain, you must log in to it separately.
Figure 3-2
Web Tools Switch Explorer for a SilkWorm 24000 Director (see Key on page 3-2)
A
B
Web Tools Administrator’s Guide
Publication Number: 53-0000522-09
C
Active CP LED Indicators
Active CP Arrow
D
E
F
3-3
3
Viewing the Switch Explorer
The active CP in the SilkWorm 24000 director is labeled with a small arrow at the bottom of the CP
display. The SilkWorm 24000 active CP is also indicated with the blue Active CP LED indicator, as
shown in the figure.
SilkWorm 48000 Director
Although the SilkWorm 48000 director has a single chassis, it can contain one domain or two domains.
Figure 3-3 shows an example of the Web Tools Switch Explorer for a single-domain SilkWorm 48000
director.
Figure 3-3
Web Tools Switch Explorer for a SilkWorm 48000 Director (see Key on page 3-2)
A
B
3-4
C
E
Active CP LED Indicators
D
Active CP Arrow
F
Web Tools Administrator’s Guide
Publication Number: 53-0000522-09
3
Viewing the Switch Explorer
SilkWorm 3250 Switch
Figure 3-4 shows an example of the Web Tools Switch Explorer for a SilkWorm 3250 switch. This is
the same format as the Switch Explorer used in Web Tools for the SilkWorm 200E, 3850, 3900, and
4100 switches.
Figure 3-4
Web Tools Switch Explorer for a SilkWorm 3250 Switch (see Key on page 3-2)
A
B
Web Tools Administrator’s Guide
Publication Number: 53-0000522-09
C
D
E
F
3-5
3
Viewing the Switch Explorer
SilkWorm 3016 Switch
Figure 3-5 shows an example of the Web Tools Switch Explorer for a SilkWorm 3016 switch. The
SilkWorm 3014 and 4012 switches have a similar Switch Explorer format.
Figure 3-5
Web Tools Switch Explorer for a SilkWorm 3016 Switch (see Key on page 3-2)
A
B
3-6
C
External Ports
E
Internal Ports
D
F
Web Tools Administrator’s Guide
Publication Number: 53-0000522-09
Viewing the Switch Explorer
3
Refresh Rates
Different panels of Web Tools refresh at different rates. Table 3-2 lists the polling rates for the various
panels in Web Tools.
The refresh, or polling, rates listed in this section and throughout the book indicate the time between the
end of one polling and the start of the next, and not how often the screen is refreshed. That is, a refresh
rate of 15 seconds does not mean that a refresh occurs every 15 seconds. It means that a new refresh
starts 15 seconds after the previous refresh finished.
Table 3-2
Polling Rate in the Switch Explorer Window
Switch Explorer Area
Polling Rate
Name Server
User-defined; 15 seconds minimum
Zoning Database
60 seconds
Fabric Watch
15 seconds
Performance Monitor
30 seconds
Fabric Tree
The Fabric Tree is the left panel of the Switch Explorer. The Fabric Tree displays all switches in the
fabric, including switches that do not have a Web Tools license. Any switches segmented before Web
Tools is launched are not displayed.
Although all switches in the fabric are displayed, only switches that have a Web Tools license installed
can be managed through Web Tools. Other switches must be managed through the Fabric OS command
line interface (CLI) or another management application. For information on adding a Web Tools license
to a switch, see “Installing a Web Tools License” on page 1-4.
Use the drop-down menu at the top of the panel to view switches in the Fabric Tree by switch name, IP
address, or WWN. The background color of the switch icon indicates the current status of the switch.
You can “mouse-over” a switch in the fabric tree to display the IP address and current status.
You can manually refresh the status of a switch within the fabric by right-clicking that switch in the
Fabric Tree and clicking Refresh.
Web Tools Administrator’s Guide
Publication Number: 53-0000522-09
3-7
3
Viewing the Switch Explorer
Fabric Toolbar
The Fabric Toolbar at the bottom of the Fabric Tree enables you to access fabric-wide administration
tasks quickly. The Fabric Toolbar icons provide access to:
•
Fabric events
This information is collected from the launch switch. Refer to “Monitoring Events”
on page 4-20 for more information.
•
Topology module
This information is collected from the selected switch. Refer to “Displaying a Fabric
Topology Report” on page 4-26 for more information.
•
Name Server information
This information is collected from the selected switch. Refer to “Displaying the
Name Server Entries” on page 4-27 for more information.
•
Zone Administration module
This information is collected from the selected switch. This icon is displayed only if a
Brocade Advanced Zoning license is installed on the switch. If secure mode is
enabled, zoning can be administered only from the primary fabric configuration
server (FCS) switch. If the selected switch has a zoning license installed but is not the
primary switch, the Zone Admin icon is displayed but not activated. Refer to
“Managing Zoning with Web Tools” on page 10-2 for more information.
It is important to note that the information displayed is gathered from different areas; switches in the
fabric might be running different versions of Fabric OS, and different versions of Fabric OS support
different features, so the information displayed might not always be the same for switches running
different versions of Fabric OS.
Switch View
The Switch View displays a graphical representation of the selected switch, including a real-time view
of switch and port status. This view is accessed by selecting a switch icon in the Fabric Tree.
Note
The Switch View display is updated approximately once every 15 seconds. However, the initial display
of the Switch Explorer might take from 30 to 60 seconds after the switch is booted.
The layout of information is different for the Switch View of different switch types. See Figure 3-1
through Figure 3-5 for examples of different Switch Views.
3-8
Web Tools Administrator’s Guide
Publication Number: 53-0000522-09
Viewing the Switch Explorer
3
Switch View Button Menu
The Switch View button menu is the launch point for the Switch Events screen, telnet interface, Fabric
Watch module, Switch Admin module, Performance Monitor module, and High Availability (HA)
Admin module. Some of these functions require a license key to activate. The Switch View button
menu also includes buttons that display the status of the switch fans, temperature monitors, switch
information, power supply, and beacon. If upfront login is enabled, the Switch View button menu also
includes a Logout button.
It is important to note that certain Fabric OS features are available only on particular switch types;
therefore, the icons for those features are displayed only for those switch types. For example, the High
Availability feature is available only on the SilkWorm 12000, 24000, and 48000 directors; therefore,
the HA Admin button displays in the Switch View button menu only for those directors.
The following buttons have a color-coded background, which indicates status for that area:
•
•
•
•
•
Status
Fan
Temp
Power
Hi Avail (HA)
The colors follow the status legend (see “Status Legend” on page 3-9).
Switch Information View
The Switch Information View displays vital switch information such as name, status, Fabric OS
version, domain ID, IP address, WWN, and current zone configuration. The information in the Switch
Information View is polled every 15 seconds.
The Switch Information View is located beside the graphic representation of the switch for the
SilkWorm 12000, 24000, and 48000 directors. For all other switch types (SilkWorm 200E, 3014, 3016,
3250, 3850, 3900, 4012, and 4100), the Switch Information View is located beneath the graphic
representation of the switch.
For more information, refer to “Displaying Switch Information” on page 11-4.
Status Legend
The Status Legend is included in the Switch Information View and defines the meaning of colors visible
in the background of the various icons in the Switch Explorer. Each color indicates a different
operational state:
•
•
•
•
Green: healthy
Yellow: marginal
Red: critical
Gray: unknown or unmonitored
Note
For all status displays based on errors per time interval, any errors cause the status to show faulty until
the entire sample interval has passed.
Web Tools Administrator’s Guide
Publication Number: 53-0000522-09
3-9
3
Displaying Switches in the Fabric
Displaying Switches in the Fabric
If your fabric has more than one switch, you can launch Web Tools from one switch and then access
other switches.
To access the Switch Explorer for a particular switch
1.
Launch Web Tools as described in “Launching Web Tools” on page 1-7.
The Switch Explorer is displayed for the switch you logged in to. The Fabric Tree is expanded by
default when you first launch Web Tools.
2.
If the Fabric Tree is not expanded, click the “+” in the Fabric Tree to view all the switches in the
fabric.
3.
Click a switch in the Fabric Tree.
A separate browser window opens and displays the selected switch. (If the launch switch is running
a Fabric OS version earlier than v5.0.1, the selected switch displays in the same browser window.)
The graphic of the selected switch is displayed in the Switch View. Additional switch information
is displayed in the Switch Information View.
Ending the Web Tools Session
You can end your Web Tools session either by logging out or by closing the Switch Explorer browser
window.
A session automatically times out if it has been inactive for longer than two hours. If the session times
out, you must restart Web Tools and log in again. Refer to “Session Management” on page 1-12 for
more information about sessions.
To end the Web Tools session
Click Logout in the Switch Explorer. (This button is displayed only if upfront login is enabled.)
or
Click the X in the upper-right corner of the Switch Explorer browser window to close it.
Using Web Tools and Secure Mode
When secure mode is enabled on switches you manage through Web Tools, there are certain
requirements and scenarios of which you should be aware. You should read through the requirements
and scenarios in this section if you plan to use Web Tools to manage any switches that have secure
mode enabled.
3-10
Web Tools Administrator’s Guide
Publication Number: 53-0000522-09
Using Web Tools and Secure Mode
3
Web Tools Access and HTTP_POLICY
When secure mode is enabled, access to the Web Tools interface is controlled by HTTP_POLICY. If
secure mode is enabled and HTTP_POLICY has been defined, your workstation IP address must be
included in this policy or you will not have access to Web Tools for any switch in the fabric. If your
workstation IP is not included in this policy, the Interface Disabled page is displayed when you attempt
to access a switch. For instructions on including your workstation in HTTP_POLICY, refer to the
Secure Fabric OS Administrator’s Guide.
Note
If a secure mode change is made in the fabric—that is, secure mode is enabled, secure mode is disabled,
or there is a change to the primary FCS—you must exit and relaunch Web Tools. If Web Tools is kept
open after a secure mode change occurs, behavior is undefined.
Opening Modules in a Secure Fabric
When opening more than one module in a secure fabric, wait for each module to load completely before
opening another. For example, if you want to access both the Zone Admin and the Switch Admin
modules, open one of the modules and wait for it to load completely before opening the second module.
Abnormal behavior might occur if you attempt to open two modules simultaneously in a fabric with
secure mode enabled.
Certain Web Tools features are limited or disabled when secure mode is enabled on a fabric. For more
information about secure mode, refer to the Secure Fabric OS Administrator’s Guide.
Primary-FCS-Only Functionality
The following Web Tools functionality is reserved for the primary FCS when secure mode is enabled:
•
Zoning administration is allowed only from the primary FCS switch when secure mode is enabled.
For all other switches in a secure fabric, the Zoning button is disabled.
•
SNMP community strings can be modified only from the primary FCS switch when secure mode is
enabled. For non-FCS switches, you can view the SNMP community strings, but they are readonly, and the SNMP access control lists on the SNMP tab are not displayed.
•
User account administration is allowed only from the primary FCS switch when secure mode is
enabled. The changes are then propagated to all switches in the fabric.
Disabled Functionality
Telnet access to a switch and the Telnet button in Web Tools are both disabled when secure mode is
enabled for a fabric. You must use sectelnet or SSH to access the Fabric OS CLI in a secure fabric.
These capabilities are not accessible from Web Tools. For more information on sectelnet or SSH, refer
to the Secure Fabric OS Administrator’s Guide.
The SNMP Access Control List is replaced with RSNMP_POLICY and WSNMP_POLICY when
secure mode is enabled for a fabric. The SNMP Access Control List is not displayed in Web Tools.
Web Tools Administrator’s Guide
Publication Number: 53-0000522-09
3-11
3
Working With Web Tools: Recommendations
Working With Web Tools: Recommendations
Listed below are recommendations when working with Web Tools:
3-12
•
When using a mixed fabric—that is a fabric containing switches and directors running v4.x, v3.x,
and v2.x firmware—use the most advanced switches or directors to control the fabric. For example,
use the v4.x switches or directors as the primary FCS, the location to perform zoning tasks, and the
time server (CLI). You should use the most recently released firmware on your switches.
•
If switches are accessed simultaneously from different connections (for example, Web Tools, CLI,
and API), changes from one connection might not be updated to the other, and some modifications
might be lost. Make sure when connecting with simultaneous multiple connections that you do not
overwrite the work of another connection.
•
Several tasks in Web Tools make fabric-level changes: for example, the tasks in the Zone Admin
module. When executing fabric-level configuration tasks, wait until you have received
confirmation that the changes are implemented before executing any subsequent tasks. For a large
fabric, this can be up to a few minutes.
•
A maximum of five simultaneous HTTP sessions to any one switch is recommended. An HTTP
session is considered a Fabric Manager or Web Tools connection to the switch.
Web Tools Administrator’s Guide
Publication Number: 53-0000522-09
Chapter
Managing Your Fabrics, Switches, and Ports
4
This chapter contains the following sections:
•
•
•
•
•
•
•
•
•
•
•
•
•
•
•
•
“Managing Fabrics, Switches, and Ports Using Web Tools,” next
“Launching the Telnet Window” on page 4-3
“Configuring IP and Netmask Information” on page 4-4
“Configuring a syslog IP Address” on page 4-5
“Configuring a Switch” on page 4-5
“Rebooting the Switch” on page 4-7
“Changing System Configuration Parameters” on page 4-8
“Configuring Ports” on page 4-12
“Activating Ports on Demand” on page 4-15
“Maintaining Licensed Features” on page 4-16
“Administering High Availability” on page 4-18
“Monitoring Events” on page 4-20
“Displaying a Fabric Topology Report” on page 4-26
“Displaying the Name Server Entries” on page 4-27
“Physically Locating a Switch Using Beaconing” on page 4-28
“Displaying Swapped Port Area IDs” on page 4-29
Managing Fabrics, Switches, and Ports Using Web
Tools
You can perform most of management tasks described in this chapter through the Switch Admin
module. Information in the Switch Admin module is retrieved from the selected switch.
Click the Admin button in the Switch View to access the Switch Admin module. Figure 4-1 on
page 4-2 shows the Switch Admin module.
Web Tools Administrator’s Guide
Publication Number: 53-0000522-09
4-1
4
Managing Fabrics, Switches, and Ports Using Web Tools
Figure 4-1
Switch Admin Module
With the exception of switch time, information displayed in the Switch Admin module is not updated
automatically by Web Tools. To update the information displayed in the Switch Admin module, refer to
“Refreshing the Switch Admin Module” on page 4-3.
Caution
Any changes you make in the Switch Admin module are in a buffered environment and are not applied
to the switch until you save the changes. (The exception to this is the License tab, where changes are
applied immediately and there is no Apply button, and the upload trace function in the Trace tab.) If you
close the Switch Admin module without saving your changes, your changes are lost. To save the
buffered changes you make in the Switch Admin module to the switch, click Apply before closing the
module or before switching to another tab.
Some of the management tasks for the SilkWorm 12000, 24000, and 48000 directors are performed
through the Hi Avail module. This module and the associated tasks are described in “Administering
High Availability” on page 4-18.
You can also use telnet commands to perform management tasks. Refer to “Launching the Telnet
Window” on page 4-3 for information on how to launch a telnet window through Web Tools.
The remainder of this section describes basic Switch Admin module procedures that are useful for many
switch-management operations.
4-2
Web Tools Administrator’s Guide
Publication Number: 53-0000522-09
Launching the Telnet Window
4
Launching the Switch Admin Module
Most of the management procedures in this chapter are performed from the Switch Admin module.
To access the Switch Admin module
1.
Select a switch from the Fabric Tree.
The selected switch appears in the Switch View.
2.
Click the Admin button on the Switch View.
The Switch Admin module displays (as shown in Figure 4-1 on page 4-2).
Refreshing the Switch Admin Module
You can refresh the fabric element information displayed at any time using the following procedure.
Note that when you click a different tab in the Switch Admin module, the information in the newly
selected tab is automatically refreshed.
To refresh the fabric information
1.
Click the Refresh button in any tabbed page of the Switch Admin module.
Launching the Telnet Window
When you launch a telnet window for the SilkWorm 12000, 24000, or 48000 directors, it is on a logicalswitch basis. This means that for each logical switch, you must launch a separate telnet window. Refer
to the Fabric OS Command Reference Manual for information about the telnet commands.
Note
Web Tools does not support telnet on the Mozilla browser. You must use an external command line
interface if using Mozilla.
Telnet access to a switch and the Telnet button in Web Tools are both disabled when secure mode is
enabled for a fabric. You must use sectelnet or SSH to access the Fabric OS CLI in a secure fabric.
These capabilities are not accessible from Web Tools. For more information on sectelnet or SSH, refer
to the Secure Fabric OS Administrator’s Guide.
To access telnet through Web Tools
1.
Select a switch from the Fabric Tree.
The selected switch appears in the Switch View.
2.
Click the Telnet button on the Switch View.
The Telnet window displays.
3.
To close the session when you are done, type the exit command at the telnet prompt.
Web Tools Administrator’s Guide
Publication Number: 53-0000522-09
4-3
4
Configuring IP and Netmask Information
Configuring IP and Netmask Information
When you configure IP and netmask information for the SilkWorm 12000, 24000, or 48000 director, it
is on a logical-switch basis. This means that for each logical switch, you must configure IP and subnet
mask information individually.
When changing the Ethernet IP/netmask, the Gateway IP, or the Fibre Channel net IP/net mask from
Web Tools, there is a normal loss of network connection to the switch. If the IP properties have
changed, you must close all current windows and restart Web Tools with the new IP address.
To configure IP and netmask information
1.
Launch the Switch Admin module as described on page 4-3.
2.
Click the Network tab (see Figure 4-2).
3.
Type a new value in the appropriate field (for example, 10.77.77.77).
4.
For the SilkWorm 12000, 24000, and 48000 directors only:
a.
Click Advanced.
b.
Type valid IP addresses for the Ethernet IP and subnet mask for CP0 and CP1.
c.
Click OK to return to the Network tab.
5.
Click Apply.
6.
Exit and relaunch Web Tools to continue working.
Figure 4-2
4-4
Network Tab
Web Tools Administrator’s Guide
Publication Number: 53-0000522-09
Configuring a syslog IP Address
4
Configuring a syslog IP Address
The syslog IP represents the IP address of the server that is running the syslog process. The syslog
daemon reads and forwards system messages to the appropriate log files and/or users, depending on the
system configuration. When one or more IP addresses are configured, the switch forwards all error log
entries to the syslog on the specified servers. Up to six servers are supported. Refer to Fabric OS
Administrator’s Guide for more information on configuring the syslog daemon.
When you configure a syslog IP address for the SilkWorm 12000 director or for a SilkWorm 24000 or
48000 configured with two logical switches, it is on a logical-switch basis. This means that for each
logical switch, you must configure a syslog IP address individually.
To configure the syslog IP address
1.
Launch the Switch Admin module as described on page 4-3.
2.
Click the Network tab (see Figure 4-2 on page 4-4).
3.
Enter a valid IP address in the New IP field (for example, 10.77.77.77).
4.
Click Add.
The configured IP is displayed in the Syslog IP window.
5.
Click Apply.
To remove a syslog IP address
1.
Launch the Switch Admin module as described on page 4-3.
2.
Click the Network tab.
3.
Select a syslog IP from the table.
4.
Click Remove.
5.
Optional: Click Clear All to remove all of the syslog IP addresses.
6.
Click Apply.
Configuring a Switch
Use the Switch tab of the Switch Admin module to perform basic switch configuration. Figure 4-1 on
page 4-2 shows an example of the Switch tab.
Enabling and Disabling a Switch
You can identify if a switch is enabled or disabled in the Switch Admin module by looking at the
bottom right corner: the
icon means that the switch is enabled, and the
icon means that the
switch is disabled.
Use the following procedure to enable or disable a switch.
To enable or disable a switch
1.
Launch the Switch Admin module as described on page 4-3.
2.
Click the Switch tab.
Web Tools Administrator’s Guide
Publication Number: 53-0000522-09
4-5
4
Configuring a Switch
3.
Click the Enable radio button in the Switch Status section to enable the switch, or click the
Disable radio button to disable the switch.
4.
Click Apply.
Changing the Switch Name
Switches can be identified by IP address, domain ID, World Wide Name (WWN), or customized switch
names that are unique and meaningful.
Switch names can be a maximum of 15 characters long for Fabric OS v5.0.1. They must begin with an
alpha character, but otherwise can consist of any combination of alphanumeric and underscore
characters.
To change the switch name
1.
Launch the Switch Admin module as described on page 4-3.
2.
Click the Switch tab.
3.
Type a new name in the Name field.
4.
Click Apply.
Note
Beginning with Fabric OS v4.4.0, it is recommended that you customize the chassis name for each
switch. Some system messages identify a switch service by chassis name, so if you assign meaningful
chassis names in addition to meaningful switch names, logs will be more useful. You change the chassis
name using the CLI. Refer to the Fabric OS Administrator’s Guide for instructions on changing the
chassis name.
Changing the Switch Domain ID
Although domain IDs are assigned dynamically when a switch is enabled, you can request a specific ID
to resolve a domain ID conflict when you merge fabrics.
To change the switch domain ID
1.
Launch the Switch Admin module as described on page 4-3.
2.
Disable the switch, as described in “Enabling and Disabling a Switch” on page 4-5.
3.
Click the Switch tab.
4.
Type a new domain ID in the Domain ID field.
The domain ID is an integer between 1 and 239.
4-6
5.
Click Apply.
6.
Enable the switch, as described in “Enabling and Disabling a Switch” on page 4-5.
Web Tools Administrator’s Guide
Publication Number: 53-0000522-09
Rebooting the Switch
4
Viewing and Printing a Switch Report
The switch report includes the following information:
•
•
•
•
•
•
a list of switches in the fabric
switch configuration parameters
a list of ISLs and ports
Name Server information
zoning information
SFP serial ID information
To view or print a switch report
1.
Launch the Switch Admin module as described on page 4-3.
2.
Click the Switch tab.
3.
Click View Report.
A switch report displays in a new window.
4.
View or print the report using your browser.
Rebooting the Switch
When you reboot the switch, the reboot takes effect immediately.
Performing a Fast Boot
A fast boot reduces boot time significantly by bypassing power-on self test (POST).
To perform a switch fast boot
1.
Launch the Switch Admin module as described on page 4-3.
2.
Click the Firmware tab (see Figure 5-2 on page 5-4).
3.
Click the Fastboot radio button.
4.
Click Apply.
Performing a Reboot
Use the following procedure to reboot the CP and execute the normal power-on booting sequence.
Web Tools Administrator’s Guide
Publication Number: 53-0000522-09
4-7
4
Changing System Configuration Parameters
To perform a switch reboot
1.
Launch the Switch Admin module as described on page 4-3.
2.
Click the Firmware tab (see Figure 5-2 on page 5-4).
3.
Click the Reboot radio button.
4.
Click Apply.
Changing System Configuration Parameters
When you change system configuration parameters for the SilkWorm 12000 director or for a SilkWorm
24000 or 48000 configured with two logical switches, it is on a logical-switch basis. This means that for
each logical switch, you must change the system configuration parameters individually.
You must disable the switch before you can configure fabric parameters.
You can change the following system configuration parameters:
•
•
•
•
switch fabric settings
virtual channel settings
arbitrated loop parameters
system services
Configuring Fabric Parameters
You can configure the following fabric parameters using the Configure tab and Fabric subtab of the
Switch Admin module (as shown in Figure 4-3 on page 4-9):
•
BB Credit
The number of buffers available to attached devices for frame receipt. The default BB Credit is 16.
The range is 1 through 27.
•
R_A_TOV
Resource allocation timeout value (in milliseconds). This variable works with the E_D_TOV to
determine switch actions when presented with an error condition. The default is 10000. The
possible range is 4000 through 120000.
•
E_D_TOV
Error detect timeout value (in milliseconds). This timer is used to flag a potential error condition
when an expected response is not received within the set time. The valid range is 1000 through
5000.
•
Datafield size
The largest possible data field size (in bytes). The valid range is 256 through 2112.
•
Switch PID Format
Select a switch PID format from one of the following:
4-8
Format 1 (0-base, 256 encoding)
Format 2 (16-base, 256 encoding)
Web Tools Administrator’s Guide
Publication Number: 53-0000522-09
Changing System Configuration Parameters
•
4
Sequence Level Switching
Check this box to enable frames of the same sequence from a particular group to be transmitted
together. When this option is not selected, frames are transmitted interleaved among multiple
sequences. Under normal circumstances, sequence-level switching should be disabled for better
performance. However, some host adapters have issues when receiving interleaved frames among
multiple sequences.
•
Disable Device Probing
Set this mode only if the switch N_Port discovery process (PLOGI, PRLI, INQUIRY) causes an
attached device to fail. When set, devices that do not register with the Name Server are not present
in the Name Server data base.
•
Per-Frame Routing Priority
Choose to select or deselect per-frame routing priority. When enabled, the virtual channel ID is
used in conjunction with a frame header to form the final virtual channel ID.
•
Suppress Class F Traffic
Applies only if VC-encoded address mode is also set. When checked, translative addressing (which
allows private devices to communicate with public devices) is disabled.
•
Insistent Domain ID Mode
Set this mode to make the current domain ID insistent across reboots, power cycles, and failovers.
This mode is required fabric wide to transmit FICON® data.
Figure 4-3
Web Tools Administrator’s Guide
Publication Number: 53-0000522-09
Configure Tab, Fabric Subtab
4-9
4
Changing System Configuration Parameters
To configure fabric parameters
1.
Launch the Switch Admin module as described on page 4-3.
2.
Disable the switch as described in “Enabling and Disabling a Switch” on page 4-5.
3.
Click the Configure tab.
4.
Click the Fabric subtab.
5.
Make the fabric parameter configuration changes.
6.
Click Apply.
7.
Enable the switch as described in “Enabling and Disabling a Switch” on page 4-5.
Enabling Insistent Domain ID Mode (FICON only)
When insistent domain ID (ID_ID) mode is enabled, the current domain setting for the switch is
insistent; that is, the same ID is requested during switch reboots, power cycles, CP failovers, firmware
downloads, and fabric reconfigurations. If the fabric does not assign the insistent domain ID, the switch
segments from the fabric.
This parameter is for use with FICON only.
To enable insistent domain ID mode
1.
Launch the Switch Admin module as described on page 4-3.
2.
Disable the switch as described in “Enabling and Disabling a Switch” on page 4-5.
3.
Click the Configure tab.
4.
Click the Fabric subtab.
5.
Check the Insistent Domain ID Mode checkbox.
6.
Click Apply.
7.
Enable the switch as described in “Enabling and Disabling a Switch” on page 4-5.
Configuring Virtual Channel Settings
You can configure the parameters for eight virtual channels to enable fine-tuning for a specific
application. You cannot modify the first two virtual channels, which are reserved for switch internal
functions.
Caution
The default virtual channel settings have already been optimized for switch performance. Changing the
default values can improve switch performance but can also degrade performance. Do not change these
settings without fully understanding the effects of the changes.
VC Priority specifies the class of frame traffic given priority for a virtual channel.
4-10
Web Tools Administrator’s Guide
Publication Number: 53-0000522-09
Changing System Configuration Parameters
4
To configure system services
1.
Launch the Switch Admin module as described on page 4-3.
2.
Disable the switch as described on page 4-5.
3.
Click the Virtual Channel subtab.
4.
Type a value in the VC Priority field you want to change. Valid values for all fields are 2 or 3.
5.
Click Apply.
6.
Enable the switch as described on page 4-5.
Configuring Arbitrated Loop Parameters
You can configure the following arbitrated loop parameters using the Configure tab and Arbitrated
Loop subtab of the Switch Admin module:
Send Fan Frames
Check this box to specify that fabric address notification (FAN) frames
are sent to public loop devices to notify them of their node ID and address.
Always Send RSCN
Following the completion of loop initialization, a remote state change
notification (RSCN) is issued when FL_Ports detect the presence of new
devices or the absence of pre-existing devices. Check this box to issue an
RSCN upon completion of loop initialization, regardless of the presence
or absence of new or pre-existing devices.
Do Not Allow AL_PA 0x00 Check this box to disable 0x00 as an AL_PA value.
To configure arbitrated loop parameters
1.
Launch the Switch Admin module as described on page 4-3.
2.
Disable the switch as described in “Enabling and Disabling a Switch” on page 4-5.
3.
Select the Configure tab.
4.
Select the Arbitrated Loop subtab.
5.
Check or uncheck the boxes to enable or disable the corresponding arbitrated loop parameters.
6.
Click Apply.
7.
Enable the switch as described in “Enabling and Disabling a Switch” on page 4-5.
Configuring System Services
You can configure the following system services:
rstatd
Dynamically enables or disables a server that returns system operation
information through remote procedures calls (RPC).
rapid
Allows or disallows the API to communicate with the switch.
rusersd
Dynamically enables or disables a server that returns information about the user
logged into the system through remote procedure calls (RPC).
Disable RLS Probing Enables or disables FCP read link status (RLS) information probing for F_Ports
and FL_Ports. It is disabled by default.
Web Tools Administrator’s Guide
Publication Number: 53-0000522-09
4-11
4
Configuring Ports
To configure system services
1.
Launch the Switch Admin module as described on page 4-3.
2.
Disable the switch as described in “Enabling and Disabling a Switch” on page 4-5.
3.
Click the Configure tab.
4.
Click the System subtab.
5.
Check the boxes next to the system services that you want to enable. Uncheck a box to disable a
service.
Note: Checking the Disable RLS Probing box disables RLS probing. Unchecking this box
enables RLS probing.
6.
Click Apply.
7.
Enable the switch as described in “Enabling and Disabling a Switch” on page 4-5.
Configuring Ports
Use the Ports tab of the Switch Admin module to perform the basic port configuration procedures
described in this section. Figure 4-4 shows an example of the Ports tab.
Figure 4-4
4-12
Ports Tab
Web Tools Administrator’s Guide
Publication Number: 53-0000522-09
Configuring Ports
4
Configuring Port Type
The Current Type column in the Ports tab page indicates the actual or current type of the port:
•
If the port is offline, this value is the allowed types, or U-Port if no type constraint has been
specified.
•
If the port is online, this value is the type the port has actually negotiated to (normally L-Port for
storage ports, F-Port for HBA or host ports, and E-Port for ISLs).
The L-Port, F-Port, and E-Port columns indicate any constraints on what types the port can negotiate to
when it comes up.
Use the following procedure to configure the port type.
To configure the port type
1.
Launch the Switch Admin module as described on page 3-2.
2.
Click the Ports tab.
3.
This step is switch-specific:
For SilkWorm 12000, 24000, and 48000 directors, select the subtab that corresponds to the
correct slot for the logical switch.
For SilkWorm 200E, 3014, 3016, 3250, 3850, 3900, 4012, and 4100 switches, proceed directly to
the next step.
4.
Select a port by clicking the port number.
5.
Uncheck the following checkboxes, depending on how you want to configure the port type:
L-Port
The port can be used to connect a loop device.
F-Port
The port can be used to connect a non-loop device.
E-Port
The port can be used to connect to another switch.
By default, all of these boxes are checked, meaning that there is no constraint on port type. The port
will negotiate to its preferred type when the switch comes up, depending on what type of device or
switch it is attached to.
Unchecking a checkbox guarantees that the port will not attempt to function as a port of the
unchecked type.
At least one type must remain checked. L-Port and F-Port cannot both be unchecked.
6.
Click Apply.
Configuring Port Speed
The Current Speed column in the Ports tab page indicates the current speed of the port. Use the
following procedure to change the port speed.
Web Tools Administrator’s Guide
Publication Number: 53-0000522-09
4-13
4
Configuring Ports
To configure port speed
1.
Launch the Switch Admin module as described on page 4-3.
2.
Click the Ports tab.
3.
This step is switch-specific:
For SilkWorm 12000, 24000, and 48000 directors, select the subtab that corresponds to the
correct slot for the logical switch.
For SilkWorm 200E, 3014, 3016, 3250, 3850, 3900, 4012, and 4100 switches, proceed directly to
the next step.
4.
Select a port speed from the Change Speed drop-down list corresponding to the port for which you
want to change the speed.
5.
Click Apply.
Assigning a Name to a Port
Port names are optional. You can assign a name to a port to make port grouping easier. The Port Name
column in the Ports tab displays the port name, if one exists.
The SilkWorm 3016 switch is preconfigured with port names; you can change them to suit your needs.
To name a port
1.
Launch the Switch Admin module as described on page 4-3.
2.
Click the Ports tab.
3.
This step is switch-specific:
For SilkWorm 12000, 24000, and 48000 directors, select the slot subtab that corresponds to the
correct slot for the logical switch.
For SilkWorm 200E, 3014, 3016, 3250, 3850, 3900, 4012, and 4100 switches, proceed directly to
the next step.
4.
Double-click in the Port Name field for the port you want to change.
5.
Type a name for the port. Port names can be from 0 through 32 alphanumeric characters, unless
FICON Management Server (FMS) mode is enabled; if FMS mode is enabled, port names should
be limited from 0 through 24 alphanumeric characters. Although it is not required that port names
be unique, it is recommended.
6.
Click Apply.
Disabling a Port over Reboots
Use the following procedure to disable a port so that it remains disabled if the switch reboots.
To disable a port so that it remains disabled over reboots
4-14
1.
Launch the Switch Admin module as described on page 4-3.
2.
Click the Ports tab.
Web Tools Administrator’s Guide
Publication Number: 53-0000522-09
Activating Ports on Demand
3.
4
This step is switch-specific:
For SilkWorm 12000, 24000, and 48000 directors, select the slot subtab that corresponds to the
correct slot for the logical switch.
For SilkWorm 200E, 3014, 3016, 3250, 3850, 3900, 4012, and 4100 switches, proceed directly to
the next step.
4.
Check the Persistent Disable checkbox for that port you want to keep disabled over reboots.
5.
Click Apply.
Enabling and Disabling a Port
All licensed ports are enabled by default. You can disable and reenable them as necessary.
If a port is not licensed you cannot enable it until you install the Ports on Demand license. (Refer to
“Activating Ports on Demand” for more information.) The Licensed Port column indicates whether a
port is licensed.
Note
If you disable a principal ISL port (an ISL port that is used to communicate with the principal switch),
the fabric reconfigures. If the port was connected to a device, that device is no longer accessible from the
fabric. For more information, refer to the Fabric OS Administrator’s Guide.
To enable or disable a port
1.
Launch the Switch Admin module as described on page 4-3.
2.
Click the Ports tab.
3.
This step is switch-specific:
For SilkWorm 12000, 24000, and 48000 directors, select the slot subtab that corresponds to the
correct slot for the logical switch.
For SilkWorm 200E, 3014, 3016, 3250, 3850, 3900, 4012, and 4100 switches, proceed directly to
the next step.
4.
Check the box in the Enable Port column that corresponds to the port you want to enable.
Uncheck the box in the Enable Port column that corresponds to the port you want to disable.
5.
Click Apply.
6.
Review the log at the bottom of the tab for information regarding the switch configuration changes.
Activating Ports on Demand
The SilkWorm 200E model can be purchased with 8, 12, or 16 licensed ports. The SilkWorm 4100
model can be purchased with 16, 24, or 32 licensed ports. As your needs increase, you can activate
unlicensed ports by purchasing and installing the Brocade Ports on Demand optional licensed product.
Ports on Demand is ready to be unlocked in the switch firmware. Its license might be part of the
licensed Paper Pack supplied with switch software, or you can purchase the license separately from
your switch vendor, who will provide you with a key to unlock it.
Web Tools Administrator’s Guide
Publication Number: 53-0000522-09
4-15
4
Maintaining Licensed Features
By default, ports 0 through 7 are enabled on the SilkWorm 200E switch, and ports 0 through 15 are
enabled on the SilkWorm 4100 switch. By installing a Ports on Demand license, you can enable an
additional 4 ports on the SilkWorm 200E and an additional 8 ports on the SilkWorm 4100. You can
install up to two Ports on Demand licenses on each switch.
For each switch model, Table 4-1 shows the ports that are enabled by default and the ports that can be
enabled after you install the first and second Ports on Demand licenses.
Table 4-1
Ports Enabled with Ports on Demand Licenses
Enabled Ports
SilkWorm 200E SilkWorm 4100
Ports enabled without Ports on Demand license (default)
0–7
0–15
Ports enabled when you install first Ports on Demand license 8–11
16–23
Ports enabled when you install second Ports on Demand
license
24–31
12–15
Once you have installed the license keys, you must enable the ports. You can do so without disrupting
switch operation, as described in “Enabling and Disabling a Port” on page 4-15. Alternatively, you can
disable and reenable the switch to activate all ports as described in “Enabling and Disabling a Switch”
on page 4-5.
To unlock a Ports on Demand license, you can either use the supplied license key or generate a license
key. If you need to generate a key, launch an Internet browser and go to the Brocade Web site at
www.brocade.com. Click products> Software>Software License Keys and follow the instructions to
generate the key.
To enable Ports on Demand
1.
Launch the Switch Admin module as described on page 4-3.
2.
Click the Ports tab.
In the Ports tab, the Licensed Port column indicates whether the port is licensed or not.
3.
Install the Brocade Ports on Demand licensed product.
For instructions, refer to “Maintaining Licensed Features” on page 4-16.
4.
Enable the ports, as described in “Enabling and Disabling a Port” on page 4-15.
If you remove a Ports on Demand License, the licensed ports will become disabled after the next
platform reboot or the next port deactivation.
Maintaining Licensed Features
Feature licenses might be supplied with switch software, or you can purchase licenses separately from
your switch vendor, who will provide you with keys to unlock the features. License keys are provided
on a per-chassis basis, so for products that support multiple logical switches (domains), a license key
applies to all domains within the chassis.
The licensed features currently installed on the switch are listed in the License tab of the Switch Admin
module, as shown in Figure 4-5 on page 4-17. If the feature is listed, it is installed and immediately
available. When you enable some licenses, such as ISL Trunking, you might need to change the state of
the port to enable the feature on the link.
4-16
Web Tools Administrator’s Guide
Publication Number: 53-0000522-09
Maintaining Licensed Features
Figure 4-5
4
License Tab
Activating a License on a Switch
Before you can unlock a licensed feature, you must obtain a license key. You can either use the license
key provided in the Paper Pack supplied with switch software or refer to the Fabric OS Administrator’s
Guide for instructions on how to obtain a license key at the Brocade Web site (www.brocade.com).
To activate a license on a switch
1.
Launch the Switch Admin module as described on page 4-3.
2.
Click the License tab.
3.
Click Add.
The Add License dialog displays.
4.
Paste or type a license key in the field.
5.
Click Add License.
6.
Click Refresh to display the new licenses in the License tab.
Note
Some licenses (for example, Trunking) do not take effect until the switch is rebooted.
Web Tools Administrator’s Guide
Publication Number: 53-0000522-09
4-17
4
Administering High Availability
Removing a License from a Switch
Caution
Removing the Web Tools license from a switch makes that switch unavailable from Web Tools. If you
remove the Web Tools license from a SilkWorm 12000, 24000, or 48000 director, it makes both logical
switches unavailable from Web Tools.
To remove a license from a switch
1.
Launch the Switch Admin module as described on page 4-3.
2.
Click the License tab.
3.
Click the license you want to remove.
4.
Click Remove.
Administering High Availability
The procedures in this section apply only to the SilkWorm 12000, 24000, and 48000 directors, because
the High Availability module is available only on these switch types. Refer to the Fabric OS
Administrator’s Guide for additional information about High Availability.
Launching the Hi Availability Module
The background color of the Hi Avail button indicates the overall status of the switch. The Hi Avail
module displays information about the status of the High Availability (HA) feature on the SilkWorm
12000, 24000, and 48000 directors and each CP. It also enables you to perform tasks such as CP
failover or to synchronize services on the CPs.
To launch the Hi Avail module
1.
Select a SilkWorm 12000, 24000, or 48000 director from the Fabric Tree.
The selected director appears in the Switch View.
2.
Click the Hi Avail button on the Switch View.
The HA Admin module displays, as shown in Figure 4-6 on page 4-19.
4-18
Web Tools Administrator’s Guide
Publication Number: 53-0000522-09
Administering High Availability
Figure 4-6
4
High Availability Module
Note that there is a background color with the HA Status for each CP. The HA Admin module is not
refreshed automatically. Click Refresh to update the information displayed in the HA Admin module.
Synchronizing Services on the CP
A nondisruptive CP failover is possible only when all the services on it have been synchronized.
The SilkWorm 48000 director can run in a mixed-CP environment for purposes of upgrading from a
CP128 to a CP256 or downgrading from a CP256 to a CP128. The following scenarios affect whether
HA synchronization will be established.
HA synchronization will not be established:
•
If the active CP is a CP256 running Fabric OS v5.0.x but the standby CP is a CP128 running Fabric
OS v4.4
HA synchronization will be established:
•
If the active CP is a CP128 running Fabric OS v4.4 but the standby CP is a CP256 running Fabric
OS v5.0.x
•
If both CPs are running Fabric OS v5.0.x
Web Tools Administrator’s Guide
Publication Number: 53-0000522-09
4-19
4
Monitoring Events
To synchronize the services
1.
Launch the Hi Avail module as described in “Launching the Hi Availability Module” on page 4-18.
2.
If the HA Status field displays Non-Disruptive Failover Ready, you are done.
If the HA Status field displays Disruptive Failover Ready, continue with step 3.
3.
Click the Synchronize Services button.
The Warning dialog box displays.
4.
Click Yes and wait for the CPs to complete a synchronization of services, so that a nondisruptive
failover is ready.
5.
Click Refresh to update the HA Status field.
When the HA Status field displays Non-Disruptive Failover Ready, a failover can be initiated
without disrupting frame traffic on the fabric.
Initiating a CP Failover
A nondisruptive failover might take about 30 seconds to complete. During the failover, the Web Tools
session and associated windows are invalidated. You must close all Web Tools windows and relaunch
Web Tools.
To initiate a CP failover
1.
Launch the Hi Avail module as described in “Launching the Hi Availability Module” on page 4-18.
2.
Verify that the HA Status field displays Non-Disruptive Failover Ready or Disruptive Failover
Ready. Refer to “Synchronizing Services on the CP” on page 4-19 for more information.
3.
Click Initiate Failover.
The Warning dialog box displays.
4.
Click Yes to initiate a non-disruptive failover.
5.
When prompted, close the Web Tools Switch Explorer window and all associated windows, and
relaunch Web Tools.
Monitoring Events
Web Tools displays fabric-wide and switch-wide events. Event information includes sortable fields for
the following:
•
•
•
•
•
•
•
4-20
switch name
message number
time stamp
indication of whether the event is from a logical switch or a chassis
severity level
unique message identifier (in the form moduleID-messageType)
detailed error message for root cause analysis
Web Tools Administrator’s Guide
Publication Number: 53-0000522-09
Monitoring Events
4
There are four message severity levels: Critical, Error, Warning, and Info. Table 4-2 lists the event
message severity levels displayed in the Switch and Fabric Events windows, and explains what qualifies
event messages to be certain levels.
In both the Switch Events window and the Fabric Events window, you can click the Filter button to
launch the Filter Events dialog. The Filter Events dialog allows you to define which events should be
displayed in the Switch Events window or Fabric Events window. For more information on filtering
events, refer to “Filtering Fabric and Switch Events” on page 4-23.
Table 4-2
Event Severity Levels
Icon and Level Description
Critical (1)
Error (2)
Warning (3)
Critical-level messages indicate that the software has detected serious problems
that will eventually cause a partial or complete failure of a subsystem if not
corrected immediately; for example, a power supply failure or rise in temperature
must receive immediate attention.
Error-level messages represent an error condition that does not impact overall
system functionality significantly. For example, error-level messages might
indicate timeouts on certain operations, failures of certain operations after retries,
invalid parameters, or failure to perform a requested operation.
Warning-level messages highlight a current operating condition that should be
checked or it might lead to a failure in the future. For example, a power supply
failure in a redundant system relays a warning that the system is no longer
operating in redundant mode and that the failed power supply needs to be replaced
or fixed.
Information-level messages report the current nonerror status of the system
components; for example, the online and offline status of a fabric port.
Info (4)
Displaying Fabric Events
Events are displayed for all switches in the fabric in the Fabric Events window (see Figure 4-7 on
page 4-22). Fabric events are not automatically polled. You must click Refresh from the Fabric Events
window to poll fabric events. Switch events are automatically polled every 15 seconds.
Fabric Events can be collected only for switches that have the same security level (http or https) as the
launch switch. For switches that have a different level of security from the launch switch, a message is
displayed at the top of the window indicating how many switches have no events reported from the last
polling. For detailed information on the switch names and reasons for not polling (if available), click
Details.
To display fabric events
1.
Click a fabric from the Fabric Tree.
2.
Click the Fabric Events icon
on the Fabric Toolbar.
The Fabric Events window displays (see Figure 4-7).
3.
Optional: Click the column head to sort the events by a particular column.
Drag the column divider to resize a column.
You can also filter events, as described in “Filtering Fabric and Switch Events” on page 4-23.
Web Tools Administrator’s Guide
Publication Number: 53-0000522-09
4-21
4
Monitoring Events
Figure 4-7
Fabric Events Window
Displaying Switch Events
The Switch Events window displays a running log of events for the selected switch (see Figure 4-8 on
page 4-23). Switch events are polled and updated every 15 seconds, so there is no refresh-on-demand
option for switch events, as there is for the fabric events.
For two-switch configurations, all chassis-related events are displayed in the event list of each logical
switch for convenience.
4-22
Web Tools Administrator’s Guide
Publication Number: 53-0000522-09
Monitoring Events
Figure 4-8
4
Switch Events Window
To display switch events
1.
Click the switch from the Fabric Tree.
The Switch View displays.
2.
Click the Events button on the Switch View.
The Switch Events window displays (see Figure 4-8).
3.
Optional: Click the column head to sort the events by a particular column.
Drag the column divider to resize a column.
You can also filter events, as described in “Filtering Fabric and Switch Events,” next.
Filtering Fabric and Switch Events
You can filter the events in the Fabric Events window and Switch Events window by time, severity,
message ID, and service. You can apply either one type of filter at a time or multiple types of filters at
the same time. The Switch and Fabric Events windows both have a Filter button. Click the Filter
button to display the Event Filter dialog (see Figure 4-9 on page 4-24).
When a filter is applied, the Show All button is active in the events window and the type of filter
applied is identified at the top of the events window (see Figure 4-8). To unapply a filter, click the Show
All button in the events window.
Note
For two-switch configurations, clicking the Events button for a given switch automatically filters out
switch service events from the other switch. Chassis service is shown in both events lists.
Web Tools Administrator’s Guide
Publication Number: 53-0000522-09
4-23
4
Monitoring Events
Figure 4-9
Event Filter Dialog
To filter events by time intervals
1.
Launch the Fabric or Switch Events window as described in “Displaying Fabric Events” on
page 4-21 or “Displaying Switch Events” on page 4-22.
2.
Click Filter.
The Event Filter dialog displays.
3.
To filter events within a certain time period:
a.
Click From and enter the start time and date in the fields.
b.
Click To and enter the finish time and date in the fields.
4.
To filter all events beginning at a certain date and time, click From and enter the start time and date
in the fields.
5.
To filter events up until a certain date and time, click To and enter the finish time and date in the
fields.
6.
Click OK.
The filter is enabled and the enabled filter type is displayed in the events window.
4-24
Web Tools Administrator’s Guide
Publication Number: 53-0000522-09
Monitoring Events
4
To filter events by event severity levels
1.
Launch the Fabric or Switch Events window as described in “Displaying Fabric Events” on
page 4-21 or “Displaying Switch Events” on page 4-22.
2.
Click Filter.
The Event Filter dialog displays.
3.
Click Level.
The event severity level checkboxes are enabled.
4.
Click the event levels you want to display.
5.
Click OK.
The filter is enabled and the enabled filter type is displayed in the events window.
To filter events by message ID
1.
Launch the Fabric or Switch Events window as described in “Displaying Fabric Events” on
page 4-21 or “Displaying Switch Events” on page 4-22.
2.
Click Filter.
The Event Filter dialog displays.
3.
Click Message ID.
4.
Type the message IDs in the associated field. You can enter multiple message IDs as long as you
separate them by commas. You can type either the full message ID (moduleID-messageType) or a
partial ID (moduleID only).
5.
Click OK.
The filter is enabled and the enabled filter type is displayed in the events window.
To filter events by service component
1.
Launch the Fabric or Switch Events window as described in “Displaying Fabric Events” on
page 4-21 or “Displaying Switch Events” on page 4-22.
2.
Click Filter.
The Event Filter dialog displays.
3.
Click Service.
The event service drop-down list is enabled.
4.
Select either “Switch” or “Chassis” from the drop-down list to show only those messages from the
logical switch or from the chassis.
5.
Click OK.
The filter is enabled and the enabled filter type is displayed in the events window.
Web Tools Administrator’s Guide
Publication Number: 53-0000522-09
4-25
4
Displaying a Fabric Topology Report
Displaying a Fabric Topology Report
A fabric topology report lists all of the domains in the fabric and the active paths for each domain. A
sample fabric topology report is shown in Figure 4-10.
To view a fabric topology report
1.
Click the Fabric Topology icon
on the Fabric Toolbar.
The Fabric Topology window displays.
2.
Click the Print button to print a topology report.
A Print button is located at the top and bottom of the report. Both Print buttons have the same
function.
Figure 4-10 Fabric Topology Report
4-26
Web Tools Administrator’s Guide
Publication Number: 53-0000522-09
Displaying the Name Server Entries
4
Displaying the Name Server Entries
Web Tools displays Name Server entries listed in the Simple Name Server database (see Figure 4-11).
This includes all Name Server entries for the fabric, not only those related to the local domain. Each
row in the table represents a different device.
Note
Name Server entries are not automatically polled by default. Click Refresh in the Name Server window
to poll Name Server entries.
You can also click the Auto Refresh checkbox and specify a time interval at which the Name Server
entries will be automatically refreshed
Figure 4-11 Name Server Window
To view a list of the switches in the Name Server
1.
Click the Name Server icon
on the Fabric Toolbar.
The Name Server Table displays.
2.
Optional: Check the Auto Refresh checkbox on the Name Server window. Type an auto-refresh
interval (in seconds); the minimum (and default) interval is 15 seconds. The Name Server entries
will refresh at the rate you set.
Web Tools Administrator’s Guide
Publication Number: 53-0000522-09
4-27
4
Physically Locating a Switch Using Beaconing
To print the Name Server entries
1.
Click the Name Server icon
on the Fabric Toolbar.
The Name Server Table displays.
2.
Click Print.
3.
The Page Setup dialog displays. Make changes, as appropriate.
4.
Click OK in the Page Setup dialog.
The Print dialog displays.
5.
Select a printer and click OK in the Print dialog.
To display detailed Name Server information for a particular device
1.
Click the Name Server icon
on the Fabric Toolbar.
The Name Server Table displays.
2.
Click a device from the Domain column.
3.
Click Detail View.
The Name Server Information dialog displays information specific to that device.
To display the zone members of a particular device
1.
Click the Name Server icon
on the Fabric Toolbar.
The Name Server Table displays.
2.
Click a device from the Domain column.
3.
Click Accessible Devices.
The Zone Accessible Devices window displays accessible zone member information specific to that
device.
Physically Locating a Switch Using Beaconing
Use the Beacon button to physically locate a switch in a fabric. The beaconing function helps to
physically locate a switch by sending a signal to the specified switch, resulting in an LED light pattern
that cycles through all ports for each switch (from left to right).
To enable beaconing
1.
Select a switch from the Fabric Tree.
The selected switch appears in the Switch View.
2.
Click the Beacon button on the Switch View.
The LED lights on the actual switch (selected in the GUI) light up on the physical switch in a
pattern running back and forth across the switch itself. The beaconing is not shown in the GUI.
3.
4-28
Look at the physical switches in your installation location to identify the switch.
Web Tools Administrator’s Guide
Publication Number: 53-0000522-09
Displaying Swapped Port Area IDs
4
Displaying Swapped Port Area IDs
Use this procedure to view swapped ports on the switch. You cannot swap ports using Web Tools: you
can swap ports using the Fabric OS CLI only.
To determine if a port area ID has been swapped with another switch port
1.
Launch the Switch Admin module as described in “Launching the Switch Admin Module” on
page 4-3.
2.
Click the Ports tab.
3.
View the Port (Area ID) column in the Port Settings tab. For ports that have been swapped, the port
number is followed by the area ID, in parentheses.
Web Tools Administrator’s Guide
Publication Number: 53-0000522-09
4-29
4
4-30
Displaying Swapped Port Area IDs
Web Tools Administrator’s Guide
Publication Number: 53-0000522-09
Chapter
Maintaining Configurations and Firmware
5
This chapter contains the following information:
•
•
“Maintaining Configurations,” next
“Performing a Firmware Download” on page 5-3
Maintaining Configurations
It is important to maintain consistent configuration settings on all switches in the same fabric, because
inconsistent parameters (such as inconsistent PID formats) can cause fabric segmentation. As part of
standard configuration maintenance procedures, it is recommended that you back up configuration data
for every switch on a host computer server for emergency reference.
This section contains procedures for basic switch configuration maintenance. Use the Configure tab
and Upload/Download subtab of the Switch Admin module to perform these tasks. (See Figure 5-1.)
Figure 5-1
Web Tools Administrator’s Guide
Publication Number: 53-0000522-09
Configure Tab, Upload/Download Subtab
5-1
5
Maintaining Configurations
Backing Up a Configuration File
Keep a backup copy of the configuration file in case the configuration is lost or unintentional changes
are made. You should keep individual backup files for all switches in the fabric. You should avoid
copying configurations from one switch to another.
When you back up a configuration file for the SilkWorm 12000 director or for a SilkWorm 24000 or
48000 configured with two logical switches, it is on a logical-switch basis. This means that you must
back up a separate configuration file for each logical switch.
To back up a configuration file
1.
Launch the Switch Admin module as described on page 4-3.
2.
Click the Configure tab.
3.
Click the Upload/Download subtab (see Figure 5-1).
4.
Click the Config Upload to Host radio button.
5.
Type the user name, password, and host IP information.
6.
Type the configuration file with a fully qualified path.
7.
Click Apply.
You can monitor the progress by looking at the Upload/Download Progress bar on the Configure tab.
Restoring a Configuration
Restoring a configuration involves overwriting the configuration on the switch by downloading a
previously saved backup configuration file. Perform this procedure during a planned down time.
Make sure that the configuration file you are downloading is compatible with your switch model,
because configuration files from other model switches might cause your switch to fail.
To download a configuration to the switch
1.
Launch the Switch Admin module as described on page 4-3.
2.
Disable the switch, as described in “Enabling and Disabling a Switch” on page 4-5.
You can download configurations only to a disabled (offline) switch.
3.
Click the Configure tab.
4.
Click the Upload/Download subtab (see Figure 5-1 on page 5-1).
5.
Click the Config Download to Switch radio button.
6.
Type the user name, password, and host IP information.
7.
Type the configuration file with a fully qualified path.
8.
Click Apply.
You can monitor the progress by looking at the Upload/Download Progress bar on the Configure
tab.
9.
5-2
Enable the switch, as described in “Enabling and Disabling a Switch” on page 4-5.
Web Tools Administrator’s Guide
Publication Number: 53-0000522-09
Performing a Firmware Download
5
Performing a Firmware Download
During a firmware download, the switch reboots and the browser temporarily loses connection with the
switch. When the connection is restored, the version of the software running in the browser is different
from the new software version that has been installed and activated on the switch. You will need to
close all of the Web Tools windows and re-log in to avoid a firmware version mismatch. Note that for
chassis-based switches, you might get popup messages that imply the loss of connection is temporary
and will soon be resolved. You still need to close all windows and re-log in.
When you request a firmware download, the system first checks the file size that is to be downloaded. If
the compact flash does not have enough space, Web Tools displays a message and the download does
not occur. If this happens, contact your switch support supplier.
To download a new version of the firmware
1.
Launch the Switch Admin module as described on page 4-3.
2.
Click the Firmware tab (see Figure 5-2 on page 5-4).
3.
Click the Firmware Download radio button.
4.
Type the host IP address, user name, password, and fully qualified path to the file name.
5.
Click Apply.
The firmware download begins. You can monitor the firmware download status on the Firmware
Download progress bar.
About halfway through the download process, connection to the switch is lost and Web Tools
invalidates the current session. (Web Tools invalidates all windows if upfront login is enabled, but
only the Switch Admin session if upfront login is not enabled.)
6.
Close all Web Tools windows and log in again.
If the firmware download is in progress when you log in, you can continue to monitor its progress.
Web Tools Administrator’s Guide
Publication Number: 53-0000522-09
5-3
5
Performing a Firmware Download
Figure 5-2
5-4
Firmware Tab
Web Tools Administrator’s Guide
Publication Number: 53-0000522-09
Chapter
Configuring Standard Security Features
6
This chapter contains the following information:
•
•
•
“Creating and Maintaining User-Defined Accounts,” next
“Configuring SNMP Information” on page 6-4
“Managing RADIUS Server” on page 6-7
Creating and Maintaining User-Defined Accounts
In addition to the five default accounts—root, factory, admin, switchAdmin, and user—Fabric OS
supports up to 15 user-defined accounts in each logical switch (domain). These accounts expand your
ability to track account access and audit administrative activities.
The User tab of the Switch Admin module (see Figure 6-1 on page 6-2) displays account information
and enables you to create and manage user accounts, if you are logged in as an admin. If you are logged
in as a switchAdmin, you can change your own password but cannot view or modify other accounts. If
you are logged in as a user role, you cannot access the Switch Admin module.
Note
If you are operating in secure mode, you can perform these operations only on the primary FCS switch.
Web Tools Administrator’s Guide
Publication Number: 53-0000522-09
6-1
6
Creating and Maintaining User-Defined Accounts
Figure 6-1
User Tab
To display account information
1.
Launch the Switch Admin module as described on page 4-3.
2.
Click the User tab.
A list of the default and user-defined accounts displays. If you are logged in using the switchAdmin
role, only your account information is displayed.
Note that for the SilkWorm 3016 switch, the default administrator account name is “USERID” and
the default password is “PASSW0RD”. The “0” is the number zero and not the letter “O.”
To create a user-defined account
1.
Launch the Switch Admin module as described on page 4-3.
2.
Click the User tab.
3.
Click the Add... button.
The Add User Account dialog displays.
4.
6-2
Type the user name, which must begin with an alphabetic character. The name can be up to 40
characters long. It is case-sensitive and can contain alphabetic and numeric characters, the dot (.)
and the underscore ( _ ). It must be different from all other account names on the logical switch.
Web Tools Administrator’s Guide
Publication Number: 53-0000522-09
Creating and Maintaining User-Defined Accounts
6
5.
Select a role from the drop-down list: admin, switchAdmin, or user in nonsecure mode; admin,
switchAdmin, user, or nonfcsadmin in secure mode. (Refer to “Role-Based Access Control” on
page 1-11 for information about these roles.)
6.
Optional: Type a description of the account.
7.
Click the Enabled or Disabled radio button to enable or disable the account.
8.
Type the password for the account.
Passwords can be from 8 through 40 characters long. They must begin with an alphabetic character.
They can include numeric characters, the dot (.), and the underscore ( _ ). They are case-sensitive,
and they are not displayed when you enter them on the command line.
9.
Retype the password in the Confirm Password field for confirmation.
10. Click OK.
11. Click Apply to save your changes.
To delete a user-defined account
1.
Launch the Switch Admin module as described on page 4-3.
2.
Click the User tab.
3.
Select the account to remove.
4.
Click the Remove button.
5.
Click Apply to save your changes.
You cannot delete the default accounts. An account cannot delete itself. All active command line
interface (CLI) sessions for the deleted account are logged out.
To change account parameters
1.
Launch the Switch Admin module as described on page 4-3.
2.
Click the User tab.
3.
Select the account to modify.
You cannot modify the default root and factory accounts, even if you are logged in as root.
4.
Click the Modify button.
The Modify User Account dialog displays.
Note that you cannot change the user name of the account. To change the user name, you must
delete the account and create a new account.
5.
Select a role from the drop-down list: admin, switchAdmin, or user in nonsecure mode; admin,
switchAdmin, user, or nonfcsadmin in secure mode.
You can change the role only on user-level accounts. You cannot change the role on the default
accounts. You cannot change the role of your own account.
6.
Type a new description.
You can change the description only on user-level accounts. You cannot change the description of
the default accounts. You cannot change the description of your own account.
7.
Click the Enabled or Disabled radio button to enable or disable the account.
Web Tools Administrator’s Guide
Publication Number: 53-0000522-09
6-3
6
Configuring SNMP Information
You can enable and disable user- and admin-level accounts except for your own account. You
cannot enable or disable your own account or the factory account. Only the root account can disable
itself.
If you disable an account, all active CLI sessions for that account are logged out.
8.
Click OK.
9.
Click Apply to save your changes.
To change the password of an account
1.
Launch the Switch Admin module as described on page 4-3.
2.
Click the User tab.
3.
Select the account to modify.
If you are logged in as admin, you can change the password of your own account, peer admin
accounts, switchAdmin accounts, and user accounts. You cannot change the root or factory account
passwords.
If you are logged in as a switchAdmin, you can only change the password of your own account.
4.
Click the Change Password... button.
The Set User Account Password dialog displays.
If you are changing the password of an admin account, you must also provide the current password.
You do not need to provide the current password if you are changing the password of a lower-level
user account.
5.
Type the current password of the account. This step is required only if you are changing the
password of your own or a peer admin account.
6.
Type the new password of the account.
The new password must have at least one character different from the old password.
7.
Retype the new password in the Confirm Password field.
8.
Click OK.
9.
Click Apply to save your changes.
Configuring SNMP Information
This section describes how to manage the configuration of the SNMP agent in the switch. The
configuration includes SNMPv1 and SNMPv3 configuration, accessControl, and systemGroup
configuration parameters.
For more information, refer to the snmpConfig command in the Fabric OS Command Reference
Manual.
6-4
Web Tools Administrator’s Guide
Publication Number: 53-0000522-09
Configuring SNMP Information
6
Setting SNMP Trap Levels
When you set trap levels for the SilkWorm 12000 director or for a SilkWorm 24000 or 48000
configured with two logical switches, it is on a logical-switch basis. This means that for each logical
switch, you must set trap levels individually.
To set trap levels
1.
Launch the Switch Admin module as described on page 4-3.
2.
Click the SNMP tab (see Figure 6-2).
Figure 6-2
3.
SNMP Tab
Select a trap level for a recipient from the corresponding Trap Level drop-down list in the
SNMPv1 and SNMPv3 sections.
The level you select identifies the minimum event level that will prompt a trap.
4.
Click Apply.
Web Tools Administrator’s Guide
Publication Number: 53-0000522-09
6-5
6
Configuring SNMP Information
Configuring SNMP Information
When you configure SNMP information for the SilkWorm 12000 director or for a SilkWorm 24000 or
48000 configured with two logical switches, it is on a logical-switch basis. This means that for each
logical switch, you must configure SNMP information individually.
To change the systemGroup configuration parameters
1.
Launch the Switch Admin module as described on page 4-3.
2.
Click the SNMP tab (see Figure 6-2).
3.
Type a contact name, a description, and a location in the SNMP Information section.
4.
Optional: Click the Enable Authentication Trap checkbox to allow authentication traps to be sent
to the reception IP address.
5.
Click Apply.
To set SNMPv1 configuration parameters
1.
Launch the Switch Admin module as described on page 4-3.
2.
Click the SNMP tab (see Figure 6-2).
3.
Double-click a community string in the SNMPv1 section and type a new community string.
4.
Double-click a recipient IP address in the SNMPv1 section and type a new IP address.
5.
Click Apply.
To set SNMPv3 configuration parameters
1.
Launch the Switch Admin module as described on page 4-3.
2.
Click the SNMP tab (see Figure 6-2).
3.
Select a user name from the User Name drop-down list in the SNMPv3 section.
4.
Double-click a recipient IP address in the SNMPv3 section and type a new IP address.
5.
Select a trap level from the Trap Level drop-down list.
6.
Click Apply.
To change the accessControl configuration
6-6
1.
Launch the Switch Admin module as described on page 4-3.
2.
Click the SNMP tab (see Figure 6-2).
3.
Double-click an access host IP address in the Access Control List section and type a new host IP
address.
4.
Select a permission for the host from the Access Control List drop-down list. Options are Read
Only and Read Write.
5.
Click Apply.
Web Tools Administrator’s Guide
Publication Number: 53-0000522-09
Managing RADIUS Server
6
Managing RADIUS Server
Fabric OS supports RADIUS authentication, authorization, and accounting service (AAA). When
configured for RADIUS, the switch becomes a Network Access Server (NAS) that acts as a RADIUS
client. In this configuration, authentication records are stored in the RADIUS host server database.
Login and logout account name, assigned role, and time accounting records are also stored on the
RADIUS server.
You should set up RADIUS service through a secure connection such as SSH.
Use the AAA Service tab of the Switch Admin module to manage the RADIUS server (see Figure 6-3)
Figure 6-3
AAA Service Tab
Enabling and Disabling RADIUS Service
At least one RADIUS server must be configured before you can enable RADIUS service.
To enable or disable RADIUS service
1.
Launch the Switch Admin module as described on page 4-3.
2.
Click the AAA Service tab.
Web Tools Administrator’s Guide
Publication Number: 53-0000522-09
6-7
6
Managing RADIUS Server
3.
To enable RADIUS service, select a RADIUS service from the Primary AAA Service drop-down
list. Select None or Switch Database from the Secondary AAA Service drop-down list.
To disable RADIUS service, select Switch Database from the Primary AAA Service drop-down
list and select None from the Secondary AAA Service drop-down list.
4.
Click Apply.
Configuring the RADIUS Server
The configuration is chassis-based, so it applies to all logical switches (domains) on the switch and
replicates itself on a standby CP, if one is present. It is saved in a configuration upload, and so it can be
applied to other switches in a configuration download. You should configure at least two RADIUS
servers so that if one fails, the other will assume service.
You can configure the RADIUS server even if it is disabled. You can configure up to five RADIUS
servers. You must be logged in as admin or switchAdmin to configure the RADIUS server.
To configure the RADIUS server
1.
Launch the Switch Admin module as described on page 4-3.
2.
Click the AAA Service tab.
3.
Click Add. You can configure up to five RADIUS servers. If five RADIUS servers are already
configured, the Add button is disabled.
The RADIUS Configuration dialog displays.
4.
Type the RADIUS server name, which is a valid IP address or Dynamic Name Server (DNS) string.
Each RADIUS server must have a unique IP address or DNS name for the RADIUS server.
5.
Optional: Type the port number.
6.
Optional: Type the secret string.
7.
Optional: Type the timeout time in minutes.
8.
Optional: Select an authentication protocol from CHAP or PAP. The default value is CHAP, and if
you do not change it, CHAP will be the authentication protocol.
9.
Click OK to return to the AAA Service tab.
10. Click Apply.
Modifying the RADIUS Server
Use the following procedure to change the parameters of a RADIUS server that is already configured.
To modify the RADIUS server
6-8
1.
Launch the Switch Admin module as described on page 4-3.
2.
Click the AAA Service tab.
3.
Click a RADIUS server from the RADIUS Configuration list.
Web Tools Administrator’s Guide
Publication Number: 53-0000522-09
Managing RADIUS Server
4.
6
Click Modify.
The RADIUS Configuration dialog displays.
5.
Type new values for the port number, secret string, and timeout time (in minutes).
6.
Select an authentication protocol from CHAP or PAP. The default value is CHAP, and if you do
not change it, CHAP will be the authentication protocol.
7.
Click OK to return to the AAA Service tab.
8.
Click Apply.
Modifying the RADIUS Server Order
The RADIUS servers are contacted in the order they are listed, starting from the top of the list and
moving to the bottom.
To modify the order in which the RADIUS servers are contacted
1.
Launch the Switch Admin module as described on page 4-3.
2.
Click the AAA Service tab.
3.
Click a RADIUS server from the RADIUS Configuration list.
4.
Click the up and down arrows to rearrange the order of the RADIUS servers.
5.
Click Apply.
Removing a RADIUS Server
Use the following procedure to remove a RADIUS server.
To remove a RADIUS server
1.
Launch the Switch Admin module as described on page 4-3.
2.
Click the AAA Service tab.
3.
Click a RADIUS server from the RADIUS Configuration list.
4.
Click Remove. If there is no RADIUS server configured, the Remove button is disabled. You
cannot remove the only RADIUS server if the RADIUS service is the primary AAA service.
The RADIUS server is not deleted until you apply the changes from the AAA Services tab.
5.
Click Apply in the AAA Services tab.
A confirmation displays, warning you that you are about to remove the selected RADIUS server.
6.
Click Yes in the confirmation.
Web Tools Administrator’s Guide
Publication Number: 53-0000522-09
6-9
6
6-10
Managing RADIUS Server
Web Tools Administrator’s Guide
Publication Number: 53-0000522-09
Chapter
Routing Traffic
7
This chapter contains the following information:
•
•
•
•
•
•
“Introducing Routing,” next
“Displaying FSPF Routing” on page 7-2
“Configuring a Static Route” on page 7-3
“Enabling/Disabling Dynamic Load Sharing” on page 7-3
“Specifying Frame Order Delivery” on page 7-4
“Configuring Link Cost” on page 7-4
Introducing Routing
For Fabric OS v5.0.x, the supported routing policies are:
•
•
•
port-based
device-based (SilkWorm 4012 and 4100 only)
exchanged-based (SilkWorm 4012, 4100, and 48000 only)
For the SilkWorm 4012, 4100, and 48000, the exchange-based routing policy is the default.
Using port-based routing, you can assign a static route, in which the path chosen for traffic never
changes. In contrast, device-based and exchange-based routing policies always employ dynamic path
selection, in which the software chooses a path based on current traffic conditions. Refer to the Fabric
OS Administrator’s Guide for more information.
To optimize port-based routing, the dynamic load sharing feature (DLS) can be enabled to balance the
load across the available output ports within a domain. Device-based and exchange-based routing
require the use of DLS; when these policies are in effect, you cannot disable the DLS feature.
To configure routing policies, you must use the command line interface (CLI). After the routing policies
are configured, you can use Web Tools to display the routing paths, configure static routes, and
configure routing parameters, such as DLS, frame order delivery, and link cost.
The Routing tab of the Switch Admin module displays routing information. Figure 7-1 on page 7-2
shows a Routing tab when the port-based routing policy is enabled. When a device-based or exchangebased routing policy is enabled, the interface is different: the Static Route information and the Dynamic
Load Sharing radio buttons are not displayed.
Web Tools Administrator’s Guide
Publication Number: 53-0000522-09
7-1
7
Displaying FSPF Routing
Figure 7-1
Routing Tab for Port-Based Routing Policy
Displaying FSPF Routing
The Routing tab of the Switch Admin module displays information about routing paths.
To view FSPF routing
1.
Launch the Switch Admin module as described on page 4-3.
2.
Click the Routing tab.
3.
This step is switch-type specific:
For SilkWorm 12000, 24000, or 48000 directors, click a slot number under the FSPF Route
category in the navigation tree.
For SilkWorm 200E, 3014, 3016, 3250, 3850, 3900, 4012, and 4100 switches, click the FSPF
Route category in the navigation tree.
7-2
Web Tools Administrator’s Guide
Publication Number: 53-0000522-09
Configuring a Static Route
7
Configuring a Static Route
A static route can be assigned only when the active routing policy is port-based. When device-based or
exchange-based routing is active, you cannot disable DLS and you cannot view and configure static
routes.
When you configure a static route for a SilkWorm 12000 director or for a SilkWorm 24000 or 48000
configured for two logical switches, it is on a logical-switch basis. This means that for each logical
switch, you must configure a static route individually.
To configure a static route
1.
Launch the Switch Admin module as described on page 4-3.
2.
Click the Routing tab.
3.
This step is switch-specific:
For SilkWorm 12000, 24000, or 48000 directors, click a slot number under the Static Route
category in the navigation tree. Click Add.
For SilkWorm 200E, 3014, 3016, 3250, 3850, 3900, 4012, and 4100 switches, click the Static
Route category in the navigation tree. Click Add.
A new blank line appears in the window.
Note that when device-based or exchange-based routing policies are in effect, the Static Route
category does not display in the navigation tree.
4.
Type the In Port number for the route.
5.
Type the Destination Domain. The destination domain IDs match the outports in the cell.
6.
Type the Out Port number for the route.
7.
Click OK to add the static route.
8.
Click Apply.
Enabling/Disabling Dynamic Load Sharing
The device-based and exchange-based routing policies depend on the Fabric OS dynamic load sharing
feature (DLS) for dynamic routing path selection. When these policies are in force, DLS is always
enabled and cannot be disabled.
When the port-based policy is in force, you can enable DLS to optimize routing. When DLS is enabled,
it shares traffic among multiple equivalent paths between switches. DLS recomputes load sharing either
when a switch boots up or each time an E_Port or Fx_Port goes online or offline. Enabling this feature
allows a path to be discovered automatically by the FSPF path-selection protocol.
For more information regarding DLS, refer to the dlsset command in the Fabric OS Command
Reference Manual.
When you enable or disable dynamic load sharing for the SilkWorm 12000 director or for a SilkWorm
24000 or 48000 configured for two logical switches, it is on a logical-switch basis. This means that for
each logical switch, you must enable or disable dynamic load sharing individually.
Web Tools Administrator’s Guide
Publication Number: 53-0000522-09
7-3
7
Specifying Frame Order Delivery
To configure the DLS setting
1.
Launch the Switch Admin module as described on page 4-3.
2.
Click the Routing tab.
3.
Click On in the Dynamic Load Sharing area to enable dynamic load sharing.
Click Off in the Dynamic Load Sharing area to disable dynamic load sharing.
Note that when device-based or exchange-based routing policies are in effect, the DLS radio
buttons do not display in the Routing tab
4.
Click Apply.
Specifying Frame Order Delivery
In a stable fabric, frames are always delivered in order, even when the traffic between switches is shared
among multiple paths. However, when topology changes occur in the fabric (for example, if a link goes
down), traffic is rerouted around the failure, and some frames could be delivered out of order.
By default, frame delivery is out-of-order across topology changes. However, if the fabric contains
destination devices that do not support out-of-order delivery, you can force in-order frame delivery
across topology changes.
Enabling in-order delivery (IOD) guarantees that frames are either delivered in order or dropped. For
more information regarding IOD, refer to the Fabric OS Administrator’s Guide.
When you enable or disable IOD for the SilkWorm 12000 director or for a SilkWorm 24000 or 48000
configured for two logical switches, it is on a logical-switch basis. This means that for each logical
switch, you enable or disable IOD individually.
Note
Enabling in-order delivery can cause a delay in the establishment of a new path when a topology change
occurs, and therefore should be used with care.
To configure the IOD setting
1.
Launch the Switch Admin module as described on page 4-3.
2.
Click the Routing tab.
3.
Click On in the In-Order Delivery area to force in-order frame delivery across topology changes.
Click Off in the In-Order Delivery area to restore out-of-order frame delivery across topology
changes.
4.
Click Apply.
Configuring Link Cost
When you configure link cost for the SilkWorm 12000 director, or for a SilkWorm 24000 or 48000
configured for two logical switches, it is on a logical-switch basis. This means that for each logical
switch, you configure link cost individually.
7-4
Web Tools Administrator’s Guide
Publication Number: 53-0000522-09
Configuring Link Cost
7
For information regarding link cost, refer to the linkCost command in the Fabric OS Command
Reference Manual.
To configure the link cost for a port
1.
Launch the Switch Admin module as described on page 4-3.
2.
Click the Routing tab.
3.
This step is switch-specific:
For SilkWorm 12000, 24000, and 48000 directors, click the slot number of the logical switch
under Link Cost in the navigation tree.
For SilkWorm 200E, 3014, 3016, 3250, 3850, 3900, 4012, and 4100 switches, click Link Cost in
the navigation tree.
4.
Double-click in the row in the Cost column that corresponds to the appropriate port.
5.
Type the link cost.
For a 1 Gbit/sec ISL, the default cost is 1000. For a 2 Gbit/sec or a 4 Gbit/sec ISL, the default cost
is 500.
Valid values for link cost are from 1 through 9999. Setting the value to 0 sets the link cost to the
default value for that port.
6.
Click Apply.
Web Tools Administrator’s Guide
Publication Number: 53-0000522-09
7-5
7
7-6
Configuring Link Cost
Web Tools Administrator’s Guide
Publication Number: 53-0000522-09
Chapter
Administering Extended Fabrics
8
This chapter contains the following information:
•
•
“About Extended Link Buffer Allocation,” next
“Configuring a Port for Long Distance” on page 8-3
About Extended Link Buffer Allocation
As the distance between switches and the link speed increases, additional buffer-to-buffer credits are
required to maintain maximum performance. The number of credits reserved for a port depends on the
switch model and on the extended ISL mode for which it is configured.
The Extended Fabric tab of the Switch Admin module displays information about the port speed, longdistance setting, and buffer credits, as shown in Figure 8-1 on page 8-2. Use this tab to configure the
long-distance setting of a port. For detailed information on managing extended fabrics, refer to the
Fabric OS Administrator’s Guide.
The Extended Fabric tab displays the following information:
•
•
Port Number
Buffer Limited
Indicates whether the port is buffer limited. A buffer-limited port can come online with fewer
buffer credits allocated than its configuration specifies, allowing it to operate at a reduced
bandwidth instead of being disabled for lack of buffers.
Buffer-limited operation is supported for the L0 and LD extended ISL modes only and is persistent
across reboots, switch disabling and enabling, and port disabling and enabling.
•
Port Speed
The port speed is displayed as follows:
•
•
•
•
•
•
•
Web Tools Administrator’s Guide
Publication Number: 53-0000522-09
1G
1 Gbit/sec
2G
2 Gbit/sec
4G
4 Gbit/sec
N1
Negotiated 1 Gbit/sec
N2
Negotiated 2 Gbit/sec
N4
Negotiated 4 Gbit/sec
Auto-Negotiation
8-1
8
About Extended Link Buffer Allocation
•
Buffer Needed/Allocated
The number of buffers needed and the number of buffers that are actually allocated.
•
Actual Distance (km)
The actual distance, in kilometers, for the link.
•
Desired Distance (km)
Required for a port configured in LD mode (see Table 8-1 on page 8-3), the desired distance, in
kilometers, for the link. This value is the upper limit for calculating buffer availability for the port.
If the measured distance is more than the specified desired distance, the port is allocated the
number of buffers required by the specified desired distance.
•
Long Distance
Table 8-1 describes the long-distance settings and identifies which settings require a Brocade
Extended Fabrics license.
Figure 8-1
8-2
Extended Fabric Tab
Web Tools Administrator’s Guide
Publication Number: 53-0000522-09
Configuring a Port for Long Distance
Table 8-1
8
Long-Distance Settings and License Requirements
Value Description
Requires Extended
Fabrics License?
L0
No long-distance setting is enabled. The maximum supported link
distance is 10 km, 5 km, or 2.5 km for ports at speeds of 1 Gbit/sec,
2 Gbit/sec, and 4 Gbit/sec, respectively.
No
LE
Extended normal setting is enabled, 10 km (6 miles) or less.
No
L0.5
25 km (15.5 miles) or less.
Yes
L1
Medium long-distance setting is enabled, 50 km (31 miles) or less.
Yes
L2
Long-distance setting is enabled, 100 km (62 miles) or less.
Yes
LD
Dynamic setting is enabled. The LD-level link can operate at
distances up to 500 km at 1 Gbit/sec, 250 km at 2 Gbit/sec, or 125
km at 4 Gbit/sec, depending on the availability of frame buffers
within the port group.
Yes
Configuring a Port for Long Distance
When you configure a long-distance ISL, ensure that the ports on both sides of the ISL have the same
configuration, to avoid fabric segmentation.
To configure a port for long-distance connection
1.
Launch the Switch Admin module as described on page 4-3.
2.
Click the Extended Fabric tab.
3.
This step is switch-specific:
For SilkWorm 12000, 24000, and 48000 directors, click the slot subtab that corresponds to the
correct slot for the logical switch.
For SilkWorm 200E, 3014, 3016, 3250, 3850, 3900, 4012, and 4100 switches, proceed directly to
the next step.
Note
The SilkWorm 3016 switch has some limitations on the long-distance settings of its
external ports. Refer to the Fabric OS Administrator’s Guide for more information.
4.
Select a port by clicking anywhere in the row for that port.
5.
Select a distance from the Long Distance drop-down list that corresponds to the port.
Depending on the distance selected, this might require an optional license. For information about
the various distances, refer to Table 8-1.
If you select a long-distance setting of LD, you must also type a value in the Desired Distance
column for that port number:
Web Tools Administrator’s Guide
Publication Number: 53-0000522-09
8-3
8
Configuring a Port for Long Distance
a.
Double-click the Desired Distance field for the port, as shown in Figure 8-1.
b.
Type a number in the field to indicate the distance in kilometers.
For 1 Gbit/sec ports, type a number between 10 and 500, inclusive.
For 2 Gbit/sec ports, type a number between 10 and 250, inclusive.
For 4 Gbit/sec ports, type a number between 10 and 125, inclusive.
This value is the upper limit for calculating buffer availability for other ports in the same port
group. If the actual distance is more than the desired distance, the port operates in bufferlimited mode.
c.
6.
Press Enter or click another port entry for the value to be accepted.
Optional: If the fabric contains SilkWorm 2000-series extended ISLs, click the On radio button for
Long Distance Compatibility.
The switch must be disabled before you can select this option.
If you select this option, you must have an Extended Fabrics license, and both E_Ports in an ISL
must be configured with the same long-distance compatibility setting. SilkWorm 4100 switches
cannot be part of such a fabric.
7.
8-4
Click Apply.
Web Tools Administrator’s Guide
Publication Number: 53-0000522-09
Chapter
Administering ISL Trunking
9
This chapter contains the following information:
•
•
“Displaying Trunk Group Information” on page 9-2
“Disabling or Reenabling Trunking Mode on a Port” on page 9-2
Interswitch link (ISL) trunking optimizes network performance by forming trunking groups that can
distribute traffic across a shared bandwidth.
A trunking license is required on each switch that participates in the trunk. (For details on obtaining and
installing licensed features, refer to “Maintaining Licensed Features” on page 4-16.)
For additional information about ISL Trunking, refer to the Fabric OS Administrator’s Guide.
Use the Trunking tab of the Switch Admin module to view and manage trunks through Web Tools (see
Figure 9-1).
Figure 9-1
Web Tools Administrator’s Guide
Publication Number: 53-0000522-09
Trunking Tab
9-1
9
Displaying Trunk Group Information
Displaying Trunk Group Information
Use this procedure to display the following information about ISL Trunking groups:
•
•
•
Trunk group number identifier
Master port
Member ports
To view information on a trunk group
1.
Launch the Switch Admin module as described on page 4-3.
2.
Click the Trunking tab.
3.
Optional: Click Refresh to refresh the information.
Disabling or Reenabling Trunking Mode on a Port
When the trunking license is activated, trunks are automatically established on eligible ISLs and
trunking capability is enabled by default on all ports. Use the following procedure to disable trunking on
a port or to reenable trunking if it has been disabled.
Note
The SilkWorm 3016 switch has two external ports that are available for ISL Trunking. The 14 internal
ports have ISL Trunking disabled as they attach only to host devices. Refer to the Fabric OS
Administrator’s Guide for additional details.
To disable or reenable trunking mode on a port
1.
Launch the Switch Admin module as described on page 4-3.
2.
Click the Ports tab (see Figure 4-4 on page 4-12).
3.
This step is switch-specific:
For SilkWorm 12000, 24000, and 48000 directors, click the slot subtab that corresponds to the
correct slot for the logical switch.
For SilkWorm 200E, 3014, 3016, 3250, 3850, 3900, 4012, and 4100 switches, proceed directly to
the next step.
4.
To enable trunking mode on a port, click the checkbox in the Enable Trunking column that
corresponds to the port you want to trunk.
To disable trunking mode on a port, uncheck the box.
5.
9-2
Click Apply.
Web Tools Administrator’s Guide
Publication Number: 53-0000522-09
Chapter
Administering Zoning
10
This chapter briefly describes zoning and provides the procedures for managing zoning using Brocade
Web Tools. It contains the following sections:
•
•
•
•
•
•
•
•
“Introducing Zoning,” next
“Managing Zoning with Web Tools” on page 10-2
“Managing Zone Aliases” on page 10-6
“Managing Zones” on page 10-8
“Managing QuickLoops” on page 10-10
“Managing Fabric Assist Zones” on page 10-12
“Managing Zone Configurations” on page 10-15
“Managing the Zoning Database” on page 10-22
Introducing Zoning
Zoning enables you to partition your storage area network (SAN) into logical groups of devices that can
access each other. For example, you can partition your SAN into two zones, winzone and unixzone, so
that your Windows servers and storage do not interact with your UNIX servers and storage.
Zones can be configured dynamically. They can vary in size, depending on the number of fabricconnected devices, and devices can belong to more than one zone. Because zone members can access
only other members of the same zone, a device not included in a zone is not available to members of
that zone.
When using a mixed fabric—that is, a fabric containing v5.x, v4.x, v3.x, and v2.x switches—you
should use the switch with the highest Fabric OS level to perform zoning tasks. Refer to “Best Practices
for Zoning” on page 10-28 for more recommendations about zoning.
When zone or Fabric Assist (FA) zone members are specified by fabric location (domain, area) only, or
by device name (node name or port WWN) only, then zone boundaries can be enforced at the hardware
level, and the zone is referred to as a “hard zone.”
When zone elements are specified by fabric location (domain, area) and other elements of the same zone
are specified by device name (node name or port WWN), zone enforcement depends on Name Server
lookups, and the zone is referred to as a “soft zone.”
For more specific information about zoning concepts, refer to the Fabric OS Administrator’s Guide.
Web Tools Administrator’s Guide
Publication Number: 53-0000522-09
10-1
10
Managing Zoning with Web Tools
Managing Zoning with Web Tools
You can monitor and manage zoning through the Web Tools Zone Admin module. Click the Zone
Administration icon in the Fabric Toolbar to access the Zone Admin module, shown in Figure 10-1. The
Zone Admin icon is displayed in the Fabric Toolbar only if an Advanced Zoning license is installed on
the switch.
Figure 10-1 Zone Admin Module
The information in the Zone Admin module is collected from the selected switch.
If secure mode is enabled, zoning can be administered only from the primary FCS switch. If the selected
switch has an Advanced Zoning license installed but is not the primary FCS switch, the Zone Admin
icon is displayed in the Fabric Toolbar but not activated. For specific information regarding secure
fabrics, refer to the Secure Fabric OS Administrator’s Guide.
You must be logged in as an admin or switchAdmin to launch the Zone Admin module. If you are
logged in as a switchAdmin, you can access the Zone Admin module in read-only mode only; most of
the zoning operations are disabled in read-only mode.
A snapshot is taken of all the zoning configurations at the time you launch the Zone Admin module; this
information is not updated automatically by Web Tools. To update this information, refer to
“Refreshing the Zone Admin Module Information” on page 10-4.
10-2
Web Tools Administrator’s Guide
Publication Number: 53-0000522-09
Managing Zoning with Web Tools
10
Caution
Any changes you make in the Zone Admin module are held in a buffered environment and do not update
the zoning database until you save the changes. If you close the Zone Admin module without saving
your changes, your changes are lost. To save the buffered changes you make in the Zone Admin module
to the zoning database on the switch, refer to “Saving Local Zoning Changes” on page 10-5.
“Saving” means updating the zoning database on the switch with the local changes from the Web Tools
buffer. “Refreshing” means copying the current state of the zoning database on the switch to the Web
Tools buffer, overwriting its current contents.
In the Zone Admin module, all WWNs also display vendor names. In the Member Selection List panel
(see Figure 10-1), you can right-click port and device nodes to display which aliases the port or device
is a member of. In addition, you can right-click the device nodes and click View Device Detail to
display detailed information about the selected device, as shown in Figure 10-2.
Figure 10-2 Device Detail Example
Note
In the Detail View window, the scroll bars in the Member of Zones and Member of Aliases sections do
not scroll unless you double-click them first.
The remainder of this section describes basic zoning procedures you can perform in the Zone Admin
module that are useful for all zoning operations.
Launching the Zone Admin Module
This section describes how to launch the Zone Admin module, from which all zoning procedures are
performed.
Web Tools Administrator’s Guide
Publication Number: 53-0000522-09
10-3
10
Managing Zoning with Web Tools
To launch the Zone Administration module
1.
Select a switch from the Fabric Tree.
The selected switch appears in the Switch View.
2.
Click the Zone Administration icon
in the Fabric Toolbar.
The Zone Admin module displays (see Figure 10-1).
Refreshing the Fabric Information
This function refreshes the display of fabric elements (switches, ports, devices, and AL_PAs) only. It
does not affect any zoning element changes or update zone information in the Zone Admin module. To
refresh the zone information displayed in the Zone Admin module, refer to “Refreshing the Zone
Admin Module Information,” next.
This option allows you to refresh the fabric element information displayed at any time.
To refresh the fabric information
1.
In the Zone Admin module, click View > Refresh Fabric.
This refreshes the status for the fabric, including switches, ports, and devices.
Refreshing the Zone Admin Module Information
The information displayed in the Zone Admin module is initially a snapshot of the contents of the fabric
zoning database at the time the module is launched. Any changes you make to this window are saved to
a local buffer; they are not applied to the fabric zoning database until you invoke one of the
transactional operations listed in the Actions menu.
Any local zoning changes are buffered by the Zone Admin module until explicitly saved to the fabric. If
the fabric zoning database is independently changed by another user or from another interface (for
example, the CLI) while Web Tools zoning changes are still pending, the refresh icon
starts to blink
(after a 15 second polling delay). You can then choose to refresh the current Web Tools zoning view to
reflect the new, externally changed contents of the fabric zoning database, in which case any pending
local changes are lost, or you can ignore the blinking refresh icon and save your local changes,
overwriting the external changes that triggered the icon to blink.
Another reason to refresh zoning is to back out of current, unsaved work and start over.
You can refresh the zoning information at any time, either using the refresh icon (whether it is flashing
or not) or from the View menu.
The following procedure updates the information in the Zone Admin module with the information
saved in the zoning database on the switch.
.
Caution
When you refresh the buffered information in the Zone Admin module, any zoning configuration
changes you have made and not yet saved are erased from the buffer and replaced with the currently
enabled zone configuration information that is saved on the switch.
10-4
Web Tools Administrator’s Guide
Publication Number: 53-0000522-09
Managing Zoning with Web Tools
10
To refresh the local Zone Admin buffer from the fabric zoning database
1.
Launch the Zone Admin module as described on page 10-3.
2.
Click View > Refresh Zoning or click the zone refresh icon
of the Zone Admin module).
(located in the lower right corner
This refreshes the information in the Zone Admin module with the information in the switch’s zoning
database. This action also refreshes the fabric information as described in “Refreshing the Fabric
Information” on page 10-4. Any unsaved zoning changes are deleted.
Saving Local Zoning Changes
All information displayed and all changes made in the Zone Admin module are buffered until you save
the changes. That means that any other user looking at the zone information for the switch will not see
the changes you have made until you save them.
Saving the changes propagates any changes you have made in the Zone Admin module (buffered
changes) to the zoning database on the switch. If another user has a zoning operation in progress at the
time that you attempt to save changes, a warning is displayed that indicates that another zoning
transaction is in progress on the fabric. You can select to abort the other transaction and override it with
yours.
If the zoning database size exceeds the maximum allowed, you cannot save the changes. The zoning
database summary displays the maximum zoning database size (refer to “Displaying the Zone
Configuration Summary” on page 10-20).
This action updates the entire contents of the Zone Admin module, not just the selected zone, alias, or
configuration. You can save your changes at any time during the zone administration session.
To save Zone Admin module changes to the switch zoning database
1.
Make your zoning changes in the Zone Admin module.
2.
Click Actions > Save Config Only.
Note
If you have made changes to a configuration, you must enable the configuration before the changes will
be effective. To enable the configuration, refer to “Enabling a Zone Configuration” on page 10-18.
Closing the Zone Admin Module
It is very important to remember that any changes you make in the Zone Admin module are not saved
automatically. It is recommended that you always close the Zone Admin module from the File menu, as
described in the procedure below.
Caution
If you click the X in the top right corner of the Zone Admin module, the Zone Admin session is closed
immediately, and any changes you made without saving are lost. To avoid potential loss of data, use the
following procedure to close the Zone Admin module. In this procedure, the Zone Admin session
displays a warning if you have unsaved changes when you are trying to close the Zone Admin module.
Web Tools Administrator’s Guide
Publication Number: 53-0000522-09
10-5
10
Managing Zone Aliases
To safely close the Zone Admin module
1.
From the Zone Admin module, click File > Close.
If any changes exist in the buffer that have not been saved, a warning dialog displays, asking you to
confirm that you want to close the Zone Admin session without saving the changes.
2.
Click Yes to close without saving changes, or click No to go back to the Zone Admin module to
save the changes as described in “Saving Local Zoning Changes” on page 10-5.
Zoning Views
You can choose how zoning elements are displayed in the Zone Admin module. The zoning view you
select determines how members are displayed in the Member Selection List panel (see Figure 10-1).
The views filter the fabric and device information displayed in the Member Selection List for the
selected view, making it easier for you to create and modify zones, especially when creating “hard
zones.”
Depending on the method you use to zone, certain tabs might or might not be available in the Zone
Admin window.
There are four views of defining members for zoning:
Mixed zoning
This view displays the port area number, device WWNs, or QuickLoop AL_PAs, and
is useful when creating a soft zone.
Port zoning
This view displays port area numbers only, and is useful when creating a hard zone.
WWN zoning
This view displays device WWNs only, and is useful when creating a hard zone.
AL_PA zoning
This view displays QuickLoop AL_PAs only, and is useful when creating a soft zone.
To select a zoning view
1.
Launch the Zone Admin module as described on page 10-3.
2.
From the View menu, select one of the following:
•
•
•
•
Mixed Zoning
Port Zoning
WWN Zoning
AL_PA Zoning
Managing Zone Aliases
An alias is a logical group of port area numbers, WWNs, or AL_PAs. Specifying groups of ports or
devices as an alias makes zone configuration easier, by enabling you to configure zones using an alias
rather than inputting a long string of individual members. You can specify members of an alias using the
following methods:
•
•
•
10-6
A switch domain and port area number pair: for example, “2, 20”
Device node and device port WWNs
QuickLoop AL_PAs
Web Tools Administrator’s Guide
Publication Number: 53-0000522-09
Managing Zone Aliases
10
Creating and Populating a Zone Alias
Use the following procedure to create a zone alias.
To create an alias
1.
Launch the Zone Admin module as described on page 10-3.
2.
Select a format to display zoning members in the Member Selection List as described in “Zoning
Views” on page 10-6.
3.
Click the Alias tab.
4.
Click Create.
The Create New Alias dialog displays.
5.
Type a name for the new alias, and click OK in the Create New Alias dialog.
The new alias displays in the Name list in the Alias tab.
6.
Click “+” signs in the Member Selection List to view the nested elements.
The choices available in the Member Selection List depend on the selection made in the View
menu.
7.
Click elements in the Member Selection List that you want to include in your alias.
The Add Member button becomes active.
8.
Click Add Member to add alias members.
Selected members move to the Alias Members window.
9.
Optional: Repeat steps 7 and 8 to add more elements to your alias.
10. Optional: Click Add Other to include a WWN, port, or QuickLoop (AL_PA) that is not currently a
part of the fabric.
11. Optional: Click Add Other Host to include a WWN, port, or QuickLoop (AL_PA) that is not
currently a part of the fabric.
Adding and Removing Members of a Zone Alias
Use the following procedure to add or remove zone alias members.
To modify the members of an alias
1.
Launch the Zone Admin module as described on page 10-3.
2.
Click the Alias tab.
3.
Select the alias you want to modify from the Name drop-down list.
4.
Highlight an element in the Member Selection List that you want to add to your alias, or highlight
an element in the Alias Members list that you want to delete.
5.
Click Add Member to add the selected alias member.
Click Remove Member to remove the selected alias member.
The alias is modified in the Zone Admin buffer.
Web Tools Administrator’s Guide
Publication Number: 53-0000522-09
10-7
10
Managing Zones
Renaming a Zone Alias
Use the following procedure to change the name of a zone alias.
To rename a zone alias
1.
Launch the Zone Admin module as described on page 10-3.
2.
Click the Alias tab.
3.
Select the alias you want to rename from the Name drop-down list.
4.
Click Rename.
The Rename an Alias dialog appears.
5.
Type a new alias name and click OK.
The alias is renamed in the Zone Admin buffer.
Deleting a Zone Alias
You can remove a zone alias from the Zone Admin buffer. When a zone alias is deleted, it is no longer a
member of the zones of which it was once a member.
To delete a zone alias
1.
Launch the Zone Admin module as described on page 10-3.
2.
Click the Alias tab.
3.
Select the alias you want to delete from the Name drop-down list.
4.
Click Delete.
The Confirm Deleting Alias dialog displays.
5.
Click Yes.
The selected alias is deleted from the Zone Admin buffer.
Managing Zones
A zone is a region within the fabric in which specified switches and devices can communicate. A device
can only communicate with other devices connected to the fabric within its specified zone. You can
specify members of a zone using the following methods:
•
•
•
•
10-8
Alias names
Switch domain and port area number pair: for example, “2, 20”
WWN (device)
QuickLoop AL_PAs (device)
Web Tools Administrator’s Guide
Publication Number: 53-0000522-09
Managing Zones
10
Creating and Populating a Zone
Use the following procedure to create a zone.
To create a zone
1.
Launch the Zone Admin module as described on page 10-3.
2.
Select a format to display zoning members in the Member Selection List as described in “Zoning
Views” on page 10-6.
3.
Click the Zone tab.
4.
Click Create.
The Create New Zone dialog displays.
5.
Enter a name for the new zone in the Create New Zone dialog, and click OK.
The new zone displays in the Name list.
6.
Click “+” signs in the Member Selection List to view the nested elements.
The choices available in the Member Selection List depend on the selection made in the View
menu.
7.
Select an element in the Member Selection List that you want to include in your zone.
The Add Member button becomes active.
8.
Click Add Member to add the zone member.
The selected member is moved to the Zone Members window.
9.
Optional: Repeat steps 7 and 8 to add more elements to your zone.
10. Optional: Click Add Other to include a WWN, port, or QuickLoop (AL_PA) that is not currently a
part of the fabric.
Adding and Removing the Members of a Zone
Use the following procedure to add or remove zone members.
To modify the members of a zone
1.
Launch the Zone Admin module as described on page 10-3.
2.
Click the Zone tab.
3.
Select the zone you want to modify from the Name drop-down list.
The zone members for the selected zone are listed in the Zone Members list.
4.
Highlight an element in the Member Selection List that you want to include in your zone, or
highlight an element in the Zone Members list that you want to delete.
5.
Click Add Member to add a zone member.
Click Remove Member to remove a zone member.
The zone is modified in the Zone Admin buffer.
Web Tools Administrator’s Guide
Publication Number: 53-0000522-09
10-9
10
Managing QuickLoops
Renaming a Zone
Use the following procedure to change the name of a zone.
To rename a zone
1.
Launch the Zone Admin module as described on page 10-3.
2.
Click the Zone tab.
3.
Select the zone you want to rename from the Name drop-down list.
4.
Click Rename.
The Rename a Zone dialog displays.
5.
Type a new zone name and click OK.
The zone is renamed in the Zone Admin buffer.
Deleting a Zone
Use the following procedure to delete a zone.
To delete a zone
1.
Launch the Zone Admin module as described on page 10-3.
2.
Click the Zone tab.
3.
Select the zone you want to delete from the Name drop-down list.
4.
Click Delete.
The Confirm Deleting Zone dialog displays.
5.
Click Yes.
The selected zone is deleted from the Zone Admin buffer.
Managing QuickLoops
QuickLoop is a Brocade software product that allows multiple ports on a switch to create a logical loop.
Devices connected via QuickLoop appear to each other as if they are on the same arbitrated loop.
QuickLoop can be administered using Fabric OS v5.x; however, switches or directors running Fabric
OS v5.x cannot be members of a QuickLoop. SilkWorm 12000, 24000, and 48000 directors and 200E,
3014, 3016, 3250, 3850, 3900, 4012, and 4100 switches cannot be members of a QuickLoop.
Note
You must have a QuickLoop license installed to create or modify a QuickLoop.
10-10
Web Tools Administrator’s Guide
Publication Number: 53-0000522-09
Managing QuickLoops
10
Creating a QuickLoop
Use the following procedure to create a QuickLoop.
To create a QuickLoop
1.
Launch the Zone Admin module as described on page 10-3.
2.
Select a format to display zoning members in the Member Selection List as described in “Zoning
Views” on page 10-6.
3.
Click the QuickLoop tab.
4.
Click Create.
The Create New QuickLoop dialog displays.
5.
Type a name for the new QuickLoop.
6.
Click OK.
7.
Click an element in the Member Selection List that you want to include in your QuickLoop.
The Add Member button becomes active.
Note
There is a limit of two members per QuickLoop. Only switches capable of running
QuickLoop are displayed in the Member Selection List.
8.
Click Add Member to add QuickLoop members.
Selected members are moved to the QuickLoop Members area.
9.
Optional: Repeat steps 7 and 8 to add a second element to your QuickLoop.
Adding and Removing Members of a QuickLoop
Use the following procedure to add or remove members of a QuickLoop.
To modify the members of a QuickLoop
1.
Launch the Zone Administration module as described on page 10-3.
2.
Click the QuickLoop tab.
3.
Select the QuickLoop you want to modify from the Name drop-down list.
4.
Highlight an element in the Member Selection List that you want to include in your QuickLoop, or
highlight an element in the QuickLoop Members that you want to delete.
Note
There is a limit of two members per QuickLoop. Only switches capable of running
QuickLoop are displayed in the Member Selection List.
5.
Click Add Member to add a QuickLoop member.
Click Remove Member to remove a QuickLoop member.
Web Tools Administrator’s Guide
Publication Number: 53-0000522-09
10-11
10
Managing Fabric Assist Zones
Renaming a QuickLoop
Use the following procedure to change the name of a QuickLoop.
To rename a QuickLoop
1.
Launch the Zone Admin module as described on page 10-3.
2.
Click the QuickLoop tab.
3.
Select the QuickLoop you want to rename from the Name drop-down list.
4.
Click Rename.
The Rename a QuickLoop dialog displays.
5.
Type a new QuickLoop name and click OK.
The QuickLoop is renamed in the Zone Admin buffer.
Deleting a QuickLoop
Use the following procedure to delete a QuickLoop.
To delete a QuickLoop
1.
Launch the Zone Admin module as described on page 10-3.
2.
Click the QuickLoop tab.
3.
Select the QuickLoop you want to delete from the Name drop-down list.
4.
Click Delete.
The Confirm Deleting QuickLoop dialog opens.
5.
Click Yes.
The selected QuickLoop is deleted from the Zone Admin buffer.
Managing Fabric Assist Zones
Fabric Assist is an extension to QuickLoop. A Fabric Assist (FA) zone allows private hosts to
communicate with public or private targets across the fabric.
Fabric Assist zones can be administered using Fabric OS v5.x; however, switches or directors running
Fabric OS v5.x cannot be members of a Fabric Assist zone. SilkWorm 12000, 24000, and 48000
directors and 200E, 3014, 3016, 3250, 3850, 3900, 4012, and 4100 switches cannot be members of a
Fabric Assist zone.
Note
You must have a QuickLoop license installed to create or modify a Fabric Assist zone.
10-12
Web Tools Administrator’s Guide
Publication Number: 53-0000522-09
Managing Fabric Assist Zones
10
Creating a Fabric Assist Zone
Use the following procedure to create a Fabric Assist zone. For this example, the Mixed Zone level is
used.
To create a Fabric Assist zone
1.
Launch the Zone Admin module as described on page 10-3.
2.
Click View > Mixed Zoning. You can select any view except the AL_PA view.
The Mixed View tab displays.
3.
Click the Fabric Assist tab.
4.
Click Create.
The Create New FA dialog displays.
5.
Type a name for the new Fabric Assist zone and click OK.
A fabric host is required.
6.
Click “+” signs in the Member Selection List to view the nested elements.
The choices available in the Member Selection List depend on the selection made in the View
menu.
7.
Select an element in the Member Selection List that you want to include in your zone.
The Add Member button becomes active.
8.
Click Add Member to add the zone member.
The selected member is moved to the Zone Members window.
9.
Optional: Repeat steps 7 and 8 to add more elements to your Fabric Assist zone.
10. Optional: Click Add Other to include a WWN, port, or QuickLoop (AL_PA) that is not currently a
part of the fabric.
11. Optional: Click Add Other Host to include a WWN, port, or QuickLoop (AL_PA) that is not
currently a part of the fabric.
The new members appear in the Fabric Assist Members area. The newly created Fabric Assist zone also
displays in the Config tab.
Adding and Removing Fabric Assist Zone
Members
Use the following procedure to add and remove Fabric Assist zone members.
To modify the members of a Fabric Assist zone
1.
Launch the Zone Admin module as described on page 10-3.
2.
Click the Fabric Assist tab.
3.
Select the Fabric Assist zone you want to modify from the Name drop-down list.
Web Tools Administrator’s Guide
Publication Number: 53-0000522-09
10-13
10
Managing Fabric Assist Zones
4.
Click an element in the Member Selection List that you want to include in your Fabric Assist zone,
or click an element in the Fabric Assist Zone Members that you want to delete.
5.
Click Add Member to add a Fabric Assist zone member.
Click Remove Member to remove a Fabric Assist zone member.
Renaming a Fabric Assist Zone
Use the following procedure to change the name of a Fabric Assist zone.
To rename a Fabric Assist zone
1.
Launch the Zone Admin module as described on page 10-3.
2.
Click the Fabric Assist tab.
3.
Select the Fabric Assist Zone you want to rename from the Name drop-down list.
4.
Click Rename.
The Rename a Fabric Assist Zone dialog displays.
5.
Type a new Fabric Assist zone name and click OK.
The Fabric Assist zone is renamed in the Zone Admin buffer.
Deleting a Fabric Assist Zone
Use the following procedure to delete a Fabric Assist zone.
To delete a Fabric Assist Zone
1.
Launch the Zone Admin module as described on page 10-3.
2.
Click the Fabric Assist Zone tab.
3.
Select the Fabric Assist zone you want to delete from the Name drop-down list.
4.
Click Delete.
The Confirm Deleting Fabric Assist Zone dialog displays.
5.
Click Yes.
The selected Fabric Assist zone is deleted from the Zone Admin buffer.
10-14
Web Tools Administrator’s Guide
Publication Number: 53-0000522-09
Managing Zone Configurations
10
Managing Zone Configurations
A zone configuration is a group of zones; zoning is enabled on a fabric by enabling a specific
configuration. You can specify members of a configuration using the following methods:
•
•
•
Zone names
QuickLoop names
FA (Fabric Assist) zone names
Figure 10-3 shows a sample zoning database and the relationship between the zone aliases, zones, and
zoning configuration. The database contains one zoning configuration, myconfig, which contains two
zones: Zone A and Zone B. The database also contains four aliases, which are members of Zone A and
Zone B. Zone A and Zone B also have additional members other than the aliases.
Figure 10-3 Sample Zoning Database
Zone C onfiguration: myc onfig
Zone A
A lias 1
A lias 2
WWN 1; WWN 2; WWN 3
WWN 4; <domain, portarea>
Other E lements
<domain, portarea>; <AL_P A>
Zone B
A lias 3
A lias 4
WWN 5; <AL_P A>
WWW 5; WWN 6; WWN7
Other E lements
WWW 9
Creating a Zone Configuration
Use the following procedure to create a zone configuration. After creating a zone configuration, you
must explicitly enable it for it to take effect.
Web Tools Administrator’s Guide
Publication Number: 53-0000522-09
10-15
10
Managing Zone Configurations
To create a zone configuration
1.
Launch the Zone Admin module as described on page 10-3.
2.
Select a format to display zoning members in the Member Selection List as described in “Zoning
Views” on page 10-6.
3.
Click the Config tab.
4.
Click Create.
The Create New Config dialog box appears.
5.
Type a name for the new configuration and click OK.
The new configuration displays in the Name list.
6.
Click “+” signs in the Member Selection List to view the nested elements.
The choices available in the list depend on the selection made in the View menu.
7.
Highlight an element in the Member Selection List that you want to include in your configuration.
The Add Member button becomes active.
8.
Click Add Member to add configuration members.
Selected members are moved to the Config Members Window.
9.
Repeat steps 7 and 8 to add more elements to your configuration.
10. Click Actions > Save Config Only to save the configuration changes.
To enable the configuration, refer to “Enabling a Zone Configuration” on page 10-18.
Note
Any changes made to the currently enabled configuration will not appear until you reenable the
configuration.
Adding or Removing Zone Configuration
Members
Use the following procedure to add or remove members of a zone configuration.
Note
You can make changes to a configuration that is currently enabled; however, changes will not appear
until you reenable the configuration.
To modify the members of a zone configuration
10-16
1.
Launch the Zone Admin module as described on page 10-3.
2.
Click the Config tab.
3.
Select the configuration you want to modify from the Name drop-down list.
4.
Click an element in the Member Selection List that you want to include in your configuration or
click an element in the Config Members that you want to delete.
Web Tools Administrator’s Guide
Publication Number: 53-0000522-09
Managing Zone Configurations
5.
Click Add Member to add a configuration member.
Click Remove Member to remove a configuration member.
6.
Click Actions > Save Config Only to save the configuration changes.
10
To enable the configuration, refer to “Enabling a Zone Configuration” on page 10-18.
Renaming a Zone Configuration
Use the following procedure to change the name of a zone configuration.
Note
You cannot rename the currently enabled configuration.
To rename a zone configuration
1.
Launch the Zone Admin module as described on page 10-3.
2.
Click the Config tab.
3.
Click the configuration you want to rename from the Name drop-down list.
4.
Click Rename.
The Rename a Config dialog displays.
5.
Type a new configuration name and click OK.
The configuration is renamed in the configuration database.
6.
Click Actions > Save Config Only to save the configuration changes.
To enable the configuration, refer to “Enabling a Zone Configuration” on page 10-18.
Deleting a Zone Configuration
Use the following procedure to delete a zone configuration.
Note
You cannot delete a currently enabled configuration.
To delete a disabled configuration
1.
Launch the Zone Admin module as described on page 10-3.
2.
Click the Config tab.
3.
Select the configuration you want to delete from the Name drop-down list.
4.
Click Delete.
The Confirm Deleting Config dialog displays.
5.
Click Yes.
The selected configuration is deleted from the configuration database.
Web Tools Administrator’s Guide
Publication Number: 53-0000522-09
10-17
10
Managing Zone Configurations
Enabling a Zone Configuration
Several zone configurations can reside on a switch at once, and you can quickly alternate between them.
For example, you might want to have one configuration enabled during the business hours and another
enabled overnight. However, only one zone configuration can be enabled at a time.
When you enable a zone configuration from Web Tools, keep in mind that the entire zoning database is
automatically saved, and then the selected zone configuration is enabled.
If the zoning database size exceeds the maximum allowed, you cannot enable the zone configuration.
The zoning database summary displays the maximum zoning database size (refer to “Displaying the
Zone Configuration Summary” on page 10-20).
To enable a zone configuration
1.
Launch the Zone Admin module as described on page 10-3.
2.
Click Actions > Enable Config.
The Enable Config dialog displays.
3.
Select the configuration to be enabled from the menu.
A warning displays.
4.
Click OK to save and enable the selected configuration.
Disabling a Zone Configuration
When you disable the active configuration, the Advanced Zoning feature is disabled on the fabric, and
all devices within the fabric can communicate with all other devices. This does not mean that the zoning
database is deleted, however, only that there is no configuration active on the fabric.
When you disable a zone configuration from Web Tools, keep in mind that the entire zoning database is
automatically saved, and then the selected zone configuration is disabled.
To disable a zone configuration
1.
Launch the Zone Admin module as described on page 10-3.
2.
Click Actions > Disable Zoning.
The Disable Config warning displays.
3.
Click Yes to save and disable the current configuration.
Displaying the Enabled Zone Configuration
The enabled zone configuration screen displays the actual content of the single zone configuration that
is currently enabled on the fabric, whether it matches the configuration that was enabled when the
current zone admin session was launched or last refreshed (see Figure 10-4 on page 10-19). The zones,
QuickLoops, and FA zones are displayed, and their contents (ports, WWNs, AL_PAs) are displayed
next to them. Aliases are not displayed in the enabled zone configuration. If there is no active zone
configuration enabled on the switch, a message is displayed to that effect.
10-18
Web Tools Administrator’s Guide
Publication Number: 53-0000522-09
Managing Zone Configurations
10
The enabled configuration is listed in the top right corner of the Zone Admin module.
Figure 10-4 Effective Configuration Window
To view the enabled zone configuration name without launching the Zone
Admin module
Select a switch from the Fabric Tree.
The selected switch appears in the Switch View. The current zone configuration name (if one is
enabled) is displayed in the lower portion of the Switch Information View. If no zone configuration is
enabled, the field displays “none”.
To view detailed information about the enabled zone configuration
1.
Launch the Zone Admin module, as described on page 10-3.
The zone configuration in effect at the time you launched the Zone Admin module is identified in
the top right corner. This information is automatically updated every 15 seconds. It is also updated
if you manually refresh the Zone Admin module contents by clicking the refresh icon at the bottom
right corner of the Zone Admin module, or when you enable a configuration through the Zone
Admin module.
Caution
Clicking the refresh icon overwrites all local unsaved zoning changes. If anyone has made
any changes to the zones outside of your Zone Admin session, those changes will be applied.
2.
Use one of the following methods to identify the most recently effective zone configuration without
saving or applying any changes you have made in the Zone Admin module:
•
•
Click File > View Effective Configuration in the Zone Admin module.
Click the enabled configuration button
in the Zone Admin module.
Both of these actions display the Effective Configuration window. If no zone is enabled, a message
is displayed, indicating that there is no active zoning configuration on the switch.
3.
Optional: Click Print to print the enabled zone configuration details. This launches the print
dialog.
Web Tools Administrator’s Guide
Publication Number: 53-0000522-09
10-19
10
Managing Zone Configurations
Displaying the Zone Configuration Summary
The zone configuration summary hierarchically lists all defined zoning elements known to the current
Zone Admin session, whether any of the listed configurations has been enabled, and whether any of the
lower level elements has been added as members of the higher level (aliases, zones, QuickLoops, FA
zones) structures. The zone configuration summary displays the entire contents of the fabric zoning
database as it was at the time the Zone Admin session was launched, or the most recently saved or
refreshed information, and any unsaved changes you make since the time the Zone Admin session is
launched. It provides the name of the zone configuration that was enabled at the time you launched the
Zone Admin session; however, keep in mind that the enabled configuration might have changed since
then and that this screen will not reflect those changes.
To view a zone configuration summary report
1.
Launch the Zone Admin module as described on page 10-3.
2.
Click File > Print Summary.
The Zone Configuration Summary window displays, as shown in Figure 10-5.
It is important to note that the summary displays the information based on the changes just made. If
current Zone Admin session changes have not yet been saved to the fabric, the information
displayed here is different from what is seen from the switch.
3.
Optional: Click Print to print the zone configuration summary. This launches the print dialog.
Figure 10-5 Zone Configuration Summary
10-20
Web Tools Administrator’s Guide
Publication Number: 53-0000522-09
Managing Zone Configurations
10
Creating a Configuration Analysis Report
The configuration analysis report lists the following:
•
•
SAN components (ports, WWNs, and AL_PAs) that are not included in the configuration.
SAN components (ports, WWNs, and AL_PAs) that are contained in the configuration but not in
the fabric.
To create a configuration analysis report
1.
Launch the Zone Admin module as described on page 10-3.
2.
Click the Config tab.
3.
Select a configuration to be analyzed from the Name drop-down list.
4.
Click Analyze Config.
A dialog displays, asking if you want to refresh the fabric before running the analysis.
5.
Click Yes or No.
The configuration analysis window displays.
Displaying Initiator/Target Accessibility
The Initiator/Target Accessibility Matrix shows a list of initiators and a list of targets and indicates
which initiator can access which target, as shown in Figure 10-6 on page 10-22.
To display an Initiator/Target Accessibility Matrix
1.
Launch the Zone Admin module as described on page 10-3.
2.
Click the Config tab.
3.
Select a configuration to be analyzed for device accessibility from the Name drop-down list.
4.
Click Device Accessibility.
The Initiator/Target Accessibility Matrix for Config- Device Selection dialog displays.
5.
Select devices you want displayed in the accessibility matrix; click the radio button to select all
devices in the fabric or to select a subset of the devices.
If you select a subset, you must click the devices from the Select Devices list and click Add to
move them to the Evaluate for Accessibility list.
6.
Click OK.
The Initiator/Target Accessibility Matrix displays. You can “mouse over” a target to display the
symbolic name of the device. In addition, you can right-click the device nodes and click View Device
Detail to display detailed information about the selected device.
Web Tools Administrator’s Guide
Publication Number: 53-0000522-09
10-21
10
Managing the Zoning Database
Figure 10-6 Initiator/Target Accessibility Matrix
Managing the Zoning Database
This section contains the following procedures for managing the zoning database:
•
•
•
•
•
•
•
•
•
10-22
“Adding a WWN to Multiple Aliases, Zones, and FA Zones,” next
“Removing a WWN from Multiple Aliases, Zones, and FA Zones” on page 10-23
“Replacing a WWN in Multiple Aliases, FA Zones, and Zones” on page 10-24
“Searching for a Zone Member” on page 10-24
“Clearing the Zoning Database” on page 10-25
“Adding Unzoned Online Devices to a Zone or Alias” on page 10-26
“Removing Offline Devices from the Zoning Database” on page 10-26
“Replacing Offline Devices” on page 10-27
“Defining Device Aliases” on page 10-27
Web Tools Administrator’s Guide
Publication Number: 53-0000522-09
Managing the Zoning Database
10
Adding a WWN to Multiple Aliases, Zones, and
FA Zones
This procedure enables you to configure a WWN as a member in a zone configuration prior to adding
that device to the fabric. Specifically, it is useful if you want to add a WWN to all or most zoning
entities. The added WWN does not need to currently exist in the fabric.
To add a WWN to the Zone Admin buffer
1.
Launch the Zone Admin module as described on page 10-3.
2.
Click Edit > Add WWN.
The Add WWN dialog displays.
3.
Type a WWN value in the WWN field.
4.
Click OK.
The Add WWN dialog displays all the zoning elements that will include the new WWN, including
aliases, zones, and FA zones. All of the elements are selected by default.
5.
Click items in the list to select or unselect, and click Add to add the new WWN to all the selected
zoning elements.
The WWN is added to the Zone Admin buffer and can be used as a member.
Removing a WWN from Multiple Aliases, Zones,
and FA Zones
This procedure is useful if you want to remove a WWN from all or most zoning entities.
To delete a WWN from the Zone Admin buffer
1.
Launch the Zone Admin module as described on page 10-3.
2.
Click Edit > Delete WWN.
The Delete WWN dialog displays.
3.
Type a WWN value in the WWN field.
4.
Click OK.
The Delete WWN dialog displays all the zoning elements that include the WWN.
5.
Click items in the list to select or unselect, and click Delete to delete the WWN from all the
selected zoning elements.
The WWN is deleted from the selected items in the Zone Admin buffer.
Web Tools Administrator’s Guide
Publication Number: 53-0000522-09
10-23
10
Managing the Zoning Database
Replacing a WWN in Multiple Aliases, FA Zones,
and Zones
This procedure enables you to replace a WWN throughout the Zone Admin buffer. This is helpful when
exchanging devices in your fabric and helps you to maintain your current configuration.
To replace a WWN in the Zone Admin buffer
1.
Launch the Zone Admin module as described on page 10-3.
2.
Click Edit > Replace WWN.
The Replace WWN dialog displays.
3.
Type the WWN to be replaced in the Replace field.
4.
Type the new WWN in the By field.
5.
Click OK.
The Replace WWN dialog is displayed. It lists all the zoning elements that include the WWN.
6.
Click an item in the list to select or unselect, and click Replace to replace the WWN in all the
selected zoning elements.
The former WWN is replaced in the Zone Admin buffer by the new WWN, including within any
alias or zone in which the old WWN was a member.
Searching for a Zone Member
You can search zone member selection lists for specified strings of text. If you know some identifying
information about a possible member of a zoning entity, you can select the tab and view for that entity
and then search through its member selection list using the Search for Zone Member option. If the target
entity is an alias, zone, QuickLoop, or FA zone, then the search domain includes elements like switch
names and domain numbers, port names and “domain, port” addresses, device WWNs and
manufacturer names, and also any aliases that might already have been defined. If the target entity is a
configuration, then zones, FA zones, and QuickLoops are also included, along with the elements they
contain.
The search starts from the top of the list, and when the target element is found, it is also selected in the
Member Selection List so it can be added or its parent or children can be found. By default, the Member
Selection List is searched from beginning to end one time. If you select the wraparound option, the
search will continue to loop from the beginning to the end of the Member Selection List.
To search for a zone member
1.
Launch the Zone Admin module as described on page 10-3.
2.
Click Edit > Search Member.
3.
Type the zone member name in the Member Name field.
Optional: Narrow the search by checking one or more of the checkboxes, such as Match Case.
4.
10-24
Click Next to begin the zone member search.
Web Tools Administrator’s Guide
Publication Number: 53-0000522-09
Managing the Zoning Database
10
Clearing the Zoning Database
Use the following procedure to disable the active zoning configuration, if one exists, and delete the
entire zoning database.
Caution
This action not only disables zoning on the fabric but also deletes the entire zoning database. This results
in all devices being able to communicate with each other.
To disable any active configuration and delete the entire zoning database
1.
Launch the Zone Admin module as described on page 10-3.
2.
Click Actions > Clear All.
The Disable Config warning displays.
3.
Click Yes to do all of the following:
•
•
•
Disable the current configuration.
Clear the entire contents of the current Web Tools Zone Admin buffer.
Delete the entire persistent contents of the fabric zoning database.
This action is not recoverable.
Using Zoning Wizards
The Zone Admin module contains the following wizards to help you perform the following zoning
tasks:
•
•
•
•
Add Un-zoned Devices
Remove Offline Devices
Replace Offline Devices
Define Device Alias
The wizards are accessed through the Tools menu in the Zone Admin module. The following sections
describe the zoning tasks and the procedure for accessing the wizards for each task. The wizards are
self-explanatory, so the specific steps are not documented here.
Note
The left side of each wizard window lists the steps you need to take to complete the task. The current
step is in blue, as shown in Figure 10-7 on page 10-26. Some of the wizards allow you to loop and repeat
the task multiple times; as a result, each step is listed in this panel, so that you not only see the steps that
you still need to perform, but also the steps that you have already performed.
The step numbers do not necessarily match the overall numbering in this panel.
Web Tools Administrator’s Guide
Publication Number: 53-0000522-09
10-25
10
Managing the Zoning Database
Figure 10-7 Add Un-zoned Devices Wizard
Adding Unzoned Online Devices to a Zone or Alias
When zoning is enabled, devices that are not included in a zone configuration are inaccessible to other
devices in the fabric. Use the following procedure to identify online devices that are not zoned in any
zone configuration and add them to a zone or alias.
To add unzoned online devices to a zone or alias
1.
Launch the Zone Admin module as described on page 10-3.
2.
Click Tools > Add Un-zoned Devices.
The Add Un-zoned Devices wizard starts.
3.
Follow the steps outlined in the wizard.
The wizard displays unzoned devices and prompts you to select them and add them to an alias or a zone.
When you have finished the steps for adding a device to a zone or alias, if there are any more unzoned
devices, you can either continue to add those unzoned devices or exit the wizard. If there are no more
unzoned devices, you must exit the wizard.
Removing Offline Devices from the Zoning Database
Removing offline devices (WWNs) helps clean the zoning database to save more space for new entries.
Use the following procedure to view all devices that are no longer online and remove all or selected
offline devices from the zoning database.
10-26
Web Tools Administrator’s Guide
Publication Number: 53-0000522-09
Managing the Zoning Database
10
To remove offline devices from the zoning database
1.
Launch the Zone Admin module as described on page 10-3.
2.
Click Tools > Remove Offline Devices.
The Remove Offline Devices wizard starts.
3.
Follow the steps outlined in the wizard.
The wizard allows you to view all devices that are no longer online, and remove all or selected offline
devices from the zoning database.
Replacing Offline Devices
Replacing an offline device replaces its WWN with a new given WWN in all of its containing aliases
and zones. Use the following procedure to view offline devices and replace them with new ones in the
zoning database.
To replace offline devices
1.
Launch the Zone Admin module as described on page 10-3.
2.
Click Tools > Replace Offline Devices.
The Replace Offline Devices wizard starts.
3.
Follow the steps outlined in the wizard.
The wizard allows you to view all devices that are no longer online, and replace all or selected offline
devices with new ones (WWNs) in the zoning database.
Defining Device Aliases
Use the following procedure to define zone alias names for devices in a single process. This procedure
is especially useful if you use one unique zone alias to name each device port.
The alias definitions of the devices are saved in the zoning database on the switch, which has a size
limit. If database size becomes a concern, reconsider your use of alias definitions.
To assign aliases to devices
1.
Launch the Zone Admin module as described on page 10-3.
2.
Click Tools > Remove Offline Devices.
The Define Device Alias wizard starts.
3.
Follow the steps outlined in the wizard.
The wizard allows you to define one and only one name for each device port (WWN). Devices with one
or more aliases are considered already named and are not displayed.
Note
To enter a zone alias name, double-click the Zone Alias field for each device, as shown in Figure 10-8
on page 10-28, and type the name.
After typing each alias name, you must press Enter or click another zone alias field, or the wizard does
not accept the name.
Web Tools Administrator’s Guide
Publication Number: 53-0000522-09
10-27
10
Best Practices for Zoning
Figure 10-8 Entering a Zone Alias in the Define Device Alias Wizard
Best Practices for Zoning
Following are recommendations when using zoning:
•
•
•
•
10-28
Always zone using the highest Fabric OS-level switch.
Zone using the core switch versus an edge switch.
Zone using a director over a switch.
Zone on the switch you connect to when bringing up Web Tools (the proxy switch).
Web Tools Administrator’s Guide
Publication Number: 53-0000522-09
Chapter
Working With Diagnostic Features
11
This chapter contains the following information:
•
•
•
•
“Managing Trace Dumps,” next
“Displaying Switch Information” on page 11-4
“Interpreting Port LEDs” on page 11-8
“Displaying Port Information” on page 11-10
Managing Trace Dumps
A trace dump is a snapshot of the running behavior within the SilkWorm switch. The dump can be used
by developers and troubleshooters at Brocade to help understand what might be contributing to a
specific switch behavior when certain internal events are seen. For example, a trace dump can be
created each time a certain error message is logged to the system error log. Developers can then
examine what led up to the message event by studying the traces.
Tracing is always “on.” As software on the switch executes, the trace information is placed into a
circular buffer in system RAM. Periodically, the trace buffer is “frozen” and saved. This saved
information is a trace dump.
A trace dump is generated when:
•
•
•
•
•
it is triggered manually (use the traceDump command)
a critical-level LOG message occurs
a particular LOG message occurs (use the traceTrig command to set up the conditions for this)
a kernel panic occurs
the hardware watchdog timer expires
(For information about the traceDump and traceTrig commands, refer to the Fabric OS Command
Reference Manual.)
The trace dump is maintained on the switch until either it is uploaded to the FTP host or another trace
dump is generated. If another trace dump is generated before the previous one is uploaded, the previous
dump is overwritten.
When a trace dump is generated, it is automatically uploaded to an FTP host if automatic FTP uploading
is enabled.
Using the Trace tab of the Switch Admin module, you can view and configure the trace FTP host
target, enable or disable automatic trace uploads, and manually upload a trace dump (see Figure 11-1 on
page 11-2).
Web Tools Administrator’s Guide
Publication Number: 53-0000522-09
11-1
11
Managing Trace Dumps
Figure 11-1 Trace Tab
How a Trace Dump Is Used
The generation of a trace dump causes a CRITICAL message to be logged to the system error log.
When a trace dump is detected, issue the supportSave command on the affected switch. This command
packages all error logs, the supportShow output, and trace dump, and moves these to your FTP server.
You can also configure your switch to automatically copy trace dumps to your FTP server (refer to
“Setting Up Automatic Trace Dump Transfers,” next).
In addition to automatic generation of trace dumps on faults, you can also generate a trace dump
manually or when certain system error messages are logged. This is normally done with assistance from
Brocade customer support when diagnosing switch behavior.
For details on the commands, refer to the Fabric OS Command Reference Manual.
Setting Up Automatic Trace Dump Transfers
You can set up a switch so that diagnostic information is transferred automatically to a remote server.
Then, if a problem occurs you can provide your customer support representative with the most detailed
information possible. To ensure the best service, you should set up for automatic transfer as part of
standard switch configuration, before a problem occurs.
11-2
Web Tools Administrator’s Guide
Publication Number: 53-0000522-09
Managing Trace Dumps
11
Setting up for automatic transfer of diagnostic files involves the following tasks:
•
•
Specify a remote server to store the files.
Enable the automatic transfer of trace dumps to the server. (Trace dumps overwrite each other by
default; sending them to a server preserves information that would otherwise be lost.)
You should also set up a periodic checking of the remote server so that you are alerted if the server
becomes unavailable and you can correct the problem. Refer to the Fabric OS Administrator’s Guide
for additional information.
The following procedures describe in detail the tasks for setting up automatic transfer.
To specify a remote server
1.
Launch the Switch Admin module as described on page 4-3.
2.
Click the Trace tab.
3.
Type the FTP host IP address, path of the remote directory in which to store the trace dump files,
FTP user name, and FTP password in the appropriate fields.
The password is optional if you log in as an anonymous user.
4.
Click Apply.
To enable automatic transfer of trace dumps
1.
Launch the Switch Admin module as described on page 4-3.
2.
Click the Trace tab.
3.
Click Enable in the Auto FTP Upload section to enable automatic uploading of the trace dump to
the FTP host.
4.
Click Apply.
Disabling Automatic Trace Uploads
If automatic uploading of a trace dump is disabled, you must manually upload the trace dump or else the
information is overwritten when a subsequent trace dump is generated.
To disable automatic uploading of the trace dump
1.
Launch the Switch Admin module as described on page 4-3.
2.
Click the Trace tab.
3.
Click Disable in the Auto FTP Upload section to disable automatic uploading of the trace dump to
the FTP host.
4.
Click Apply.
Uploading a Trace Dump Manually
You can manually upload a trace dump when automatic uploading is not enabled.
Web Tools Administrator’s Guide
Publication Number: 53-0000522-09
11-3
11
Displaying Switch Information
To upload the trace dump
1.
Launch the Switch Admin module as described on page 4-3.
2.
Click the Trace tab.
The Trace Dump Availability section displays whether a trace dump is available. If the Trace
Auto FTP Uploaded box is checked, the trace dump has been automatically uploaded to the FTP
host.
3.
Click Upload Trace. If the Upload Trace button is inactivated, it means that a trace dump is not
available.
The Upload Trace dialog displays, along with the default trace dump file name.
4.
Optional: Type a new trace dump file name if you want to change it from the default name.
5.
For the SilkWorm 12000, 24000, and 48000 only, click the CP (active or standby) from which
the trace dump is to be uploaded.
If the CP does not have a trace dump, that CP selection is disabled.
6.
Click OK.
Displaying Switch Information
This section describes how to display information about the physical components of the switch (such as
fan, temperature, and power supply) as well as how to display other detailed switch information (such
as firmware and IP address).
Displaying Detailed Fan Hardware Status
The background color of the Fan button indicates the overall status of the fans. For more information
about the switch fan, refer to the appropriate hardware documentation.
Note
The SilkWorm 3016 Switch View does not have a Fan button as there are no fan FRUs in this embedded
switch.
You can display status information about the fans, as shown in Figure 11-2 on page 11-5.
11-4
Web Tools Administrator’s Guide
Publication Number: 53-0000522-09
Displaying Switch Information
11
Figure 11-2 Fan Status Window
Note that the Fan No. column indicates either the fan number or the fan FRU number, depending on the
switch model. A fan FRU can contain one or more fans.
•
For the SilkWorm 12000, 24000, and 48000 directors and the SilkWorm 4100 switches, the
Fan No. column indicates the fan FRU number.
•
•
For the SilkWorm 3900, the Fan No. column indicates the fan number.
The SilkWorm 200E, 3250, and 3850 switches do not contain fan FRUs, so for these switch
models, the Fan No. column indicates the fan number.
To display the fan status detail
1.
Select a switch from the Fabric Toolbar.
The selected switch appears in the Switch View. The background color of the Fan button indicates
the overall status of the fan.
2.
Click the Fan button on the Switch View.
The detailed fan status for the switch is displayed, as shown in Figure 11-2.
Displaying the Temperature Status
The background color of the Temp button indicates the overall status of the temperature. For more
information regarding switch temperature, refer to the appropriate hardware documentation.
To display the temperature status detail
1.
Select a switch from the Fabric Toolbar.
The selected switch appears in the Switch View. The background color of the Temp button
indicates the overall status of the temperature.
2.
Click the Temp button on the Switch View.
The detailed temperature sensor states for the switch are displayed, as shown in Figure 11-3 on
page 11-6.
Web Tools Administrator’s Guide
Publication Number: 53-0000522-09
11-5
11
Displaying Switch Information
Figure 11-3 Temperature Status Window
Displaying the Power Supply Status
The background color of the Power button indicates the overall status of the power supply status. For
more information regarding switch power modules, refer to the appropriate hardware documentation.
Note
The SilkWorm 3016 Switch View does not have a Power button as there are no power supply FRUs in
this embedded switch.
To display the power supply status detail
1.
Select a switch from the Fabric Tree.
The selected switch appears in the Switch View. The background color of the Power button
indicates the overall status of the power supply.
2.
Click the Power button on the Switch View.
The detailed power supply states are displayed for the switch.
Checking the Physical Health of a Switch
The Status button displays the operational state of the switch. The background color of the button
displays the real-time status of the switch. Refer to the Status Legend for the meaning of the background
colors.
If no data is available from a switch, the most recent background color remains displayed.
For all statuses that are based on errors per time interval, any errors cause the status to show faulty until
the entire sample interval has passed.
If the switch status is marginal or critical, information on the trigger that caused that status is displayed
in the Switch Information view.
Click the Status button to display a detailed, customizable switch status report, as shown in Figure 11-4
on page 11-7. Note that this is a static report and not a dynamic view of the switch.
11-6
Web Tools Administrator’s Guide
Publication Number: 53-0000522-09
Displaying Switch Information
11
Figure 11-4 Switch Report
To display a detailed switch status report
1.
Select a switch from the Fabric Tree.
The selected switch appears in the Switch View. The background color of the Status button
indicates the overall status of the switch.
2.
Click the Status button on the Switch View.
The detailed switch health report is displayed, as shown in Figure 11-4.
3.
Optional: Click the underlined links in the left panel to display detailed information about ports and
Switch Availability Monitoring (SAM).
4.
Optional: Mouse-over the Action field (see Figure 11-5 on page 11-8) and click an action to:
•
•
•
•
•
refresh the information displayed in the report
customize the report
view the data in raw XML format
view the style sheet for the report
view the XML schema for the report
Web Tools Administrator’s Guide
Publication Number: 53-0000522-09
11-7
11
Interpreting Port LEDs
Figure 11-5 Switch Report Action Menu
Interpreting Port LEDs
The Switch View displays port graphics with blinking LEDs, simulating the physical appearance of the
ports. One of the LEDs indicates port status; the other indicates port speed. For LED information, refer
to the hardware documentation for the switch you are viewing.
The background color of the port icon indicates the port status, as follows:
•
•
•
•
green (healthy)
yellow (marginal)
red (critical)
gray (unmonitored)
If the entire port icon is blue, the port is buffer-limited.
If a group of port icons is grayed out, those ports are not licensed.
The port status is also indicated in the Port Information screen in the Port Health field for the selected
port. (See Figure 11-8 on page 11-10.)
Figure 11-6 on page 11-9 shows a port icon and associated LEDs from a SilkWorm 12000 director. The
port icons are different for different switch models.
11-8
Web Tools Administrator’s Guide
Publication Number: 53-0000522-09
Interpreting Port LEDs
11
Figure 11-6 Port and LED Status Color-Coded Information in the Port Icon in Switch View
The background color of the
port icon indicates port status.
The blinking LEDs indicate port
status and port speed.
For the SilkWorm 48000 director, the representation of the port LEDs on the FC4-32 port blade is not
the same as the LEDs on the physical blade. Figure 11-7 compares the LEDs on the physical port card
and the Web Tools display.
Figure 11-7 Port LEDs for the FC4-32 Port Blade in the SilkWorm 48000
Physical Port Card
Web Tools Representation
C
A
!
B
A
!
B
D
C
D
Legend
FC4
32
Web Tools Administrator’s Guide
Publication Number: 53-0000522-09
A
Port Speed LED for the right port
B
Port Status LED for the right port
C
Port Speed LED for the left port
D
Port Status LED for the left port
11-9
11
Displaying Port Information
Displaying Port Information
The Port Information screen displays statistics and status for the selected port, SFP, or loop, as shown in
Figure 11-8. Access the Port Information screen by clicking any of the ports in the Switch View.
Figure 11-8 Port Information Screen
The number of slots displayed in the Port Information screen depends on the switch model. For
example, each logical switch in the SilkWorm 12000 director (and the SilkWorm 24000 and 48000
directors, if configured for two logical switches) has four slots. For these switch types, a subtab is
displayed for each physically inserted and powered on slot in the Port Information screen. You must
first click the slot tab and then the port tab for that slot.
For the SilkWorm 200E, 3014, 3016, 3250, 3850, 3900, 4012, and 4100 switches, there are no
subtabs for the slots. There is just a port tab for each port.
The Port Information screen displays two values relating to port type, which are defined as follows:
Port Type
This is the actual or current port type. If the port is offline, this value is the allowed
types (or U-Port, if no type constraint has been specified). If the port is online, this
value is the type the port has actually negotiated to.
Allow Port Type The allowed or configured port type, as set by the type checkboxes in the Switch
Admin module, Ports tab. (Refer to “Configuring Port Type” on page 4-13 for more
information.)
To access the Port Information screen
1.
Select a switch from the Fabric Tree.
The selected switch displays in the Switch View.
11-10
Web Tools Administrator’s Guide
Publication Number: 53-0000522-09
Displaying Port Information
2.
11
Click the port icon for which you want to view information.
The Port Information screen displays.
3.
This step is switch-specific:
For SilkWorm 12000, 24000, and 48000 directors, click the slot tab that corresponds to the
correct slot for the logical switch.
For SilkWorm 200E, 3014, 3016, 3250, 3850, 3900, 4012, and 4100 switches, proceed directly to
the next step.
4.
Click the port tab.
5.
Optional: To view additional port information, click one of the subtabs for each port: PortStats,
SFP, or Loop.
Web Tools Administrator’s Guide
Publication Number: 53-0000522-09
11-11
11
11-12
Displaying Port Information
Web Tools Administrator’s Guide
Publication Number: 53-0000522-09
Chapter
Administering FICON CUP Fabrics
12
This chapter contains the following sections:
•
•
•
•
•
“Enabling or Disabling FMS Mode,” next
“Configuring FMS Parameters” on page 12-3
“Displaying the Code Page Information” on page 12-4
“Displaying the Control Device State” on page 12-5
“Configuring CUP Port Connectivity” on page 12-6
Control Unit Port (CUP) is a protocol for managing FICON directors. Host-based management
programs manage the switches using CUP protocol by sending commands to the emulated Control
Device implemented by Fabric OS. A Brocade switch or director that supports CUP (SilkWorm 3900,
12000, 24000, or 48000) can be controlled by one or more host-based management programs or director
consoles, such as Brocade Web Tools or Brocade Fabric Manager. (Refer to the Fabric Manager
Administrator’s Guide for information about Fabric Manager.) The director allows control to be shared
between host-based management programs and director consoles.
To use FICON CUP, you must:
•
•
•
Install a FICON CUP license on a FICON director
Enable FMS mode on the FICON director
Configure CUP attributes (FMS parameters) for the FICON director
All of these things can be done using Web Tools. You can also use Web Tools to manage FICON
directors (when FMS mode is enabled on those directors) to:
•
•
•
Display the control device state
Display a code page
Manage port connectivity configuration
You do not need to install the FICON CUP license to perform FICON CUP management; you must
install the FICON CUP license, however, if your switch is to enforce traffic between the FICON
director and the host-based management program.
Enabling or Disabling FMS Mode
FICON Management Server (FMS) is used to support switch management using CUP. To be able to use
the CUP functionality, all switches in the fabric must have FICON Management Server mode (FMS
mode) enabled. FMS mode is a per-switch setting. After FMS mode is enabled, you can activate a CUP
license without rebooting the director. You can use Web Tools to install a CUP license. For more
information on installing licenses, refer to “Activating a License on a Switch” on page 4-17.
Web Tools Administrator’s Guide
Publication Number: 53-0000522-09
12-1
12
Enabling or Disabling FMS Mode
When FMS mode is disabled, mainframe management applications, director consoles, or alternate
managers cannot communicate with a director with CUP. In addition, when FMS mode is disabled on a
director, you cannot configure CUP attributes.
To enable or disable FMS mode
1.
Click a FICON CUP-capable switch from the Fabric Tree.
2.
Launch the Switch Admin module as described on page 4-3.
3.
Click the FICON CUP tab.
The FICON CUP tabbed page displays, with the FICON Management Server subtabbed page in
front, as shown in Figure 12-1. All attributes on this tab are disabled until FMS mode is enabled.
4.
Click the Enable radio button to enable FMS mode.
Figure 12-1 FICON CUP Management
12-2
Web Tools Administrator’s Guide
Publication Number: 53-0000522-09
Configuring FMS Parameters
12
Configuring FMS Parameters
FMS parameters control the behavior of the switch with respect to CUP itself, as well as the behavior of
other management interfaces (director console, Alternate Managers). You can configure FMS
parameters for a switch only after FMS mode is enabled on the switch. All FMS parameter settings are
persistent across switch power cycles. There are six FMS parameters, as described in Table 12-1.
Table 12-1
FMS Mode Parameter Descriptions
Parameter
Description
Programmed
Offline State
Control
This parameter controls whether host programming is allowed to set the switch
offline. The parameter is set as enabled by the hardware after system installation,
and can be reset by Web Tools.
Active=Saved
Mode
This parameter controls the IPL file update. The IPL file saves port connectivity
attributes and port names. After a switch reboot or power cycle, the switch reads the
IPL file and actives its contents as default configuration.
When this mode is enabled, activating a configuration saves a copy to the IPL
configuration file. All changes made to the active connectivity attributes or port
names by host programming or alternate managers are saved in this IPL file. It keeps
the current active configuration persistent across switch reboots and power cycles.
You cannot directly modify the IPL file or save a file as an IPL file. When this mode
is disabled, the IPL file is not altered for either new configuration activation or any
changes made on the current active configuration. This parameter is set as enabled
by the hardware after system installation, and can be reset by Web Tools.
Note: When FMS mode is enabled and the Active=Saved parameter is disabled, you
can enable and disable ports, but the setting is not persistent. When the
Active=Saved parameter is enabled, you can enable and disable ports and the setting
is persistent.
Alternate
Control
Prohibited
This parameter determines whether alternate managers are allowed to modify port
connectivity.
Enabling this mode prohibits alternate manager control of port connectivity;
otherwise, alternate managers can manage port connectivity.
This parameter is set as enabled by the hardware after system installation, and can
be reset by Web Tools.
User Alert
Mode
This parameter controls director console behavior for alerts.
Enabling this mode prompts the director consoles to display a warning whenever
you attempt an action that will change switch parameters. When you disable this
mode, no warning is displayed. In this case, in which Web Tools is the director
console, warning messages are displayed by Web Tools regardless of the setting of
the parameter, since Web Tools always displays warning messages when you apply
a change to a switch that changes parameters.
This parameter is always read-only in Web Tools. Each time that the switch is
powered on, the parameter is reset to disabled.
Web Tools Administrator’s Guide
Publication Number: 53-0000522-09
12-3
12
Displaying the Code Page Information
Table 12-1
FMS Mode Parameter Descriptions (Continued)
Parameter
Description
Director Clock
Alert Mode
This parameter controls behavior for attempts to set the switch timestamp clock
through the director console.
When it is enabled, the director console (Web Tools, in this case) displays warning
indications when the switch timestamp is changed by a user application. When it is
disabled, you can activate a function to automatically set the timestamp clock. There
is no indication for timestamp clock setting.
This parameter is set as disabled by the hardware after system installation, and can
be reset by Web Tools.
Host Control
Prohibited
This parameter determines whether host programming allows modifying port
connectivity.
Enabling this mode prohibits host programming control of port connectivity;
otherwise, host programming can manage port connectivity.
This parameter is set as disabled by the hardware after system installation. and can
be reset by Web Tools.
To configure FMS mode parameters
1.
Click a FICON-enabled switch from the Fabric Tree.
2.
Launch the Switch Admin module as described on page 4-3.
3.
Click the FICON CUP tab.
The FICON CUP tabbed page displays, with the FICON Management Server subtabbed page in
front (see Figure 12-1 on page 12-2). All attributes on this tab are read-only until FMS mode is
enabled.
4.
To enable or disable an FMS mode parameter, click the checkbox next to the parameter. A marked
checkbox means that the parameter is enabled. You cannot configure the User Alert Mode
parameter in Web Tools, as it is read-only.
Displaying the Code Page Information
The Code Page field identifies the language used to exchange information between the FICON director
and Host Programming. It is a read-only field in Web Tools, as it is set by Host Programming only.
When FMS mode is disabled, the code page is displayed as unavailable.
To display the code page information
1.
Click a FICON-enabled switch from the Fabric Tree.
2.
Launch the Switch Admin module as described on page 4-3.
3.
Click the FICON CUP tab.
The FICON CUP tabbed page displays, with the FICON Management Server subtabbed page in
front (see Figure 12-1 on page 12-2). All attributes on this tab are read-only until FMS mode is
enabled.
12-4
Web Tools Administrator’s Guide
Publication Number: 53-0000522-09
Displaying the Control Device State
12
The code page format is displayed in the Code Page field.
Example
Language used to exchange information with Host Programming: (EBCDIC) USA/Canada
-- 00037
Displaying the Control Device State
The Control Device is in either a neutral or a switched state. When it is neutral, the Control Device
accepts commands from any channel that has established a logic path with it and accepts commands
from alternate managers. When the Control Device is switched, it establishes a logical path and accepts
commands only from that logical path (“device allegiance”). Commands from other paths cause a
FICON CUP Busy Error (see Figure 12-2). Most “write” operations from alternate managers are also
rejected.
Figure 12-2 FICON CUP Busy Error
Device allegiance usually lasts for a very short time. However, under abnormal conditions, device
allegiance can get “stuck” and fail to terminate. It might cause the switch to be unmanageable with
CUP, and you will continue to receive the FICON CUP Busy Error. In this case, you should check the
Control Device state and the last update time to identify if the device allegiance is stuck. The Web Tools
Switch Admin displays the Control Device state and last update time (see Figure 12-1 on page 12-2).
You can click Refresh to get most recent update.
You can manually reset allegiance to bring the Control Device back to the neutral state by clicking
Reset Allegiance in the FICON CUP Busy Error display (see Figure 12-2).
The FICON CUP Busy Error can be caused by the following switch parameters being read or modified:
•
•
•
•
•
Mode Register
Port Names (also called Port Address Name)
PDCM and Port Connectivity Attributes
Switch enable/disable
Switch name change
To display the Control Device state
1.
Click a FICON-enabled switch from the Fabric Tree.
2.
Launch the Switch Admin module as described on page 4-3.
3.
Click the FICON CUP tab.
Web Tools Administrator’s Guide
Publication Number: 53-0000522-09
12-5
12
Configuring CUP Port Connectivity
The FICON CUP tabbed page displays, with the FICON Management Server subtabbed page in
front (see Figure 12-1 on page 12-2). All attributes on this tab are read-only until FMS Mode is
enabled.
The Control Device state is displayed as neutral or switched in the Control Device Allegiance field.
If FMS mode is enabled, and the Control Device state is unavailable, the FICON CUP Busy Error
is displayed. Click Reset Allegiance in the error message to reset the Control Device state to its
correct state (see Figure 12-2).
Configuring CUP Port Connectivity
In the Port Connectivity subpanel (shown in Figure 12-3 on page 12-7), you can manage the
configuration files and active configuration. All CUP configuration files and the active configuration
are listed in a table. The active configuration is listed as “Active Configuration*” and the description in
the table is “Current active configuration on switch.” The other special configuration file is the IPL.
Any other files displayed are user-defined configurations and are stored on the switch.
You can create, activate, copy, or delete saved CUP port connectivity configurations; however, you can
only edit or copy a configuration while it is active.You can also activate, edit, or copy the IPL
configuration. You must have FMS mode enabled before you can make any changes to the
configurations. Click Refresh to get the latest configuration file list from the switch.
When creating a new configuration or editing an existing configuration, keep in mind that Web Tools
port name input is restricted to printable ASCII characters. Therefore, when Web Tools displays a port
name, if there are characters beyond printable ASCII characters (which would have been created by the
Host Program), those characters are displayed as dots (.).
When initially installed, a switch allows any port to dynamically communicate with any other port. Two
connectivity attributes are defined to restrict this any-to-any capability for external ports: Block and
Prohibit.
Block is a port connectivity attribute that prevents all communication through a port. Prohibit is the port
connectivity attribute that prohibits or allows dynamic communication between ports when a port is not
blocked. Each port has a vector specifying its Prohibit attribute with respect to each of the other ports in
the switch. This attribute is always set symmetrically in that a pair of ports is either prohibited or
allowed to communicate dynamically.
The Port Connectivity table (shown in Figure 12-4 on page 12-9) displays the Port number (in physicallocation format), Port Name (port address name), Block attribute, Prohibit attribute, and Area Id (port
address, displayed in hexadecimal) in fixed columns. The right side is a port matrix, which lists all ports
by Area ID and identifies prohibited ports. Those columns are scrollable and swappable.
Displaying CUP Port Connectivity
Configurations
Use the following procedure to display a list of CUP port connectivity configurations, as shown in
Figure 12-3 on page 12-7.
12-6
Web Tools Administrator’s Guide
Publication Number: 53-0000522-09
Configuring CUP Port Connectivity
12
To display the CUP Port Connectivity Configurations list
1.
Click a FICON-enabled switch from the Fabric Tree.
2.
Launch the Switch Admin module as described on page 4-3.
3.
Click the FICON CUP tab.
The FICON CUP tabbed page displays, with the FICON Management Server subtabbed page in
front (see Figure 12-1 on page 12-2). All attributes on this page are read-only until FMS mode is
enabled.
4.
Click the CUP Port Connectivity subtab (see Figure 12-3).
Figure 12-3 Configuring CUP Port Connectivity
Creating or Editing CUP Port Connectivity
Configurations
Use the following procedure to create a new CUP port connectivity configuration or to edit an existing
configuration.
Web Tools Administrator’s Guide
Publication Number: 53-0000522-09
12-7
12
Configuring CUP Port Connectivity
To create or edit CUP port connectivity configurations
1.
Display the CUP port connectivity configuration list, as described on page 12-7.
2.
You can either create a new configuration or edit an existing configuration.
•
To create a new configuration, click New.
The Create Port CUP Connectivity Configuration dialog displays all ports and port names on
the selected switch (similar to the dialog shown in Figure 12-4). The Block column, Prohibit
column, and prohibited ports matrix are displayed as empty, for you to configure.
•
To edit an existing configuration, click the configuration and then click Edit.
The Edit Port CUP Connectivity Configuration dialog displays the content of the selected
configuration from the switch in a table format (see Figure 12-4).
3.
Optional: Check the checkbox corresponding to a port you want to block on the Block column.
Repeat this step for all ports you want to block. Click the Block All checkbox to block all ports.
4.
Optional: Check the checkbox corresponding to a port you want to prohibit on the Prohibit column.
Repeat this step for all ports you want to prohibit. Click the Prohibit All checkbox to prohibit all
ports.
The cells in the matrix are updated with “X” icons to identify prohibited ports.
5.
Optional: Click the individual cells corresponding to the combination of ports you want to prohibit.
You cannot prohibit a port to itself.
6.
Review your changes. A blue background in a cell indicates that its value has been modified.
7.
After you have finished making changes, do any of the following:
•
Click Activate to save the changes and make the configuration active immediately, as
described in “Activating a CUP Port Connectivity Configuration” on page 12-9.
•
•
Click Save to save the changes but not make the configuration active.
•
•
12-8
Click Save As to save the configuration to a new configuration file. When you click Save As, a
dialog displays in which you should type a file name and description for the configuration file.
Click Refresh to refresh the information from the switch.
Click Cancel to cancel all changes without saving.
Web Tools Administrator’s Guide
Publication Number: 53-0000522-09
Configuring CUP Port Connectivity
12
Figure 12-4 Port CUP Connectivity Configuration Dialog
Activating a CUP Port Connectivity
Configuration
When you activate a saved CUP port connectivity configuration on the switch, the preceding
configuration (currently activated) is overwritten.
To activate a saved CUP port connectivity configuration
1.
Display the CUP port connectivity configuration list, as described on page 12-7.
2.
Click the saved configuration from the list.
3.
Click Activate.
Web Tools Administrator’s Guide
Publication Number: 53-0000522-09
12-9
12
Configuring CUP Port Connectivity
The Activate CUP Port Connectivity Configuration confirmation dialog displays.
The dialog reminds you that the current configuration will be overwritten upon activation.
4.
Optional: Click Active=Saved Mode to enable (checked) or disable (unchecked) the Active=Saved
FMS parameter after the configuration is activated.
5.
Click Yes to activate the configuration, or click No to cancel the activation.
Copying a CUP Port Connectivity Configuration
Use the following procedure to copy a CUP port connectivity configuration to a new configuration.
To copy a saved CUP port connectivity configuration
1.
Display the CUP port connectivity configuration list, as described on page 12-7.
2.
Click a saved configuration or the active configuration from the list.
3.
Click Copy.
The Copy CUP Port Connectivity Configuration dialog displays.
4.
In the dialog, type a name and description for the new configuration and click OK to save the
configuration to the target file; click Cancel to cancel copying the configuration.
The file name must be in alphanumeric characters and can contain only dashes or underscores as
special characters.
Deleting a CUP Port Connectivity Configuration
Use the following procedure to delete a saved CUP port connectivity configuration.
To delete a saved CUP port connectivity configuration
1.
Display the CUP port connectivity configuration list, as described on page 12-7.
2.
Click the saved configuration from the list.
3.
Click Delete.
The Delete CUP Port Connectivity Configuration confirmation dialog displays.
4.
12-10
Click Yes to delete the selected configuration; click No to cancel the deletion.
Web Tools Administrator’s Guide
Publication Number: 53-0000522-09
Chapter
Administering Fabric Watch
13
This chapter contains the following sections:
•
•
•
•
•
•
“Introduction to Fabric Watch,” next
“Using Fabric Watch with Web Tools” on page 13-2
“Configuring Fabric Watch Thresholds” on page 13-3
“Configuring Alarms for FRUs” on page 13-6
“Displaying Fabric Watch Alarm Information” on page 13-7
“Configuring Email Notifications” on page 13-8
Introduction to Fabric Watch
Fabric Watch is a Brocade optionally licensed feature that monitors the performance and status of
switches and can automatically alert you when problems arise, before they become costly failures.
Fabric Watch tracks a variety of SAN fabric elements, events, and counters. For example, Fabric Watch
monitors:
•
•
Fabric resources, including fabric reconfigurations, zoning changes, and new logins.
•
Port state transitions, errors, and traffic information for multiple port classes as well as operational
values for supported models of Finisar “Smart” GBICs/SFPs.
•
Performance information for AL_PA, end-to-end, and SCSI command metrics.
Switch environmental functions, such as temperature, power supply, and fan status, along with
security violations.
Fabric Watch lets you define how often to measure each switch and fabric element and allows you to
specify notification thresholds. Whenever fabric elements exceed these thresholds, Fabric Watch
automatically provides notification using several methods, including email messages, SNMP traps, and
log entries.
Note
To use the Fabric Watch feature, you must have a Fabric Watch license installed on your switch.
For more detailed information regarding Fabric Watch, refer to the Fabric Watch Administrator’s
Guide.
Web Tools Administrator’s Guide
Publication Number: 53-0000522-09
13-1
13
Using Fabric Watch with Web Tools
Using Fabric Watch with Web Tools
You can administer Fabric Watch operations through the Web Tools Fabric Watch module. Click the
Watch button in the Switch View to access the Fabric Watch module, shown in Figure 13-1.
Figure 13-1 Fabric Watch Module
Fabric Watch navigation tree, lists the
available classes for the switch
Summary of actions
The last time the Fabric Watch
module was updated
The Fabric Watch navigation tree, on the left side of the module, displays the available classes. The
classes are organized in a set of folders. Not all classes are available for all switches.
You should use the Fabric Watch module if you want to:
13-2
•
•
Configure custom threshold values on particular elements.
•
•
Choose if and how Fabric Watch alerts you to errant values (configure alarms).
Place limits on the acceptable values of those elements and enable the custom limits (configure
threshold boundaries).
Choose if and how frequently Fabric Watch identifies unacceptable values (configure threshold
traits).
Web Tools Administrator’s Guide
Publication Number: 53-0000522-09
Configuring Fabric Watch Thresholds
13
To launch the Fabric Watch module
1.
Select a switch from the Fabric Tree.
The selected switch appears in the Switch View.
2.
Click the Watch button on the Switch View.
Note
The Watch button displays in the Switch View only if the Fabric Watch license has been
activated.
The Fabric Watch module displays (see Figure 13-1).
Configuring Fabric Watch Thresholds
The Threshold Configuration tab enables you to configure event conditions. From this tab, you
configure threshold traits, alarms, and email configuration.
Use the following procedures to configure threshold traits for all classes except for the FRU class. Use
the procedure described in “Configuring Alarms for FRUs” on page 13-6 for the FRU class.
Configuring Threshold Traits
Configure threshold traits to define a threshold for a particular class and area. Using the following
procedure, you can configure the following traits for a threshold:
•
•
•
•
•
Unit
The string used to define the units of measurement for the area
Time Base
The time base (second, minute, hour, day) for the area
Low Boundary
The low threshold for the event-setting comparisons
High Boundary
The high threshold for the event-setting comparisons
Buffer Size
The size of the buffer zone used in event-setting comparisons
To configure threshold traits
1.
Launch the Fabric Watch module as described in “To launch the Fabric Watch module”.
2.
Click the Threshold Configuration tab (see Figure 13-2 on page 13-4).
Web Tools Administrator’s Guide
Publication Number: 53-0000522-09
13-3
13
Configuring Fabric Watch Thresholds
Figure 13-2 Threshold Configuration for Fabric Watch
3.
Click the Trait Configuration subtab.
4.
Click a class from the Fabric Watch navigation tree.
Note
If you select the FRU class from the Fabric Watch navigation tree, there is a separate set
of instructions. Refer to “Configuring Alarms for FRUs” on page 13-6.
5.
Select an area from the Area Selection menu in the Threshold Configuration tabbed page.
The module displays two columns of trait information, labeled System Default and Custom
Defined. You cannot modify the information in the System Default column.
6.
Click the System Default radio button to use the system default settings, and proceed to step 12.
or
Click the Custom Defined radio button to specify new settings and proceed to the next step.
7.
Type a unit of threshold measurement in the Unit field.
8.
Select a time to record the event in the Time Base field.
9.
Type the lowest boundary of the normal zone in the Low Boundary field.
10. Type the highest boundary of the normal zone in the High Boundary field.
11. Type the size of the buffer zone in the Buffer Size field.
12. Click Apply to save your changes.
13-4
Web Tools Administrator’s Guide
Publication Number: 53-0000522-09
Configuring Fabric Watch Thresholds
13
Configuring Threshold Alarms
After you update the threshold information, use the Alarm Configuration subtab to customize the
notification settings for each event setting.
To configure threshold alarms
1.
Launch the Fabric Watch module as described on page 13-3.
2.
Click the Threshold Configuration tab.
3.
Click the Alarm Configuration subtab.
4.
Click a class from the Fabric Watch navigation tree.
5.
Select an area from the Area Selection menu in the Threshold Configuration tab.
The module displays two tables of alarm configuration information, labeled System Default and
Custom Defined. You cannot modify the information in the System Default table.
6.
Click the System Default radio button in the Activate Level section to use the system default
settings, and proceed to step 8.
or
Click the Custom Defined radio button in the Activate Level section to specify new settings and
proceed to the next step.
7.
Click a checkbox to set the type of notification method for each event type (Changed, Below,
Above, Inbetween). The available alarm actions are ERROR_LOG, SNMP_TRAP, RAPI_TRAP,
and EMAIL_ALERT.
8.
Click Apply.
Enabling or Disabling Threshold Alarms for
Individual Elements
Use the Element Configuration subtab to configure element-specific alarm settings.
To enable or disable threshold alarms for an element
1.
Launch the Fabric Watch module as described on page 13-3.
2.
Click a class from the Fabric Watch navigation tree.
You can set alarms for information on a switch only if that information is monitored by Fabric
Watch for that switch; not all alarm options are available for all switches. For more information,
refer to the Fabric Watch Administrator’s Guide.
3.
Click the Threshold Configuration tab.
4.
Click the area with the alarms that you want to enable or disable from the Area Selection menu.
5.
Click the Element Configuration subtab.
6.
Click an element from the Element Selection menu.
Web Tools Administrator’s Guide
Publication Number: 53-0000522-09
13-5
13
Configuring Alarms for FRUs
7.
To disable threshold alarms, click Disabled in the Status area, and click Apply. The threshold
alarms are disabled and you do not need to continue with this procedure.
or
To enable threshold alarms, click Enabled in the Status area, and continue with the next step.
8.
9.
Select a behavior type for the threshold alarms:
•
Click Triggered to receive threshold alarms only when they are triggered by events that you
have defined.
•
Click Continuous to receive threshold alarms at a continuous interval. Select a time interval in
which to receive the threshold alarms from the Time Interval menu.
Click Apply.
10. Optional: Apply the selections on this panel to multiple elements simultaneously.
a.
Click Apply More.
This brings up the Multiple Selection Dialog.
b.
Click the boxes next to the indices of all applicable elements.
c.
Click OK.
Configuring Alarms for FRUs
Configuration for the FRU class is different than configuration for the other classes. Because FRUs are
not monitored through a threshold-based system, they have a simpler interface for configuration. For
FRUs, you configure the states for which an event occurs, as described in the following procedure.
To configure alarms for FRUs
1.
Launch the Fabric Watch module as described on page 13-3.
2.
Click the Threshold Configuration tab.
3.
Click the FRU class from the Fabric Watch navigation tree.
4.
Select a FRU type from the Area Selection menu in the Threshold Configuration tab.
5.
Click the alarm states for which you want an event to register. Whenever a FRU of the selected type
is detected to be in one of the selected states, an event will occur.
6.
Click the methods by which you want to be notified about the FRU alarms. For FRUs, the only
options are error log and email alert.
7.
Click Apply to apply the changes to the switch.
A confirmation dialog displays, asking if you want to apply the changes to the switch.
8.
13-6
Click OK in the confirmation dialog to save the changes to the switch.
Web Tools Administrator’s Guide
Publication Number: 53-0000522-09
Displaying Fabric Watch Alarm Information
13
Displaying Fabric Watch Alarm Information
From the Fabric Watch module, you can view two types of reports:
•
•
Alarm notifications, which displays the alarms that have occurred for a selected class/area
Alarm configuration, which displays threshold and alarm configurations for a selected class/area
Displaying an Alarm Configuration Report
Use the Threshold Configuration tab, Configuration Report subtab to display a report of the
configuration for a selected class/area. The following information is displayed:
•
•
•
Threshold settings (labeled Threshold Configuration)
Notification settings (labeled Action Configuration)
Element settings (not labeled)
You can scroll through this information but cannot make changes.
To view an alarm configuration report
1.
Launch the Fabric Watch module as described on page 13-3.
2.
Click the Threshold Configuration tab.
3.
Click a previously configured element from the Fabric Watch navigation tree (refer to “Enabling or
Disabling Threshold Alarms for Individual Elements” on page 13-5).
4.
Click the alarm area report to be viewed from the Area Selection menu.
5.
Click the Configuration Report subtab.
This tab displays a report of the configuration for the selected area.
Displaying Alarms
Using the Alarm Notification tab, you can view a list of all alarms that have occurred for a selected
class/area (see Figure 13-1 on page 13-2). Table 13-1 describes the columns in this report. (Note that for
the FRU class, only the Name, State, and Time columns are displayed. In addition, if the FRU area is
Fan, the Name column refers to either a fan or a fan FRU, depending on the switch model. Refer to
“Displaying Detailed Fan Hardware Status” on page 11-4 for more information.)
Table 13-1
Alarm Notification Table Fields
Field
Description
Name
The string assigned to the element that had an event
State
The current state of the element
Reason
The event type that was triggered
Last Value
The data value of the element when the event was triggered
Current Value
The current data value of the element
Time
Time when the event occurred
Web Tools Administrator’s Guide
Publication Number: 53-0000522-09
13-7
13
Configuring Email Notifications
To view alarms
1.
Launch the Fabric Watch module as described on page 13-3.
2.
Click the class that you want to check for alarms in the Fabric Watch navigation tree.
3.
Click the Alarm Notification tab.
4.
Click the area that you want to check for alarms from the Area Selection menu.
All alarms for that area display.
For troubleshooting responses to alarms, refer to the Fabric Watch Administrator’s Guide.
Configuring Email Notifications
One of the ways that you can be notified of an alarm condition is through an email alert. If you have
configured alarms to send an email notification, you must also configure the email server and the email
recipient, as described in the following sections.
Configuring the Email Server on a Switch
You must set up the email notification recipient’s DNS server and domain name on each switch for
which email notification is enabled.
When you set up the email notification local network’s DNS server and domain name for the
SilkWorm 12000, 24000, and 48000 directors, it is on a logical-switch basis. This means that for each
logical switch, you must set up the email notification recipient’s DNS server and domain name
individually.
To configure the email server
1.
Launch the Switch Admin module as described on page 4-3.
2.
Click the Switch tab.
3.
Type your primary domain Name Server IP address in the DNS Server 1 field in the Email
Configuration area.
4.
Type your secondary domain server IP address in the DNS Server 2 field.
5.
Type the domain name in the Domain Name field (between 4 and 32 characters).
6.
Click Apply to save the changes.
Configuring the Email Alert Recipient
You can set a different email alert configuration for each class. For example, you can set one email
notification for SFPs and another for E_Ports. Before configuring email alert recipients, you must set up
the email notification recipient’s DNS server and domain name. For more information, refer to
“Configuring the Email Server on a Switch”.
13-8
Web Tools Administrator’s Guide
Publication Number: 53-0000522-09
Configuring Email Notifications
13
To configure the Email Alert alarm
1.
Launch the Fabric Watch module as described on page 13-3.
2.
Click the Email Configuration tab, as shown in Figure 13-3.
3.
Click the Enable or Disable radio button to enable or disable the email alert status.
When you disable email alerts, Fabric Watch does not send email notification even if the email
notification method is assigned to monitored areas.
4.
Type the email address of the recipient in the Recipient Email Address text box. Messages are sent
to this address when email notification is enabled.
Note
Email addresses must not exceed 128 characters.
5.
Click Apply.
6.
Optional: Click Send Test Email to receive a test email so you can verify the email notification is
working correctly. You can send a test email only after you have applied your settings.
Figure 13-3 Fabric Watch Email Configuration
Web Tools Administrator’s Guide
Publication Number: 53-0000522-09
13-9
13
13-10
Configuring Email Notifications
Web Tools Administrator’s Guide
Publication Number: 53-0000522-09
Chapter
Monitoring Performance
14
This chapter contains the following sections:
•
•
•
•
•
•
“Monitoring Performance Using Web Tools,” next
“Launching the Performance Monitor Module” on page 14-5
“Creating a Basic Performance Monitor Graph” on page 14-5
“Customizing Basic Monitoring Graphs” on page 14-6
“Creating Advanced Performance Monitoring Graphs” on page 14-8
“Managing Performance Graphs” on page 14-12
Monitoring Performance Using Web Tools
The Web Tools Performance Monitor module graphically displays throughput (in megabytes per
second) for each port and for the entire switch.
The basic-mode Performance Monitor is standard in the Web Tools software. The Advanced
Monitoring menu in Performance Monitor is an optionally licensed software.
Use the basic-mode Performance Monitor module to:
•
•
•
Create user-definable reports.
Display a performance canvas for application-level or fabric-level views.
Save persistent graphs across reboots (saves parameter data across reboots).
Using Brocade Advanced Performance Monitoring, you can display predefined reports for AL_PA,
end-to-end, and filter-based performance monitoring. You can track:
•
•
The number of CRC errors for AL_PA devices.
•
The number of times a particular filter pattern in a frame is transmitted by a port.
The number of words received and transmitted in Fibre Channel frames with a defined S_ID/
D_ID pair.
For detailed information on these types of performance monitoring, refer to the Fabric OS
Administrator’s Guide.
Each graph is displayed individually in a window, so it can be minimized, maximized, resized, and
closed.
Graphs within the Performance Monitor module are updated every 30 seconds. When you first display
the graph or if you modify the graph (such as to add additional ports), you might have to wait up to 30
seconds before the new values are shown.
Web Tools Administrator’s Guide
Publication Number: 53-0000522-09
14-1
14
Monitoring Performance Using Web Tools
When you have multiple graphs open in the Performance Monitor module, you can:
•
Select Tile from the Window menu to view all graphs at once, tiled in the Performance
Monitor module.
•
•
Select Cascade from the Window menu to view one graph at a time.
Select Close All to close all open Performance Monitor graphs in the Performance Monitor
module.
In addition, the Window menu lists all open graphs. You can select a graph name from the Window
menu to bring that graph to the front view when the graphs are cascaded, and to select the window for
that graph when the graphs are tiled.
Predefined Performance Graphs
Web Tools predefines basic graph types, to simplify performance monitoring. A wide range of end-toend fabric, LUN, device, and port metrics graphs are included. Table 14-1 lists the basic monitoring
graphs available. Table 14-2 on page 14-3 lists the advanced monitoring graphs. The advanced
monitoring graphs give more detailed performance information to help you manage your fabric. You
can access the basic monitoring graphs on all switches; advanced monitoring graphs are available only
on switches that have a Brocade Advanced Performance Monitoring license activated.
Table 14-1
Basic Performance Graphs
Graph Type
Description
Port Throughput
Displays the performance of a port, in bytes per second, for frames
received and transmitted.
Switch Aggregate Throughput Displays the aggregate performance of all ports on a switch.
14-2
Blade Aggregate Throughput
Displays the aggregate performance of all ports on a port card. This
graph is available only for the SilkWorm 12000, 24000, and 48000
directors.
Switch Throughput
Utilization
Displays the port throughput at the time the sample is taken. For the
SilkWorm 12000, 24000, and 48000 directors, this graph displays the
throughput for each slot. You can customize this graph to display
information for particular ports.
Port Error
Displays a line of CRC errors for a given port.
Switch Percent Utilization
Displays the percentage utilization for each port in a switch. For the
SilkWorm 12000, 24000, and 48000 directors, this graph displays the
percent utilization for each slot. You can customize this graph to
display information for particular ports.
Port Snapshot Error
Displays the CRC error count between sampling periods for all the
ports on a switch. For the SilkWorm 12000, 24000, and 48000
directors, this graph displays the CRC error rate for each slot. You
can customize this graph to display information for particular ports.
Web Tools Administrator’s Guide
Publication Number: 53-0000522-09
Monitoring Performance Using Web Tools
Table 14-2
14
Advanced Performance Monitoring Graphs
Graph Type
Description
SID/DID Performance
Displays the traffic between the SID-DID pair on the switch being
managed. For more information, refer to “Creating an SID-DID
Performance Graph” on page 14-8.
SCSI vs. IP Traffic
Displays percentage of SCSI versus IP frame traffic on each
individual port. For more information, refer to “Creating a SCSI vs.
IP Traffic Graph” on page 14-10.
AL_PA Errors
Displays CRC errors for a given port and a given AL_PA. For more
information, refer to “Creating an AL_PA Error Graph” on
page 14-11.
SCSI Commands by port and
LUN (R, W, R/W)
Displays the total number of read/write commands on a given port to
a specific LUN. For more information, refer to “Creating a SCSI
Command Graph” on page 14-10.
The labeling of axes in the graphs depends on the switch type. For the SilkWorm 12000, 24000, and
48000 directors, slot numbers are displayed with “expansion” arrows next to them, as shown in Figure
14-1 on page 14-4. Click the arrows to expand and contract the list of ports per slot. For the SilkWorm
200E, 3014, 3016, 3250, 3850, 3900, 4012, and 4100 switches, slot numbers are not identified.
Port throughput utilization is represented by a horizontal bar for each selected port, which gets longer or
shorter depending on the percent utilization for that port at the last poll time. Thin short vertical
intersecting bars give a historical perspective by representing the highest and lowest values reached for
each selected port since the graph was opened. A third bar between them represents the average of all
values polled. (See Figure 14-1.)
Figure 14-1 shows how to access the list of Advanced Performance Monitoring graphs using Web
Tools. This example displays the graphs available in the Performance Monitor module for a
SilkWorm 24000 director with the Advanced Performance Monitoring license installed. Note that the
slot number is identified.
Web Tools Administrator’s Guide
Publication Number: 53-0000522-09
14-3
14
Monitoring Performance Using Web Tools
Figure 14-1 Accessing Performance Graphs
User-Defined Graphs
You can modify the predefined graphs to create your own customized graphs (refer to “Customizing
Basic Monitoring Graphs” on page 14-6 for more information). These user-defined graphs can be added
and saved to canvas configurations, described next.
Canvas Configurations
A canvas is a saved configuration of graphs. The graphs can be either the Web Tools predefined graphs
or user-defined graphs. Each canvas can hold up to eight graphs per window, as shown in Figure 14-2.
Up to 20 canvases can be set up for different users or different scenarios. Each canvas is saved with a
name and an optional brief description.
14-4
Web Tools Administrator’s Guide
Publication Number: 53-0000522-09
Launching the Performance Monitor Module
14
Figure 14-2 Canvas of Eight Performance Monitoring Graphs
Launching the Performance Monitor Module
Use the following procedure to launch the Web Tools Performance Monitor module.
To launch the Performance Monitor module
1.
Select a switch from the Fabric Tree. The selected switch appears in the Switch View.
2.
Click the Perf button on the Switch View.
The Performance Monitor module displays.
Creating a Basic Performance Monitor Graph
Use the following procedure to create the basic performance monitor graphs listed in Table 14-1 on
page 14-2.
To create a basic performance monitor graph
1.
Launch the Performance Monitor module as described on page 14-5.
2.
Click Performance Graphs > Basic Monitoring > Graph Type.
Web Tools Administrator’s Guide
Publication Number: 53-0000522-09
14-5
14
Customizing Basic Monitoring Graphs
Depending on the type of graph you select, you might be prompted to select a slot or port for which
to create a graph (see Figure 14-3).
Figure 14-3 Creating a Port Throughput Graph
3.
If prompted, drag the port into the Enter/drag slot,port field, or manually type the slot and port
information in the field, in the format slot,port.
For SilkWorm 12000, 24000, and 48000 directors, you must select first a slot number and then a
port number.
For SilkWorm 200E, 3014, 3016, 3250, 3850, 3900, 4012, and 4100 switches, you need type only
a port number.
4.
Click OK.
The graph is displayed in a window in the Performance Monitor module. The following section
explains how you can customize some of these graphs.
Customizing Basic Monitoring Graphs
You can customize some of the basic performance monitoring graphs to display information for
particular ports. For the SilkWorm 12000, 24000, and 48000 directors, you can also customize these
graphs to display information for a slot.
You can customize the following graphs:
•
•
•
Switch Throughput Utilization Graph
Switch Percent Utilization Graph
Port Snapshot Error Graph
The following procedure assumes that you have already created one of these customizable graphs.
To customize basic performance monitoring graphs
1.
Create or access the graph you want to customize. Refer to “Creating a Basic Performance Monitor
Graph” on page 14-5 for instructions on creating a graph.
2.
For SilkWorm 12000, 24000, and 48000 directors, to display detailed port throughput utilization
rates for each port in a slot, click the arrows next to a slot. Port information for that slot is displayed
in the graph.
For SilkWorm 200E, 3014, 3016, 3250, 3850, 3900, 4012, and 4100 switches, proceed to step 3.
14-6
Web Tools Administrator’s Guide
Publication Number: 53-0000522-09
Customizing Basic Monitoring Graphs
3.
14
To display detailed port throughput utilization rates for particular ports only:
a.
Right-click anywhere in the graph.
b.
Click Select Ports.
The setup dialog displays, as shown in Figure 14-4. The title of the dialog varies, depending on
the type of graph you are customizing, but the layout of the dialog is the same. Figure 14-4
shows an example of the setup dialog for the Switch Throughput Utilization graph.
Figure 14-4 Switch Throughput Utilization Setup Dialog
c.
Double-click the domain icon
to expand the slot/port list.
For the SilkWorm 12000, 24000, and 48000 directors, click the + signs to expand the ports
under each slot, as shown in Figure 14-4.
d.
Click the particular port you want to monitor in the graph in the Port Selection List. Use Shiftclick and Ctrl-click to select multiple ports.
e.
Click Add to move the selected ports to the Selected Ports list.
f.
Optional: Click ADD ALL Ports to add all of the ports in the Port Selection List to the
Selected Ports list.
g.
Optional: Click Search to launch the Search Port Selection List dialog, from which you can
search for all E_Ports, all F_Ports, or all port names with a defined string. Select the ports you
want to add and click Search in the Search Port Selection List dialog.
h.
Click Apply.
Only the selected ports are displayed in the graph.
Web Tools Administrator’s Guide
Publication Number: 53-0000522-09
14-7
14
Creating Advanced Performance Monitoring Graphs
Creating Advanced Performance Monitoring Graphs
This section describes how to create the advanced performance monitor graphs listed in Table 14-2 on
page 14-3. Because the procedure for creating these graphs differs depending on the type of graph, each
type is described separately in the sections that follow.
Note
You must have an Advanced Performance Monitoring license installed to use the advance performance
monitor features.
Creating an SID-DID Performance Graph
The SID/DID Performance graph displays the traffic between a SID-DID pair on the switch being
managed.
To create an SID/DID performance graph
1.
Launch the Performance Monitor module as described on page 14-5.
2.
Click Performance Graphs > Advanced Monitoring > SID/DID Performance.
The SID/DID Performance Setup dialog displays (see Figure 14-5 on page 14-9).
If you want to see which end-to-end (EE) monitors are currently set up on a particular port, proceed
to step 3.
If you want to specify the port, source ID, and domain ID, skip to step 4.
14-8
Web Tools Administrator’s Guide
Publication Number: 53-0000522-09
Creating Advanced Performance Monitoring Graphs
14
Figure 14-5 Creating an SID/DID Performance Graph
3.
Click a port from the Slot/Port or Sid/Did Selection List.
a.
Drag the selected port into the Enter/drag port number field.
b.
Click Retrieve preset EE monitors.
The current end-to-end monitors for that port are displayed in the “Current EE monitors set for
selected port” table.
c.
Optional: To display a performance graph for the current EE monitors set for the selected port,
click a SID-DID pair in the table. You can select multiple source ID and Destination IDs. Click
Select. If you selected multiple SID/DID monitors, click OK in the confirmation dialog that
appears. Skip to step 6.
If you do not want to display a performance graph for the current EE monitors set for the
selected port, continue with step 4.
4.
Click a source ID from the “Port or Sid/Did Selection List,” and click Add Sid. You can also type
a source ID in the “Enter/drag SID number” field.
5.
Click a destination ID from the “Port or Sid/Did Selection List,” and click Add Did. You can also
type a destination ID in the “Enter/drag DID number” field.
6.
Click OK.
If you selected multiple EE monitors, SIDs, or PIDs, a confirmation dialog displays, reminding you
that one graph will be opened for each selection. Click Yes to display the graphs.
Web Tools Administrator’s Guide
Publication Number: 53-0000522-09
14-9
14
Creating Advanced Performance Monitoring Graphs
Creating a SCSI vs. IP Traffic Graph
The SCSI vs. IP Traffic graph displays the SCSI vs. IP traffic for selected ports. For SilkWorm 12000,
24000, and 48000 directors, the slot and port name is identified in the graph.
In a trunk group, the SCSI vs. IP Traffic graph displays only the master port and not the slave ports.
To create a SCSI vs. IP Traffic graph
1.
Launch the Performance Monitor module as described on page 14-5.
2.
Click Performance Graphs > Advanced Monitoring > SCSI vs. IP Traffic.
The SCSI vs. IP Traffic Setup dialog displays. This dialog is similar to that shown in Figure 14-4
on page 14-7.
3.
Double-click the domain icon
to expand the slot/port list.
For SilkWorm 12000, 24000, and 48000 directors, click the + signs to expand the ports under
each slot, as shown in Figure 14-4.
4.
Click the port you want to monitor in the graph in the Port Selection List. Use Shift-click and Ctrlclick to select multiple ports.
5.
Click Add to move the selected ports to the Selected Ports list.
6.
Optional: Click ADD ALL Ports to add all of the ports in the Port Selection List to the Selected
Ports list.
7.
Optional: Click Search to launch the Search Port Selection List dialog, from which you can search
for all E_Ports, all F_Ports, or all port names with a defined string. Select the ports you want to add
and click Search in the Search Port Selection List dialog.
8.
Click Apply in the SCSI vs. IP Traffic Setup dialog.
Only the selected ports are displayed in the SCSI vs. IP traffic graph.
Creating a SCSI Command Graph
This graph displays the total number of read or write (or both) commands on a given port or to a specific
LUN on a given port.
To create a SCSI command graph
1.
Launch the Performance Monitor module as described on page 14-5.
2.
Click Performance Graphs > Advanced Monitoring > SCSI Commands > Graph Type.
The applicable setup dialog displays. Figure 14-6 on page 14-11 shows the “SCSI Read/Write on a
LUN per port Setup” dialog.
14-10
Web Tools Administrator’s Guide
Publication Number: 53-0000522-09
Creating Advanced Performance Monitoring Graphs
14
Figure 14-6 Creating a SCSI Command Graph
3.
Navigate to a switch > slot > port in the Slot/Port Selection List.
4.
Click the port from the Slot/Port Selection List and drag it into the Enter/drag slot,port field.
5.
Optional: For the LUN per port graphs, type a LUN number, in hexadecimal.
For the SilkWorm 4012 and 4100 switches, you can enter up to eight LUN masks.
For the SilkWorm 48000 director, you can enter up to four LUN masks.
For all other switches running Fabric OS v4.x or v5.x, you can enter up to two LUN masks.
For switches running Fabric OS v3.x, you can enter up to three LUN masks.
6.
Click OK.
The selected graph is displayed in the canvas.
Creating an AL_PA Error Graph
The AL_PA Error graph displays CRC errors for a given port and a given AL_PA. The AL_PA Error
graph is not supported on the SilkWorm 4012 and 4100 switches.
To create an AL_PA error graph
1.
Launch the Performance Monitor module as described on page 14-5.
2.
Click Performance Graphs > Advanced Monitoring > ALPA Error.
The ALPA Error Setup dialog displays (see Figure 14-7 on page 14-12).
3.
Navigate to a switch > slot > port in the Slot/Port or Alpa Selection List.
4.
Click the port from the Slot/Port Selection List or an AL_PA from the Slot/Port Selection List, and
drag it into the “Enter/drag slot,port” field. You can also manually type the slot and port number, in
the format slot,port.
5.
Click OK.
The AL_PA Error graph displays on the canvas.
Web Tools Administrator’s Guide
Publication Number: 53-0000522-09
14-11
14
Managing Performance Graphs
Figure 14-7 Creating an ALPA Error Graph
Managing Performance Graphs
This section provides the following procedures for managing performance graphs:
•
•
•
•
Saving Graphs to a Canvas
Adding a Graph to an Existing Canvas
Printing Graphs
Modifying an Existing Graph
Saving Graphs to a Canvas
Saving graphs is especially useful when you create customized graphs and do not want to re-create them
every time you access the Performance Monitor module.
When you save graphs, you must save them to a canvas. The following procedure describes how to save
graphs to a new canvas.
To save graphs
1.
Launch the Performance Monitor module as described on page 14-5.
2.
Create basic or advanced Performance Monitor graphs, as described in “Creating a Basic
Performance Monitor Graph” on page 14-5 and “Creating Advanced Performance Monitoring
Graphs” on page 14-8.
The graphs are displayed in the in the Performance Monitor window.
3.
Click File > Save Current Canvas Configuration.
The Save Canvas Configuration dialog displays.
4.
Type a name and description for the configuration and then click Save Canvas.
A message displays, confirming that the configuration was successfully saved to the switch.
14-12
Web Tools Administrator’s Guide
Publication Number: 53-0000522-09
Managing Performance Graphs
14
Adding a Graph to an Existing Canvas
The following procedure assumes that a canvas is already created.
To create a new canvas, you must first create graphs, as described in “Creating a Basic Performance
Monitor Graph” on page 14-5 and “Creating Advanced Performance Monitoring Graphs” on page 14-8,
and then save those graphs to a canvas, as described in “Saving Graphs to a Canvas” on page 14-12.
To add a graph to an existing canvas
1.
Click File > Display Canvas Configurations.
The Canvas Configuration List displays. A message “No Canvas configuration to display” will
display if there are no saved canvas configurations.
2.
Click a canvas in the list.
3.
Click Edit.
The Edit Canvas dialog box displays.
4.
Click Add.
A list of graphs displays.
5.
Click a graph to add it to the canvas.
6.
Click Save.
Printing Graphs
You can print a single graph or all the graphs displayed on the selected canvas configuration. Only one
canvas configuration can be opened at a time.
To print a single graph
1.
Launch the Performance Monitor module as described on page 14-5.
2.
Create a basic or advanced Performance Monitor graph as described in “Creating a Basic
Performance Monitor Graph” on page 14-5 and “Creating Advanced Performance Monitoring
Graphs” on page 14-8.
3.
Right-click anywhere in the graph and click Print.
The print dialog displays.
4.
Click OK.
To print all graphs in a canvas
1.
Launch the Performance Monitor module as described on page 14-5.
2.
Click File > Display Canvas Configurations.
The Canvas Configuration List displays. A message “No Canvas configuration to display” will
display if there are no saved canvas configurations.
3.
Select a canvas from the list and click Load.
The graphs from that canvas are displayed in the Performance Monitor window.
Web Tools Administrator’s Guide
Publication Number: 53-0000522-09
14-13
14
Managing Performance Graphs
4.
Click File > Print All Graphs.
The print dialog displays.
5.
Click OK.
Modifying an Existing Graph
Use the following procedure to modify an existing graph that is saved in a canvas.
To modify an existing graph
1.
Launch the Performance Monitor module as described on page 14-5.
2.
Click File > Display Canvas Configurations.
The Canvas Configuration List displays. A message “No Canvas configuration to display” displays
if there are no saved canvas configurations.
3.
Select a canvas from the list and click Edit.
The Performance Monitor Canvas: Canvas Name dialog displays.
4.
Select a graph from the list and click Edit.
Note
The Edit button is enabled only for the graphs that are configurable or editable.
14-14
5.
Make changes in the Edit dialog, as necessary.
6.
Click OK to close the Edit dialog.
7.
Click Save to save the changes and close the Performance Monitor Canvas dialog.
8.
Click Close to close the Canvas Configuration List.
Web Tools Administrator’s Guide
Publication Number: 53-0000522-09
Chapter
Limitations
15
This section provides the following information:
•
•
•
“General Web Tools Limitations,” next
“Platform-Specific Limitations” on page 15-5
“Limitations When Using the Mozilla Browser” on page 15-6
General Web Tools Limitations
Table 15-1 lists general Web Tools limitations that apply to all browsers and switch platforms.
Table 15-1
Web Tools Limitations
Problem Area
Details
Browser
The Fabric Watch, Switch Admin, HA, Name Server, and Zone Admin
modules are separate applets embedded in HTML pages. The successful
launch of the applet depends on whether the browser can successfully load the
HTML page. Very occasionally, you will see a blank browser window with
the message “loading pages...” that is stuck. This is likely caused by a sudden
loss of switch Web server (either by normal HA failover, reboot, or other
causes).
Workaround: If the Fabric Watch, Switch Admin, HA, Name Server, or
Zone Admin modules hang, close this window and relaunch the module.
Browser
A Web Tools browser window might stop responding following an HA
failover immediately after a zoning configuration was enabled or disabled. It
is likely that the Web daemon was terminated by the HA failover before the
HTTP request was sent back.
Workaround: If one of the Web Tools modules is hanging, close the window
and relaunch the module. If the module is locked, shut down and relaunch the
Web Tools application.
Web Tools Administrator’s Guide
Publication Number: 53-0000522-09
15-1
15
General Web Tools Limitations
Table 15-1
Web Tools Limitations (Continued)
Problem Area
Details
Firmware download
There are multiple phases to firmware download and activation. When Web
Tools reports that firmware download has completed successfully, this
indicates that a basic sanity check, package retrieval, package unloading, and
verification was successful.
Web Tools forces a full package install.
A reboot is required to activate the newly downloaded firmware. This reboot
is done automatically; however, although Web Tools screens will continue to
be visible during the reboot, they will not be available. Wait approximately 10
minutes to ensure that all of the application windows have been restored. If
Web Tools fails to respond after 20 minutes, you might need to close all Web
Tools applications windows and restart them, or to contact your system
administrator for network assistance.
The Web Tools loss of network connectivity during a failover or reboot
(initiated though the firmwaredownload) varies for different configurations:
HTTP timeout
•
SilkWorm 12000, 24000, and 48000 directors: loss of network
connectivity is up to 5 minutes if the power-on self-test (POST) is
disabled. If POST is enabled, the loss of network connectivity can exceed
5 minutes.
•
SilkWorm 200E, 3014, 3016, 3250, 3850, 3900, 4012, and 4100
switches: loss of network connectivity is up to 1 minute if POST is
disabled. If POST is enabled, the loss of network connectivity can exceed
1 minute.
Very occasionally, you might see the following message when you try to get
data from a switch or to send a request to the switch:
Failed to get switch response. Please verify the status
of your last operation and try again if necessary.
This indicates that an HTTP request did not get a response. The request was
sent to the switch, but the connection was down, probably caused by a
temporary loss of the Web server on the switch. Due to the nature of an HTTP
connection, Web Tools will report this error after a 90-second default timeout.
In this case, verify the status of your last request, using telnet to check related
status, or click the Refresh button from the Web Tools application you were
working on to retrieve related data. If your request did not get through to the
switch, resubmit it. Executing a refresh from Web Tools retrieves a copy of
switch data at that moment; the data you entered can be lost if it had not
already committed to the switch.
Java Plug-in
When there is a dialog box opened for a module (for example, Switch Admin,
Zone Admin, or Fabric Watch) and you try to open another module, the initial
login dialog box receives an error and closes. This is a known defect in the
Java 1.3.1_04 Plug-in and is documented in Bug Id 4763605 (available from
www.java.sun.com).
Workaround: Close and reopen the module.
15-2
Web Tools Administrator’s Guide
Publication Number: 53-0000522-09
General Web Tools Limitations
Table 15-1
15
Web Tools Limitations (Continued)
Problem Area
Details
Licenses
If you remove the Web license after Web Tools application windows are
opened, Web Tools displays the Web license missing dialog. From this point
on, Web Tools behavior will be undefined if you continue with other
operations after removing the license.
Workaround: Close and relaunch the browser.
Loss of Connection
Occasionally, you might see the following message when you try to retrieve
data from the switch or send a request to the switch:
Switch Status Checking
The switch is not currently accessible.
The dialog title may vary, because it indicates which module is having the
problem.
This is caused by the loss of HTTP connection with the switch, due to a
variety of possible problems. Web Tools will automatically try to regain the
connection. While Web Tools is trying to regain the connection, check if your
Ethernet connection is still functioning. If the problem is not with the Ethernet
connection, wait for Web Tools to recover the connection and display the
following message:
You will have to resubmit your request after closing this
message.
If the temporary switch connection loss is caused by switch hot code load, or
other similar operation, the Switch Explorer you are currently running can be
downloaded from a different firmware version than the new one. In this case
the following message displays:
Switch connection is restored. The firmware version you are
running is not in sync with the version currently on switch.
Close your browser and re-launch Webtools.
You need to close Switch Explorer and relaunch Web Tools to reopen the
connection.
Performance Monitor If the Web browser crashes or the Performance Monitor license is lost while
the Performance Monitor module is running, some of the Performance
Monitor resources owned by Web Tools might not be cleaned up correctly.
Workaround: You might need to use the CLI to manually delete these
counters. For example, if you detect Web Tools owned resources (using
perfshoweemonitor), but you have verified that no Web users are actually
using them, use the perfdeleemonitor or perfcleareemonitor command to
free the resources.
Performance Monitor For SCSI Read, Write, or Read/Write on a LUN per Port graphs, Fabric OS
v4.1.0 (and later 4.x versions) allows you to enable only two bytes or less for
the LUN value mask setting. Fabric OS v3.1 (and later 3.x versions) allows up
to three bytes. Web Tools displays an error message if you exceed this limit.
Workaround: There is no workaround.
Web Tools Administrator’s Guide
Publication Number: 53-0000522-09
15-3
15
General Web Tools Limitations
Table 15-1
Web Tools Limitations (Continued)
Problem Area
Details
Refresh option in
browsers
When a pop-up window requesting a user response is pushed into the
background and a refresh is requested, a fatal Internet Explorer error may
occur.
Workaround: Restart the browser.
Refresh option in
browsers
Web Tools must be restarted when the Ethernet IP address is changed using
the NetworkConfig View command. Web Tools appears to hang if it is not
restarted after this operation is executed.
Workaround: Restart the browser.
Refresh option in
browsers
If you change the switch name or domain ID using the CLI after the Web
Tools Switch Admin module has started, the new switch name or domain ID
will not be updated on the header of the Switch Admin page. Clicking the
Refresh button will not fix the problem.
Workaround: Click the Switch tab and the Switch Admin header will
update.
Refresh option in
browsers
If you change the switch name using the Web Tools Switch Admin page or
SNMP and then open a telnet window to verify the name change, the CLI
prompt (for example, switch:admin>) displays the previous name. The telnet
prompt cannot pick up the new switch name until the switch is fastbooted.
Workaround: In order to display the correct switch name in the CLI prompt
after a switch name update using Web Tools or SNMP, fastboot the switch.
Refresh option in
browsers
Following a switch enable or disable, you must wait at least 25–30 seconds
for the fabric to reconfigure and for FSPF route calculations to complete
before requesting routing information. If accessed too early, routing
information will not be shown.
Workaround: Following a switch enable or disable, wait at least 25–30
seconds before further action.
Refresh option in
browsers
The Web Tools Switch Explorer might continue to display a switch from the
Switch View, even when the switch has been removed from the fabric.
Workaround: If this behavior is seen, relaunch the Switch Explorer. If the
switch was removed from the fabric, the Fabric View window will list the
switch as unavailable.
Refresh option in
browsers
In the Switch Admin module, Switch tab, if you click the Refresh button, you
might not be able to click the data entry fields to enter text. This behavior
occasionally happens on a notebook or laptop computer; it rarely happens on
a desktop computer.
Workaround: If this happens, you should close the browser window and
restart it.
Switch Explorer
closure
15-4
If upfront login is enabled, and the session times out or you log out or close
the Switch Explorer window, all other windows belonging to the session are
invalidated. After a short delay these windows become grayed out and
unusable, but are not closed automatically. You must manually close these
windows.
Web Tools Administrator’s Guide
Publication Number: 53-0000522-09
Platform-Specific Limitations
Table 15-1
15
Web Tools Limitations (Continued)
Problem Area
Details
Switch View
Occasionally, switches might display the port icons correctly, but be missing
one or more control button icons.
Workaround: Close the Switch View of the switch and reopen it.
Windows Operating
Systems
Occasionally, you will not see the “Lost connection to the switch” message on
the Switch View, even though the Ethernet connection has been lost. You
might still be able to invoke various features from Switch View, such as
Status, Fan Temp, Power, and Beacon. This problem might be seen in the
SilkWorm 12000, for example, when you see the “Lost connection to the
switch” error for a single switch in the chassis, when a lost connection affects
both logical switches.
Workaround: Verify Ethernet connection to the switch by pinging the logical
switch IP address.
Zone Admin
The accessibility matrix in the Zone Admin module does not show hosts and
devices zoned by QuickLoop AL_PA as being accessible to each other.
Platform-Specific Limitations
Table 15-2 lists Web Tools limitations that are specific to the SilkWorm 12000 director and to the
SilkWorm 24000 and 48000 directors when they are configured to have two domains.
Table 15-2
Platform-Specific Limitations
Problem Area
Details
Switch View
Neither CP is updated in the Switch View (refer to Figure 3-1 on
page 3-2) when switch 0 is being rebooted. The CP data displayed on
this Switch View is dependent on switch 0, and that data is not available
when switch 0 is rebooting.
Workaround: Wait until the reboot is finished and Switch View polling
occurs; then, the CPs will be updated properly.
Java Plug-in
The Java Plug-in might sometimes have problems focusing on a
particular field in an open applet if you have the same window open for
both logical switches.
Workaround: When this problem occurs, close and relaunch the
affected applet.
Web Tools Administrator’s Guide
Publication Number: 53-0000522-09
15-5
15
Limitations When Using the Mozilla Browser
Limitations When Using the Mozilla Browser
Table 15-3 lists limitations in Web Tools that occur when you use the Mozilla browser on a Linux
system. These limitations do not occur when using Internet Explorer on Windows.
Table 15-3
Web Tools Limitations When Using the Mozilla Browser
Problem Area
Details
Mozilla Browser on Red
Hat Operating System
On the Red Hat platform, the default system font size is larger than on
other platforms. This can cause tabbed panes to not line up. There is no
impact on functionality.
Mozilla Browser on
Solaris Operating System
On a Solaris/Mozilla browser, some pop-up windows (for example, the
firmware download completion message and performance monitor
dialog boxes) display in the background, behind other windows. This can
give the appearance of a session hang.
Workaround: If you are apparently locked out of other windows in the
Solaris/Mozilla environment, look for a pop-up window that needs to be
dismissed before proceeding further.
Performance Monitor
module
When creating performance graphs, you might not be able to drag and
drop port numbers or AL_PAs in the graph setup dialog box.
Workaround: Type the port numbers and AL_PAs in the appropriate
fields.
Switch Admin, Routing
tab
When you launch Web Tools and open the Switch Admin module for the
first time, if you click the Routing tab, the FSPF route tree nodes do not
display correctly.
Workaround: Click another tab in the Switch Admin module; then click
the Routing tab again.
Telnet
Mozilla browsers do not support the telnet application.
Workaround: Launch an external telnet process.
Zone Admin
If you make changes in the Zone Admin module and then close the
module without saving your changes, your changes are lost.
If you have unsaved changes and you close the module by clicking File >
Close, you receive a message warning that your changes are not saved
and requesting confirmation before the module is closed.
If you have unsaved changes and you close the module by clicking the X
in the upper right corner of the window, you receive a warning message
only if you are using Internet Explorer. If you are using the Mozilla
browser, you do not receive this message and any unsaved changes are
lost.
Workaround: Always close the Zone Admin module by clicking
File > Close. If you have not saved your changes, for all browsers, a
warning message is displayed, requesting confirmation before the
module is closed.
15-6
Web Tools Administrator’s Guide
Publication Number: 53-0000522-09
Glossary
A
Advanced
Fabric
Services,
Brocade
A Brocade proprietary feature.
Advanced
Performance
Monitoring,
Brocade
A Brocade proprietary feature.
Advanced
Zoning,
Brocade
A Brocade proprietary feature.
AL_PA
alias
arbitrated loop
area number
authentication
Arbitrated-loop physical address. A unique 8-bit value assigned during loop initialization to a port in an
arbitrated loop. Alternately, “arbitrated-loop parameters.”
A logical grouping of elements in a fabric. An alias is a collection of port numbers and connected
devices, used to simplify the entry of port numbers and WWNs when creating zones.
A shared 100-Mbit/sec Fibre Channel transport structured as a loop. Can support up to 126 devices and
one fabric attachment. See also topology.
In Brocade Fabric OS v4.0 and above, ports on a switch are assigned a logical area number. Port area
numbers can be viewed by entering the switchShow command. They are used to define the operative
port for many Fabric OS commands: for example, area numbers can be used to define the ports within
an alias or zone.
The process of verifying that an entity in a fabric (such as a switch) is what it claims to be.
B
Basic User
mode
A switch configuration that is set from the EZSwitchSetup CD. If Basic User mode is enabled, then
entering the switch IP address in a browser window launches Web Tools EZ instead of Web Tools.
Basic User mode is supported only on SilkWorm 200E and 3250 switches.
BB_Credit
Buffer-to-buffer credit. The number of frames that can be transmitted to a directly connected recipient
or within an arbitrated loop. Determined by the number of receive buffers available.
beacon
A tool in which all of the port LEDs on a switch are set to flash from one side of the switch to the other,
to enable identification of an individual switch in a large fabric. A switch can be set to beacon by a CLI
command or through Brocade Web Tools.
Web Tools Administrator’s Guide
Publication Number: 53-0000522-09
Glossary-1
C
canvas
CHAP
chassis
CLI
client
community
(SNMP)
compact flash
configuration
A saved configuration of performance monitor graphs.
Challenge-Handshake Authentication Protocol. Allows remote servers and clients to securely exchange
authentication credentials. Both the server and client are configured with the same shared secret.
The metal frame in which the switch and switch components are mounted.
Command line interface. An interface that depends entirely on the use of commands, such as through
telnet or SNMP, and does not involve a GUI.
An entity that, using its common transport (CT), makes requests of a server.
A relationship between a group of SNMP managers and an SNMP agent, in which authentication,
access control, and proxy characteristics are defined. See also SNMP.
Flash (temporary) memory that is used in a manner similar to hard disk storage. It is connected to a
bridging component that connects to the PCI bus of the processor. Not visible within the processor's
memory space.
(1) A set of parameters that can be modified to fine-tune the operation of a switch. Use the configShow
command to view the current configuration of your switch.
(2) In Brocade Zoning, a zoning element that contains a set of zones. The Configuration is the highestlevel zoning element and is used to enable or disable a set of zones on the fabric. See also zone
configuration.
CP
Control processor.
D
D_ID
director
DLS
Destination identifier. A 3-byte field in the frame header, used to indicate the address identifier of the
N_Port to which the frame is headed.
A Brocade SilkWorm 12000, 24000, or 48000 switch.
Dynamic load-sharing. Dynamic distribution of traffic over available paths. Allows for recomputing of
routes when an Fx_Port or E_Port changes status.
domain ID
A unique identifier for all switches in a fabric, used in routing frames. Usually automatically assigned
by the principal switch but can be assigned manually. The domain ID for a Brocade SilkWorm switch
can be any integer from 1 through 239.
E_D_TOV
Error-detect timeout value. The minimum amount of time a target waits for a sequence to complete
before initiating recovery. Can also be defined as the maximum time allowed for a round-trip
transmission before an error is declared. See also R_A_TOV.
E
Glossary-2
Web Tools Administrator’s Guide
Publication Number: 53-0000522-09
E_Port
Expansion port. A standard Fibre Channel mechanism that enables switches to network with each other,
creating an ISL. See also ISL.
effective zone
configuration
A subset of the defined zone configuration, containing only the zone configuration object that is
currently enabled. Only one configuration can be active at a time, but since multiple configurations can
be defined in the database, a new configuration can be easily switched.
enabled zone
configuration
The currently enabled configuration of zones. Only one configuration can be enabled at a time. See also
zone configuration.
error
Ethernet
As it applies to the Fibre Channel industry, a missing or corrupted frame, timeout, loss of
synchronization, or loss of signal (link errors).
Popular protocols for LANs.
F
F_Port
fabric
Fabric
Manager
fabric topology
Fabric Watch
failover
FAN
FCS switch
Fibre Channel
FICON®
firmware
Fabric port. A port that is able to transmit under fabric protocol and interface over links. Can be used to
connect an N_Port to a switch. See also FL_Port, Fx_Port.
A collection of Fibre Channel switches and devices, such as hosts and storage. Also referred to as a
“switched fabric.” See also SAN, topology.
An optionally licensed Brocade software. Fabric Manager is a GUI that allows for fabric-wide
administration and management. Switches can be treated as groups, and actions such as firmware
downloads can be performed simultaneously.
The arrangement of switches that form a fabric.
An optionally licensed Brocade software. Fabric Watch can be accessed through either the command
line or Web Tools, and it provides the ability to set thresholds for monitoring fabric conditions.
Describes the Brocade SilkWorm 12000, 24000, and 48000 process of one CP passing active status to
another CP. A failover is nondisruptive.
Fabric address notification. Retains the AL_PA and fabric address when a loop reinitializes, if the
switch supports FAN.
Relates to the Brocade Secure Fabric OS feature. One or more designated switches that store and
manage security parameters and configuration data for all switches in the fabric. They also act as a set
of backup switches to the primary FCS switch. See also primary FCS switch.
The primary protocol used for building SANs to transmit data between servers, switches, and storage
devices. Unlike IP and Ethernet, Fibre Channel was designed to support the needs of storage devices of
all types. It is a high-speed, serial, bidirectional, topology-independent, multiprotocol, and highly
scalable interconnection between computers, peripherals, and networks.
A protocol used on IBM mainframes. Brocade SilkWorm switch FICON support enables a SilkWorm
fabric to transmit FICON format data between FICON-capable servers and storage.
The basic operating system provided with the hardware.
Web Tools Administrator’s Guide
Publication Number: 53-0000522-09
Glossary-3
fixed port
usage
fixed zoning
FL_Port
flash
frame
FRU
FSPF
FTP
In Web Tools EZ, fixed port usage means that a set of switch ports is designated to be used as HBA
(host) ports and a set of ports is designated to be used as storage ports.
In Web Tools EZ, fixed zoning is a preconfigured default zoning setup that is set at the factory. It
enforces the rule of one HBA port zoned with one storage port. Fixed zoning is hard zoning; each zone
member is identified by the default switch domain (1) and a port number. Fixed zoning is set up based
on fixed port usage.
Fabric loop port. A port that is able to transmit under fabric protocol and also has arbitrated-loop
capabilities. Can be used to connect an NL_Port to a switch. See also F_Port, Fx_Port.
Programmable nonvolatile RAM (NVRAM) memory that maintains its contents without power.
The Fibre Channel structure used to transmit data between ports. Consists of a start-of-frame delimiter,
header, optional headers, data payload, cyclic redundancy check (CRC), and end-of-frame delimiter.
There are two types of frames: link control frames (transmission acknowledgements and so forth) and
data frames.
Field-replaceable unit. A component that can be replaced onsite.
Fabric shortest path first. The Brocade routing protocol for Fibre Channel switches.
File Transfer Protocol.
Fx_Port
A fabric port that can operate as either an F_Port or FL_Port. See also F_Port, FL_Port.
gateway
Hardware that connects incompatible networks by providing translation for both hardware and
software. For example, an ATM gateway can be used to connect a Fibre Channel link to an ATM
connection.
G
GBIC
Gbit/sec
GUI
Gigabit interface converter. A removable serial transceiver module that allows gigabaud physical-level
transport for Fibre Channel and gigabit Ethernet.
Gigabits per second (1,062,500,000 bits/second).
A graphic user interface, such as Brocade Web Tools arbitrated-loop topology and Brocade Fabric
Manager.
H
HA
header
host
HTTP
Glossary-4
High availability. A set of features in Brocade SilkWorm switches that is designed to provide maximum
reliability and nondisruptive replacement of key hardware and software modules.
A Fibre Channel frame has a header and a payload. The header contains control and addressing
information associated with the frame.
A computer system that provides end users with services like computation and storage access.
Hypertext Transfer Protocol. The standard TCP/IP transfer protocol used on the World Wide Web.
Web Tools Administrator’s Guide
Publication Number: 53-0000522-09
I
initiator
Insistent
Domain ID
Mode
interswitch
link
IOD
IP
ISL
A server or workstation on a Fibre Channel network that initiates communications with storage devices.
See also target.
Sets the domain ID of a switch as insistent, so that it remains the same over reboots, power cycles,
failovers, and fabric reconfigurations. This mode is required to support FICON® traffic.
See ISL.
In-order delivery. A parameter that, when set, guarantees that frames are either delivered in order or
dropped.
Internet Protocol. The addressing part of TCP.
Interswitch link. A Fibre Channel link from the E_Port of one switch to the E_Port of another. See also
E_Port.
L
L_Port
LED
loop
initialization
LUN
Loop port. A node port (NL_Port) or fabric port (FL_Port) that has arbitrated-loop capabilities. An
L_Port can be in either Fabric Mode or Loop Mode.
Light-emitting diode. Used to indicate the status of elements on a switch.
The logical procedure used by an L_Port to discover its environment. Can be used to assign AL_PA
addresses, detect loop failure, or reset a node.
Logical unit number.
N
N_Port
Name Server
node
node name
NS
Node port. A port on a node that can connect to a Fibre Channel port or to another N_Port in a point-topoint connection.
Simple Name Server (SNS). A switch service that stores names, addresses, and attributes for up to 15
minutes and provides them as required to other devices in the fabric. SNS is defined by Fibre Channel
standards and exists at a well-known address. Also referred to as “directory service.”
A Fibre Channel device that contains an N_Port or NL_Port.
The unique identifier for a node, communicated during login and port discovery.
Name Server. The service provided by a fabric switch that stores names, addresses, and attributes
related to Fibre Channel objects. Can cache information for up to 15 minutes. Also known as “Simple
Name Server” or as a “directory service.” See also Simple Name Server (SNS).
Web Tools Administrator’s Guide
Publication Number: 53-0000522-09
Glossary-5
O
out-of-box
switch
A switch coming from the factory without any customized settings. Web Tools EZ determines that a
switch is an out-of-box switch if the passwords of all of the default accounts (root, factory, admin, and
user) are set to the default passwords.
P
path selection
Performance
Monitoring
PID
PLOGI
The selection of a transmission path through the fabric. Brocade switches use the FSPF protocol. See
also FSPF.
A Brocade SilkWorm switch feature that monitors port traffic and includes frame counters, SCSI read
monitors, SCSI write monitors, and other types of monitors.
Port identifier.
Port login. The port-to-port login process by which initiators establish sessions with targets.
port
In a Brocade SilkWorm switch environment, an SFP or GBIC receptacle on a switch to which an optic
cable for another device is attached.
port address
In Fibre Channel technology, the port address is defined in hexadecimal. In the Brocade Fabric OS, a
port address can be defined by a domain and port number combination or by area number. In an ESCON
Director, an address used to specify port connectivity parameters and to assign link addresses for
attached channels and control units.
port card
A hardware component that provides a platform for field-replaceable, hot swappable ports.
port group
A group of adjacent ports that share a common pool of frame buffers for long distance connections.
port name
A user-defined alphanumeric name for a port.
port swapping
POST
primary FCS
switch
principal
switch
Port swapping is the ability to redirect a failed port to another port. This feature is available in Fabric
OS v4.1.0 and higher.
Power-on self-test. A series of tests run by a switch after it is turned on.
Relates to the Brocade Secure Fabric OS feature. The primary fabric configuration server switch
actively manages security and configurations for all switches in the fabric. See also FCS switch.
The first switch to boot up in a fabric. Ensures unique domain IDs among roles.
private device
A device that supports arbitrated-loop protocol and can interpret 8-bit addresses but cannot log in to the
fabric.
protected
module
A Web Tools module to which you must log in if upfront login is disabled. Protected modules allow you
to modify the switch information. The Switch Admin and Zoning modules are protected modules.
Glossary-6
Web Tools Administrator’s Guide
Publication Number: 53-0000522-09
protocol
A defined method and set of standards for communication. Determines the type of error-checking, the
data-compression method, how sending devices indicate an end of message, and how receiving devices
indicate receipt of a message.
public loop
An arbitrated loop that includes a participating FL_Port and can contain both public and private
NL_Ports.
QuickLoop
A Brocade software product that allows multiple ports on a switch to create a logical loop. Devices
connected via QuickLoop appear to each other as if they are on the same arbitrated loop.
Q
R
R_A_TOV
Resource allocation timeout value. The maximum time a frame can be delayed in the fabric and still be
delivered. See also E_D_TOV.
route
As it applies to a fabric, the communication path between two switches. Might also apply to the specific
path taken by an individual frame, from source to destination. See also FSPF.
routing
The assignment of frames to specific switch ports, according to frame destination.
S
S_ID
Source ID. Refers to the native port address (24 bit address).
SAN
Storage area network. A network of systems and storage devices that communicate using Fibre Channel
protocols. See also fabric.
SCSI
Small Computer Systems Interface. A parallel bus architecture and a protocol for transmitting large data
blocks to a distance of 15 to 25 meters.
sectelnet
Secure Fabric
OS
security policy
sequence
server
session
SFP
A protocol similar to telnet but with encrypted passwords for increased security.
An optionally licensed Brocade feature that provides advanced, centralized security for a fabric.
Rules that determine how security is implemented in a fabric. Security policies can be customized
through Brocade Secure Fabric OS or Brocade Fabric Manager.
A group of related frames transmitted in the same direction between two N_Ports.
A computer that processes end-user applications or requests.
The connection between the Web Tools client and its managed switch.
Small-form-factor pluggable. A transceiver used on 2 GB/sec and 4 GB/sec switches that replaces the
GBIC.
Web Tools Administrator’s Guide
Publication Number: 53-0000522-09
Glossary-7
SilkWorm
Simple Name
Server (SNS)
SNMP
The brand name for the Brocade family of switches.
A switch service that stores names, addresses, and attributes for up to 15 minutes and provides them as
required to other devices in the fabric. SNS is defined by Fibre Channel standards and exists at a wellknown address. Also referred to as “directory service” or “name server.”
Simple Network Management Protocol. An Internet management protocol that uses either IP for
network-level functions and UDP for transport-level functions, or TCP/IP for both. Can be made
available over other protocols, such as UDP/IP, because it does not rely on the underlying
communication protocols. See also community (SNMP).
soft zone
A zone consisting of zone members that are made visible to each other through client service requests.
Typically, soft zones contain zone members that are visible to devices using Name Server exposure of
zone members. The fabric does not enforce a soft zone. Note that well-known addresses are implicitly
included in every zone.
SSH
Secure shell. Used starting in Brocade Fabric OS v4.1 to support encrypted telnet sessions to the switch.
SSH encrypts all messages, including the client sending the password at login.
switch
switch name
switch port
syslog
A fabric device providing bandwidth and high-speed routing of data via link-level addressing.
The arbitrary name assigned to a switch.
A port on a switch. Switch ports can be E_Ports, F_Ports, or FL_Ports.
Syslog daemon. Used to forward error messages.
T
T11
target
TCP/IP
telnet
throughput
Time Server
topology
A standards committee chartered with creating standards for Fibre Channel.
A storage device on a Fibre Channel network. See also initiator.
Transmission Control Protocol Internet Protocol.
A virtual terminal emulation used with TCP/IP. “Telnet” is sometimes used as a synonym for the
Brocade Fabric OS CLI.
The rate of data flow achieved within a cable, link, or system. Usually measured in bps (bits per second
or b/sec).
A Fibre Channel service that allows for the management of all timers.
As it applies to Fibre Channel technology, the configuration of the Fibre Channel network and the
resulting communication paths allowed. There are three possible topologies:
Point to point. A direct link between two communication ports.
Switched fabric. Multiple N_Ports linked to a switch by F_Ports.
Arbitrated loop. Multiple NL_Ports connected in a loop.
Glossary-8
Web Tools Administrator’s Guide
Publication Number: 53-0000522-09
trap (SNMP)
The message sent by an SNMP agent to inform the SNMP management station of a critical error. See
also SNMP.
trunking
In Fibre Channel technology, a feature that enables distribution of traffic over the combined bandwidth
of up to four ISLs between adjacent switches, while preserving in-order delivery.
trunking group
A set of up to four trunked ISLs for SilkWorm 200E, 3014, 3016, 3200, 3250, 3800, 3850, 3900, 12000,
24000, and 48000; up to eight for SilkWorm 4100.
U
upfront login
A login configuration setting for Web Tools. If upfront login is enabled, users log in only once, when
they launch Switch Explorer. If upfront login is disabled (default), users can launch Switch Explorer
without logging in, but must log in every time they launch a switch administration module.
W
watchdog
A software daemon that monitors Fabric OS modules on the kernel.
WWN
World Wide Name. An identifier that is unique worldwide. Each entity in a fabric has a separate WWN.
zone
A set of devices and hosts attached to the same fabric and configured as being in the same zone. Devices
and hosts within the same zone have access to others in the zone but are not visible to any outside the
zone.
Z
zone
configuration
A specified set of zones. Enabling a configuration enables all zones in that configuration. See also
enabled zone configuration, and effective zone configuration.
zone member
Defines a device. A zone member can belong to more than one zone at a time.A zone member can be
defined by either port-level zoning (domain,port: the physical port to which it is connected) or WWNlevel zoning (using WWW port or WWN node).
Web Tools Administrator’s Guide
Publication Number: 53-0000522-09
Glossary-9
Glossary-10
Web Tools Administrator’s Guide
Publication Number: 53-0000522-09
Index
Numerics
B
2 domain/4 domain fabric licenses
1-6
backing up configuration file
5-2
basic performance monitoring graphs
1-7
2-13
BB credit 4-8
Beacon button 4-28
beaconing, enabling 4-28
best practices for zoning 10-28
browser limitations 15-1
Basic User mode
A
basic zoning
accessibility matrix 10-21
accessing
Switch Admin module 4-3
switch event report 4-22
telnet window 4-3
Web Tools from Web Tools EZ 2-14
activating
CUP port connectivity configuration 12-9
licenses 4-17
Ports on Demand 4-15
adding
Fabric Assist zone members 10-13
performance graphs to a canvas 14-13
QuickLoop members 10-11
unzoned online devices to zones 10-26
WWN to zoning database 10-23
zone alias members 10-7
zone configuration members 10-16
zone members 10-9
AL_PA error graphs 14-11
AL_PA zoning
14-5, 14-6
10-6
alarm configuration report
browser refresh frequency, setting
browsers, supported
buffer-limited ports
alarms
configuring 13-5, 13-6
displaying 13-7
enabling and disabling 13-5
aliases, assigning to devices 2-13
aliases, zone. See zone aliases
arbitrated loop parameters, configuring 4-11
assigning a name to a port 4-14
automatic trace dump transfers 11-2
Web Tools Administrator’s Guide
Publication Number: 53-0000522-09
1-1
8-1
C
changing
chassis name 4-6
domain ID 4-6
passwords 2-12, 6-4
switch name 2-12, 4-6
switch time 2-12
chassis name, changing 4-6
class F traffic
13-7
1-2
4-9
clearing the zoning database 10-25
closing sessions
1-12
closing Zone Admin module
code page, displaying
10-5
12-4
configuration analysis report
configuration download
10-21
5-2
configuration file
backing up 5-2
restoring 5-2
saving 5-1
Index-1
configuring
arbitrated loop parameters 4-11
CUP port connectivity 12-6
email notifications 13-8
ethernet IP 4-4
fabric parameters 4-8
Fabric Watch thresholds 13-3
FAN frame notification parameters 4-11
FC IP address 4-4
FICON Management Server parameters 12-3
FRU alarms 13-6
in-order frame delivery 7-4
Internet Explorer 1-2
IP and netmask 4-4
link cost 7-4, 7-5
long-distance settings 8-3
port speed 4-13, 4-14
port type 4-13
ports 4-12
RADIUS server 6-8
routes 7-1
SNMP information 6-6
static routes 7-3
syslog IP address 4-5
system services 4-11
threshold alarms 13-5
virtual channel settings 4-10
connections, displaying 2-8
contacting technical support xix
Control Device state
12-5
Control Unit Port. See CUP
copying CUP port connectivity configuration
CP failover, initiating
4-20
CP, synchronizing services on
4-19
creating
AL_PA error graphs 14-11
basic performance graphs 14-5
CUP port connectivity configuration
Fabric Assist zones 10-13
QuickLoops 10-11
SCSI command graphs 14-10
SCSI vs. IP traffic graphs 14-10
SID-DID performance graphs 14-8
user accounts 6-2
zone aliases 10-7
zone configurations 10-15
zones 10-9
Index-2
12-10
12-8
CUP port connectivity configuration
activating 12-9
copying 12-10
creating 12-8
deleting 12-10
displaying 12-6
editing 12-8
customizing
basic performance graphs 14-6
chassis name 4-6
D
datafield size
4-8
defining device aliases 2-13,
10-27
deleting
CUP port connectivity configuration 12-10
Fabric Assist zones 10-14
QuickLoops 10-12
user accounts 6-3
WWN from zoning database 10-23
zone aliases 10-8
zone configurations 10-17
zones 10-10
device accessibility
displaying 2-11
editing 2-13
validating 2-13
device aliases, defining 2-13, 10-27
2-8
device information, displaying 2-9
device probing 4-9
device-based routing 7-1
device connections, displaying
disabling
automatic trace uploads 11-3
dynamic load sharing 7-3
FICON Management Server mode
ports 4-14, 4-15
RADIUS service 6-7
RLS probing 4-11
switch 4-5
telnet access 3-11
threshold alarms 13-5
trunking mode 9-2
upfront login 1-10
zone configurations 10-18
zoning 10-18
12-1
Web Tools Administrator’s Guide
Publication Number: 53-0000522-09
displaying
alarms 13-7
Control Device state 12-5
CUP port connectivity configuration
device accessibility 2-11
device connections 2-8
device information 2-9
enabled zone configuration 10-18
fabric events 4-21
fan status 11-4
FICON code page 12-4
Name Server entries 4-27
port information 2-5, 2-7, 11-10
power supply status 11-6
switch events 4-22
switch information 2-6, 4-6
temperature status 11-5
user accounts 6-2
DLS 7-3
12-6
domain ID, changing 4-6
events
displaying 4-21, 4-22
filtering 4-23
severity levels 4-21
Events button 4-22
exchange-based routing
7-1
extended fabrics 8-1
F
Fabric Assist zones 10-12
fabric events
4-21
fabric information, refreshing 10-4
fabric parameters, configuring 4-8
Fabric Toolbar
3-8
fabric topology report
Fabric Tree
4-26
3-7
downloading
configuration file 5-2
firmware 5-3
dynamic load sharing 7-3
Fabric Watch
about 13-1
thresholds 13-3
Fabric Watch module
E
FAN frame notification parameters, configuring
E_D_TOV
13-3
failover, initiating 4-20
Fan button 11-10
4-8
email notifications 13-8
enabled zone configuration, displaying
4-11
2-5, 2-7, 11-4, 11-5
fast boot 4-7
feature licenses 4-16
Fibre Channel Association xviii
fan status
10-18
enabling
automatic trace dump transfer 11-3
beaconing 4-28
dynamic load sharing 7-3
FICON Management Server mode 12-1
insistent domain ID mode 4-10
ports 4-15
Ports on Demand 4-15
RADIUS service 6-7
RLS probing 4-11
switch 4-5
threshold alarms 13-5
trunking mode 9-2
upfront login 1-10
zone configurations 10-18
ending sessions 1-12
FICON Management Server mode, enabling and disabling
12-1
FICON Management Server parameters 12-3
filtering events
4-23
firmware configuration, backing up
firmware, downloading
5-2
5-3
fixed zoning, assigning 2-14
FRU alarms, configuring
13-6
FSPF routing 7-2
G
getting help
xix
graphs for performance monitoring 14-2
Web Tools Administrator’s Guide
Publication Number: 53-0000522-09
Index-3
H
launching
Fabric Watch module 13-3
Hi Avail module 4-18
Performance Monitor module
Switch Admin module 4-3
telnet window 4-3
Zone Admin module 10-3
launching Web Tools 1-7
10-1, 10-6
hardware, supported 1-6
help xix
Hi Avail module 4-18
high availability 4-18
HTTP_POLICY 3-11
HTTPS protocol 1-7
hard zones
LEDs
2-5
LEDs, port 11-8
license ID, displaying
license key
I
4-20
in-order delivery of frames 7-4
insistent domain ID mode
about 4-9
enabling 4-10
installing
Java Plug-in 1-3, 1-4
JRE 1-3
JRE patches on Solaris 1-4
Solaris patches 1-4
Web Tools license 1-4
IOD 7-4
IP and netmask, configuring
4-4
ISL trunking 9-1
J
Java Plug-in, installing
1-3, 1-4
1-2
Java Plug-ins, supported
JRE, installing 1-3
L
Index-4
1-4
licensed features
initiator/target accessibility matrix
languages supported
4-6
licenseAdd command 1-4
ID_ID mode
about 4-9
enabling 4-10
inactivity timeout 1-13
initiating CP failover
14-5
1-6
10-21
4-16
licenses
activating 4-17
installing Web Tools 1-4
removing 4-18
licenseShow command 1-4
limitations
15-1
limited switch license 1-6
link cost 7-4
1-6
logging out 1-12, 2-14
login options 1-10
localization support
long-distance connection, configuring
8-3
M
6-7
message severity levels 4-21
mixed zoning 10-6
managing RADIUS server
modifying
Fabric Assist zones 10-13
performance graphs 14-14
QuickLoops 10-11
RADIUS server 6-8
RADIUS server order 6-9
zone aliases 10-7
zone configurations 10-16
zones 10-9
monitoring performance 14-1
Mozilla limitations
15-6
Web Tools Administrator’s Guide
Publication Number: 53-0000522-09
N
power supply status
Name Server entries, displaying
4-27
printing
effective zone configuration 10-19
fabric topology report 4-26
performance graphs 14-13
switch report 4-7
zone configuration summary 10-20
naming ports 4-14
netmask and IP, configuring
4-4
O
opening modules, secure mode
3-11
Q
QuickLoops
P
passwords, changing
2-12, 6-4
R_A_TOV
4-9
persistent disable a port 4-14
per-frame routing priority
physically locating switch using beaconing
4-28
4-8
4-8
RADIUS server
about 6-7
configuring 6-8
modifying 6-8
modifying server order 6-9
removing 6-9
RADIUS service, enabling and disabling 6-7
1-2
rebooting the switch 4-7
recommendations 3-12
RAM requirements
platforms, supported
1-2
platform-specific limitations 15-5
polling rates
10-10
R
performance graphs
adding to a canvas 14-13
modifying 14-14
printing 14-13
types of 14-2
Performance Monitor module 14-5
PID format
2-5, 2-7, 11-6, 11-7
3-11
primary FCS functionality
3-7
10-28
1-2
recommendations for zoning
port information, displaying 2-5,
2-7, 11-10
refresh frequency, setting
3-7
port names, assigning 4-14
refresh rates
port speed 4-14, 8-1
refreshing
fabric information 10-4
Switch Admin module 4-3
Zone Admin module 10-4
removing
Fabric Assist zone members 10-13
licenses 4-18
offline devices from zoning database
QuickLoop members 10-11
RADIUS server 6-9
zone alias members 10-7
zone configuration members 10-16
zone members 10-9
port speed, configuring
port swapping
4-29
port type, configuring
port zoning
4-13
4-13
10-6
port-based routing
7-1
ports
buffer-limited 8-1
configuring 4-12
disabling 4-14, 4-15
enabling 4-15
LEDs 2-5, 11-8
long distance parameter 8-3
naming 4-14
Ports on Demand, enabling 4-15
Web Tools Administrator’s Guide
Publication Number: 53-0000522-09
10-26
Index-5
renaming
device aliases 2-13
Fabric Assist zones 10-14
QuickLoops 10-12
zone aliases 10-8
zone configurations 10-17
zones 10-10
replacing
offline devices in zones 10-27
WWN in zoning database 10-24
requirements
switch 1-6
Web Tools 1-1
requirements for launching Web Tools
restoring configuration file
starting Web Tools
static routes, configuring
7-3
11-6
Status Legend 3-9
Status button
support, contacting technical xix
1-6
supported switches 1-6
swapping port area IDs 4-29
supported languages
1-1
5-2
RLS probing
enabling and disabling 4-11
role-based access control 1-11
routes
configuring 7-1
static routes 7-3
switch
changing the name of 4-6
enabling and disabling 4-5
rebooting 4-7
Switch Admin module 4-1
launching 4-3
refreshing 4-3
switch events, displaying 4-22
Switch Explorer 3-1
Switch Information View
3-9
2-6, 4-6
switch name, changing 2-12, 4-6
switch PID format 4-8
switch report 4-7
switch requirements 1-6
switch setup wizard 1-8
switch setup wizard, launching 2-12
switch status report 11-7
switch time, changing 2-12
Switch View 3-8
Switch View button menu 3-9
synchronizing services on the CP 4-19
switch information, displaying
S
saving
performance graphs 14-12
zoning changes 10-5
SCSI command graph 14-10
SCSI vs. IP traffic graph
1-7
14-10
searching zone member selection lists 10-24
3-11
security banner 1-10
secure mode
10-6
sequence level switching 4-9
session management 1-12
sessions, ending 1-12
selecting a zoning view
setting
refresh frequency 1-2
SNMP trap levels 6-5
severity levels 4-21
syslog IP address
configuring 4-5
removing 4-5
system services, configuring
T
technical support
xix
SID-DID performance graph 14-8
telnet access disabled 3-11
SNMP information, configuring 6-6
telnet window, launching
SNMP trap levels 6-5
soft zones
10-1, 10-6
Solaris patches, installing
Index-6
4-11
4-3
telnet, install Web Tools 1-4
temperature status 2-5, 2-7, 11-5
1-4
Web Tools Administrator’s Guide
Publication Number: 53-0000522-09
threshold alarms
configuring 13-5
enabling and disabling
time, changing 2-12
Z
13-5
zone access map, displaying
1-13
topology report 4-26
trace dumps 11-1
troubleshooting 3-12
timeout, session
trunk groups, viewing
9-2
trunking mode, enabling and disabling 9-2
U
upfront login 1-10
uploading trace dumps 11-3
user accounts, managing
6-1
2-11
Zone Admin module
about 10-2
closing 10-5
launching 10-3
refreshing 10-4
saving changes 10-5
zone aliases
adding unzoned online devices 10-26
creating 10-7
defining device aliases 10-27
deleting 10-8
description 10-6
modifying 10-7
renaming 10-8
replacing offline devices 10-27
zone configuration analysis report 10-21
zone configuration summary report
V
validating device accessibility
value line licenses
2-13
1-6
VC Priority 4-10
viewing
swapped ports 4-29
switch report 4-7
switch status 11-6
switches in the fabric 3-10
trunk groups 9-2
virtual channel settings, configuring
4-10
W
Web Tools EZ
about 2-1
launching 1-9
Web Tools EZ switch setup wizard 1-8
Web Tools, launching
1-7
WWN
adding to zones 10-23
removing from zones 10-23
replacing in zones 10-24
WWN zoning 10-6
Web Tools Administrator’s Guide
Publication Number: 53-0000522-09
10-20
zone configurations
creating 10-15
deleting 10-17
disabling 10-18
enabling 10-18
example 10-15
modifying 10-16
renaming 10-17
zone member selection lists, searching
10-24
zones
adding unzoned online devices 10-26
adding WWNs 10-23
creating 10-9
deleting 10-10
description 10-8
modifying 10-9
removing WWNs 10-23
renaming 10-10
replacing offline devices 10-27
replacing WWNs 10-24
zoning
about 10-1
basic 2-13
best practices 10-28
fixed 2-14
Index-7
zoning database
clearing 10-25
managing 10-22
maximum size 10-5, 10-18
removing offline devices 10-26
zoning views 10-6
zoning, disabling 10-18
zoning, saving changes
Index-8
10-5
Web Tools Administrator’s Guide
Publication Number: 53-0000522-09