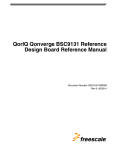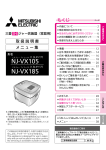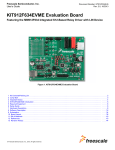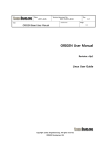
1
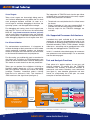
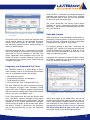
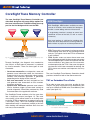
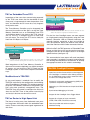
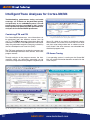
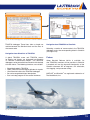
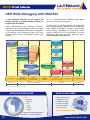
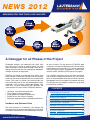
NEWS 2012
DEBUGGER, REAL-TIME TRACE, LOGIC ANALYZER
A Debugger for all Phases of the Project
Embedded designs are becoming ever more complex and time to market is getting shorter. To meet
these challenges many project managers now rely on
debug and trace tools that can accompany developers
through all phases of the project.
for over 20 years. The key feature of TRACE32 logic
analyzers is seamless integration within the hardwarebased debug and trace tools. For a typical application
using the logic analyzer integrated in PowerTrace II
read the article “Checking JTAG Signals” on page 6.
TRACE32, the debug and trace tool family from Lauterbach provides a consistent concept and environment
which can be further extended with user customizable
scripts. This helps to shorten the familiarization process and makes time for the actual development work.
Developers with practical knowledge gained from
more than 10 years experience with TRACE32 are
quite common. So, what makes TRACE32 different?
Fast, efficient computers mean that more simulation
and validation is being undertaken on PC and workstations. In the embedded world the pre-silicon software
development on virtual targets has become the norm.
For this phase of the project Lauterbach can provide
pure software solutions.
•
•
•
•
•
Hardware- and software-based tools
Early support for new processors
Large portfolio of supported processors
Extensive test and analysis functions
Seamless integration into the embedded tool chain
Hardware and Software Tools
The core business of Lauterbach is the design and
manufacture of hardware-based debug and trace tools.
In addition Lauterbach has also offered logic analyzers
www.lauterbach.com
CONTENTS
New Supported Processors
4
Nexus-Trace for Small Package Format Cores 5
Checking JTAG Signals
6
Enhancements to Target OS-Awareness
6
Code-Coverage – Simplified
7
CoreSight Trace Memory Controller
10
Trace Analyses for Cortex-M3/M4
12
Simulink Integration
14
UEFI BIOS Debugging with TRACE32
16
®
Virtual Targets
Today virtual targets are increasingly being used to
start software development long before the first hardware prototypes become available. As soon as a
virtual target is available, debugging of the driver, the
operating system, and the application can begin.
For debugging and tracing, most virtual targets have
their own API. If this is not the case, the standardized
MCD-API (http://www.lauterbach.com/mcd_api.html)
can be used. Many new projects today use multicore
chips. Consequently, Lauterbach has expanded its multicore debugging support for virtual targets since 2011.
The integration of TRACE32 tools into the pre-silicon
validation forms an important part of the early support
for the latest processors and SoCs:
• Tested tools are ready before the first silicon leaves
the factory.
• Expert knowledge of the new processor/SoC is
available and can be accessed by the customer.
• Start-up scripts for the TRACE32 debugger are
available.
60+ Supported Processor Architectures
Lauterbach has tools available for all the common
processors or SoCs on the embedded market. In fact
Lauterbach is the only provider of tools for many cores.
Standard controllers, DSPs, FPGA softcores, configurable cores - everything can be combined into a multicore chip and debugged with a TRACE32 tool.
Pre-Silicon Validation
For semiconductor manufacturers, it is important to
validate the design of their processors or SoCs before
actual production. Individual sections are intensely
tested, for example: the JTAG interface, the entire core,
or the interaction between core and peripherals.
For this testing, you traditionally used an emulator for
the silicon (e.g. Palladium) or FPGA prototypes, connected to the hardware-based TRACE32 debug tools.
This would run much slower than the real processors.
In 2011, Lauterbach also added support for numerous
new processors and multicore chips. For an overview,
see the table on page 4.
Test and Analysis Functions
Each phase of a project requires its own test and
analysis functions. To provide this, the TRACE32
PowerView GUI includes an extensive selection of
commands and menus. Boundary scan commands
(see figure 2), core detection commands and commands for manipulating the JTAG pins are some
examples of low-level commands.
Today, you can perform first validations of Verilog or
SystemC models directly on a PC or a workstation.
With pure software validation you cannot use debug
hardware. Therefore, Lauterbach added a Verilog
Back-End to its software in 2011. This simulates a
JTAG interface at the signal level (see figure 1).
TRACE32 Front-End for ARM
Verilog Simulator for Cortex-A
TRACE32
Actuator
(shared library)
.DLL /.SO
TRACE32
Verilog Back-End
for Cortex-A/-R
Named
pipe
Verilog
Procedural
Interface
TRACE32
Actuator
.V
Trigger
Run-time
counter
JTAG
Reset
Verilog model
Fig. 1: For each user entry in TRACE32 Front-End, Verilog Back-End produces JTAG signals for validation of the model.
2
NEWS 2012
Cortex-A
.V
www.lauterbach.com
JTAG TAP
.V
.V
.V
Scan chain configuration
Since July 2011, Lauterbach has included the option of
exporting trace information in Prism format, enabling
the CriticalBlue tools to work with the trace recorded
by the actual operation of the code.
The article “Simulation and Reality Come Closer
Together” on page 14 thoroughly describes another
innovation – the integration between MATLAB Simulink® and TRACE32.
Fig. 2: Boundary-Scan commands are available for commissioning
the hardware.
During the quality and test phase the high-level commands provide support for the developer and these
typically deal with analysis of trace data. Examples
are: measuring function runtime, energy profiling, or
details of code-coverage.
Since the beginning of 2011, Lauterbach has enabled
most major processor architectures to stream the trace
information to the host computer in real-time. This
allows significantly more diagnostic data to be collected and quality assurance becomes much easier.
For more information, see the article “Code-Coverage
– Simplified” on page 7.
Integration into Embedded Tool Chain
Extended Lifetime
When migrating to a new technology Lauterbach has a
philosophy of ensuring there is a long transition phase.
They will not force a customer to accept a technology
change while in the middle of a key project.
For example: Starting in May 2012, Lauterbach will
introduce a QT version of its graphical user interface
TRACE32 PowerView (see figure 3). With QT, an upto-date GUI will be available for Linux, Mac OS X, and
other host operating systems.
Lauterbach will continue to support the Motif version
of TRACE32 PowerView so that customers can determine their own best transition time.
QT-based PowerView
The TRACE32 software is an open design so that it
works smoothly with all of the common basic components of an embedded design. This includes:
•
•
•
•
Host operating systems
Programming languages and compilers
Target operating systems
Virtual machines, such as Android VM Dalvik
The open TRACE32 API allows seamless interaction
with numerous third-party tools. Examples include
special IDEs such as Eclipse, graphical programming
tools and external profiling tools. Several new developments in this area were added in 2011.
Fig. 3: The new QT-based GUI for Linux, Mac OS X and other operating
systems.
Prism, the parallelization tool from the Scottish company CriticalBlue, supports developers when migrating single-core code to run on multicore chips. The tool
enables you to try different parallelization strategies
without making changes to the function code. When
the optimal strategy is determined, the parallelization can be performed step by step, also supported
by Prism.
Within these pages of our NEWS 2012, you will find
further information which might be useful for your current or future projects. Hopefully you will find a feature
that contributes to your project’s success. We will be
demonstrating several of them live at the upcoming
ESC Silicon Valley, March 26-29th, in San Jose, and at
many other shows in the US throughout the year.
3
New Supported Processors
New Derivatives
Altera
4
Cortex-A / -R
• FPGA with Cortex-A9 MPCore
as Hardcore
MIPS32
• MP32
AppliedMicro
PPC44x
• 86290 / 491 / 791 Q2/2012
ARM
Cortex-A / -R
• Cortex-A7/Cortex-A7 MPCore
• Cortex-A15
• Cortex-A15 MPCore
• Cortex-R5/Cortex-R5 MPCore
• Cortex-R7/Cortex-R7 MPCore
Beyond
Semiconductor
Beyond
• BA22
Broadcom
MIPS32
• BCM35230
• BCM63168, BCM63268 • BCM7231, BCM7358
Fujitsu
Cortex-A / -R
• MB9DF126, MB9EF126
IBM
PPC44x
• 476FP Q2/2012
Ikanos
MIPS32
• Fusiv Vx185
Infineon
TriCore
• TriCore Multi-Core
Architecture
Intel®
Atom™/x86
• Atom D2500, Atom N550
• Core i3/i5/i7 2nd Generation
Lantiq
MIPS32
• XWAY xRX100
• XWAY xRX200
LSI
PPC44x
• ACP344x Q2/2012
Marvell
ARM9 Debug-Cabel
• 88E7251
ARM11 Debug-Cabel
• 88AP610-V6, MV78460-V6
Cortex-A / -R Debug-Cabel
• 88AP610-V7, MV78460-V7
Cavium
MIPS64
• CN61XX / CN62XX / CN66XX
• CN67XX / CN68XX
Ceva
CEVA-X
• CEVA-XC
Nuvoton
Cortex-M
• NuMicro
CSR
ARM11
• QUATRO 4500
NXP
Cypress
ARM9
• EZ-USB FX3
Cortex-M
• LPC12xx
Beyond
• JN5148
Energy Micro
Cortex-M
• Giant Gecko
Qualcomm
Freescale
MCS12X
• MC9S12VR, MC9S12XS
• MM912F634
Cortex-A / -R
• i.MX 6 Series
MPC55xx/56xx
• MPC5604E, MPC5675K,
• MPC5676R
Power QUICC III
• P1010, P1020
• P2040, P2041
• P3041, P4040, P4080
• PSC9131
QorIQ 64-Bit
• P5010, P5020
MIPS32
• AR7242
Cortex-A / -R
• Krait
Renesas
V850
• V850E2/Fx4: 70F3548..66
70F4000..70F4011
• V850E2/Fx4-L: 70F3570..89
• V850E2/Px4: 70F3503 / 05
70F3507 / 08 / 09
78K0R / RL78
• 78K0R/Kx3-C/L
• RL78/G14, RL78/G1A
• RL78/F12, RL78/I1A
SH
• SH708x with
AUD/Onchip-Trace
• SH7147
NEWS 2012
www.lauterbach.com
New Derivatives
Samsung
ARM7
• S3F4
Cortex-A / -R
• S5PV310
Cortex-M
• S3FM, S3FN
ST-Ericsson
Cortex-A / -R
• A9500, A9540, M7400
MMDSP
• A9500, A9540
STMicroelectronics
MPC55xx/56xx
• SPC56A80, SPC56HK
Cortex-M
• STM32F2xx, STM32F4xx
Synopsys
ARC
• ARC EM4, ARC EM6
Tensilica
Xtensa
• BSP3, LX4, SSP16
Texas Instruments
MSP430
• CC430Fxxx, MSP430FR5xxx
• MSP430x1xx..MSP430x6xx
Texas Instruments
(Cont.)
ARM9
• AM38xx
• OMAP4460 / 4470
• TMS320C6A81xx
• TMS320DM81xx
Cortex-A / -R
• AM335x, AM38xx
• OMAP4460 / 4470 / 543x
• RM48L950
• TMS320C6A81xx
• TMS320DM81xx
• TMS570LS3xxx
Cortex-M
• AM335x
• OMAP4460 / 4470 / 543x
• TMS470MFxxx
TMS320C28X
• TMS320C28346 / F28069
TMS320C6x00
• OMAP4460 / 4470 / 543x
• TMS320C6A81xx
• TMS320DM81xx
• TMS320TCI6616 / 18
Xilinx
Cortex-A / -R
• Zynq7000
Nexus-Trace Also for Small Package Format Cores
The Nexus cell, which is integrated into the controllers of the MPC560xB/C family from Freescale or the
SPC560B/C controllers of ST, can generate trace data
for the instructions executed by the core. If an operating system is used, information on task switching are
produced as well.
A microcontroller must have a trace interface, so
that an external trace tool, such as TRACE32, can
record this trace data. However, the members of the
MPC560xB/C family do not have this interface in their
standard packaging. To provide access to this valuable data about the program run during the development phase, silicon-compatible microcontrollers in a
208-pin BGA development package are offered, which
have a Nexus interface with 4 MDO (Message Data
Out) pins.
Since
mid-2011,
Lauterbach
has
provided
MPC560xB/C adapters that can replace the original
controller on the target hardware with a 208-pin controller with Nexus interface.
The MPC560xB/C adapter consists of a suitable
MPC560xB/C controller in 208-pin BGA development
package and Mictor plug with Nexus interface for connecting TRACE32 trace tools (shown in figure 4 in
blue). In addition, a socket adapter from the Tokyo
Eletech company is required.
Nexus connector
MPC560xB/C in 208-pin package
Tokyo Eletech adapter
Tokyo Eletech socket
Fig. 4: The MPC560xB/C adapter allows a development package with
Nexus interface to be used instead of the original controller.
5
Checking JTAG Signals
Lauterbach’s PowerTrace II is equipped with an integrated logic analyzer and supplied with a standard
digital probe. This enables 17 digital channels to be
recorded with a sampling rate of up to 200 MHz. This
logic analyzer has a save depth of up to 1024K samples and an example of its use would be the test of
the JTAG signals during pre-silicon validation (see figures 6 and 7).
JTAG signals
Fig. 6: The recorded JTAG signals.
JTAG protocol
Fig. 5: Measuring arrangement for recording the JTAG signals.
Fig. 7: The protocol representation of the JTAG signals.
Enhancements to Target OS-Awareness
The following version adaptations have been made:
• eCos 3.0
• Linux v3.0
• SMX v4
• embOS 3.80
• MQX 3.6
• FreeRTOS v7
• RTEMS 4.10
• The content of the QNX tracelogger can be dis-
New Supported Target-OS
6
played using TRACE32 QNX OS-Awareness. A
graphical representation of the task switch is also
possible using the TRACE32 command group
LOGGER.Chart.
• TRACE32 QNX OS-Awareness has been adapted
for the use of position-independent executables.
OSEK/ORTI SMP
planned
µC/OS-II for Andes
available
PikeOS
available
Elektrobit tresos (OSEK/ORTI)
available
PXROS-HR Run Mode Debugging
available
Erika (OSEK/ORTI)
available
RTEMS for Nios II
available
FreeRTOS für AVR32
available
Sciopta 2.x
available
Linux for Beyond
planned
SYS/BIOS for ARM
available
MQX for ARC
available
VxWorks SMP
available
NEWS 2012
www.lauterbach.com
Code-Coverage – Simplified
As of March 2011, TRACE32 trace information can
be streamed to a host hard-disk from the running
target. The large amount of program flow data
which can result from this method, leads to a significant simplification of the code-coverage.
Trace-based Code-Coverage
Proof of statement coverage and condition coverage is
often required to meet system quality specifications in
industries such as medical and automotive.
• Statement coverage proves that each line of code
was executed during the system test.
• Condition coverage proves that for each conditional instruction both pass and fail branches were
executed at least once.
For many embedded systems highly optimized code
must be tested in real-time. The alternatives of code
instrumentation and non-real-time operation cannot
be used in these cases.
To be able to meet these requirements, the target processor/SoC must fulfill the following prerequisites:
1.The cores which are implemented must have a core
trace logic (see figure 8). This logic generates information about the instructions executed by the core.
Depending on the operation of the trace logic, information about the task switches and the read/write
operations can also appear.
2.The processor/SoC must have a trace port with sufficient bandwidth so that the trace information can
be recorded by an external tool without any information loss.
The Classic Measurement Process
Until now, code-coverage analysis was performed with
TRACE32 using the following steps:
1.Start program execution and automatically stop
when the trace memory is full.
2.Transfer the trace memory content to the codecoverage database.
3.Continue program execution.
For each measurement step, the amount of data collected was limited by the size of the memory available
within the trace tool. The results of the code-coverageanalysis could be checked after the total measurement
was completed or, if needed, after each intermediate
step.
New: Streaming
If the trace data is transferred to a drive on the host
computer at the time of recording, the complete software routine can be recorded in one measurement
step. The streamed data is stored within a file on the
hard-disk. To avoid completely filling the hard-disk with
trace data, TRACE32 stops streaming as soon as less
than 1 GByte of free memory remains.
To be able to stream, the following technical prerequisites must be fulfilled:
• 64-bit host computer and 64-bit TRACE32 executable
• Interface between trace tool and host computer
must be as fast as possible.
• Optimal configuration of the trace source and the
trace tool
64-bit host
TRACE32 PowerView
JTAG
SoC
Core
Core
trace
logic
Trace port
Trace
control
logic
Trace memory
as FIFO
File on
hard-disk
Fig. 8: For the code-coverage analysis, up to 1 TByte of trace data can be streamed to the host computer.
7
Fast Host Interface
PowerTrace vs. PowerTrace II
The amount of trace data that is exported via the trace
port depends on the target system hardware. The
number of cores, the number of trace port pins, and
the trace clock speed are all important parameters.
The protocol used by the core trace logic plays also an
important role. For example, the ARM PTM protocol
is more compact than the ARM ETMv3 protocol (see
figure 9).
The embedded software is another major variable. A
software program that performs many jumps and
retrieves data/instructions mainly from the cache produces more trace data per second than a software
program that processes many sequential instructions
and must frequently wait for the availability of data/
instructions.
The amount of data varies but it is always large. Streaming only works properly, if the transfer rate between the
tool and the host computer is fast enough to transfer
all of the data from the trace port to the host computer
without any data loss. The 1 GBit Ethernet interface is
the only recommended interface for the PowerTrace II.
TRACE32 trace tools are available in two designs,
which differ especially in relation to their features.
PowerTrace
•
•
•
•
•
256 or 512 MByte trace memory
USB 2.x and 100 MBit Ethernet
80 MBit/s as maximum transfer rate to host computer
Software compression of trace data (factor 3)
Memory interface with 100 MHz
PowerTrace II
•
•
•
•
•
1/2/4 GByte trace memory
USB 2.x and 1 GBit Ethernet
500 MBit/s as maximum transfer rate to host computer
Hardware compression of trace data for ETMv3 and PTM (factor 6)
Memory interface with 233 MHz
The programming of the trace logic on the chip can
be used to directly influence the amount of trace data
being generated. The logic should be programmed so
that only trace information which is relevant to the codecoverage analysis is being generated. To illustrate this
point, the following two examples are provided.
The ETM can be configured so that trace information
is produced only for the instructions executed by the
program. Information about the read/write operations
is not needed for code-coverage. By default the PTM
only generates information about the program flow.
Therefore the PTM does not need to be configured.
ETM/PTM: Optimal Configuration
Both trace sources encode the virtual address instructions. If an embedded design uses an operating system, such as Linux or Embedded Windows, virtual addresses cannot be mapped unambiguously to physical
ETM and PTM are different implementations of the
core trace logic on the ARM/Cortex architectures.
3.2 GBit/s max. transmission rate
Cortex-R4
@ 500MHz
ETMv3
Average load
Maximum load
Cortex-A9
@ 1GHz
PTM
4 x Cortex-A9
@ 1GHz
PTM
0
2
4
6
8
Fig. 9: A transmission rate of 3.2 GB/s is generally adequate for streaming program sequence information on the host.
8
NEWS 2012
www.lauterbach.com
10 GBit/s
addresses. The trace source must also be configured,
so that information is generated defining the virtual
address space in which an instruction was located.
For the ARM ETM/PTM, the amount of trace data can
be further reduced:
• The code-coverage analysis does not analyze or
need time information. We therefore recommend
configuring the TRACE32 trace tool so that the trace
data is transferred to the host without time stamps.
This reduces the amount of data by a third.
program sequence on the individual core(s). If Branch
History Messaging is used this can make the trace
data very compact. Compared to standard trace data
a reduction by a factor of 10 is realistic. Only PowerTrace II supports streaming from the Nexus trace port.
Streaming also works for all other processors/SoCs
that are supported by TRACE32 and have a trace
port.
Code-Coverage for SMP-Systems
• PowerTrace II also provides FPGA-based hardware
compression of the trace data. This enables up to
3.2 GBit/s trace data to be transferred to the host
computer. Figure 9 shows that this transfer rate is
generally sufficient for streaming ETM/PTM data
without any data loss.
TRACE32 also supports code-coverage analysis on
SMP (symmetric multiprocessing) systems. For codecoverage it must be proven that an instruction was
executed, which core was responsible for running the
code is irrelevant. Figure 10 shows the results of codecoverage for two Cortex-A9 MPCores.
Nexus: Optimal Configuration
For statement and condition coverage, if only the failbranch of a conditional statement was run the statement is highlighted in yellow and marked with “not
exec”. The detailed coverage lists the specifics of how
often each statement or each branch of the statement
was run.
On processors of the MPC5xxx/SPC5xx families the
core trace logic is implemented to the Nexus standard.
To undertake code-coverage analysis, a Nexus class 2
trace cell is adequate as all you need is detail of the
Function coverage
Statement & condition coverage
Detailed coverage
Fig. 10: Code-coverage analysis for an SMP system.
9
CoreSight Trace Memory Controller
The new CoreSight Trace Memory Controller provides SoC designers with more design options for
the trace infrastructure. TRACE32 already has support for the first designs which use the TMC.
Core
trace
Bus
trace
System
trace
Trace bus (ATB)
ETB
Fig. 11: CoreSight Funnel combines all trace data produced by trace
macrocells into a single data stream.
Through CoreSight, the diagnosis data needed for
the analysis of SoC-internal processes is produced
by ‘trace macrocells’. There are three types of trace
macrocells:
• Core trace macrocells are assigned to a core and
generate trace information about the instructions
processed by that core. Information about process
switches and load/store operations is generated
depending on the design of the trace cell.
• Bus trace macrocells are firmly assigned to a bus
and generate trace information on data transfers
that occur on the bus.
• System trace macrocells generate trace information for hardware trigger (system event tracing) or
provide diagnostic information produced by code
instrumentation of the application software.
The CoreSight Funnel combines all of the trace data
into a single data stream (see figure 11). This trace
data stream is then either stored in an on-chip memory buffer (ETB) or exported to an external tool using
a trace port (TPIU). The IP for CoreSight trace being
implemented today is sometimes pushed to the limit
when dealing with complex multicore SoCs that contain many trace macrocells.
10
With CoreSight, ARM makes available an extensive set of IP blocks, which enables SoC designers
to build a custom debug and trace infrastructure.
A single debug interface is enough to control and
coordinate all cores of the SoC, as well as access
all memory.
One trace interface is sufficient for providing diagnostic data about the processes occurring within the
SoCs without any impact on real-time performance.
Funnel
TPIU
ARM CoreSight
NEWS 2012
• ETB: The on-chip trace memory is often too small to
record enough trace data for any meaningful future
analysis. The typical size for the ETB is still between
4 and 16 KByte.
• TPIU: System states may occur where more trace
data is being generated than the trace port can output.
The CoreSight design is such that trace data from the
trace macrocells is only taken over if the trace data
can be exported by the TPIU. If the trace data generated remains in the trace macrocells for too long, the
FIFOs there can overflow and important data may
be lost.
The new CoreSight Trace Memory Controller should
provide a solution for both of the above scenarios.
TMC as Embedded Trace Buffer
To be able to store more trace data on-chip for later
analysis, the chip manufacturer can theoretically connect up to 4 GByte of SRAM to the Trace Memory Controller (see figure 12).
Trace bus (ATB)
Trace Memory Controller
in ETB mode
SRAM
Fig. 12: In ETB mode, the Trace Memory Controller can make up to 4 GByte
of on-chip trace memory available.
www.lauterbach.com
TMC as Embedded Trace FIFO
Trace bus (ATB)
Inspections of the trace data streams being exported
by the TPIU have shown that the bandwidth of most
trace ports is large enough for normal operation. Overload, and therefore loss of trace data, only happens
when peaks occur.
The Trace Memory Controller can be integrated into
the trace infrastructure of the SoCs, so that the Trace
Memory Controller acts as an Embedded Trace FIFO
and cushions peaks in the load on the TPIU (see figure 13). This ETF is designed so that no trace data
loss can occur. The size of the ETF can be freely defined from 512 Bytes to 4 GBytes.
Trace bus (ATB)
Trace Memory Controller
in FIFO mode
SRAM
Trace Memory Controller
in Router mode
SRAM
AXI
High-speed link
(USB, Ethernet, ...)
Fig. 14: In Router mode, the Trace Memory Controller forwards the trace
data for the export to a high-speed standard interface.
For the first time CoreSight traces can now connect
to a high-speed standard interface by using the Trace
Memory Controller. USB or Ethernet interfaces are
common favorites, especially as they are available in
many end products. Ideally, the external trace tool will
share the interface with the other connected devices.
Within the SoC, the TMC operates as Embedded Trace
Router and has the task of passing on the trace data
through the AXI bus for the export to the IP of the highspeed interface (see figure 14).
TPIU
Fig. 13: In FIFO mode, the Trace Memory Controller can cushion load
peaks on the TPIU. By doing this, trace data loss can be avoided.
Both integrations of the Trace Memory Controller in
the trace infrastructure depicted are simple examples.
Of course, you can build the TMC IP block into the
CoreSight system in much more complex and flexible
ways.
Modifications in TRACE32
This new method of trace export will need completely
new trace tools. Lauterbach is currently in close contact
with leading semiconductor manufacturers to develop
the appropriate tools for this switch in technology.
TRACE32 CoreSight Features
• Open for use with all cores which can be integrated
into CoreSight; Lauterbach offers debug solutions
for all ARM/Cortex cores and for numerous DSPs,
as well as for configurable cores.
As you would expect, Lauterbach has to modify the
TRACE32 software for the configuration and handling
of the Trace Memory Controller. This applies especially
when the Trace Memory Controller is integrated in the
SoC using new, previously unsupported ways. The
TRACE32 user only needs to configure the basic address for the TMC. Then all the proven trace display
and analysis features can be used as usual.
• Support for asymmetric multiprocessing (AMP) and
symmetric multiprocessing (SMP)
TMC as Router to High-Speed Link
• Support for all types of trace macrocells
(ETM, PTM, HTM, ITM, STM, and more)
The idea of moving away from dedicated trace ports
has long been discussed within the embedded community. There are certainly several good arguments for
this move.
• Debugging via JTAG interface and 2-pin Serial Wire
Debug
• Synchronized debugging of all cores
• Support for the CoreSight Cross Trigger Matrix
• Tools for parallel and serial trace ports
• Multicore tracing
11
Intelligent Trace Analyses for Cortex-M3/M4
Troubleshooting, performance tuning and codecoverage - all of these can be performed quickly
and precisely on an embedded system if the adequate trace analysis is provided. In 2011, Lauterbach explored new paths to enable optimized trace
analyses for the Cortex-M3/M4 processors.
Instruction flow with data accesses (ETM&ITM)
Combining ETM and ITM
For Cortex-M3/M4 processors, trace information can
be generated from two different sources (see figure 17). The ETMv3 generates information about the
executed instructions. The ITM generates information
about the performed read/write accesses assisted by
the Data Watchpoint and Trace Unit (DWT).
Fig. 15: By combining ETM and ITM trace data, read/write accesses can be
integrated seamlessly into the program sequence.
figure 15), which in turn leads to significantly simpler
error location. The cause of an error such as an incorrect data value being written into an address can be
easily found if the write accesses are embedded into
the overall program trace.
The ITM trace packages for read/write accesses contain the following information: data address, data value,
program counter.
OS-Aware Tracing
Through analysis of the program counter, the data
accesses which are separately generated can be
seamlessly integrated into the program sequence (see
If an operating system is running on the Cortex-M3/
M4, task switch information becomes essential for the
trace analysis.
Instruction flow with task switches (ETM&ITM)
Timing diagram for task switches (ITM)
Call tree for task "sens1" (ETM&ITM)
Timing diagram for task MIPS (ETM&ITM)
Fig. 16: Through the combination of ETM and ITM trace data, extensive trace analysis can be provided for the eCos operating system.
12
NEWS 2012
www.lauterbach.com
In order to receive information about task switches the
following method can be used: Trace information on
the write cycle in which the kernel writes the identifier
for the current task on the corresponding OS variable
can be generated using the ITM. As described above
the write access information can be integrated seamlessly into the program flow trace. This improves the
readability of the trace listing (see figure 16). The integration of the task switch into the program sequence
also forms the basis for the runtime analyses shown
in the figure 16.
Three Recording Modes
To record the trace information generated by the
Cortex-M3/M4 processors, Lauterbach supports three
modes:
• FIFO mode: Storing the information in the 128 MByte
memory of the TRACE32 CombiProbe.
• STREAM mode: Streaming the information to a
hard-disk on the host computer.
• Real-time Profiling: The trace information is
streamed to the host computer and analyzed during
runtime.
For the first two recording modes, the trace information is collected and the trace analysis is undertaken
after recording is completed.
Each recording mode has its own features. FIFO is the
most commonly used mode. It is quick and usually all
that is needed for error location and the runtime analyses.
Cortex-M3/M4 Core
ETMv3
Instruction flow
only
DWT
4 hardware watchpoints
on load/store operations
ITM
Instrumentation Trace
Macrocell
Formatter
TPIU
Trace Port Interface
Unit
TRACE32
CombiProbe
Function coverage on running system
Statement coverage on running system
The ETMv3 implemented on Cortex-M3/M4 processors has neither a trigger nor a trace filter. It is not
possible to select for recording only those program
segments that are needed for troubleshooting. This
can mean trace data might have to be collected for a
relatively long period in order to cover the area needed
for analysis. In this case the STREAM mode can be
the best option. The STREAM mode, however, places
high demands on the debug environment:
• The large amount of data that results from streaming requires a 64-bit TRACE32 executable. This is
needed to allow the address range for the large
number of trace entries that will be collected.
• The transfer rate between CombiProbe and host
computer must be fast enough to stream all trace
data without a data loss. The 128 MByte memory of
the CombiProbe is used to cushion load peaks from
the trace port (TPIU).
Fig. 17: Real-time profiling enables code-coverage analysis to be followed
live on the screen
Real-time Profiling is particularly suitable for performing statement and condition coverage. The coverage
analysis can be followed live on the screen and the
test results are visible immediately (see figure17). “ok”
marked lines are already covered.
13
Simulation and Reality Draw Closer Together
It is now common to perform simulation and verification of designs before committing to hardware. This is
why tools such as MATLAB® and Simulink® have made
inroads as development software into the control
engineering market. It can save a lot of time and effort
if the control loop can be tested for the effects of many
variables before finalizing the design.
After the control algorithms had been created and
functionally tested with Simulink, the corresponding
program code for the processor of the control hardware was generated from the control blocks using the
Embedded Coder. Using a TRACE32 debugger, the
generated code was loaded into the control hardware
and functionally tested in-situ.
So what is the next step, after the control algorithm has
been found through simulation? How is this solution integrated into the control hardware? For this, Simulink
enables you to generate code automatically. But can
you be sure that the program behaves the same way
on the control hardware as in the simulation?
To determine the level of deviation between simulated
control behavior (red path) and real control behavior
(green path), but above all to confirm the numeric accuracy of the control hardware, a Processor-In-the-Loop
simulation (PIL) was chosen (see Figure 18). Essentially, the PIL simulation is based on the specially developed Simulink blocks “PIL Send” and “PIL Receive”.
These were designed to implement communication
between Simulink and the TRACE32 Remote API.
Verification Approach
The Institute of Flight System Dynamics at Technische
Universität München came up with an interesting solution during development of a flight control system for a
Diamond DA42 (see figure 20).
Aircraft
model
Flight control
algorithm
Flight test
pattern
PIL
Send
PIL
Rcv
Deviation
protocol
Simulink model
®
In each run through, the flight control algorithm performs a single calculation step of the discrete time
flight control on the target hardware. The Simulink
model provides the necessary input parameters. The
values calculated are returned to the Simulink model
and there supply the aircraft model. In a parallel calculation, the simulated flight control algorithm computes
the same values. The difference is then used to compare the two results.
The testing in the stand resulted in an absolute deviation of 10-13 – a high level of consistency that was
elegantly and easily proven with this approach.
For more information about the project of the Institute of
Flight System Dynamics at the Technische Universität
München, go to www.lauterbach.com/intsimulink.html.
TRACE32 Remote API
TRACE32 Integration for Simulink®
At the Embedded World show February 2012 in
Nuremberg/Germany, Lauterbach will be presenting
an even closer coupling between Simulink and Lauterbach’s TRACE32 debuggers.
Target
Flight control algorithm
Fig. 18: The real control behavior (green path) and the simulated control
behavior (red path) are compared.
14
NEWS 2012
Lauterbach has used the property of the Simulink code
generation that the code block always begins with a
comment line which contains the name and model
path for the block. These comment lines are available
after the generated code has been loaded into the
www.lauterbach.com
Simulink®
TRACE32 PowerView
Fig. 19: The block belonging to the selected source code line is marked in Simulink.
TRACE32 debugger. These lines allow a simple correlation between the Simulink block and the lines in
the source code.
Navigation from Simulink® to TRACE32
A global TRACE32 menu and TRACE32 menus
for blocks and signals are integrated into Simulink
as ‘Simulink Customization Menus’. The TRACE32
debugger can be controlled from Simulink with the help
of these menus. The following functions are available:
•
•
•
•
•
Show block code in TRACE32
Open TRACE32 Variable Watch Window for signals
Load Simulink build to the TRACE32 debugger
Set and manage block/signal breakpoints
Start and stop program on the control hardware
Navigation from TRACE32 to Simulink®
Selecting a section of source code in the TRACE32
debugger marks the corresponding block in Simulink
(see Figure 19).
Future
When Simulink Release 2012a is available, further TRACE32 functions will be possible in Simulink.
Lauterbach will use the improved functionality of the
Simulink rtiostream API to integrate a PIL simulation,
data logging, and parameter tuning.
MATLAB® and Simulink® are registered trademarks of
The MathWorks, Inc.
Fig. 20: Diamond DA42 (Source: www.diamond-air.at)
15
UEFI BIOS Debugging with TRACE32
A new TRACE32 extension for the Atom™ Debugger provides a complete debug capability of
Insyde’s H2O UEFI BIOS.
UEFI is the successor to the traditional PC BIOS. It
functions as an interface between firmware and operating system managing the boot process. From poweron to takeover by the operating system, UEFI runs
through various, clearly distinguished phases (see
figure 21).
As it is a JTAG-based tool, TRACE32 allows debugging to start from the reset vector.
In each phase of the boot process, the PowerView
user interface provides special windows which show
UEFI specific information. Functions and prepared
scripts enable debugging of dynamically loaded
drivers starting from the first instruction. For more
information about the new UEFI extension, go to
www.lauterbach.com/uefi.html.
OS-Absent
App
verify
Pre
Verifier
CPU
Init
Transient OS
Environment
Chipset
Init
Device,
Bus, or
Service
Driver
Board
Init
Transient OS
Boot Loader
DXE
Dispatcher
OS-Present
App
Boot
Dispatcher
Boot Services
Runtime Services
Final OS
Boot Loader
Final OS
Environment
?
Transient
System Load
Runtime
Afterlife
security
Security
Pre-EFI
Initialization
Environment
Power on
Driver
Execution
Environment
Boot
Device
Selection
Platform initialization
OS boot
Shutdown
Fig. 21: System boot process with UEFI.
WORLDWIDE BRANCHES
• USA
• Germany
• France
• UK
• Italy
• China
• Japan
16
Represented by experienced
partners in all other countries
KEEP US INFORMED
If your address has
changed or if you
no longer want to
be on our mailing
list, please send
us an e-mail to:
[email protected]
www.lauterbach.com