1
Chapter 4: Configuring the High-Level Network
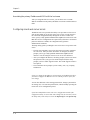
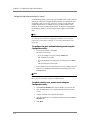
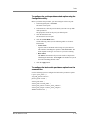
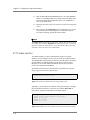
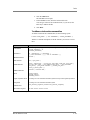
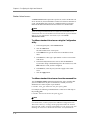
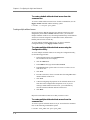
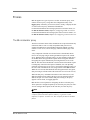
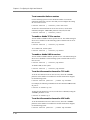
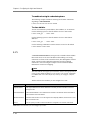
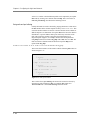
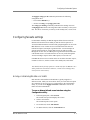
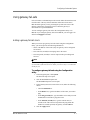
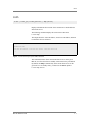
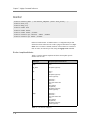
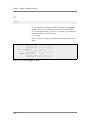
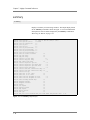
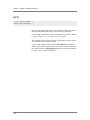
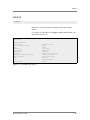
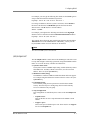
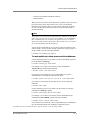
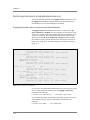
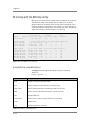
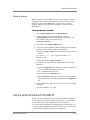
To configure a wmi monitor for the server node
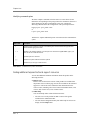
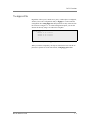
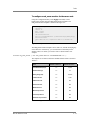
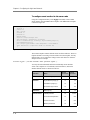
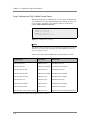
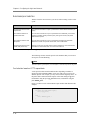
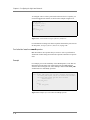
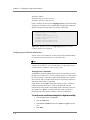
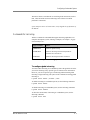
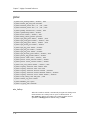
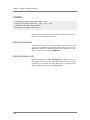
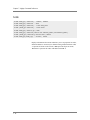
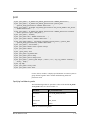
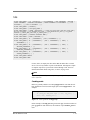
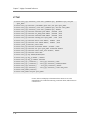
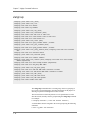
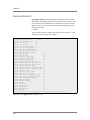
Using the Configuration utility or the bigpipe command, create a health
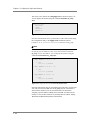
check monitor using the wmi monitor template. The wmi monitor template
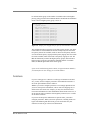
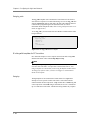
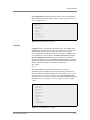
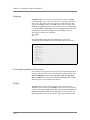
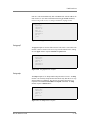
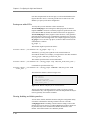
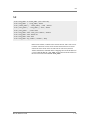
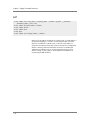
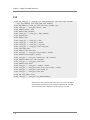
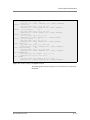
is shown in Figure 4.3.
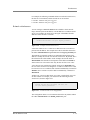
monitor type wmi {
interval 5
timeout 16
dest *:12346
username ""
password ""
method "POST"
urlpath "/scripts/F5Isapi.dll"
cmd "GetCPUInfo, GetDiskInfo, GetOSInfo"
metrics "LoadPercentage, DiskUsage, PhysicalMemoryUsage:1.5,
VirtualMemoryUsage:2.0"
post "<input type=’hidden’ name=’RespFormat’ value=’HTML’>"
agent "Mozilla/4.0 (compatible: MSIE 5.0; Windows NT)
}
Figure 4.3 wmi monitor template
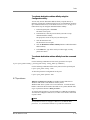
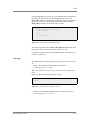
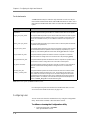
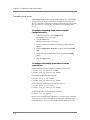
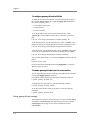
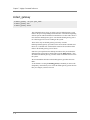
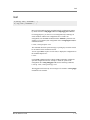
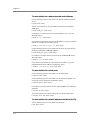
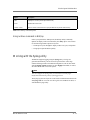
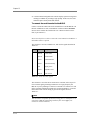
The monitor template contains default values for all the attributes. These are
template defaults. In creating a custom monitor from the template, the only
default values you are required to change are the null values for username
and password. For example:
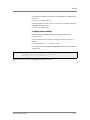
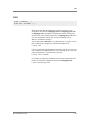
b monitor my_wmi ’{ use wmi username "dave" password "$getm" }’
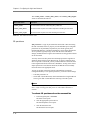
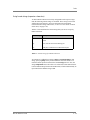
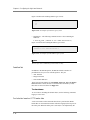
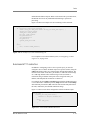
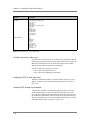
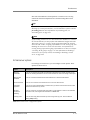
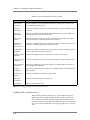
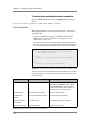
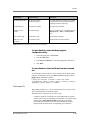
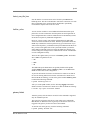
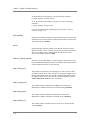
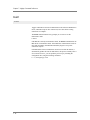
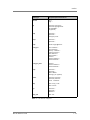
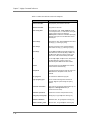
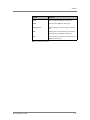
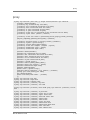
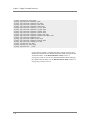
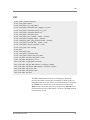
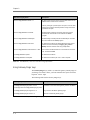
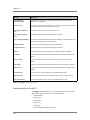
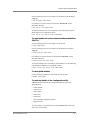
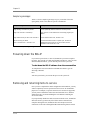
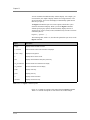
You may also add commands and metrics and modify metric attribute
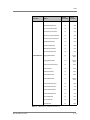
values. The complete set of commands, associated metrics, and metric
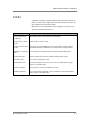
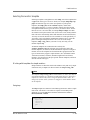
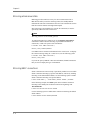
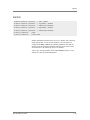
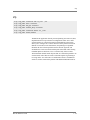
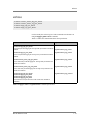
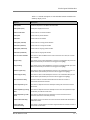
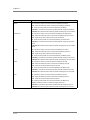
attribute default values are shown in Table 4.4.
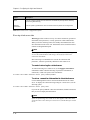
Default
Threshold
Metric
GetCPUInfo
LoadPercentage (%)
1.0
80
GetOSInfo
PhysicalMemoryUsage (%)
1.0
80
VirtualMemoryUsage (%)
1.0
80
NumberRunningProcesses
1.0
100
GetDiskInfo
DiskUsage (%)
1.0
90
GetPerfCounters
TotalKBytesPerSec
1.0
10,000
ConnectionAttemptsPerSec
1.0
500
CurrentConnections
1.0
500
GETRequestsPerSec
1.0
500
Table 4.4 wmi monitor commands and metrics
4 - 14
Default
Coefficient
Command