1
Signal Logging to the MATLAB Workspace
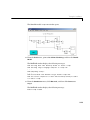
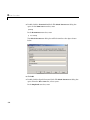
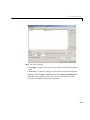
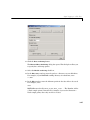
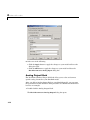
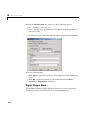
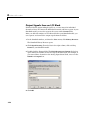
5 Do one of the following:
- Click Apply to apply the changes to your model and leave the dialog box
open.
- Click Close to apply the changes to your model and close the dialog box.
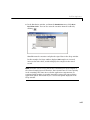
You must click the Apply or Close button on the Signal and Triggering
dialog box for the changes you made to take effect. Generally it is not
necessary to rebuild your real-time application.
Plotting Logged Signal Data
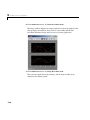
You can use the MATLAB plotting functions for visualizing non-real-time
simulated data or real-time application data.
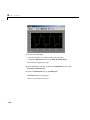
After running your real-time application and logging data to the MATLAB
workspace, you can plot the data. This procedure uses the Simulink model
rtwin_model.mdl as an example, and assumes you saved your data to the
variable ScopeData:
1 In the MATLAB window, type
ScopeData
MATLAB lists the structure of the variable ScopeData. The variable
ScopeData is a MATLAB structure containing fields for the time vector,
signal structure, and a string containing the block name.
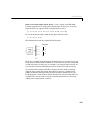
ScopeData =
time: [10000x1 double]
signals: [1x1 struct]
blockName: 'rtwin_model/Scope'
To list the contents of the structure signals, type
ScopeData.signals
3-35