Download Qlogic QLA2000F Product guide
Transcript
EMC® Ionix™ ControlCenter® 6.1 Taking Control of Your Datacenter P/N 300-006-385 REV 07 Copyright © 2003 - 2012 EMC Corporation. All rights reserved. Published in the USA. Published November 2012 EMC believes the information in this publication is accurate as of its publication date. The information is subject to change without notice. The information in this publication is provided as is. EMC Corporation makes no representations or warranties of any kind with respect to the information in this publication, and specifically disclaims implied warranties of merchantability or fitness for a particular purpose. Use, copying, and distribution of any EMC software described in this publication requires an applicable software license. EMC2, EMC, EMC Centera, EMC ControlCenter, EMC LifeLine, EMC OnCourse, EMC Proven, EMC Snap, EMC SourceOne, EMC Storage Administrator, Acartus, Access Logix, AdvantEdge, AlphaStor, ApplicationXtender, ArchiveXtender, Atmos, Authentica, Authentic Problems, AutoStart, AutoSwap, AVALONidm, Avamar, Captiva, Catalog Solution, C-Clip, Celerra, Celerra Replicator, Centera, CenterStage, CentraStar, ClaimPack, ClaimsEditor, CLARiiON, ClientPak, Codebook Correlation Technology, Common Information Model, Configuration Intelligence, Connectrix, CopyCross, CopyPoint, CX, Dantz, Data Domain, DatabaseXtender, Direct Matrix Architecture, DiskXtender, DiskXtender 2000, Document Sciences, Documentum, elnput, E-Lab, EmailXaminer, EmailXtender, Enginuity, eRoom, Event Explorer, FarPoint, FirstPass, FLARE, FormWare, Geosynchrony, Global File Virtualization, Graphic Visualization, Greenplum, HighRoad, HomeBase, InfoMover, Infoscape, InputAccel, InputAccel Express, Invista, Ionix, ISIS, Max Retriever, MediaStor, MirrorView, Navisphere, NetWorker, OnAlert, OpenScale, PixTools, PowerPath, PowerSnap, QuickScan, Rainfinity, RepliCare, RepliStor, ResourcePak, Retrospect, RSA, SafeLine, SAN Advisor, SAN Copy, SAN Manager, Smarts, SnapImage, SnapSure, SnapView, SRDF, StorageScope, SupportMate, SymmAPI, SymmEnabler, Symmetrix, Symmetrix DMX, Symmetrix VMAX, TimeFinder, UltraFlex, UltraPoint, UltraScale, Unisphere, Viewlets, Virtual Matrix, Virtual Matrix Architecture, Virtual Provisioning, VisualSAN, VisualSRM, VMAX, VNX, VNXe, Voyence, VPLEX, VSAM-Assist, WebXtender, xPression, xPresso, YottaYotta, the EMC logo, and the RSA logo, are registered trademarks or trademarks of EMC Corporation in the United States and other countries. Vblock is a trademark of EMC Corporation in the United States. VMware is a registered trademark of VMware, Inc. in the United States and/or other jurisdictions. All other trademarks used herein are the property of their respective owners. For the most up-to-date regulatory document for your product line, go to the technical documentation and advisories section on the EMC online support website. 2 EMC Ionix ControlCenter 6.1: Taking Control of Your Datacenter CONTENTS Chapter 1 Introduction The Challenges ................................................................................ Reporting ........................................................................................ Monitoring....................................................................................... Configuring and Controlling ............................................................. The Solution .................................................................................... Use Case Scenarios ......................................................................... Who Should Use This Use Case Scenarios Book? ............................. Chapter 2 5 5 5 5 6 6 6 Reporting on Your Datacenter Identifying IT assets for accounting.................................................. 8 Tracking which assets belong to a department (CTO)...................... 19 Tracking which assets belong to a department (Operations Manager) . 22 Allocating storage for a new application......................................... 26 Understanding how much storage is allocated to an application .... 27 Charging departments for storage use ........................................... 31 Configuring database space for a new application ......................... 36 Preventing application outages due to out-of-space conditions...... 42 Predicting storage needs more accurately ...................................... 45 Pooling storage resources.............................................................. 46 Collecting utilization statistics for management ............................. 50 Identifying old and large files......................................................... 53 Identifying a host performance problem ........................................ 59 Identifying a storage array performance problem ........................... 64 Chapter 3 Monitoring Your Datacenter Identifying and diagnosing loss of signal for a switch port ............. Preventing a space shortage on a host logical volume.................... Fixing a disk transfer rate alert ....................................................... Automating the resolution to an Oracle tablespace space shortage Chapter 4 78 88 93 96 Configuring and Controlling Your Datacenter Validating and optimizing a SAN configuration............................. 101 Allocating storage to a host from a Symmetrix array ..................... 119 EMC Ionix ControlCenter 6.1: Taking Control of Your Datacenter 3 Contents Allocating CLARiiON devices (LUNs) to a host ............................... Adding devices to a CLARiiON metaLUN for a host........................ Adding HP XP LUSEs to a host ...................................................... Deallocating storage from a host.................................................. Allocating storage using AutoPath................................................ Chapter 5 155 163 170 179 187 Virtual Provisioning of Your Symmetrix Devices Creating, mapping, and masking Symmetrix thin devices to a host...... 194 Monitoring Symmetrix thin pool utilization using Ionix ControlCenter alerts ........................................................................................... 227 Reporting on virtual provisioned storage using StorageScope ...... 227 Analyzing performance of virtually provisioned storage................ 247 Appendix A About Virtual Provisioning Virtual Provisioning overview ....................................................... 256 Virtual Provisioning glossary........................................................ 262 4 EMC Ionix ControlCenter 6.1: Taking Control of Your Datacenter CHAPTER 1 Introduction The Challenges Today, many businesses face ever-increasing challenges regarding reporting on, monitoring, configuring, and controlling their datacenters. Reporting Businesses are finding it difficult to keep track of what they have in their datacenters. For example, they need to know the number of storage arrays they have, the storage array vendors, how the storage arrays are being used, and by which applications. The process of keeping track, gathering information from many sources, in many forms, using tools unique to each operating system, and then compiling the information onto spreadsheets, with multiple iterations, is labor-intensive and cumbersome. Monitoring Both large and small organizations face the challenge of monitoring their storage environment. The introduction of storage networks, while solving problems of data access, has increased datacenter complexity. Mergers and cost-conscious purchases have contributed to a heterogeneous environment, and tight budgets have prevented organizations from adding personnel. At the same time, the internet, by providing means for organizations to reach a global audience that is active day and night, has raised the standard of the levels of performance and availability. Configuring and Controlling Managing storage resources involves complicated, routine tasks, which can include planning changes to a datacenter and juggling multiple tools from different vendors unique to each system. Management tasks can include knowing how storage is utilized, how much free space is available and where that storage is located. Configuration tasks can include adding new servers, applications, and storage. All of these processes can be extremely complex and difficult to manage efficiently. Introduction 5 Introduction The Solution The EMC Ionix ControlCenter 6.x family of storage management software provides an end-to-end solution for multivendor storage reporting, monitoring, configuration, and control. With Ionix ControlCenter, you can see the elements of your IT infrastructure (both hardware and software), know how your infrastructure is performing, and do what's necessary to ensure that service levels are met—for better performance, improved productivity, and reduced costs. Use Case Scenarios To supplement the product user documentation, EMC provides this book of use case scenarios. Unlike a product guide, which covers the entire range of features and capabilities, each chapter looks at just a small slice of Ionix ControlCenter functionality—that subset of Ionix ControlCenter you will use to answer specific questions such as “How do I know what I have?”, “How do I monitor what I have?”, and “How can I control and manage what I have?” This book assumes that Ionix ControlCenter is already installed and configured. Each use case has a small-to-medium datacenter environment, with multiple arrays, switches, databases, and hosts. However, it has none of the complexity associated with clustering, multiple networks, or firewalls that you might have implemented in your datacenter. Who Should Use This Use Case Scenarios Book? This use case scenarios book serves as a model for the methods of using Ionix ControlCenter to improve your business and operational processes. It also demonstrates how Ionix ControlCenter can be used to accomplish the tasks around managing a datacenter. 6 EMC Ionix ControlCenter 6.1: Taking Control of Your Datacenter CHAPTER 2 Reporting on Your Datacenter EMC Ionix ControlCenter provides many solutions for creating detailed reports of your storage assets. Use these reports to keep track of what storage assets you have and what group or department is using them, monitoring storage capacity and utilization, planning for configuration changes to the datacenter, or identifying performance problems that can severely impact business operations. This chapter contains the following scenarios: ◆ ◆ ◆ ◆ ◆ ◆ ◆ ◆ ◆ ◆ ◆ ◆ ◆ ◆ Identifying IT assets for accounting .................................................................... 8 Tracking which assets belong to a department (CTO) ........................................ 19 Tracking which assets belong to a department (Operations Manager) ............... 22 Allocating storage for a new application ........................................................... 26 Understanding how much storage is allocated to an application....................... 27 Charging departments for storage use .............................................................. 31 Configuring database space for a new application ............................................ 36 Preventing application outages due to out-of-space conditions ........................ 42 Predicting storage needs more accurately......................................................... 45 Pooling storage resources ................................................................................ 46 Collecting utilization statistics for management................................................ 50 Identifying old and large files ........................................................................... 53 Identifying a host performance problem ........................................................... 59 Identifying a storage array performance problem .............................................. 64 Reporting on Your Datacenter 7 Reporting on Your Datacenter Identifying IT assets for accounting This example demonstrates how a CTO can use EMC® Ionix™ StorageScope™ to create reports of the company’s IT assets, including arrays, hosts, and switches, for the corporate accountants. The CTO logs in to StorageScope, builds custom queries displaying all assets managed by Ionix ControlCenter, and prints them to a PDF. Once generated, the queries can be re-used to provide the information on demand. The sections below demonstrate how to use StorageScope to retrieve basic information for arrays, hosts, and switches, along with some custom fields that are specific to the accounting department’s needs. Note: If you create a single query listing all arrays, hosts and switches in the environment, the StorageScope Query Builder will list the objects by logical relationship, entering one row for every logical path from host to array through a switch. In cases where an object is not connected to any other managed resource, it would not appear in the query at all. For this example, a simple, complete listing of objects is required. Consequently, the listing of managed resources is handled through three queries rather than a single query. Listing of arrays To complete this task, the CTO: 1. Opens a web browser window and enters the following URL: https://<StorageScope_host_name>:30002/srm where <StorageScope_host_name> is the name of the host on which StorageScope is installed. 2. Enters the Ionix ControlCenter login. The dashboard appears. 3. On the StorageScope menu, selects Analysis > Queries > Query Builder. 4. Selects Create to launch the Query Builder Wizard. Note: For detailed instructions on using the Query Builder Wizard, refer to the StorageScope online help. a. On the Define Initial Settings step of the wizard, sets Name, Description, and Time Period settings for the query, see Figure 1 on page 9. 8 EMC Ionix ControlCenter 6.1: Taking Control of Your Datacenter Reporting on Your Datacenter Figure 1 Define Initial Settings step of the Query Builder 5. Since the query will be returning data based on the present configuration of the managed environment, selects Current Data. 6. Clicks Next to move to the Areas of Interest page of the query wizard Figure 2. Identifying IT assets for accounting 9 Reporting on Your Datacenter 10 EMC Ionix ControlCenter 6.1: Taking Control of Your Datacenter Reporting on Your Datacenter Figure 2 Areas of Interest step of the Query Builder 7. On the Areas of Interest page, selects Arrays from the Arrays grouping. 8. Clicks Next to move to the Select Columns page of the query wizard Figure 3 on page 12. Identifying IT assets for accounting 11 Reporting on Your Datacenter Figure 3 Select Columns Step of the Query Builder 9. Adds the following columns to the query: • Arrays.Array Vendor • Arrays.Array Type • Arrays.Array Model • Arrays.Array Name • Arrays.UDF.Cost • Arrays.UDF.Location Note: The columns listed above containing the appellation “UDF” are Ionix ControlCenter User-Defined Fields. User-Defined Fields are custom fields created by the user and are specific to the user’s environment. UDF fields listed in this document are merely examples of custom fields a user may wish to add as attributes for managed objects in their environment, they will neither exist in your Ionix ControlCenter installation nor be shown in figures in this document. For 12 EMC Ionix ControlCenter 6.1: Taking Control of Your Datacenter Reporting on Your Datacenter more information about working with User-Defined Fields, refer to the Ionix ControlCenter online help or to the EMC Technical Note Using Custom Fields in StorageScope Queries. 10. Clicks Next to go to the Create Filters step of the query wizard. No filters are needed for this query. 11. Clicks Next to go to the Select Sorting, Grouping & Total Options step of the query wizard. 12. Leaves the default options in place and clicks Next to go to the Select Run Settings step of the query wizard. 13. Chooses the default output options for the query and clicks Save to save the query. Note: This query will likely be run again in the future; EMC recommends saving it for later use. 14. Clicks Run Now to run the query. The query output lists the arrays in the managed environment Figure 4 on page 14. Identifying IT assets for accounting 13 Reporting on Your Datacenter Figure 4 Report listing all arrays Listing of hosts To complete this task, the CTO repeats the steps outlined under “Listing of arrays” on page 8, substituting the following values: ◆ Areas of Interest step: Selects Hosts from the Hosts grouping ◆ Select Columns step: Selects the following columns: • Hosts.Host Type • Hosts.Host OS • Hosts.Host.Name • Hosts.UDF.Cost 14 EMC Ionix ControlCenter 6.1: Taking Control of Your Datacenter Reporting on Your Datacenter • Hosts.UDF.Location Note: The columns listed above containing the appellation “UDF” are Ionix ControlCenter User-Defined Fields. User-Defined Fields are custom fields created by the user and are specific to the user’s environment. UDF fields listed in this document are merely examples of custom fields a user may wish to add as attributes for managed objects in their environment, they will neither exist in your Ionix ControlCenter installation nor be shown in figures in this document. For more information about working with User-Defined Fields, refer to the Ionix ControlCenter online help or to the EMC Technical Note Using Custom Fields in StorageScope Queries . When wizard steps are completed, clicks Run Now to run the query. The query output lists the hosts in the managed environment Figure 5 on page 16. Identifying IT assets for accounting 15 Reporting on Your Datacenter Figure 5 Report listing all hosts Listing of switches To complete this task, the CTO repeats the steps outlined under “Listing of arrays” on page 8, substituting the following values: 16 EMC Ionix ControlCenter 6.1: Taking Control of Your Datacenter Reporting on Your Datacenter ◆ Areas of Interest step: Selects Switches from the Connectivity grouping ◆ Select Columns step: Selects the following columns: • Switches.Switch Vendor • Switches.Switch Model • Switches.Switch Name • Switches.UDF.Cost Center • Switches.UDF.Reference Note: The columns listed above containing the appellation “UDF” are Ionix ControlCenter User-Defined Fields. User-Defined Fields are custom fields created by the user and are specific to the user’s environment. UDF fields listed in this document are merely examples of custom fields a user may wish to add as attributes for managed objects in their environment, and will not exist in your Ionix ControlCenter installation nor be shown in figures in this document. For more information about working with User-Defined Fields, refer to the Ionix ControlCenter online help or to the EMC Technical Note Using Custom Fields in StorageScope Queries. When wizard steps are completed, clicks Run Now to run the query. The query output lists the hosts in the managed environment Figure 6 on page 18. Identifying IT assets for accounting 17 Reporting on Your Datacenter Figure 6 Report listing all switches 18 EMC Ionix ControlCenter 6.1: Taking Control of Your Datacenter Reporting on Your Datacenter Tracking which assets belong to a department (CTO) This example demonstrates how a CTO can use the Hosts by Group and Arrays by Group reports in EMC StorageScope to identify which hosts and arrays belong to a particular group. Note: Grouping of objects host, arrays, and so on) is done in the Ionix ControlCenter console. Refer to the Ionix ControlCenter online help subject Creating user-defined groups for details regarding creating user-defined object groups. Displaying the hosts in a group To display the hosts in a group, the CTO: 1. Generates the Hosts by Group report Figure 7. Note: Refer to “Understanding how much storage is allocated to an application” on page 27 for step-by-step instructions on creating this report. Tracking which assets belong to a department (CTO) 19 Reporting on Your Datacenter Figure 7 Hosts by Group report 2. Reviews the report output to determine storage usage for host groups and to find a listing of all hosts owned by one or more groups in which the CTO is interested. Note: To prevent double-counting of storage resources shared by hosts within a group, the “Total” values in this report reflect the total storage capacity available to the group, not the sum of the storage available to each of the group’s hosts. Displaying the arrays in a group To complete this task, the CTO: 1. Selects Analysis > Reports > Built-in/Custom Reports from the StorageScope navigation menu. 2. Selects the checkbox corresponding to the Arrays by Group report and clicks Run Now to open the Run “Arrays by Group” dialog box. 20 EMC Ionix ControlCenter 6.1: Taking Control of Your Datacenter Reporting on Your Datacenter 3. Uses the Settings section of the dialog box to specify a Name and Output Format for the report. 4. Clicks Get Values to retrieve a listing of array groups in the enterprise. 5. Uses the Filters to select the Array Groups and Group Depth(s) for which the report will return data. 6. Clicks Run Now to close the dialog box and run the report with the specified settings; the Interactive Reports page appears. 7. Periodically refreshes the page until the report’s Status is Completed. 8. Selects the name of the report from the Job column to view the report output Figure 8. Figure 8 “Arrays by Group” report 9. Reviews the report output to determine storage usage for host groups and to find a listing of all hosts owned by the group(s) in which they are interested. Tracking which assets belong to a department (CTO) 21 Reporting on Your Datacenter Tracking which assets belong to a department (Operations Manager) This example demonstrates how an Operations Manager uses the Console tree and Topology view to identify the assets of a department, in this case Manufacturing. The task involves viewing the user-defined group in the Console tree, opening the Topology view, and then adding the user-defined group to the view. In this example, a group for the manufacturing department has already been created and populated with the objects for that group. User-defined groups (UDGs) are created in the Ionix ControlCenter Console tree. A folder named “Manufacturing” was created and then the objects owned by that group were copied or dragged and dropped into the folder. Refer to the Ionix ControlCenter online help in the Console on how to create UDG’s, and how to add and remove objects from UDG’s. Exploring the Manufacturing group To complete this task, the Operations Manager: 1. Logs in to the Console. 2. In the Console tree, expands the folders Management > Manufacturing. 3. Expands the subfolders to see the assets that belong to Manufacturing Figure 9. 22 EMC Ionix ControlCenter 6.1: Taking Control of Your Datacenter Reporting on Your Datacenter Figure 9 Viewing the assets of the Manufacturing group The File Systems subgroup contains file systems from multiple servers. The name of the server on which a file system resides is appended to the file-system name. This convention is also used for the switch ports and storage devices. Adding the Manufacturing group to the Topology view The Operations Manager: 1. Clicks the Eraser icon in the view on the right side of the Console to clear the view. 2. On the Console toolbar, clicks the Topology button and displays the Topology view Figure 10 on page 24. Tracking which assets belong to a department (Operations Manager) 23 Reporting on Your Datacenter Figure 10 Displaying the Topology view 3. Drags the Manufacturing group folder from the Console tree to the Topology view. 4. In the Topology view, right-clicks any empty space and selects Expand All. 5. On the Topology view toolbar, clicks Show Links. The Topology view, as depicted in Figure 11, shows how the hosts in the Manufacturing group physically connect to the array devices through the fabric. In the map, the Manufacturing assets are circled. 24 EMC Ionix ControlCenter 6.1: Taking Control of Your Datacenter Reporting on Your Datacenter Figure 11 Viewing physical connections in the Topology view Tracking which assets belong to a department (Operations Manager) 25 Reporting on Your Datacenter Allocating storage for a new application This example demonstrates how a database administrator (DBA) uses Properties views to evaluate the configuration and capacity of an existing database instance to help plan the database storage allocations for a new application. To complete this task, the DBA: 1. Logs in to the Console. 2. In the Console tree, expands the folder Databases Instances, which are grouped by type. 3. Expands the Oracle Instances group, Sales@l82ar155 instance and then Tablespaces. If necessary, the administrator can click the Eraser icon in the view on the right side of the Console to clear the view. 4. On the Console toolbar, clicks the Properties button. 5. In the Console tree, places a checkmark next to the folders Databases and Tablespaces. The properties of both database instances and the tablespaces for database Sales@l82ar155 appear in the Properties view Figure 12. Figure 12 Checking database configuration and capacity information 26 EMC Ionix ControlCenter 6.1: Taking Control of Your Datacenter Reporting on Your Datacenter Understanding how much storage is allocated to an application This example demonstrates how a Storage Manager uses the Hosts by Group report in EMC StorageScope to determine how much storage is accessible to “AppX”, a critical host-based, storage-intensive application. To complete this task, the Storage Manager: 1. Accesses StorageScope through a web browse, see “Identifying IT assets for accounting” on page 8. The StorageScope dashboard appears. 2. Selects Analysis > Reports > Built-in/Custom Reports. 3. Selects the Host by Group report. The Run “Hosts by Group” dialog box appears Figure 13. Understanding how much storage is allocated to an application 27 Reporting on Your Datacenter Figure 13 Hosts By Group report 4. Under Settings, keeps the default name of the report (Hosts By Group). 5. For Output Format, selects Portable document format (PDF) to generate the report as a PDF. 6. Under Filters, selects the Host Groups and Group Depths on which the report will be generated. In this example, all depths are selected. 7. Clicks Get Values to retrieve a list of all host groups in the environment. Note: You can press the Shift and Ctrl keys while clicking to select multiple objects. 8. Clicks Run Now to generate the report Figure 14 on page 29. 28 EMC Ionix ControlCenter 6.1: Taking Control of Your Datacenter Reporting on Your Datacenter Figure 14 Hosts By Group report 9. Refreshes the Interactive Reports page periodically to check the status of the report. When StorageScope has generated the report, the Status appears as Complete. 10. In the Job column, selects the name of the report (Hosts by Group) to view its results. 11. The report also displays the following information for every host in the report: • Host Name • Host OS • Accessible (GB) • Used Accessible (GB) • File System (GB) • Used File System (GB) Understanding how much storage is allocated to an application 29 Reporting on Your Datacenter • Network File System (GB) • VMFS Capacity (GB) • Used VMFS Capacity (GB) • Database (GB) • Used Database (GB) 12. Reviews the report to determine how much storage is available to hosts and host groups that use the application. Note: To prevent double-counting of storage resources shared by hosts within a group, the “Total” values in this report reflect the total storage capacity available to the group, not the sum of the storage available to each of the group’s hosts. 30 EMC Ionix ControlCenter 6.1: Taking Control of Your Datacenter Reporting on Your Datacenter Charging departments for storage use The examples below demonstrates two different ways in which a CEO can track storage use by departments and charge them accordingly. Charging departments for storage resource usage For the purposes of this example, the enterprise’s storage resources (hosts, arrays, file systems and databases) are sorted into Ionix ControlCenter user-defined groups by the departments that use them. The CTO uses StorageScope’s Query Builder to determine data usage by department and, based on the results of the query, can then charge departments accordingly for their storage needs. To build the query, the CTO: 1. Selects Analysis > Queries > Query Builder. 2. Selects Create and the Query Builder Wizard opens. Note: For full documentation of the Query Builder, refer to the StorageScope online help. The procedures listed below are described in detail under “Identifying IT assets for accounting” on page 8. 3. On the Define Initial Settings step of the wizard, chooses a Name, Description, Category, and Time Period for the query. 4. Selects the following Areas of Interest for the query: • Hosts: Chargeback • Groups • All Groups 5. On the Select Columns step of the Query Wizard, chooses the following columns and orders them as shown below: • All Groups.Group Name • All Groups .Group Path • Chargeback.# Subgroups • Chargeback.# Physical Hosts • Chargeback.# Databases Charging departments for storage use 31 Reporting on Your Datacenter • Chargeback.# File Systems • Chargeback.Accessible (KB) • Chargeback.Database Capacity (KB) • Chargeback.DB on Array (KB) • Chargeback.File System (KB) • Chargeback.FS on Array (KB) • Chargeback.Internal/JBOD (KB) Note: Refer to the StorageScope online help for full documentation of database fields used with the Query Builder. 6. In this example, no filtering is needed, so the DBA clicks Next to proceed to the Select Sorting, Grouping & Total Options step of the wizard. 7. Sorts and the results of the query in ascending order by All Groups.Group Name. 8. Selects No Subtotals. 9. Clicks Save; this query will likely be used again in the future. 10. Clicks Run Now to execute the query and display its results in screen in the format specified on the first step of the wizard. The output of the query results lists the amount and type(s) of storage resources used by each department in the enterprise Figure 15. 32 EMC Ionix ControlCenter 6.1: Taking Control of Your Datacenter Reporting on Your Datacenter Figure 15 Host Chargeback report Charging departments for file group usage In the scenario shown below, the CTO creates a file group for chargeback for each department, and then adds the department’s file systems to the group. Then, the CTO runs the chargeback report to produce an itemized listing of each department’s file system storage use and chargeback amount. Creating file groups To create file groups, the CTO: 1. On the Utilities menu, selects Settings > File Groups for Chargeback and displays the File Groups for Chargeback page. 2. Clicks Create to open the New File Group for Chargeback dialog box. 3. Assigns the department’s name to the group. Note: Each group must have a unique name. Names can be up to 50 characters long. 4. Assigns a value or cost per unit of storage, such as $1 per GB. Note: The chargeback value is calculated against the amount of used capacity in the file system, not the allocated capacity of the file system. Charging departments for storage use 33 Reporting on Your Datacenter 5. Clicks OK to create the file group. 6. Repeats this process for every file group being created. Adding paths to the file group After the file group has been created, paths must be added to it by the CTO, who: 1. On the Utilities menu, selects Settings > File Groups for Chargeback and displays the File Groups for Chargeback page. 2. Selects the checkbox next to the file group to which paths are being added. 3. Clicks Modify and displays the properties page for the group. 4. Clicks Add to open the Add Paths dialog box. 5. In the Add Paths dialog box, uses either of the following methods to add paths: Browses for the resource a. Clicks the Browse tab. b. Selects the host on which the file system resides. c. Drills down to find the desired file system path, selecting the checkbox next to it. d. Clicks OK to add the path. Manually enters the path to the resource a. Clicks the Specify Paths tab. b. Types each path on a separate line in UNC format For example, \\server\share\folder or //server/share/dir) 6. Clicks OK when finished adding paths. 7. Repeats this process for the other File Groups associated with each department. Running the Chargeback Report This example assumes that departments are charged for storage resource usage by the amount of storage they use in network and host-based file systems. Here, the StorageScope administrator has created a File Group for Chargeback for each department, assigned a cost per unit of storage for each group, and populated each group with the file systems used by the department assigned to it. 34 EMC Ionix ControlCenter 6.1: Taking Control of Your Datacenter Reporting on Your Datacenter Note: “Creating file groups” on page 33 provides instructions for creating a file group. Once this configuration process is complete, the CTO runs StorageScope’s built-in Chargeback report to assess how much to charge the department for its resource usage at the file level. To run the Chargeback report, the CTO: 1. Selects Analysis > Reports > Built-In/Custom Reports from the StorageScope navigation menu to go to the All Reports page. 2. Selects the checkbox corresponding to the Chargeback report on the list of Built-in Reports. 3. Scrolls to the bottom of the page and clicks Run Report. The Run “Chargeback” Report dialog box appears. 4. Selects a Name and Output Format for the report. 5. Clicks Get Values to retrieve a list of Host Names and File Groups in the managed environment. 6. Uses the Filters to select one or more Host Names, File Groups, Paths, and a File Size range on which the report will be generated. 7. Clicks Run Now to generate the report. The dialog box will close and the browser will be redirected to the Interactive Reports page. Note: The report may take several minutes to run. 8. Refreshes the Interactive Reports page periodically to check the status of the report. When StorageScope has generated the report, the Status will be listed as “Complete.” 9. Selects the completed report’s name in the Job column (in this case, Chargeback) to view its results. The Chargeback report displays a listing of File Groups for Chargeback in the managed environment, with subtotals by group and itemized data points for the file-level storage used by each group. Charging departments for storage use 35 Reporting on Your Datacenter Configuring database space for a new application This example demonstrates how a database administrator (DBA) works with a storage administrator using StorageScope to determine the capacity and configuration necessary for adding a new database application to the datacenter. At the DBA’s request, the storage administrator uses the StorageScope Databases report to get capacity and configuration information about all databases in the environment. Based on the results of that report, the storage administrator then uses the StorageScope Query Builder to determine the storage systems on which the databases reside and the available storage that has been allocated for them. With this information, the DBA can determine whether more storage needs to be allocated for the new database application. Generating the databases report To complete this task, the storage administrator: 1. Logs in to StorageScope as documented under “Identifying IT assets for accounting” on page 8. 2. Selects Analysis > Reports > Built-In/Custom Reports. 3. Selects the checkbox for the Databases report. 4. Clicks Run Report. The Run “Databases” dialog box appears Figure 16. 36 EMC Ionix ControlCenter 6.1: Taking Control of Your Datacenter Reporting on Your Datacenter Figure 16 Databases report setup 5. Selects a Name and Output Format for the report. 6. Clicks Get Values to retrieve a list of Host Groups in the managed environment. 7. Uses the Filters to select one or more Database Names, and Database Types on which the report will be generated. Note: To report only on databases that have used a certain percentage of their allocated capacity, are of a certain size, or are using a certain amount of storage, enter appropriate values in the % Used Database, Database Capacity, or Used Database fields, respectively. Configuring database space for a new application 37 Reporting on Your Datacenter 8. Clicks Run Now to generate the report. The dialog box will close and the browser will be redirected to the Interactive Reports page. Note: The report may take several minutes to run. 9. Refreshes the Interactive Reports page periodically to check the status of the report. When StorageScope has generated the report, the Status will be listed as “Complete.” 10. Selects the completed report’s name in the Job column (in this case, Databases) to view the results. Figure 17 Report listing usage for individual database The entire databases report displays the following: • The 10 most and least used databases • Usage details for all databases in the enterprise with subtotals for specific database types • Usage details for individual databases, see Figure 17 11. The DBA reviews the report output to check the status and configuration of databases to determine whether more storage needs to be allocated for them. 38 EMC Ionix ControlCenter 6.1: Taking Control of Your Datacenter Reporting on Your Datacenter Building the custom query To build a custom query displaying database configurations in the environment, the storage administrator: 1. Selects Analysis > Queries > Query Builder 2. Selects Create and the Query Builder Wizard opens. Note: For full documentation of the Query Builder, refer to the StorageScope online help. The procedures listed below are described in detail under “Identifying IT assets for accounting” on page 8. 3. On the Define Initial Settings step of the wizard, chooses a Name, Description, Category, and Time Period for the query. 4. Selects the following Areas of Interest for the query: • Hosts: Hosts, Host Devices • Arrays: Arrays, LUNs • Databases: Databases, Database Datafiles, Oracle Tablespaces 5. On the Select Columns step of the Query Wizard, chooses the following columns and orders them as shown below: • Database.Database Name • Databases.Database Type • Oracle Tablespaces.Tablespace Name • Database Datafiles.Data File Name • Database Datafiles.Resides On • Database Datafiles.Data File Capacity (KB) • Database Datafiles.Used Data File (KB) • Hosts.Host Name • Host Devices.Host Device Name • Arrays. Array Name • LUNs.LUN Name Configuring database space for a new application 39 Reporting on Your Datacenter • LUNS.LUN Capacity 6. The storage administrator does not filter the report and clicks Next to proceed to the Select Sorting, Grouping & Total Options step of the wizard Figure 18. Figure 18 Sorting the query results by database Name 7. Sorts the results of the query by Databases.Database Name. 8. Selects No Subtotals. 9. Clicks Save. 10. Clicks Run Now to execute the query and display its results in screen in the format specified on the first step of the wizard. The output of the query results shows: • The name and type of databases in the enterprise • The amount of physical storage used by the databases • The host at which databases in the enterprise are located • The amount of storage used for each datafile • The storage system on which the datafile resides • Information about the array on which the datafile resides, if applicable 40 EMC Ionix ControlCenter 6.1: Taking Control of Your Datacenter Reporting on Your Datacenter 11. The DBA and the storage administrator examine the storage configuration for the databases to determine further storage planning needs for them. Figure 19 on page 41 shows the output of the query. Note: If there are empty values in the Host Device Name, Array Name, LUN Name, and LUN Capacity (KB) fields and the Reside On column reports “unknown”, this indicates that the tablespace resides on internal or JBOD storage rather than on an array. Figure 19 Database Configuration report Configuring database space for a new application 41 Reporting on Your Datacenter Preventing application outages due to out-of-space conditions This example demonstrates how a Windows administrator uses the Relationship view to map an application file system on a VMware virtual machine back to the array device on which it resides. Then, using the Properties views, the Windows administrator discovers how much space is available on the virtual disk, file system, and finally on the array in case the administrator needs to add more disks to the ESX Server. Viewing the file-system-to-device relationship To complete this task, the Windows administrator: 1. In the Console, clicks the Eraser icon in the right-side view to clear the view. 2. On the Console toolbar, clicks Relationship. The Relationship view appears. 3. In the Console tree, expands the folders Hosts, the Windows Hosts category, and a virtual machine. 4. Drags the virtual machine from the Console tree to the Relationship view. The Relationship view, depicted in Figure 20, maps the virtual machine from the ESX Server and virtual disks (VMDK files) on which the virtual machine resides, through the file systems, back to the array devices. 42 EMC Ionix ControlCenter 6.1: Taking Control of Your Datacenter Reporting on Your Datacenter Figure 20 Relationship view Checking the available space in the virtual disk, file system, and array To complete this task, the Windows administrator: 1. On the Relationship view toolbar, clicks the horizontal split-screen icon Figure 21. Figure 21 Splitting the Relationship view A second, empty view appears below the Relationship view. 2. Clicks any part of the second (lower) view to make it active. 3. On the Console toolbar, clicks Properties. The second view changes to a Properties view. 4. Drags the file system icon from the Relationship view to the Properties view Figure 22. Preventing application outages due to out-of-space conditions 43 Reporting on Your Datacenter Figure 22 Dragging a file system to a Properties view 5. In the Properties view, notes the percentage of free space available in the Percent Free column. 6. Repeats the process by dragging the virtual disk, and then the array from the Relationship view to the Properties view. The Properties view, depicted in Figure 23, now shows the size of the virtual disk and the amount of available space in the file system and array. Figure 23 Viewing the available storage in a file system, virtual disk, and storage array 44 EMC Ionix ControlCenter 6.1: Taking Control of Your Datacenter Reporting on Your Datacenter Predicting storage needs more accurately This example demonstrates how a Storage Manager uses StorageScope to determine the storage needs for a file system residing on a EMC Celerra® Network Server (a NAS storage system) over time. The Storage Manager uses one of StorageScope’s SRM views to get a point-in-time view of the status of NAS File Systems in the enterprise. To complete this task, the Storage Manager: 1. Logs in to StorageScope as documented under “Identifying IT assets for accounting” on page 8. 2. Selects Analysis > SRM Views. 3. From the NAS views, selects File Systems to open the NAS File Systems view. 4. Selects the 10 Most Used File Systems layout, which displays the 10 NAS file systems that have used the highest percentage of their allocated storage space Figure 24. Figure 24 Report listing the 10 most used NAS file systems The view displays the percentage of storage space used and the number of weeks, based on usage trends, until the storage space will be completely used. Predicting storage needs more accurately 45 Reporting on Your Datacenter Pooling storage resources This example demonstrates how an Operations Manager uses StorageScope to identify unused storage space in the datacenter. The Operations Manager uses the Utilization Summary layout of the All Hosts report. To complete this task, the Operations Manager: 1. Logs in to StorageScope as documented under “Identifying IT assets for accounting” on page 8. 2. Selects Analysis > Reports > Built-In/Custom Reports. 3. Selects the Hosts report to open the Run “Hosts” Report dialog box Figure 25. Figure 25 Hosts report setup 46 EMC Ionix ControlCenter 6.1: Taking Control of Your Datacenter Reporting on Your Datacenter 4. Uses the Settings section of the dialog box to enter a Name and choose an Output Format for the report. 5. Optional: Uses the Filters section of the dialog box to specify the Host Type, host names, and Host OS on which the report will return data. Also, specifies filters for a range of Accessible storage on the host, % Used File System, % Used Database, Dormant Files, Aged Files, and Aged and Dormant Files. 6. Selects Get Values to retrieve the list of hosts meeting the specified filter requirements. 7. If necessary, repeats the previous two steps. 8. Clicks Run Now to generate the report; the browser is redirected to the Interactive Reports page. Note: The report may take several minutes to run. 9. Refresh the Interactive Reports page periodically to check the status of the report. When StorageScope has generated the report, the Status will be listed as Complete. 10. Selects the completed report’s name in the Job column (in this case, Hosts) to view its results Figure 26. Pooling storage resources 47 Reporting on Your Datacenter Figure 26 All Hosts report The report in Figure 26 on page 48 displays the following: • Array storage and internal or JBOD storage accessible to each host. • Accessible storage used by each host. • Storage used by databases, media files, temporary files, aged/dormant files, volume groups, and file systems on each host. Summary information for all hosts in the environment and for specific host types (for example, Windows 2003 or VMware servers), displaying the same information as described above. 48 EMC Ionix ControlCenter 6.1: Taking Control of Your Datacenter Reporting on Your Datacenter 11. Reviews the results of the report to determine whether there is significant unused host-accessible storage in the environment, and how that storage is allocated. Pooling storage resources 49 Reporting on Your Datacenter Collecting utilization statistics for management This example demonstrates how a system administrator and DBA use StorageScope to quickly gather file-system utilization statistics for management. The examples below demonstrate how a DBA can gather file system and database utilization statistics for management using the StorageScope Query Builder. Collecting file system utilization statistics In this example, the DBA quickly gathers file-system utilization statistics for management: To complete this task, the administrator: 1. Logs in to StorageScope as documented under “Identifying IT assets for accounting” on page 8. 2. Selects Analysis > Queries > Query Builder. 3. Clicks Create to create a new, custom query. 4. On the Define Initial Settings step of the wizard, sets Name, Description, and Time Period settings for the query. Since the query will be returning data based on the present configuration of the managed environment, selects Current Data. 5. Selects Hosts and File Systems from the Hosts grouping on the Areas of Interest step of the wizard. 6. On the Select Columns step, selects the following columnsin order: • Hosts.Host Name • File Systems.File System Name • Hosts.Host OS • Hosts.Host OS Level • File Systems.File System Type • File Systems.Resides On • File Systems.File System (KB) • File Systems.Used File System (KB) • File Systems.Free File System (KB) 50 EMC Ionix ControlCenter 6.1: Taking Control of Your Datacenter Reporting on Your Datacenter 7. If desired, filter the query output to include or exclude certain values. 8. On the Select sorting, grouping & total options step of the query, sorts the query results in ascending order by Hosts.Host Name and selects No Subtotals. 9. Clicks Save. 10. Clicks Run Now to run the query. The query output provides total and used file space information for all systems in the managed environment Figure 27 on page 51. Figure 27 File system utilization statistics Collecting database utilization statistics In this example, the DBA generates a custom query to quickly gather tablespace usage statistics about the databases in the managed environment. To complete this task, the administrator: Collecting utilization statistics for management 51 Reporting on Your Datacenter 1. Logs in to StorageScope as documented under “Identifying IT assets for accounting” on page 8. 2. Selects Analysis > Queries > Query Builder. 3. Selects the Database Tablespace Usage built-in query and clicks Run The output of the Database Tablespace Usage query provides a listing of total, used, and available space for databases in the managed environment Figure 28 on page 52. Figure 28 Database tablespace usage query 52 EMC Ionix ControlCenter 6.1: Taking Control of Your Datacenter Reporting on Your Datacenter Identifying old and large files In this example, the storage administrator wants reduce wasted storage contained in file systems and hosts in the enterprise. Using the StorageScope Query builder, the administrator identifies old and dormant files, as well as large files that may be taking up valuable storage space. Identifying old or rarely used files The storage administrator uses StorageScope to create a query statistics about hosts containing uncompressed files that are rarely accessed or modified. In this example, the query searches for files that have not been modified or accessed since July 1, 2006. To accomplish this task, the administrator: 1. Logs into StorageScope as documented under “Identifying IT assets for accounting” on page 8. 2. Selects Analysis, Queries, Query Builder. 3. Clicks Create to create a new, custom query. 4. On the Define Initial Settings step of the wizard, sets Name, Description, and Time Period settings for the query. Since the query will be returning data based on the present configuration of the managed environment, the DBA selects Current Data. 5. Clicks Next to move to the Areas of Interest page of the query wizard. 6. On the Areas of Interest step of the wizard, selects Hosts and File Systems from the Hosts grouping and select Files and File Types from the Files grouping. 7. Clicks Next. 8. On the Select Columns step of the wizard, selects the following columns: • Hosts.Host Name • Files.Parent Directory • Files.File Name • Files.Date Created • Files.Last Modified • Files.Last Accessed Identifying old and large files 53 Reporting on Your Datacenter • Files.Compressed 9. Clicks Next to go to the Create Filters step of the wizard. 10. Filters the query Figure 29 on page 54. Figure 29 Filtering the old files query 11. Clicks Next to go to the Select Sorting, Grouping & Total Options page of the wizard. 12. Sorts the results of the query by the Hosts.Host Name and Files.Last Accessed fields in ascending order and selects No subtotals Figure 30. Figure 30 Sorting the columns in the old files report 13. Clicks Next to go to the Select Run Settings step. 14. Clicks Save to save the query as configured. 15. Clicks Run Now to run the query. 54 EMC Ionix ControlCenter 6.1: Taking Control of Your Datacenter Reporting on Your Datacenter The query in Figure 31 on page 55 shows a listing, sorted by hostname, of those files in the enterprise that have not been accessed or modified since July 1, 2006. Based on the results of the query, the storage administrator can determine which files should be compressed, archived, or deleted in accordance with the enterprise’s data-retention policies. Figure 31 Report listing all old and unused files Identifying large files The storage administrator seeks to identify large files in the storage network that could be wasting valuable storage space and could possibly be archived, compressed, or deleted. In accordance with the enterprise’s policies, all files larger than 250 MB are subject to inspection for this purpose. Identifying old and large files 55 Reporting on Your Datacenter To complete this task, the storage administrator: 1. Logs in to StorageScope as documented under “Identifying IT assets for accounting” on page 8. 2. Selects Analysis > Queries > Query Builder. 3. Clicks Create to create a new, custom query. 4. On the Define Initial Settings step of the wizard, sets Name, Description, and Time Period settings for the query. Since the query will be returning data based on the present configuration of the managed environment, the DBA selects Current Data. 5. Clicks Next to move to the Areas of Interest page of the query wizard. 6. On the Areas of Interest step of the wizard, selects Hosts from the Hosts grouping and selects Files from the Files grouping. 7. Clicks Next to move to the Select Columns page of the wizard. 8. Selects, in order, the following columns: • Hosts.Host Name • Files.Parent Directory • Files.File Name • Files.Actual Size • Files.Compressed? 9. Clicks Next to go to the Create Filters step of the wizard. 10. Filters the query so that it only includes files that are 250 MB or larger Figure 32. 56 EMC Ionix ControlCenter 6.1: Taking Control of Your Datacenter Reporting on Your Datacenter Figure 32 Filtering the large files query 11. Clicks Next to go to the Select Sorting, Grouping & Total Options step. 12. Sorts the query by Hosts.Host Name in ascending order, and then by Files.Actual Size (B) in descending Figure 33. Figure 33 Sorting the columns in the large files report 13. Clicks Save to save the query for future use. 14. Clicks Run Now to run the query. The output of the query shows a listing of files, sorted by host, that are larger than 250 MB Figure 34 on page 58. Identifying old and large files 57 Reporting on Your Datacenter Figure 34 Report listing all large files 15. Reviews the report to determine which files could be archived, deleted, or compressed in accordance with the enterprise’s data-retention policies. 58 EMC Ionix ControlCenter 6.1: Taking Control of Your Datacenter Reporting on Your Datacenter Identifying a host performance problem This example demonstrates how a UNIX administrator and DBA use Performance Manager to identify a host performance problem. In this example, a company’s sales department noticed that sales transactions were processing slower than normal during the day on 3/30/06 and in the morning and afternoon on 3/31/06. They informed the CTO. The sales transactions are handled by an Oracle database that resides on host l82ar156. Host l82ar156 is connected to EMC Symmetrix® storage array 000187400075. The CTO contacts the Oracle database administrator (DBA) who works with one of the UNIX administrators to investigate the problems. The administrator launches the Performance Manager Console and then opens the Repository that contains the performance data collected on 3/30/06 to see why the sales department noticed performance problems with the Oracle database on this day. To complete this task, the UNIX administrator: 1. In the Ionix ControlCenter Console, on the File menu, selects Launch > Performance Manager. The Performance Manager login screen appears Figure 35. Figure 35 Performance Manager login screen Identifying a host performance problem 59 Reporting on Your Datacenter 2. Selects Repository losbd200, the Repository holding the 3/30/06 performance data. 3. Enters the appropriate Username and Password. 4. Clicks OK. The Data Selection dialog box appears Figure 36 on page 60. Figure 36 Data Selection dialog box 5. Under Data Provider, from the Class pull-down menu, selects Host. 6. From the Identifier pull-down menu, selects host l82ar156. 7. Under Archives, selects Daily. 8. Under Daily, selects 3/30/06. 9. Clicks OK. The Performance Manager Console appears Figure 37 on page 61. 60 EMC Ionix ControlCenter 6.1: Taking Control of Your Datacenter Reporting on Your Datacenter Analysis Toolbar Right Pane Menu Bar Toolbar and Graphics Tools Views, Metrics, and Configuration Panes Status Bar Figure 37 Performance Manager console In the Performance Manager Console, the Views, Metrics, and Configuration (Config) panes provide high-level views of the performance data and options for configuring the reports. The Analysis toolbar provides buttons for selecting the type of report (graph, chart, and so on) to display in the right panel. 10. Clicks the Metrics tab. The Metrics panes appear Figure 38 on page 62. Identifying a host performance problem 61 Reporting on Your Datacenter Figure 38 Metrics panes The Metrics panes contain lists of objects or options for creating various data views (graphs, reports, and so on) of the performance data. Host l82ar156 appears in the top Metrics pane. 11. In the top Metrics pane, under the folder for host l82ar156, selects the Physical Device folder. The devices on the host and the devices on the Symmetrix array to which the host is connected appear in the middle pane. 12. Clicks inside the middle pane to select a device. 13. Presses and holds the Shift key and then selects all devices in the middle pane. 14. In the bottom metrics pane, selects response time (ms) to view the device’s response times (in milliseconds). 62 EMC Ionix ControlCenter 6.1: Taking Control of Your Datacenter Reporting on Your Datacenter 15. On the Analysis toolbar, clicks the Graph Per Metric ( of the metrics selected in the Metrics panes. ) button to create a graph A graph appears in the right pane showing the response times of all devices on the host and the Symmetrix array Figure 39 on page 63. Figure 39 Metrics graph of host and array devices Most of the response times of each of the devices are normal (less than 5 milliseconds), indicating that the performance problem is on host l82ar156 and not the Symmetrix array to which the host is connected. The DBA meets with the CTO and UNIX administrator to discuss how to further investigate the problems on the host that are related to performance. Identifying a host performance problem 63 Reporting on Your Datacenter Identifying a storage array performance problem Continuing from the previous example, “Identifying a host performance problem” on page 59, this example demonstrates how the UNIX administrator now analyzes the data collected on 3/31/06 to determine what caused the performance problems the sales department experienced at two peak periods (9 A.M. and 6 P.M.) Accessing the host The UNIX administrator opens the Repository holding the performance data collected for host l82ar156 and Symmetrix 000187400075. To complete this task, the UNIX administrator: 1. On the menu bar, from the File menu, selects Open. The Data Selection dialog box appears. 2. Under Data Provider, from the Class pull-down menu, selects Host. 3. From the Identifier pull-down menu, selects host l82ar156. 4. Under Archives, selects the radio button next to Daily. 5. Under Daily, selects 3/31/06. 6. Clicks OK. The Performance Manager console appears with host l82ar156 in the Views pane. Analyzing the host device The UNIX administrator now analyzes host device c2t0d2s2 (the device host l82ar156 uses to connect to the Symmetrix) for the performance problems. The DBA provides the name of the host device. To complete this task, the UNIX administrator: 1. Clicks the Metrics tab to switch to the Metrics panes. 2. In the top Metrics pane, under the folder for host l82ar156, selects the Physical Device folder. 3. The devices for the host and the Symmetrix appear in the middle Metrics pane. 4. In the middle Metrics pane, selects device c2t0d2s2. 64 EMC Ionix ControlCenter 6.1: Taking Control of Your Datacenter Reporting on Your Datacenter 5. In the bottom pane, selects response time (ms). 6. Clicks the Graph Per Object ( ) button. A graph appears in the right pane showing response time for the device Figure 40 on page 65. Figure 40 Graph showing response time of device c2t0d2s2 The graph reveals that the device performance degraded at two peak periods (9 A.M. and 6 P.M.) that match the periods when the sales department claimed they noticed the performance problem. Identifying the storage array disks The UNIX administrator now wants to identify the disks on the Symmetrix array to which host l82ar156 is connected through device c2t0d2s2. To complete this task, the UNIX administrator: Identifying a storage array performance problem 65 Reporting on Your Datacenter 1. In the middle Metrics pane, selects all of the devices. 2. In the bottom Metrics pane, selects ios per sec to view the I/O statistics (per second) of the devices. 3. Clicks the Histogram ( ) button. A histogram graph appears in the right pane Figure 41 on page 66. Figure 41 Histogram of all devices A histogram graph is a bar graph of historical performance data. The X-axis shows the selected objects and the Y-axis displays the values of the selected metrics. The histogram graph displays the input/output per second data for the selected devices. c2t0d2s2 appears as the first device. 4. Selects the Config tab at the bottom of the left-hand panes Figure 42 on page 67. 66 EMC Ionix ControlCenter 6.1: Taking Control of Your Datacenter Reporting on Your Datacenter Figure 42 Tab for Configuration view 5. On the menu bar, on the File menu, selects Open and the Data Selection dialog box appears. 6. Under Data Provider, from the Class pull-down menu, selects Host. 7. From the Identifier pull-down menu, selects host l82ar156. 8. Under Archives, selects the radio button next to Daily. 9. Under Daily, selects 3/31/06. 10. Clicks OK and the Performance Manager console appears with host l82ar156 in the Views pane. 11. On the menu bar, from the File menu, selects Open and the Data Selection dialog box appears. 12. Under Data Provider, from the Class pull-down menu, selects Symmetrix. 13. From the Identifier pull-down menu, selects Symmetrix array 000187400075. 14. Under Archives, selects the radio button next to Daily. 15. Under Daily, selects 3/31/06. 16. Clicks OK and the Symmetrix array appears in the Views pane. 17. Right-clicks the Symmetrix and selects Load Configuraton from Repository Figure 43 on page 68. Identifying a storage array performance problem 67 Reporting on Your Datacenter Figure 43 Loading configuration data Config – As of 03/31/2006 appears in the left pane tree under the Symmetrix array. 18. Clicks Config – As of 03/31/2006 in the tree. A table appears in the right pane Figure 44 on page 69. 68 EMC Ionix ControlCenter 6.1: Taking Control of Your Datacenter Reporting on Your Datacenter Figure 44 Symmetrix folder and a table of the Symmetrix configuration The table displays the configuration between the host and the Symmetrix array, including the array device (0x011) to which device c2t0d2s2 is connected. Analyzing storage array disks Having identified the disks and the array device (0x011) on the Symmetrix array that host l82ar156 was using, the UNIX administrator now analyzes the disks to ensure that the host accessed them at 9 A.M. and 6 P.M. on this day. To complete this task, the UNIX administrator: 1. In the middle Metrics pane, selects both disks. 2. In the bottom Metrics pane, selects read commands per sec to view the number of read commands 0x011 made (per second) to the disks. 3. Clicks the Graph Per Metric ( ) button. A graph of the two disks appears showing that host l82ar156 did in fact access these disks at 9 A.M. and 6 P.M. Figure 45 on page 70. Identifying a storage array performance problem 69 Reporting on Your Datacenter Figure 45 Graph of Symmetrix disks Analyzing a storage array device The UNIX administrator now analyzes array device 0x011 for the performance problems. To complete this task, the UNIX administrator: 1. In the middle Metrics pane, selects device 0x011. 2. In the bottom Metrics pane, selects %hit to view the percentage of hits from the array device to the array cache (cache hit ratio). 3. Clicks the Graph Per Metric ( ) button. A graph appears showing that the cache hit ratio fell considerably at 9 A.M. and 6 P.M. Figure 46. 70 EMC Ionix ControlCenter 6.1: Taking Control of Your Datacenter Reporting on Your Datacenter Figure 46 Graph of cache hit ratio on the Symmetrix array disk 4. In the bottom Metrics pane, selects read hits per second and read misses per second to view the number of times device 0x011 found the data in the array cache (read hits) and the number of times the data had to be retrieved from the disk (read misses). Clicks the Graph per object ( ) button. A new graph appears showing that there were read misses at 9 A.M. and 6 P.M., which caused the cache hit ratio to fall Figure 47 on page 72. Identifying a storage array performance problem 71 Reporting on Your Datacenter Figure 47 Graph showing read misses between Symmetrix disks and cache Analyzing a storage array system To confirm the read misses, the UNIX administrator now analyzes the entire Symmetrix array for the occurrence of destaged tracks (data moved from the cache back to the disks). To complete this task, the UNIX administrator: 1. In the top Metrics pane, under the Symmetrix folder, selects the System folder. The Symmetrix array (000187400075) appears in the middle metrics pane. 2. In the middle Metrics pane, selects the Symmetrix array. 3. In the bottom Metrics pane, selects destaged tracks per sec to view the number of data tracks that the array destaged. A new graph appears showing that the Symmetrix destaged tracks of data during 9 A.M. and 6 P.M. Figure 48 on page 73. 72 EMC Ionix ControlCenter 6.1: Taking Control of Your Datacenter Reporting on Your Datacenter Figure 48 Graph of destaged data on the Symmetrix array The UNIX administrator is now certain that the data destaging on the Symmetrix array is what caused the performance to degrade. Identifying hosts connected to a storage array Now the UNIX administrator needs to determine what caused the Symmetrix array to destage data, and checks to see if another host connected to the Symmetrix array was perhaps accessing the array at the same time as host l82ar156. To complete this task, the UNIX administrator: 1. In the top Metrics pane, under the Symmetrix folder, selects the Devices folder. All devices on the Symmetrix array that were active appear in the middle Metrics pane. Identifying a storage array performance problem 73 Reporting on Your Datacenter 2. In the bottom Metrics pane, selects total ios per sec to view the total number of I/O’s for each device. 3. In the middle Metrics pane, sorts total ios per sec in descending order and selects the top nine devices. 4. Clicks the Links ( ) button. The Links view appears in the right pane showing the end-to-end path of the Symmetrix array and the hosts connected to its devices Figure 49 on page 74. Figure 49 Links view showing the path between Host l82ar155 and the Symmetrix array The Links view reveals that there are two devices on the Symmetrix array that are linked to two devices on another host (l82ar155). 5. In the Links view, under Host Device, selects one of the devices for host l82ar155. 74 EMC Ionix ControlCenter 6.1: Taking Control of Your Datacenter Reporting on Your Datacenter 6. In the top Metrics panel, under host l82ar155, selects the Physical Device folder. Figure 50 Host l82ar155 In thetop Metrics pane All of the host’s and the Symmetrix array’s disks appear in the middle Metrics pane. 7. In the middle Metrics pane, selects both disks. 8. In the bottom Metrics pane, selects ios per sec. 9. Clicks the Graph Per Metric ( ) button. A graph appears in the right pane displaying the times when host l82ar155 accessed the Symmetrix array Figure 51 on page 76. Identifying a storage array performance problem 75 Reporting on Your Datacenter Figure 51 Graph showing times when host l82ar155 accessed the Symmetrix array The two peak times when host l82ar155 accessed the Symmetrix array are identical to the times when host l82ar156 accessed the Symmetrix array (9 A.M. and 6 P.M.). Because host l82ar155 was accessing the devices that share the same disk spindle on the Symmetrix array as host 182ar156, the competing workload caused the performance degradation. 76 EMC Ionix ControlCenter 6.1: Taking Control of Your Datacenter CHAPTER 3 Monitoring Your Datacenter EMC Ionix ControlCenter provides solutions for monitoring your storage assets. Ionix ControlCenter alerts notify you of problems (for example, a port is down, a disk is down, a volume is low on storage capacity) in the datacenter, while views such as Properties, Topology, Relationship, and Path Details allow you to investigate alerts and determine corrective action for addressing them. This chapter contains the following scenarios: ◆ ◆ ◆ ◆ Identifying and diagnosing loss of signal for a switch port ................................ Preventing a space shortage on a host logical volume ...................................... Fixing a disk transfer rate alert.......................................................................... Automating the resolution to an Oracle tablespace space shortage .................. Monitoring Your Datacenter 78 88 93 96 77 Monitoring Your Datacenter Identifying and diagnosing loss of signal for a switch port This example demonstrates how a storage administrator uses Ionix ControlCenter to respond to a Loss of Signal alert for a switch port. In this example, a company has already defined a process for problem notification and resolution that allows the administrator to quickly identify, diagnose, and resolve the issue. The port for which the alert has triggered is critical to the company’s business operations, so the administrator set the Loss of Signal alert for the switch port to Fatal during the Ionix ControlCenter implementation. They also set a monitoring schedule that ensured the administrator would receive notification within 15 minutes when a problem occurred. Receiving the switch port alert While exploring the properties of some file systems in the Ionix ControlCenter Console, the storage administrator notices a new switch port alert in the Alerts view (Figure 52 on page 78). Figure 52 Switch port loss of signal alert 78 EMC Ionix ControlCenter 6.1: Taking Control of Your Datacenter Monitoring Your Datacenter The alert indicates that the switch port is experiencing 10,303 signal losses within a 15-minute interval. (To determine the interval, the administrator right-clicks the alert and selects Alert > Details on the Actions tab or the Alert Definition dialog box, the schedule is every 15 minutes). This level of performance will severely affect communications between any devices that use the port. The storage administrator must take action immediately. Acknowledging the alert Following the procedures that the storage administrator established during the planning stage of the Ionix ControlCenter implementation, the administrator first acknowledges the alert to indicate to the rest of the IT staff that someone is addressing the issue. To acknowledge the alert, the administrator: 1. Right-clicks the alert in the Alerts view and selects Acknowledge (Figure 53). Figure 53 Acknowledging an alert The Acknowledge Alert dialog box appears (Figure 54). Identifying and diagnosing loss of signal for a switch port 79 Monitoring Your Datacenter Figure 54 Acknowledge alert dialog box 2. Enters a note and clicks OK. In the Alerts view, the alert text changes from bold to plain text and the administrator’s ID appears in the Acknowledged By column. Diagnosing the alert To diagnose the switch problem, the administrator uses several views: ◆ Topology — To identify the other components to which the switch physically connects ◆ Path Details — To identify the paths that exist (mapping, I/O path) between the host device and the array logical volume across the SAN ◆ Properties — To find out more information about the host to which the switch connects ◆ Tree panel — To discover which business groups are affected by the issue To use the Topology view, the administrator: 1. Clicks the horizontal split-screen icon in the Alerts view. 80 EMC Ionix ControlCenter 6.1: Taking Control of Your Datacenter Monitoring Your Datacenter A new view appears below the Alerts view. 2. Clicks Topology on the toolbar to change the view type. 3. Drags the port from the Alerts view to the Topology view. 4. Clicks the plus sign next to the switch (Mainstreet_3800) in the middle of the view to show its ports. The Topology view shows the switch on which the port resides. In the view, a red X icon indicates the port with the problem (Figure 55). Figure 55 Topology view 5. Clicks Show Links on the Topology view toolbar to draw the links between the switch ports, hosts, and storage. 6. Expands the Hosts folder on the left and the Storage folder on the right. 7. Resizes the Topology view to see the connections more clearly and places the cursor over the link between the troubled switch and the director port to highlight it (Figure 56). Identifying and diagnosing loss of signal for a switch port 81 Monitoring Your Datacenter Figure 56 Expanded Topology view The Topology view shows that the switch port possibly connects either of two managed hosts to the FA-3D director on the 00075 Symmetrix array. Using the Path Details view To find out if either host is affected, the administrator uses the Path Details view, which shows detailed information about the I/O path between host devices and storage array logical volumes. To use the Path Details view, the administrator: 1. Clears the Alerts view to create space for the Path Details view. 2. Clicks the down arrow next to Storage Allocation on the task bar and selects Path Details (Figure 57). 82 EMC Ionix ControlCenter 6.1: Taking Control of Your Datacenter Monitoring Your Datacenter Figure 57 Opening a Path Details view The empty view above Topology changes to Path Details. 3. Drags the array’s front-end director from the Topology view to the Path Details view. 4. Under Select Object, selects the front-end director and clicks Show Devices. The Path Details view now shows which host devices the affected director is mapped to. By highlighting the affected connection in the table in the top part of the view, the administrator sees more details about this I/O path in the lower part of the view (Figure 58). Identifying and diagnosing loss of signal for a switch port 83 Monitoring Your Datacenter Figure 58 Path Details view Using the Path Details view, the administrator identifies which file system is connected to the down switch port. Identifying affected applications or business units To see which applications or business units are affected by the poor switch performance, the administrator: 1. Right-clicks the host in the Path Details view and selects Properties. 2. Selects the host in the Properties view. 84 EMC Ionix ControlCenter 6.1: Taking Control of Your Datacenter Monitoring Your Datacenter In the tree, an icon appears next to each folder to which the host belongs. By looking at the folders in the tree, the administrator sees that the host belongs to the Sales department and is a part of their Sandbox application (Figure 59), which is a test environment for a new e-commerce application. Figure 59 Identifying the groups to which a host belongs The administrator contacts the application developers working on the Sandbox application and collaborates with them to identify the problem. Closing the issue After verifying that the switch performance has improved and that no other systems were adversely affected by the fix, the administrator closes the issue using the department’s new procedures. To close the issue, the administrator: 1. Reopens the Alerts view by right-clicking the port in the Topology view and selects Alerts (Figure 60). Identifying and diagnosing loss of signal for a switch port 85 Monitoring Your Datacenter Figure 60 Reopening the Alerts view An Alerts view showing only the port alert appears below the Topology view. 2. Right-clicks the alert in the Alerts view and selects Alerts > Clear Alert for All Users (Figure 61). Figure 61 Clearing the switch port alert 86 EMC Ionix ControlCenter 6.1: Taking Control of Your Datacenter Monitoring Your Datacenter The Clear Alert dialog box appears (Figure 62). Figure 62 Adding an alert note 3. Types a note about how the issue was resolved and clicks OK. The alert will appear in the Alert History view for one month, based on the Alert data retention policy the administrator set during configuration. If a similar issue occurs, the monitoring schedule is set to notify the administrators within 15 minutes of the problem. Administrators can help diagnose and resolve the issue by searching the alert notes. Identifying and diagnosing loss of signal for a switch port 87 Monitoring Your Datacenter Preventing a space shortage on a host logical volume In this example, the Windows administrator receives notification that a logical volume on a Windows host has reached a critical space threshold: 5 percent capacity remaining. The volume surpasses the threshold at 9 P.M., after the administrator has already left the office for the day. Receiving an alert in BMC PATROL During the alert configuration phase, the Windows administrator created an alert for a set of key application volumes, which included this volume. The administrator configured a management policy that would propagate the alert to BMC PATROL if the alert persisted for a certain time period (exactly for situations in which the administrator was away from the office). The late-shift operator whose responsibility it is to monitor BMC PATROL notices the alert (Figure 63). Figure 63 A Ionix ControlCenter alert in BMC PATROL The operator pages the Windows administrator. Diagnosing a free space alert The Windows administrator logs in to the Console from home using terminal services to access Ionix ControlCenter across the company’s firewall. 88 EMC Ionix ControlCenter 6.1: Taking Control of Your Datacenter Monitoring Your Datacenter Following the company’s procedures, the administrator first acknowledges the alert in the Alerts view to indicate that someone is addressing the issue. In the Alerts view, the administrator right-clicks the alert, selects Acknowledge Alert, enters a brief note in the dialog box, and clicks OK to close it. To diagnose the free space alert, the administrator: 1. Clicks the horizontal split-screen icon in the Alerts view to create a new view. 2. Clicks Relationship on the Console toolbar to change the view type of the new view. 3. Drags the host from the Alerts view to the Relationship view. The Relationship view shows how the host logical volumes map back to the array devices (Figure 64). Figure 64 Relationship view 4. Right-clicks the volume in the Relationship view and selects Properties to find out the actual free space available on the volume. Preventing a space shortage on a host logical volume 89 Monitoring Your Datacenter A new Properties view opens below the Relationship view. The new view shows the volume size and the amount of free space available the last time the host’s Discovery data collection policy ran (Figure 65). Figure 65 Host file system Properties view According to the Last Modified column in the Properties view, the Discovery policy last ran just after midnight. At that time, the free space was about 6 percent, or 1.52 GB. The Properties view shows a different value than the alert is reporting because the Properties view is populated from the Repository, while the alert is updated according to the schedule that it is assigned. During the alert configuration stage, the Operations Manager and Windows administrator assigned this alert an hourly schedule. The Windows administrator could update the Properties view by right-clicking the host and selecting Rediscover, which would cause Ionix ControlCenter to run the Discovery data collection policy for the host. Alternatively, the administrator could set the policy to run more frequently than once per day. 90 EMC Ionix ControlCenter 6.1: Taking Control of Your Datacenter Monitoring Your Datacenter Locating additional free space Because the logical volume free space has fallen below the fatal threshold, the Windows administrator decides to act immediately and find additional free space. To find additional free space for the logical volume, the administrator: 1. Closes the Properties view. 2. Drags the top of the Relationship view up to better see the view’s contents. 3. Expands the Devices for l82ar154 folder. The administrator notices that there are several array devices that are already mapped to the host. These devices might be available for extending the logical volume. The icons in the Relationship view indicate the device types. 4. Highlights several standard devices by clicking, pressing and holding the Ctrl key, and clicking additional devices. 5. Right-clicks one of the highlighted devices and selects Properties. A new Properties view opens. The highlighted devices are added to the view (Figure 66). Figure 66 Symmetrix device Properties view Preventing a space shortage on a host logical volume 91 Monitoring Your Datacenter Extending the logical volume The administrator identifies some volumes available to extend the logical volume and will use Ionix ControlCenter to do it right away. To extend the logical volume, the administrator: 1. Right-clicks the logical volume and selects Allocation, Extend Logical Volume. 2. Completes a series of dialog boxes. Closing the issue After confirming that the logical volume has sufficient space, the administrator follows the new departmental procedures to close the issue and document the resolution. The administrator clears the alert from the Alerts view and adds a note about the diagnosis and resolution. 92 EMC Ionix ControlCenter 6.1: Taking Control of Your Datacenter Monitoring Your Datacenter Fixing a disk transfer rate alert In this example, a senior Windows administrator receives notification about the performance of a disk on a vital Windows server. The alert is a Physical Disk Bottleneck (Transfer Rate) alert, which triggers when the transfer rate for a Windows disk exceeds a threshold. The senior administrator assigns the alert to a junior administrator to investigate. Assigning the alert To assign the alert, the senior administrator: 1. Right-clicks the alert in the Alerts view and selects Alerts, Assign. The Assign Alert dialog box appears. 2. Selects the junior administrator’s ID in the Assign To field. 3. Records a note about possible causes for the alert in the Notes field and suggests that the junior admin use the Relationship view to see how the disk is mapped. 4. Clicks OK. The alert text changes from bold to plain text in the Alerts view, indicating that the alert has been acknowledged. The Assigned To column shows the junior administrator’s ID. The Acknowledged By column shows the senior administrator’s ID. Diagnosing the alert The junior administrator has sorted the Alerts view by the Assigned To column to see which alerts the administrator has been assigned. When the new alert appears, the administrator notices it. To diagnose and resolve the issue, the administrator: 1. Notices the note icon in the first column of the Alerts view, right-clicks the alert, and selects Alerts > Notes > Note. The View/Add Notes dialog box appears. 2. Reads the senior administrator’s note about using the Relationship view and closes the dialog box. 3. Clicks the horizontal split-screen icon to create a new view below the Alerts view. Fixing a disk transfer rate alert 93 Monitoring Your Datacenter 4. Clicks the Relationship button on the Console toolbar to change the new view type. 5. Drags the affected disk from the Alerts view to the Relationship view. The Relationship view maps the host device back to the Symmetrix physical disk on which it resides (Figure 67). Figure 67 Mapping a host device in the Relationship view 6. Drags the disk outside of the red box in which it resides and drops it in a blank area of the Relationship view. This causes the view to redraw itself with the Symmetrix disk, which is now the subject of the view. The view reveals that disks on two other hosts are mapped to LUNs that also use this disk (Figure 68). 94 EMC Ionix ControlCenter 6.1: Taking Control of Your Datacenter Monitoring Your Datacenter Figure 68 Viewing Symmetrix disk relationships The junior administrator realizes that the host devices are likely contending for the physical disk cycles. So, the administrator reassigns the alert to the senior administrator and adds a note about the diagnosis. The senior administrator is likely to have to remap one of the host devices. Fixing a disk transfer rate alert 95 Monitoring Your Datacenter Automating the resolution to an Oracle tablespace space shortage In this example, a tablespace that belongs to the Sales database exceeds a threshold of 95 percent occupancy. The database administrator (DBA) identifies the problem by noticing an alert icon on the DBA folder in the tree. During the configuration phase, the DBA configured an autofix that would automatically trigger a script he had previously written to expand a tablespace. He attached the autofix to the tablespace alert. Following the alert trail The DBA first identifies the tablespace problem when a downward-pointing arrow appears on the DBA folder in the tree (Figure 69). Figure 69 An alert in the DBA folder During the configuration phase, the Operations Manager and DBA created the DBA folder in the tree to contain the hosts and databases for which the DBA is responsible. To find out which host or database has the problem, the DBA: 96 EMC Ionix ControlCenter 6.1: Taking Control of Your Datacenter Monitoring Your Datacenter 1. Expands the DBA folder and places a checkmark next to the folder in the tree to view the Properties of all the objects in the folder. 2. Follows the trail of arrows in the tree to discover which object has the alert. The DBA expands Databases, the sales database, and then Tablespaces. A red icon appears on the Sales object, indicating a critical or fatal alert (Figure 70). Figure 70 Locating the source of an alert The downward-pointing arrow also appears on host l82ar154 because the database instance with the alert resides on that host. Viewing the alert To view the alert text, the DBA: 1. Clicks the horizontal split-screen icon in the Properties view to create a new view. 2. Clicks Alerts on the Console toolbar to change the new view type to an Alerts view. 3. Drags the Sales tablespace from the tree to the Alerts view. The alert text appears in the view (Figure 71). Automating the resolution to an Oracle tablespace space shortage 97 Monitoring Your Datacenter Figure 71 Viewing the alert text A wrench icon appears in the Autofix column as a reminder that during configuration, an autofix was created to automatically expand a tablespace when it hits a critical threshold. The icon indicates that the autofix is currently running. While the DBA is reviewing the alert, the wrench icon changes; a green checkmark appears on top of it indicating that the autofix completed with a return code of zero (Figure 72). Figure 72 Icon indicating a successful autofix Verifying the fix To verify that the autofix script successfully expanded the tablespace, the DBA: 1. First acknowledges the alert to indicate that someone is working on the issue. 2. Clears the Properties view in the top half of the view panel. 3. Drags the tablespace from the Alerts view to the empty Properties view. The Properties view shows that the tablespace is now 24 percent free (Figure 73). 98 EMC Ionix ControlCenter 6.1: Taking Control of Your Datacenter Monitoring Your Datacenter Figure 73 Viewing Tablespace Properties Clearing the alert After confirming that the tablespace has sufficient storage space, the administrator notes the resolution for the problem, and then clears the alert from the Alerts view. Automating the resolution to an Oracle tablespace space shortage 99 Monitoring Your Datacenter 100 EMC Ionix ControlCenter 6.1: Taking Control of Your Datacenter CHAPTER 4 Configuring and Controlling Your Datacenter EMC Ionix ControlCenter simplifies the tasks around configuring and controlling your storage assets by providing tools for planning a datacenter, and creating, configuring, allocating, and provisioning storage. This chapter contains the following scenarios: ◆ ◆ ◆ ◆ ◆ ◆ ◆ Validating and optimizing a SAN configuration ............................................... Allocating storage to a host from a Symmetrix array........................................ Allocating CLARiiON devices (LUNs) to a host ................................................. Adding devices to a CLARiiON metaLUN for a host .......................................... Adding HP XP LUSEs to a host......................................................................... Deallocating storage from a host .................................................................... Allocating storage using AutoPath .................................................................. 101 119 155 163 170 179 187 Validating and optimizing a SAN configuration This example demonstrates how a storage administrator uses Ionix ControlCenter SAN Advisor™ to model and validate a SAN environment for interoperability, high availability, configuration rules, and best practices. The administrator performs the following tasks: ◆ Validates the existing SAN environment ◆ Models proposed SAN changes for interoperability, availability, and performance ◆ Builds an action plan for implementing changes ◆ Implements the changes ◆ Verifies correct plan information This configuration consists of a new HP XP 48 connected through a Brocade switch to a single Windows host. After building the existing environment in SAN Advisor, the administrator will add new hosts to the design to verify the interoperability of new configurations. Configuring and Controlling Your Datacenter 101 Configuring and Controlling Your Datacenter Logging in to SAN Advisor The administrator logs in to SAN Advisor as follows: 1. On the Start menu, selects Programs > EMC > SAN Advisor. The SAN Advisor login page appears. 2. Enters the username and password and clicks Login. The SAN Advisor home page appears (Figure 74). Figure 74 SAN Advisor home page Validating an existing SAN environment SAN Advisor takes snapshots of Ionix ControlCenter-managed environments. These snapshots help accelerate SAN design and change management by allowing you to model and validate environment changes before implementing them. The administrator takes a snapshot of the existing SAN environment from the Ionix ControlCenter Repository and directly from servers running SNMP as follows. (For information on supported host and agent details, refer to the SAN Advisor online help.) To validate the SAN, the administrator: 102 EMC Ionix ControlCenter 6.1: Taking Control of Your Datacenter Configuring and Controlling Your Datacenter 1. Enters the name of the new snapshot definition and clicks Go. The EMC Ionix ControlCenter Host page appears (Figure 75 on page 103). Figure 75 SAN Advisor Ionix ControlCenter Host page 2. Enters the Ionix ControlCenter hostname or IP address, username, and password. To use SNMP for host data collection, selects the Use SNMP box, and enters the SNMP community strings and port number. When finished, clicks Next. The Select Fabrics page appears showing all Ionix ControlCenter-managed physical fabrics and systems (Figure 76). Validating and optimizing a SAN configuration 103 Configuring and Controlling Your Datacenter Figure 76 SAN Advisor Select Fabrics page 3. Selects the appropriate checkbox to choose the fabrics to include in the snapshot. Additional devices are accessible by clicking Select Individual Systems. EMC recommends taking snapshots of either an individual fabric or two fabrics that mirror each other. Because SAN Advisor uses high-availability rules, it is important to take snapshots of mirrored fabrics for these rules to execute. If fabrics are not mirrored, EMC recommends creating a separate definition for each fabric. 4. When finished, clicks Next. The Match to EMC Support Matrix page appears (Figure 77). Figure 77 SAN Advisor Match To EMC Support Matrix page 104 EMC Ionix ControlCenter 6.1: Taking Control of Your Datacenter Configuring and Controlling Your Datacenter 5. Matches the items that do not match the EMC Support Matrix components. Matching associates a collected snapshot value with an EMC Support Matrix component and allows SAN Advisor to validate each components’ interoperability based on EMC Support Matrix information: a. Expands the items in the Managed Object column to see all system names. b. Clicks Show Items and displays all items that require matching. c. To match an item, the administrator clicks its link in the Matched To column and navigates the menus to select the correct description as shown in Figure 78. Figure 78 Matching snapshot values to EMC Support Matrix components Validating and optimizing a SAN configuration 105 Configuring and Controlling Your Datacenter d. When finished, clicks Next. The Take Snapshot page appears (Figure 79). Figure 79 SAN Advisor Take Snapshot page 6. Clicks Start Snapshot Now to begin the snapshot process. SAN Advisor confirms when the snapshot is complete. Note: You can use the Schedule Snapshots page to define how often SAN Advisor takes an environment snapshot. You can use the Report page to define who receives snapshot reports. SAN Advisor sends reports using email after a scheduled snapshot is finished. The completed snapshot appears on the SAN Advisor home page in the Snapshot Definitions and Snapshots section as shown in Figure 80. Figure 80 Completed snapshot appears on SAN Advisor Home page 7. Views the snapshot. All error, warning, or informational messages associated with the SAN environment are displayed in the Overview report. The Overview report contains design messages, diagrams, and tables that contain component details. 106 EMC Ionix ControlCenter 6.1: Taking Control of Your Datacenter Configuring and Controlling Your Datacenter Clicks the snapshot name, and then clicks View Report to view the Overview report. 8. Edits the snapshot to model changes or resolve problems, if necessary. 9. Clicks the snapshot name, and then clicks Make Copy and Edit. The snapshot is copied to the My Designs section so that it can be edited. The snapshot is now a design. Modeling proposed SAN changes The SAN design created in “Validating an existing SAN environment” on page 102 provides a baseline against which SAN changes can be modeled. Resolving the availability problem The Overview report displays a warning message which shows an availability problem on host losbd205. Two connections to the same switch in the fabric are discovered, as shown in Figure 81. Figure 81 Overview Report: availability problem Note: To run an Overview report, set this option from the snapshot setup page as show in Figure 82. Validating and optimizing a SAN configuration 107 Configuring and Controlling Your Datacenter Figure 82 Report Selection - “Overview” is checked To resolve the availability problem, the administrator: 1. On the SAN Advisor home page, under Snapshot Definitions and Snapshots, locates the appropriate snapshot and clicks Copy to My Designs. The snapshot (now a design) moves to My Designs, so that it can be edited. 2. Under My Designs, clicks the design to edit it. 3. On the page that appears, selects Tools, Connections from the top navigation bar. The Connections page appears showing the two connections to the same switch in the fabric (Figure 83). Figure 83 Availability problem: two connections to the same switch 108 EMC Ionix ControlCenter 6.1: Taking Control of Your Datacenter Configuring and Controlling Your Datacenter 4. Opens Card 10 Port 7 of the Connectrix® ED-10000M and clicks the trash can icon next to losbd205 to disconnect it from the host (Figure 84). Figure 84 Disconnecting the host from the switch 5. Opens another switch and finds a spare port to connection for the host (Figure 85). Figure 85 Reconnecting the host to different switch Validating and optimizing a SAN configuration 109 Configuring and Controlling Your Datacenter 6. Clicks the submit button to send changes (Figure 86). Figure 86 Submitting changes 7. If changes are accepted then warning message is cleared from the snapshot. Resolving an interoperability problem The Overview report also shows that an interoperability problem exists on host cawti (Figure 87). Two HBAs from different vendors are present. EMC recommends that both HBAs be from the same vendor. Figure 87 Overview Report: driver/firmware qualification issues To resolve the interoperability problem, the administrator: 1. In the object tree, under Hosts, clicks host cawti, and displays the host’s summary report. 110 EMC Ionix ControlCenter 6.1: Taking Control of Your Datacenter Configuring and Controlling Your Datacenter 2. Clicks the Host Information tab to view the HBA driver and firmware combination that is incorrect (Figure 88). SAN Advisor displays an icon to show components that do not interoperate with each other. Figure 88 Host Information page showing incompatible components 3. Clicks the trash can icon on the right side of the screen to delete the QLogic HBA. 4. Selects the correct HBA driver and firmware for the Emulex HBA from the menu (Figure 89). Figure 89 Selecting the correct HBA firmware Validating and optimizing a SAN configuration 111 Configuring and Controlling Your Datacenter 5. Clicks the Add HBA button to replace the deleted QLogic HBA with another Emulex HBA (Figure 90). This ensures that HBAs are from the same vendor, because, by default, the new HBA will be the same as the existing HBA. Now the HBA driver and firmware for both HBAs are of a qualified combination. Figure 90 Qualified HBA combination By detailing the existing configuration, the administrator can easily add individual or multiple components and test their interoperability as shown next in “Adding components to the existing configuration” on page 114. Customizing configuration rules Optionally, if the administrator wants to comply with internal business recommendations, rather than complying with the EMC Support Matrix, the administrator can edit the configuration rules, for example, to apply or not apply to certain objects. To edit a configuration rule, the administrator: 1. On the SAN Advisor home page, under My Designs, clicks the desired design. The Host Information page appears. 112 EMC Ionix ControlCenter 6.1: Taking Control of Your Datacenter Configuring and Controlling Your Datacenter 2. On the Tools menu, selects Edit Rule Set and displays the Rule Set page containing a list of all configuration rules (Figure 91). Figure 91 Rule Set page 3. Selects the checkbox next to the rule to edit and clicks Edit Conditions and displays the Rule Conditions page for the selected rule (Figure 92). Figure 92 Editing rule conditions 4. On the Conditions tab, from the pull-down menu, selects Enable Rule When, which activates the pull-down menus below it. 5. Selects the following for the four pull-down menus, so that the rule will only apply to Windows hosts: Validating and optimizing a SAN configuration 113 Configuring and Controlling Your Datacenter • Object — Host • Attribute — OS Vendor • Operator — equals • Value — Microsoft 6. Clicks Apply to Rule Set to apply the changes. Adding components to the existing configuration The administrator wants to add a new host to the existing configuration. Using the baseline established in “Validating an existing SAN environment” on page 102, the administrator can now model the new components. To add a new storage requirement and host, the administrator: 1. Copies and edits the appropriate design from the SAN Advisor home page. The Server page appears showing the Storage Requirements fields. 2. Selects New > Host or clicks the Add Another Host button and enters the new storage requirement information, which includes new hostname (New Server), requirement name, target platform, protection, and capacity (Figure 93). Figure 93 Defining a new storage requirement 3. When finished, clicks the Host Information tab. The Host Information fields appear. 4. Enters the new host information, which includes host model, operating system, and HBAs (Figure 94). 114 EMC Ionix ControlCenter 6.1: Taking Control of Your Datacenter Configuring and Controlling Your Datacenter Figure 94 Defining a new host For detailed information on the fields in the Host Information page, click the SAN Advisor online help icon in the top-right corner of the page. As you add and define components, SAN Advisor continuously checks their interoperability against the latest EMC Support Matrix data and indicates any incompatibility issues. If an incompatibility is found, an icon appears to warn of an invalid configuration. When finished, clicks Submit. The new host is now added. 5. Selects Tools > Connections. The Connections page appears (Figure 95). A red flag next to the new hostname indicates that the host is not yet connected. Validating and optimizing a SAN configuration 115 Configuring and Controlling Your Datacenter Figure 95 SAN Advisor Connections page 6. To connect the new host’s HBA ports to the fabric, expands the new host on the left (New Server) and expands the switch on the right. 7. Clicks one end of the connection, then the other end of the connection to connect the two points. A connection is shown in Figure 96. Figure 96 Connecting the new host’s HBA port 8. When finished, clicks Submit. The new host is now connected as shown in Figure 97. 116 EMC Ionix ControlCenter 6.1: Taking Control of Your Datacenter Configuring and Controlling Your Datacenter Figure 97 The new host is connected The administrator can now compare the designs and verify whether the new host was added correctly as shown in “Building an action plan” on page 117. Building an action plan Building an action plan consists of comparing snapshots and correcting any problems found. The administrator compares the original snapshot with the new design. To complete this task, the administrator: 1. Navigates to the SAN Advisor home page. 2. In the Compare column, checks the original design snapshot and the new design snapshot (Figure 98). Validating and optimizing a SAN configuration 117 Configuring and Controlling Your Datacenter Figure 98 Selecting snapshots for comparison 3. Clicks Compare. The newly added host should be the only difference seen in these designs (Figure 99). Figure 99 Compare report showing newly-added host 118 EMC Ionix ControlCenter 6.1: Taking Control of Your Datacenter Configuring and Controlling Your Datacenter Implementing changes Using SAN Advisor’s Compare Report as a guide to install, connect, and configure the new host and storage requirement, the administrator should verify that: ◆ The host contains all required software, HBAs, and drivers. ◆ The host can connect to the storage array where its storage requirement resides. ◆ The storage requirement is protected by the appropriate RAID level. ◆ The storage requirement has the required local and remote replicas. Verifying correct plan information To verify that the changes are correct, the administrator: 1. Takes a second snapshot of the Ionix ControlCenter environment where the host was added, as described in “Validating an existing SAN environment” on page 102. 2. Checks the appropriate snapshots for comparison, and clicks Compare, as described in “Building an action plan” on page 117. 3. Compares the snapshot to the design containing the recently modeled changes. If the new host was implemented correctly, the Compare Report will not contain any differences (Figure 100). Figure 100 Comparing snapshots Allocating storage to a host from a Symmetrix array This example demonstrates adding additional storage from a Symmetrix array to a new Sun Solaris database host (l82ar156) that has been added to the datacenter. Allocating storage to a host from a Symmetrix array 119 Configuring and Controlling Your Datacenter An Oracle DBA has requested 40 GB of RAID 1 storage with local replica for the new database host. The system administrator determines that they need to find and allocate a total of 120 GB of space (40 GB for the standard devices, 40 GB for the mirror devices, and 40 GB for the BCV devices) to meet their RAID protection and local replica business requirements. The host and the Symmetrix array are physically connected to the same fabric as shown in Figure 101. Figure 101 New database host l82ar156 added to the environment Determining if there is enough storage on the Symmetrix array The system administrator needs to find and allocate a total of 120 GB of storage for the new database host. The administrator creates a custom StorageScope report to determine the amount of configured, allocated, and unconfigured storage available on this array. The administrator uses the most up-to-date data for generating the StorageScope reports used in this section. Otherwise, the administrator could be basing device allocation on old data that is no longer valid for this configuration. To do this, the administrator: 1. Opens a web browser window and enters the following URL: https://<StorageScope_host_name>:30002/srm where <StorageScope_host_name> is the name of the host on which StorageScope is installed. 120 EMC Ionix ControlCenter 6.1: Taking Control of Your Datacenter Configuring and Controlling Your Datacenter 2. Enters the Ionix ControlCenter login. The dashboard appears. 3. On the StorageScope menu, selects Analysis > Queries > Query Builder. 4. Selects Create to launch the Query Builder Wizard. Note: For detailed instructions on using the Query Builder Wizard, refer to the StorageScope online help. 5. On the Define Initial Settings step of the wizard, sets Name, Description, and Time Period settings for the query (Figure 102 on page 121). 6. Since the query will be returning data based on the present configuration of the managed environment, selects Current Data. Figure 102 Define Initial Settings step of the query builder 7. Clicks Next to move to the Areas of Interest page of the query wizard (Figure 103). 8. On the Areas of Interest page, selects Arrays from the Arrays grouping. Allocating storage to a host from a Symmetrix array 121 Configuring and Controlling Your Datacenter Figure 103 Areas of Interest step of the query builder 9. Clicks Next to move to the Select Columns page of the query wizard (Figure 104). 10. Adds the following columns to the query: • Arrays.Array Name • Arrays.Array S/N • Arrays.Array Type • Arrays.Array Vendor • Arrays.Array Model • Arrays.Array Cache • Arrays.Physical Capacity • Arrays.Unconfigured • Arrays.Configured • Arrays.#Cache Slots 122 EMC Ionix ControlCenter 6.1: Taking Control of Your Datacenter Configuring and Controlling Your Datacenter • Arrays.#LUNs • Arrays.#Array Ports • Arrays.#Disks • Arrays.Last Power On • Arrays.Symmetrix Family Figure 104 Select Columns step of the query builder Note: The columns listed above containing the appellation “UDF” are Ionix ControlCenter User-Defined Fields. User-Defined Fields are custom fields created by the user and are specific to the user’s environment. UDF fields listed in this document are merely examples of custom fields a user may wish to add as attributes for managed objects in their environment, they will neither exist in your Ionix ControlCenter installation nor be shown in figures in this document. For more information about working with User-Defined Fields, refer to the Ionix ControlCenter online help or to the EMC Technical Note Using Custom Fields in StorageScope Queries. Allocating storage to a host from a Symmetrix array 123 Configuring and Controlling Your Datacenter 11. Clicks Next to go to the Create Filters step of the query wizard (Figure 105). 12. Creates a filter for the array of interest as follows: 13. Under Column Name selects “Arrays.Array Name”. 14. Under Operator selects “equal to ”. 15. Under Value enters “000187400075”, which is the name of the symmetrix array of interest. Figure 105 Create Filters step of the query builder 16. Clicks Next to go to the Select Sorting, Grouping & Total Options step of the query wizard. 17. Leaves the default options in place and clicks Next to go to the Select Run Settings step of the query wizard. 18. Chooses the default output options for the query and clicks Save to save the query. 124 EMC Ionix ControlCenter 6.1: Taking Control of Your Datacenter Configuring and Controlling Your Datacenter Note: If this Query is likely be run again in the future; EMC recommends saving it for later use. 19. Clicks Run Now to run the query. The query output lists only the array of interest (Figure 106). Figure 106 StorageScope report showing unconfigured capacity The report shows that there is 2635.24 GB configured, 2575.61 GB allocated, and 331.64 GB unconfigured storage available. Since the administrator needs 120 GB of storage for the new host, there is enough additional storage on this array to meet their requirements. Determining if type of connection is available The administrator uses the Topology view in the Ionix ControlCenter Console to verify that Fibre Channel connections to the array exist. To determine if the required connections exist, the administrator: 1. Clicks the Topology button on the Console toolbar. 2. In the Console tree, expands the folders Storage Systems, Symmetrix. The Symmetrix arrays appear. 3. Drags the array (000187400075) into the Topology view (Figure 107). The administrator turned on Show Links to see the cabling that is in place for this fabric. The administrator is using WWN zoning and will need to create a zone and add it to the zone configuration for the Mainstreet_3800 fabric. Allocating storage to a host from a Symmetrix array 125 Configuring and Controlling Your Datacenter Figure 107 Determining if desired type of connection is available The Topology view shows that Fibre Channel connectivity to the host exists. Determining if ports that meet requirements are available The administrator needs to determine if ports are available on the array, and if the available ports meet requirements such as fan-in ratio, I/O, devices per channel, and so on. The administrator uses the EMC Support Matrix available on the EMC online support website (http://powerlink.emc.com)to determine if the current configuration can support the new host. To complete this task, the administrator: ◆ Verifies port settings. ◆ Verifies fan-in ratio. ◆ Determines devices per channel. ◆ Determines port throughput. Verifying port settings Port flag settings on the Symmetrix array control how the array communicates with each host type. The administrator needs to select a port based on the port flag settings to ensure that the port can communicate with the HBA in the new Sun host. The most up-to-date information for port flag settings can be found in the EMC Support Matrix on the EMC online support website. 126 EMC Ionix ControlCenter 6.1: Taking Control of Your Datacenter Configuring and Controlling Your Datacenter To do this, the administrator: 1. In the Console tree, expands the folders Storage Systems, Symmetrix. 2. Expands the array (000187400075) and the folder Host Directors. 3. Right-clicks FA-3D and selects Port and Director Configuration, Port Flag Settings. The Port Flag Default Settings wizard appears (Figure 108 on page 127). Figure 108 Port Flag Default Settings dialog box 4. Clicks Next and displays the next page of the wizard (Figure 109). Figure 109 Port Flag Setting dialog box Allocating storage to a host from a Symmetrix array 127 Configuring and Controlling Your Datacenter 5. Verifies the flag settings for the host operating system against the EMC Host Support Matrix. 6. Clicks Help and displays the online Help that describes the flag settings. 7. Clicks Cancel to close the wizard once the port flag settings are confirmed. The administrator has now verified that FA-3D Port 0 and the new host HBA are compatible. Verifying fan-in ratio The administrator uses Path Details view to determine the number of HBAs connected to the selected Symmetrix port to ensure that the fan-in ratio stays within EMC guidelines based on the EMC Support Matrix on the EMC online support website. To do this, the administrator: 1. On the Console toolbar, clicks the pull-down menu of the blue Storage Allocation button and selects Path Details. 2. In the Console tree, expands the Symmetrix array down to the director (Storage Systems, Symmetrix Arrays, 000187400075, Host Directors, FA-3D), and then drags Port 0 into the target panel. A table showing the path details for this host appears if there are HBAs zoned to this port, or, if not (as in this case), the target panel displays the message: There are no paths to display in this view. Determining devices per channel The administrator uses Properties view to determine the number of devices on the selected port to ensure that the configuration stays within EMC guidelines based on the EMC Support Matrix on the EMC online support website. To do this, the administrator: 1. On the Console toolbar, clicks the Properties view button. 2. In the Console tree, expands the Symmetrix array down to the director (Storage Systems, Symmetrix Arrays, 000187400075, Host Directors, FA-3D), and then drags Port 0 into the Properties view. The number of devices connected to the port are displayed in the # Devices column (Figure 110). 128 EMC Ionix ControlCenter 6.1: Taking Control of Your Datacenter Configuring and Controlling Your Datacenter 3. Compares the number of devices on the channel to the EMC Support Matrix and determines that this configuration falls within the guidelines. Figure 110 Using Properties view to determine the number of devices on FA-3D Port 0 Determining port throughput FA-3D Port 0 is not a member of the active zone set. This means that it is an unused port on the Symmetrix array and has no throughput. The Performance View displays port throughput and can be used to determine if a port is unused. Figure 111 shows an example of how a port with no throughput appears in the Performance View with the Port Throughput and Port I/O both displaying a value of “0”. Figure 111 Using Performance view to determine the throughput on FA-3D Port 0 In situations where throughput might be an issue, the administrator can use Ionix ControlCenter Performance Manager (which is not installed in this scenario, but is demonstrated in “Identifying a storage array performance problem” on page 64) to check port throughput. Allocating storage to a host from a Symmetrix array 129 Configuring and Controlling Your Datacenter Determining if configured storage is available The administrator uses Free Space view and Properties view to determine if configured storage is available on the Symmetrix array. To do this, the administrator: 1. On the taskbar, clicks the pull-down menu on the blue Storage Allocation button and selects Free Space. 2. In the Console tree, expands the folders Storage Systems, Symmetrix, and selects the checkbox beside Symmetrix array 000187461272. Figure 112 Free Space view showing available unmapped storage The Free Space view shows that there is not enough available unmapped storage. The administrator will configure additional storage on this array to meet their requirements. The administrator now splits the target panel horizontally using Alt-Shift-h, clicks the Properties view button, and drags the array into the Properties view to confirm that unconfigured storage is available on the array (Figure 113). There is 331.64 GB of unconfigured storage available. 130 EMC Ionix ControlCenter 6.1: Taking Control of Your Datacenter Configuring and Controlling Your Datacenter Figure 113 Properties view showing unconfigured storage Configuring unconfigured storage The database on the new Solaris host needs at least 40 GB (mirrored) of storage. Since the Symmetrix array uses 8.46 GB standards, the administrator needs to create five 8.46 GB drives, and five 8.46 GB unprotected devices that will be converted to BCVs. To do this, the administrator: 1. In the Console tree, expands the folders Storage Systems, Symmetrix. The Symmetrix arrays appear. 2. Right-clicks the Symmetrix array and selects Device Configuration, Logical Device Configuration. The Logical Device Configuration dialog box appears (Figure 114 on page 131). Figure 114 Logical Device Configuration dialog box Allocating storage to a host from a Symmetrix array 131 Configuring and Controlling Your Datacenter 3. Creates five standard volumes and five unprotected volumes, each containing 18,484 cylinders (equivalent to 8.46 GB) as follows: Adds five standard devices to the configuration as follows: a. In the No. Volumes to create field, enters 5. b. For the size, enters 18484 Cylinders (which is equivalent to 8.46 GB size). c. For configuration, selects Mirror-2 devices. d. Clicks Add to add the configuration to the Requested Configuration table. At the bottom of the Requested Configuration table, the Configuration Total shows how much space will be used to create the configuration. 4. Adds five unprotected devices to the configuration (for use as BCVs) as follows: a. In the No. Volumes to create field, enters 5. b. For the size, enters 18484 Cylinders (which is equivalent to 8.46 GB size). c. For configuration, selects UNPROTECTED, which automatically disables SAVE device type. d. Clicks Add to add the configuration to the Requested Configuration table. At the bottom of the Requested Configuration table, the Configuration Total shows how much space will be used to create the configuration. 5. Clicks Execute to run the proposed configuration. It takes several minutes to create the devices. When the execution steps have completed, the administrator is prompted to close the window. 6. In the Console tree, expands the Symmetrix array and expands the folders Unmapped Devices, Standard Devices. The 10 devices that were just created appear at the bottom of the list. 7. Selects the devices and drags them into the Properties view to verify that there are five two-way mirrored and five unprotected devices. Figure 115 on page 133 shows the 10 devices: five two-way mirrored devices and five unprotected devices. 132 EMC Ionix ControlCenter 6.1: Taking Control of Your Datacenter Configuring and Controlling Your Datacenter Figure 115 Symmetrix devices Creating BCVs The administrator now creates BCVs from the unprotected devices they just created. To do this, the administrator: 1. Selects the five unprotected devices from the Properties view. 2. Right-clicks the selected device and selects Device Configuration, Device Type Definition. The Device Type Definition dialog box appears (Figure 116). 3. Selects the devices and clicks the BCV button. Each devices’ type changes to BCV and is highlighted in blue (Figure 116). Allocating storage to a host from a Symmetrix array 133 Configuring and Controlling Your Datacenter Figure 116 Define BCVs 4. Clicks Execute to start the device type conversion. 5. Closes the window when the device type conversion is complete. 6. Uses the Properties view to ensure that the devices were changed to BCVs. Now that the BCVs have been created, the administrator can map the new standard devices to the FA port. Configuring the connection The administrator configures the connection to the Symmetrix storage array by: ◆ Mapping devices to the FA port. ◆ Adding the host and Symmetrix ports to a new Cisco VSAN. ◆ Zoning the Symmetrix to the host. ◆ Masking the devices. Mapping devices to a FA port In previous sections, the administrator found an available port (FA-3D Port 0) on the Symmetrix array and confirmed that it is suitable for this configuration. Now, the administrator uses Symmetrix Device Reallocation (SDR) to map the new standard and BCV devices to the FA port. 134 EMC Ionix ControlCenter 6.1: Taking Control of Your Datacenter Configuring and Controlling Your Datacenter Gatekeeper devices may also need to be added to the host depending on what kind of information needs to be collected from the Symmetrix array. To do this, the administrator: 1. In the Console tree, right-clicks the Symmetrix array (000187400075) and selects Device Mapping > SDR Device Mapping. Ionix ControlCenter acquires a lock on the Symmetrix array and the SDR Device Mapping dialog box appears (Figure 117). Figure 117 SDR Device Mapping dialog box 2. Under Select Devices, expands Unmapped Devices, and selects the standard devices (created in the previous sections) and gatekeeper devices (if required) to map to the FA port. 3. Under Select a Port, expands Host Directors and selects the director and port: FA-3D Port 0. 4. Selects Port 0, to highlight it, and clicks Copy. The devices move from the left panel to the right panel under the selected port. 5. Repeats this procedure to add the new BCVs. The administrator selects FA-3C Port 0. 6. Clicks Continue to commit the changes. The dialog box displays the proposed changes. 7. Clicks Execute to perform the changes. The screen is updated as the changes are made. Allocating storage to a host from a Symmetrix array 135 Configuring and Controlling Your Datacenter When the execution steps have completed, the administrator is prompted to close the window. Configuring the new interoperability VSAN The administrator needs to create a virtual SAN (VSAN) in the physical fabric Mainstreet_3800. Mainstreet_3800 is a Cisco fabric consisting of two Cisco MDS switches: Cisco9216i (the master switch) and Cisco9216A. Solaris host l82ar156 and the port on Symmetrix 000187400075 to which the new devices are mapped are members of the physical Mainstreet_3800 fabric. Host l82ar156 is connected to switch Cisco9216i and Symmetrix port FA-3D Port 0 is connected to switch Cisco9216A. These two switches are physically connected to each other through an interswitch link. Creating a VSAN involves the following tasks: ◆ Configuring the switch ports connected to Host l82ar156 and to storage port FA-3D Port 0 in the same Cisco VSAN, which is necessary because the VSAN acts as an independent fabric with its own exclusive zoning structure. ◆ Adding the host and storage ports to the same zone, adding the zone to a zone set, and then activating the zone set on the VSAN. See “Zoning the host and storage ports” on page 141. To create a VSAN, the administrator: 1. In the Console tree expands the folders Connectivity, Fabrics, Mainstreet_3800 [Fabric]. 2. Right-clicks the VSAN folder and selects New. The VSAN wizard appears (Figure 118). 136 EMC Ionix ControlCenter 6.1: Taking Control of Your Datacenter Configuring and Controlling Your Datacenter Figure 118 Step 1 of the VSAN wizard 3. In step 1 of the VSAN wizard, performs the following actions: a. Enters the VSAN ID and VSAN name. b. Selects the load balancing method, and switch membership. c. For Interop Value, selects Interop-1 to allow for the addition of interop-enabled Brocade or McDATA switch ports via the switch's management software at a later time. d. Checks switches Cisco9216i and Cisco9216A in the table. e. Clicks Next. Step 2 of the VSAN wizard appears (Figure 119 on page 138). Allocating storage to a host from a Symmetrix array 137 Configuring and Controlling Your Datacenter Figure 119 Step 2 of the VSAN wizard with switch Cisco9216A selected 4. In step 2 of the VSAN wizard, performs the following actions: a. Selects the port type, the switch (Cisco9216i and Cisco9216A separately), and the slot to narrow the range of ports and displays in the Available Members table and clicks Filter. b. For Display by, selects to display ports in the Available Members table by port Member Name or by port WWN. c. In the Available Members table, selects: – Cisco switch port Slot1/Port 02, which is connected to host l82ar156. – Cisco switch port Slot2/Port 05, which is connected to Symmetrix port FA-3D Port 0. d. Clicks Add to move both ports to the Selected Members table. Note: The administrator could optionally click Move Members from Other VSANs to remove selected members out of other VSANs and into the VSAN wizard's Select Members table (Figure 120 on page 139). 138 EMC Ionix ControlCenter 6.1: Taking Control of Your Datacenter Configuring and Controlling Your Datacenter Figure 120 Move Members From Other VSANs dialog box 5. Clicks Next. Step 3 of the VSAN wizard appears (Figure 121). 6. Clicks Review Properties to review the properties of the VSAN. 7. Clicks Review Members to review the members of the VSAN. Figure 121 Step 3 of the VSAN wizard Allocating storage to a host from a Symmetrix array 139 Configuring and Controlling Your Datacenter Note: The administrator can click Review Zoning Changes to view the zoning changes that would have occurred had ports been moved from other VSANs (Figure 122 on page 140). Figure 122 Review Zoning Changes dialog box 8. Clicks Next. Step 4 of the VSAN wizard appears. 9. Selects one of the following options: • Distribute and commit VSAN now and copy running config to startup config. Then selects Cancel operation or Continue and overwrite. The VSAN edits will appear both in Ionix ControlCenter and on the fabric. • Save changes to the planned VSAN folder in the physical fabric. After the task succeeds on the Ionix ControlCenter Server, the new VSAN appears in Ionix ControlCenter in the fabric's Planned VSANs folder, but does not appear on the fabric. 10. Clicks Execute. 11. On the Execute dialog box, selects task list options to send the task list to the Ionix ControlCenter Server for execution. 12. Clicks OK. The new VSAN0006 appears in the in the Ionix ControlCenter tree in the Planned VSANs folder under Connectivity, Fabrics, Mainstreet_3800 [Fabric]. 140 EMC Ionix ControlCenter 6.1: Taking Control of Your Datacenter Configuring and Controlling Your Datacenter Zoning the host and storage ports Now that Host l82ar156 and Symmetrix port FA-3D Port 0 are configured in the same virtual fabric (VSAN 0006), the administrator can zone them together in an active zone set, so that I/O between the host and array can occur. Creating a Zone and Adding Member Ports To create a new zone and populate it with the required host and FA ports, the administrator: 1. In the Console tree, expands the folders Connectivity, Fabrics, Mainstreet_3800 [Fabric], Planned VSANs, VSAN0006. 2. Right-clicks the Planned Zones folder and selects New > Zone (Figure 123 on page 141). Figure 123 Opening the New Zone dialog box 3. In the New Zone dialog box, accepts the default zoning policy (None), or selects a zoning policy from the Zoning Policy menu (Figure 124 on page 142). Allocating storage to a host from a Symmetrix array 141 Configuring and Controlling Your Datacenter Figure 124 New Zone dialog box Note: Zoning policies specify certain characteristics of new zones, and help to ensure that these characteristics are the same across all zones created in a fabric or a work group. Once a zone is created, however, the policy that was applied during zone creation or editing no longer has any effect on the zone. 4. For Zone, enters Zone_l82ar156 for the name of the new zone. 5. In the Available Ports table, selects host l82ar156 and storage port FA-3D, Port 0, (Member 5006048acadfe2d2). 6. Clicks Add to move the host and storage port to the Ports in Zone table. Ports moved from one table to the other in the current session are displayed in blue italics. Note: The administrator can use the two drop-down filter lists to manage the display of ports/aliases that appear in the Available Ports table. The first list filters by fabric; the second filters by port type or zoning type. 7. Clicks OK to save changes and closes the dialog box. 142 EMC Ionix ControlCenter 6.1: Taking Control of Your Datacenter Configuring and Controlling Your Datacenter Note: New zone Zone_l82ar156 is now created with host l82ar156 and Symmetric port FA-3D, Port 0 as members. The new zone appears in the Console tree under Connectivity, Fabrics, Mainstreet_3800 [Fabric], Planned VSANs, VSAN0006, Planned Zones. Adding a zone to a zone set and activating the zone set Host l82ar156 and storage port FA-3D, Port 0 now exist in zone Zone_l82ar156. The administrator now adds the zone to a zone set and activates the zone set on virtual SAN VSAN0006. The administrator can add the zone to an existing zone set or create a new zone set. In this example the administrator creates and activates new zone set Zone_Set_156. To complete this task, the administrator: 1. In the Console tree, expands the folders Connectivity, Fabrics, Mainstreet_3800 [Fabric], Planned VSANs, VSAN0006, Planned Zones. 2. In the Planned Zones folder, right-clicks Zone_l82ar156 and selects Zoning, Add Zone to Zone Set (Figure 125). Figure 125 Adding a zone to a zone set Allocating storage to a host from a Symmetrix array 143 Configuring and Controlling Your Datacenter The Add To Zone Set dialog box appears with Zone_l82ar156 in the Zones In Zone Set table (Figure 125 and Figure 126). Figure 126 Add To Zone Set dialog box 3. In the Add to Zone Set dialog box, selects New Zone Set and enters Zone_Set_156. 4. Checks Activate zone set immediately. 5. Clicks Save and Continue. The edits are saved, and the Activate Zone Set dialog box appears displaying the differences between the zone set about to be activated on the fabric and the zone set currently active in the Ionix ControlCenter Repository (Figure 127). 144 EMC Ionix ControlCenter 6.1: Taking Control of Your Datacenter Configuring and Controlling Your Datacenter Figure 127 Viewing zone set differences before activating the zone set 6. Reviews the zone set differences and then clicks Continue. 7. In the confirmation dialog box that appears, selects one of the following options on the confirmation dialog box: • Cancel operation — Cancels the activate zone set operation if the active zone set on the fabric is out of sync with the active zone set in Ionix ControlCenter. • Continue and overwrite — Activates the new zone set even if the zone set active on the fabric is different from the Ionix ControlCenter active zone set. The new zone set overwrites the zone set that is currently active on the fabric without saving a copy. 8. Clicks Execute. When Ionix ControlCenter activates a zone set, it overwrites the active zone set on the fabric. If the active zone set on the fabric has been changed using a third-party tool, it may be out of sync with the active zone set in Ionix ControlCenter. Ionix Allocating storage to a host from a Symmetrix array 145 Configuring and Controlling Your Datacenter ControlCenter does not save copies of zoning configurations that it overwrites on the fabric. To avoid loss of data, make copies of the fabric’s active zone set with a third-party tool before using Ionix ControlCenter to activate a zone set. Whether the operation succeeds or fails, the administrator can view the zone set differences in the Ionix ControlCenter task list. The following changes occur in the zoning folders in the Ionix ControlCenter tree (Figure 128 on page 146): • A copy of the activated zone set replaces the zone set in the Active Zone Set folder. • A copy of the activated zone set replaces the Copy of Active zone set in the Planned Zone Sets folder. • A copy of the previous active zone set replaces the Last Active zone set in the Planned Zone Sets folder. Figure 128 New tree configuration after activating Zone_Set_156 on fabric VSAN 0006 Masking devices Now that host l82ar156 and Symmetrix port FA-3D, Port 0 are actively zoned together, the administrator now uses the Ionix ControlCenter masking utility to configure secure host access to the Symmetrix array. The administrator grants host access to several storage devices mapped to port FA-3D Port 0. 146 EMC Ionix ControlCenter 6.1: Taking Control of Your Datacenter Configuring and Controlling Your Datacenter The administrator already enabled masking on the Symmetrix array by setting the volume configuration management (VCM) port flag (see “Verifying port settings” on page 126). While masking remained disabled on the array, all hosts that were physically connected to storage ports on the array could access all the storage devices mapped to them. Granting host access To grant host access to the Symmetrix storage array, the administrator: 1. Clicks the Storage Allocation pull-down arrow in the Console taskbar, and selects Masking to display the Masking view. 2. In the Console tree, expands Hosts, l82ar156, Adapters, qlogic-qla2000-1 and checks Host Port 1 to add the port to Masking view (Figure 129 on page 147). Figure 129 Symmetrix Masking view 3. In the Masking view, performs the following: a. For 1-Select Storage Type, selects Symmetrix. b. For 2-Select Storage Array, selects SAN Zoned Storage, and then selects array 000187400075 in the results window. Allocating storage to a host from a Symmetrix array 147 Configuring and Controlling Your Datacenter c. For 3-Select Storage Port, selects Port 0@FA-3D. You can select multiple storage ports, if necessary. Only VCM-enabled adapters and ports are displayed for Symmetrix arrays. d. For 4-Select Device Filter Options, applies filters to the selection. e. Clicks 5-Show Devices and displays storage devices that meet the filter criteria in the Masking view display area. Note: The administrator can drag an LDEV from Masking view into Path Details view to quickly identify all the hosts that have access to it. 4. Right-clicks one or more logical devices and selects Grant Masking. 5. The Modify Masking Configurations-Preview Changes dialog box appears (Figure 130 on page 148). Figure 130 Modify Masking Configuration dialog box 148 EMC Ionix ControlCenter 6.1: Taking Control of Your Datacenter Configuring and Controlling Your Datacenter Note: Optionally, the administrator could click Edit Changes to close the dialog box and return to the Masking view and make further modifications, or delete a masking operation(s) by selecting it in the table and clicking Delete Actions. 6. Previews the grant masking actions. 7. Checks Activate the VCMDB to automatically refresh the grant access actions to all the Fibre Channel adapters on the Symmetrix array. If the administrator does not check Activate the VCMDB, the administrator must manually run the Make Active command in Ionix ControlCenter after the grant access tasks have finished running on the Ionix ControlCenter Server. 8. Clicks Execute. After the operation executes on the Ionix ControlCenter Server, host l82ar156 has secure access to the selected devices on Symmetrix 30471 port FA-3D, Port 0. The modifications are visible to all the hosts that are connected to the Symmetrix storage array. If the change is not reflected in the Console, the administrator can reboot the host and run the host agent to rediscover the HBA. Creating device groups The administrator creates a device group containing the standards and BCVs to simplify the process of establishing devices. Placing both standards and BCVs in the same device group allows the administrator to establish all devices at once instead of individually. To do this, the administrator: 1. In the Console tree, expands the folders Storage Systems, Symmetrix. 2. Expands the Symmetrix array (000187400075), the folder Mapped Devices, and then Standard Devices. 3. Selects the standard devices for the host: 1F4 through 1F8. 4. Right-clicks the highlighted devices and selects Data Protection, Device Groups, Create. Step 1 of the Device Group Wizard appears (Figure 131). Allocating storage to a host from a Symmetrix array 149 Configuring and Controlling Your Datacenter Figure 131 Device Group Wizard 5. For Device group type, selects Regular, and then clicks Next. Step 2 of the Device Group Wizard appears (Figure 132). 150 EMC Ionix ControlCenter 6.1: Taking Control of Your Datacenter Configuring and Controlling Your Datacenter Figure 132 Creating a device group 6. Selects the host in which the device group will be created: l82ar156. 7. Under Device Group Name, clicks Add Members to a New Device Group. 8. Enters the name for the new device group: databasedg If the administrator needs to add or remove members from the device group, they can click the Edit Members button. 9. Clicks Next when finished with the selections. Step 3 of the Device Group Wizard appears (Figure 133). Allocating storage to a host from a Symmetrix array 151 
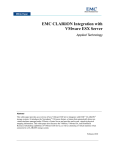
Configuring and Controlling Your Datacenter Figure 133 Associating devices to the device group 10. Selects the Associate BCV checkbox. 11. Enters the number of BCV sets and clicks Next. The administrator enters 1, for one copy of the database. The wizard chooses the BCVs and enters them in the Final Devices column. 12. Removes the BCV devices selected in the wizard and replaces them with the BCV devices created earlier (1F9 through 1FD). The administrator can make changes by highlighting a device and clicking Add or Remove. 13. Clicks Next. The administrator is prompted to confirm the configuration before creating the device groups. 14. Clicks Finish to confirm the configuration. 152 EMC Ionix ControlCenter 6.1: Taking Control of Your Datacenter Configuring and Controlling Your Datacenter A pop-up box confirms that the device group was created. 15. Clicks Finish to complete the task. 16. Verifies that the device group was created by expanding the host in the Console tree and then the folder Device Groups. The device group appears (Figure 134). Figure 134 List of device groups Establishing BCVs with standard devices The administrator establishes the BCVs with the standards. To do this, the administrator: 1. In the Console tree, expands the folder Hosts, host l82ar156, and the folder Device Groups. 2. Right-clicks device group databasedg and selects Data Protection > TimeFinder > Establish. The TimeFinder Establish dialog box appears (Figure 135 on page 154). Allocating storage to a host from a Symmetrix array 153 Configuring and Controlling Your Datacenter Figure 135 Establishing BCVs with standard devices 3. Clears the Incremental checkbox, and then clicks Execute. The BCV will be established to the standard. 4. On the task bar, from the blue Performance Management button, selects TimeFinder/SRDF QoS, and displays the EMC TimeFinder®/EMC SRDF® QoS view. 5. Selects the device group to watch the progress of the establish in the view. Once the device groups have established, the devices can be updated on the host system. Discovering host devices The administrator has completed storage allocation and now updates the disk information on the host after the configuration change. To do this, the administrator: 1. In the Console tree, right-clicks host l82ar156 and selects Host, Rescan Disks. Note: Host agent must be installed in order to see the Hosts, Rescan Disks option. A login dialog box appears the first time during the session when an attempt is made to perform a command that requires user authentication on this host. 154 EMC Ionix ControlCenter 6.1: Taking Control of Your Datacenter Configuring and Controlling Your Datacenter 2. Enters the Username and Password that provide the necessary privileges to complete the rescan task on this host. 3. Once the rescan completes, right-clicks host l82ar156 and selects Rediscover. The Discover data collection policy runs, and the host information in the Console is updated (Figure 136). Figure 136 New devices are visible to the host Allocating CLARiiON devices (LUNs) to a host This example demonstrates allocating storage from a CLARiiON® CX600 array to an IBM AIX application server (l82ar156). The storage administrator is adding 10 GB of RAID 5 storage to the host. The administrator completes the following tasks to allocate storage from the CLARiiON array: ◆ Ensures the CLARiiON storage is accessible from the host ◆ Finds the available storage ◆ Creates new LUNs if necessary ◆ Adds LUNs to an existing storage group (or creates a new one) so the host sees the LUNs Determining if storage is available on the CLARiiON array The administrator determines if there is available storage on the CLARiiON array through a StorageScope Array Summary report. Allocating CLARiiON devices (LUNs) to a host 155 Configuring and Controlling Your Datacenter To do this, the administrator: 1. In the Console tree, expands the folders Storage Systems, CLARiiON. 2. Right-clicks the array (WRE00022201023) and selects StorageScope Views. The StorageScope log in screen appears. 3. Enters the username and password. 4. From StorageScope console selects Analysis > SRM Views > Arrays. 5. Under Consumption Details tab selects WRE00022201023. 6. The Array Configuration report for this array is generated (Figure 137). Figure 137 StorageScope array configuration report for the CLARiiON Array The administrator determines that there is 1,332.77 GB of unconfigured space, 4,598.07 GB of raw configured space, and 890.00 GB of raw allocated space on this array. Determining if type of connection is available The administrator intends to add new storage to host l82ar136 and checks to ensure that the array is accessible. To do this, the administrator: 156 EMC Ionix ControlCenter 6.1: Taking Control of Your Datacenter Configuring and Controlling Your Datacenter 1. On the Console toolbar, clicks the pull-down menu of the blue Storage Allocation button and selects Path Details. 2. In the Console tree, expands the folder Hosts, and then drags host l82ar136 into the target panel. 3. Selects the host to show devices. A table showing the path details by HBA for this host appears. 4. Clicks any HBA in the table. The Path details for the host appear as shown in Figure 138. Figure 138 Path Details for host l82ar136 Figure 138 shows that there is connectivity between the host and the CLARiiON array (WRE00022201023). Because the path already exists, the administrator does not need to determine if ports are available, and can skip that portion of the workflow. Determining if configured storage is available The administrator determines if there is available configured storage on the CLARiiON array through the StorageScope Array Configuration report generated in “Determining if storage is available on the CLARiiON array” on page 155. The StorageScope Array Summary report is shown in Figure 139 on page 158. Allocating CLARiiON devices (LUNs) to a host 157 Configuring and Controlling Your Datacenter Figure 139 StorageScope report showing available configured storage The administrator determines that there is over 150 GB of available configured unallocated storage. The administrator also needs to ensure that the available storage is the correct protection type (RAID 5). To do this, the administrator: 1. On the Console toolbar, clicks the Properties view button. 2. In the Console tree, expands the CLARiiON array. 3. Drags the unmapped LUNs into the Properties view. 4. Sorts on the Configuration column (by clicking the column heading). This shows the RAID-level protection of the LUNs. Configuring the connection The administrator determined in the previous section that LUNs are available for allocation. If LUNs were not available for allocation, the administrator could create the LUNs using Ionix ControlCenter Navisphere Manager. The administrator allocates the existing LUNs as follows: ◆ 158 Determines if a storage group exists EMC Ionix ControlCenter 6.1: Taking Control of Your Datacenter Configuring and Controlling Your Datacenter ◆ Finds available LUNs ◆ Adds LUNs to the storage group Determining if storage group exists The LUNs will be placed in a storage group for the host. Only one storage group can exist per host. The administrator determines that a storage group already exists by selecting the host in the Console tree, and selecting Storage Allocation, Path Details in the toolbar. Figure 140 shows that the existing storage group is named l82ar136_AIX. If this host did not have a storage group, the administrator could have created a new one by right-clicking Storage Groups under the CLARiiON array in the Console tree and selecting New. This displays the Storage Group Configuration Wizard. Figure 140 Storage group Finding available LUNs The administrator finds the available (unmapped) LUNs on the array by right-clicking Unmapped LUNs under the CLARiiON array in the Console tree and selecting Properties. Host l82ar136 requires 10 GB of RAID 5 storage. LUN 1 will meet host’s needs as shown in Figure 141. Allocating CLARiiON devices (LUNs) to a host 159 Configuring and Controlling Your Datacenter Figure 141 Available unmapped LUNs The administrator adds the LUNs to storage group l82ar136_AIX through the Storage Group Configuration Wizard. To do this, the administrator: 1. In the Console tree, expands the folders Storage Systems, CLARiiON Arrays, WRE00022201023, Storage Groups. 2. Right-clicks storage group l82ar136_AIX and selects Edit. The Storage Group Configuration Wizard appears displaying the storage group the administrator intends to edit. 3. Clicks Next. The Add/Remove LUNs screen appears (Figure 142 on page 161). 160 EMC Ionix ControlCenter 6.1: Taking Control of Your Datacenter Configuring and Controlling Your Datacenter Figure 142 Adding LUNs to the storage group 4. Finds the appropriate LUNs on the left side of the wizard screen and clicks Add to add them to the Storage Group. The administrator adds LUNs 62 through 71. 5. Clicks Finish. The proposed changes are displayed. 6. Reviews the proposed changes and clicks Execute. A task list appears. 7. Fills in the task list name and task name to easily view the execution progress and status. The administrator names the task l82ar136 (after the host). 8. Confirms that the LUNs were successfully placed in the storage group by clicking the Properties button on the toolbar, and then expanding the following in the Console tree: Task Lists, SAN Tasklists, l82ar136. The table shows a status of Succeeded (Figure 143). Figure 143 Storage group configuration task succeeded Allocating CLARiiON devices (LUNs) to a host 161 Configuring and Controlling Your Datacenter Discovering host devices The administrator has completed storage allocation and now updates the disk information on the host after the configuration change. To do this, the administrator: 1. In the Console tree, right-clicks host l82ar136 and selects Host, Rescan Disks. Note: Host agent must be installed in order to see the Hosts, Rescan Disks option. A login dialog box appears the first time during the session that an attempt is made to perform a command that requires user authentication on this host. 2. Enters the Username and Password that provide the necessary privileges to complete the rescan task on this host. 3. Once the rescan completes, right-clicks host l82ar136 and selects Rediscover. The Discover data collection policy runs, and the host information in the Console is updated. Figure 144 on page 163 shows the new LUNs appearing in the Storage Group for l82ar136 in the Console tree. The server sees the devices after rediscovery is complete. The administrator has completed the allocation of LUNs to the application server. 162 EMC Ionix ControlCenter 6.1: Taking Control of Your Datacenter Configuring and Controlling Your Datacenter Figure 144 LUNs are now available to the application server Adding devices to a CLARiiON metaLUN for a host This example demonstrates how a storage administrator uses Ionix ControlCenter to add devices to (expand) a metaLUN on a CLARiiON CX600 array. MetaLUNs are groups of striped or concatenated LUNs that can be easily created or expanded using the Ionix ControlCenter Expand Storage Wizard. The administrator uses metaLUNs as a way of managing groups of devices based on the type and amount of storage required by various business applications. In this scenario, the administrator has received a free space alert that a logical volume on an AIX host has reached a critical space threshold with only 5 percent capacity remaining. Note: Refer to “Preventing a space shortage on a host logical volume” on page 88 for details on how to configure and respond to free space alerts. Adding devices to a CLARiiON metaLUN for a host 163 Configuring and Controlling Your Datacenter After acknowledging the alert, the administrator determines that all of the allocated RAID 5 storage (80 GB) for host l82ar134 is utilized and that an additional 80 GB of RAID 5 storage must be allocated. The following steps are required to allocate additional storage to the host: ◆ Determine if Storage is Available ◆ Start the Expand Storage Wizard ◆ Select LUNs to add to metaLUN (or create metaLUN) ◆ Review and Execute the Expansion ◆ Confirm the Allocation Determining if storage is available The administrator determines the LUNs accessible to the host by navigating, from the Console tree, to hosts devices under the AIX host and dragging them into the Relationship view. Figure 145 shows that host l82ar134 is connected to the CLARiiON CX600 array and an existing metaLUN named LUN 15 META. The administrator will add more storage to the host by adding LUNs to the existing metaLUN using the Expand Storage Wizard. Figure 145 Relationship view Starting the Expand Storage Wizard The administrator starts the wizard as follows: 1. In the tree panel, expands the Storage Systems folder. 164 EMC Ionix ControlCenter 6.1: Taking Control of Your Datacenter Configuring and Controlling Your Datacenter 2. Expands the CLARiiON array containing the metaLUN for host l82ar134. 3. Expands the Mapped LUNs folder and displays the LUNs (and metaLUNs) on the array. 4. Right-clicks the metaLUN (LUN 15 Meta) and selects Configure > Expand LUN/MetaLUN. The Expand Storage Wizard appears showing the current state of the metaLUN. In this case, the wizard shows that all of the 80 GB of RAID 5 storage is utilized (Figure 146). Figure 146 Expand Storage Wizard 5. Clicks Next to begin selecting the LUNs to add to the metaLUN. Selecting the LUNs The first Select LUNs screen displays all of the available LUNs. The administrator selects LUNs as follows: 1. Scrolls through the Available LUNs panel to find 80 GB of RAID 5 storage. Adding devices to a CLARiiON metaLUN for a host 165 Configuring and Controlling Your Datacenter 2. Selects the appropriate RAID group and clicks Add to add the RAID group to the right-hand panel. The new maximum capacity (160 GB) appears. Figure 147 Selected RAID group showing new user capacity 3. Clicks OK after determining that enough storage is selected. The wizard displays the new metaLUN components and the new maximum capacity (Figure 148). 166 EMC Ionix ControlCenter 6.1: Taking Control of Your Datacenter Configuring and Controlling Your Datacenter Figure 148 RAID groups and LUNs by component Reviewing and executing the expansion The administrator verifies the metaLUN properties as follows: 1. Clicks Next and verifies (the administrator makes no changes) the final metaLUN Properties information, and then clicks Next again to review the metaLUN configuration. Figure 149 shows the new devices that will be added to the metaLUN. Adding devices to a CLARiiON metaLUN for a host 167 Configuring and Controlling Your Datacenter Figure 149 Review MetaLUN configuration 2. After reviewing the details for the metaLUN expansion, the administrator clicks Execute to complete the task. Confirming the allocation The administrator confirms the allocation of additional storage to the host by navigating, from the Console tree, to hosts devices under the AIX host and dragging them into the Relationship view (Figure 150). The new RAID group, containing LUNs 24, 25, 26, and 27, is now part of the expanded metaLUN and accessible to the host. 168 EMC Ionix ControlCenter 6.1: Taking Control of Your Datacenter Configuring and Controlling Your Datacenter Figure 150 Relationship view showing new LUNs in metaLUN Discovering host devices The administrator has completed storage allocation and now updates the disk information on the host after the configuration change. To do this, the administrator: 1. In the Console tree, right-clicks host l82ar134 and selects Host, Rescan Disks. Note: Host agent must be installed in order to see the Hosts, Rescan Disks option. A login dialog box appears the first time during the session when an attempt is made to perform a command that requires user authentication on this host. 2. Enters the Username and Password that provide the necessary privileges to complete the rescan task on this host. 3. Once the rescan completes, right-clicks host l82ar134 and selects Rediscover. The Discover data collection policy runs, and the host information in the Console is updated. Adding devices to a CLARiiON metaLUN for a host 169 Configuring and Controlling Your Datacenter Adding HP XP LUSEs to a host This example demonstrates how a storage administrator uses Ionix ControlCenter to add a new website and requires an additional 20 GB of RAID 5 storage for the Web server. The Web server (l82ar122) is an existing host that is already cabled and zoned to an HP XP 12000 array. During the initial setup and configuration of the HP XP array and this host, the administrator used Ionix ControlCenter to complete the following tasks: ◆ Enabled LUN security on the array port (otherwise, all LUNs mapped to this port will be accessible to the connected host.) ◆ Set the host mode on the array ports to specify which hosts (based on OS) can access the LUNs on the array. ◆ Zoned the host and array ports. ◆ Added the host to a host group on the storage port. Once the array ports are set up correctly, the administrator adds storage to the Web Server as follows: ◆ Determines the array port ◆ Determines if storage is available ◆ Creates LUSEs (logical unit size expansion volumes) ◆ Masks devices to the array port ◆ Discovers devices on host Determining the array port The administrator uses the Relationship view to determine which port on the array has connectivity to the host. To do this, the administrator: 1. On the Console toolbar, clicks the Relationship button and displays the Relationship view. 2. Clicks the Table button to switch from the map view to the table view. 3. In the Console tree expands the folders Hosts, Windows Hosts, host l82ar122, Host Devices, and drags host l82ar122 into the Relationship view (Figure 151). 170 EMC Ionix ControlCenter 6.1: Taking Control of Your Datacenter Configuring and Controlling Your Datacenter The Relationship view shows that host l82ar122 is connected to the HP XP array 30471 through Director CHA-2X, port CL2-K. Figure 151 Use Relationship view to see host to array port connectivity Determining if storage is available on the HP XP array The administrator uses the Properties view to see if there is any available storage. To do this, the administrator: 1. On the Console toolbar, clicks the Properties button and displays the Properties view. 2. In the Console tree, expands the folders Storage Systems, HP XP Arrays (if not already expanded). 3. Drags the HP XP array and the Unmapped Devices folder into the target panel. The array Properties view appear (Figure 152). Adding HP XP LUSEs to a host 171 Configuring and Controlling Your Datacenter Figure 152 Use Properties view to determine if there is enough unallocated capacity The administrator uses the LUN Capacity and RAID Level columns from the Properties view to determine that there is enough unallocated capacity of the appropriate size and RAID level for allocation to the Web server. Creating LUSEs Logical unit size expansion (LUSE) volumes combine two or more HP XP devices (LDEVs) to function as one large device, much like a metadevice on a Symmetrix array. The LUSE appears as a single large device instead of several smaller ones to the host. The Properties view showed that there were enough unmapped 2.29 GB devices with RAID 5 protection available to provide the 20 GB of new storage for the host. The devices are located on control units (CU) 1 and 2. Because these devices are not all on the same control unit (CU), the administrator creates two LUSEs (a LUSE cannot contain devices with different CUs). The administrator creates the LUSEs as follows: 1. In the Console tree, expands the folders Storage Systems, HP XP Arrays (if not already expanded). 2. Right-clicks the StorageWorks XP array (30471), and selects Configure > Create LUSE. 172 EMC Ionix ControlCenter 6.1: Taking Control of Your Datacenter Configuring and Controlling Your Datacenter 3. The New LUSEs dialog box appears (Figure 153 on page 173). Figure 153 Create the LUSEs 4. Under Select Devices, selects either All to view all of the devices and their CUs or selects the specific Control Unit (1) to view the devices it owns. The devices appear in the table under the menu. 5. In the devices table, holds the Ctrl key down and selects the devices to add to the LUSE volume. The lowest number ID number will become the meta head (top device) of the LUSE volume (1:98 in this case). 6. Checks Select Lun Address Automatically to have the next available LUN ID applied to the LUSE volume when it is mapped. 7. Clicks Create to establish the LUSE volume. 8. Selects Control Unit 2 from the menu and repeats steps 5 through 7. 9. Clicks Continue and displays the preview panel. 10. Reviews the details of the proposed LUSE volumes, and then clicks Execute to create them. Adding HP XP LUSEs to a host 173 Configuring and Controlling Your Datacenter The two LUSEs consisting of nine 2.29 GB RAID 5 devices are now mapped to the correct array port and ready to be masked to the host. The LUSEs are identified by the lowest numbered device in each LUSE. In this case, the LUSEs are 1:98 and 2:36. Granting host access to the LUSEs (Masking) The administrator now grants host l82ar122 access to LUSEs 1:98 and 2:36, which are mapped to port CL2-K@CHA-2X on array 30471. Host access is granted to HP XP 12000 storage arrays exclusively through user-defined host groups that reside on the storage port. Adding a host to a host group To add host l82ar122 to a host group, the administrator: 1. In the Console tree, expands Storage Systems, HP XP Arrays, HP XP Array 30471, Controller CHA-2X, Storage Port, Host Groups. 2. Right-clicks host group HostGrpX and selects Masking, Host Group, Edit. The Edit Host Group dialog box appears (Figure 154 on page 175). 174 EMC Ionix ControlCenter 6.1: Taking Control of Your Datacenter Configuring and Controlling Your Datacenter Figure 154 Add the host port to a host group 3. In the Available Host Ports table, selects the host port and clicks Add to move it to the Selected Host Ports table. Note: The administrator could click New to create a new user-defined port. 4. Clicks Execute. The host port appears in the host group after the task has finished running on the Ionix ControlCenter Server. Granting host access to storage Now that port 1 on host l82ar122 has been added to host group, the administrator can grant the host port access to storage on the HP XP 12000 array. To grant the host port access to storage, the administrator: 1. Right-clicks array 30471 and selects Configure, Grant/Remove Access Rights. Adding HP XP LUSEs to a host 175 Configuring and Controlling Your Datacenter The Masking view appears (Figure 155 on page 176). Figure 155 Granting the host port access to the LUSE 2. In the Masking view, performs the following actions: a. For 1-Select Storage Type, selects a storage array type HP XP1024/XP128/XP12000. b. For 2-Select Storage Array, chooses a filter from the drop-down list, if necessary, then selects array 30471. c. For 3-Select Host Groups, selects HostGrpX in the tree window. d. Uses the 4-Select Device Filter Options to configure the rendering of logical devices (LDEVs) in the Masking view table. e. Clicks 5-Show Devices and displays the filtered LDEVs in the Masking view table. 176 EMC Ionix ControlCenter 6.1: Taking Control of Your Datacenter Configuring and Controlling Your Datacenter Note: The administrator can drag an LDEV from Masking view into Path Details view to quickly identify all the hosts that have access to it. f. In the table, selects LDEVs 1:98 and 2:36, right-clicks one of the selected LDEVs and selects Grant Access. The Masking wizard appears (Figure 156 on page 177). Figure 156 Assigning a LUN address to each LDEV 3. In the Assign LUN Address table, under the Address column, selects a LUN address for each LDEV. 4. Clicks Next. Note: If the administrator had assigned invalid LUN addresses to the LDEVS, the Invalid LUN Address dialog box appears, listing LDEVs with invalid LUN addresses. For example, the same LUN address may have been chosen for two LDEVs in the same host group. In this case, clicks OK in the Invalid LUN Address dialog box, and reassigns the LUN addresses in the Masking wizard. 5. In step 2 of the Masking wizard, reviews the changes that are about to be committed to the ECC Server (Figure 157). Adding HP XP LUSEs to a host 177 Configuring and Controlling Your Datacenter Figure 157 Reviewing the configuration changes before sending to the Ionix ControlCenter Server 6. Clicks Execute. The grant access rights tasks are sent to the ECC Server for execution. A pop-up message indicates whether the operation has completed successfully or has failed. Discovering host devices The administrator has completed allocation of storage to the Web server and now updates the disk information on the host. To do this, the administrator: 1. In the Console tree, right-clicks host l82ar122 and selects Host, Rescan Disks. Note: Host agent must be installed in order to see the Hosts, Rescan Disks option. A login dialog box appears the first time during the session when an attempt is made to perform a command that requires user authentication on this host. 2. Enters the Username and Password that provide the necessary privileges to complete the rescan task on this host. 3. Once the rescan completes, right-clicks host l82ar122 and selects Rediscover. The Discover data collection policy runs, and the host information in the Console is updated. 178 EMC Ionix ControlCenter 6.1: Taking Control of Your Datacenter Configuring and Controlling Your Datacenter 4. On the Console toolbar, clicks the Properties button and displays the Properties view. 5. In the Console tree, expands host l82ar122 and the folder Host Devices. 6. Drags the Host Devices folder into the Properties view to view the details. Figure 158 shows the new host devices totaling 20.62 GB. Figure 158 Devices are now available to the web server Deallocating storage from a host This example demonstrates how a storage administrator uses Ionix ControlCenter Deallocation Wizard to deallocate, or remove, storage from a host. In this scenario, the administrator allocated too much storage to Windows host l82at124 and now deallocates 40 GB of storage from the host. The Deallocation Wizard allows the administrator to remove the relationship between the host and specified storage devices to which it has access (as long as the objects are connected through Fibre Channel paths). The administrator completes the following steps to deallocate storage: ◆ Determine the Amount of Free Space on the Host ◆ Determine the Host Devices to be Deallocated ◆ Start the Deallocation Wizard ◆ Create Deallocation Policies ◆ Select the Host ◆ Confirm the Objects and Select a Policy ◆ Select the Deallocation Paths ◆ Review and Execute the Task Deallocating storage from a host 179 Configuring and Controlling Your Datacenter Determine amount of free space available on host The administrator uses Free Space view to determine the amount of free space on host l82at124. Figure 159 shows that this host has a little over 48 GB of free space. The administrator decides to deallocate 40 GB from this host. Figure 159 Free Space view of host l82at124 Starting the Storage Deallocation Wizard The administrator starts the wizard as follows: 1. In the Console tree expands Hosts, l82at124, Host Devices, and highlights devices c6t9d10 and c6t8d11. In this case, the administrator had already determined which devices to deallocate. However, they could have simply selected host l82ar124 and used the wizard to determine which devices were not in use and could be safely deallocated. 2. Right-clicks the host and selects Allocation, Deallocate. 180 EMC Ionix ControlCenter 6.1: Taking Control of Your Datacenter Configuring and Controlling Your Datacenter The Storage Deallocation Wizard starts (Figure 160). The dialog box shows the hosts that were previously selected as well as any available deallocation policies. The administrator can add objects by dragging them from the tree, or remove them by selecting the device and pressing Delete. 3. Clicks New to create a new policy. The administrator could have used or edited the policy provided by Ionix ControlCenter as a default, or used or edited an existing policy available through the drop-down menu. Figure 160 Starting Deallocation Wizard Editing or creating the deallocation policy Deallocation policies define the actions to be performed during the deallocation task, such as rediscovering a host, unmapping devices from the front end of a storage array, and dissolving metadevices. A default Deallocation Policy is provided but the Administrator creates a new policy using the Deallocation Policy Editor (Figure 161). To access the Deallocation Policy Editor go to Storage Administration > Deallocation Policies. Right click and select New > Deallocation Policy. Deallocating storage from a host 181 Configuring and Controlling Your Datacenter To create the new policy, the administrator: 1. Names the policy CLARIION_FREE_DEVICES, and ensures that Use this policy as system default is cleared. This is a policy unique to CLARiiON array deallocations and will not be the standard policy that the administrator uses to deallocate storage for every array. 2. Ensures that Disable Host Actions is cleared, and selects Before Executing Tasks, Rediscover host and fail on error. This means that the wizard checks which devices are currently in use, and will fail the deallocation task if storage is still in use by the host. 3. Selects After Executing Tasks, Rediscover Hosts. This tells Ionix ControlCenter to rediscover the host after the deallocation and update the Repository so all users will see accurate data about the host. 4. Selects Array Actions, Delete device. This deletes any deallocated devices that are no longer part of any path. 5. Clicks Save to save the new policy and return to the Allocation -- Deallocate dialog box. 6. Ensures that the (CLARIION_FREE_DEVICES) deallocation policy is selected and clicks Next. 182 EMC Ionix ControlCenter 6.1: Taking Control of Your Datacenter Configuring and Controlling Your Datacenter Figure 161 Create a new deallocation policy Selecting allocation paths The Paths to Deallocate dialog box displays the available paths to be deallocated based on the objects that were selected in the previous screen. In this case, a total of four paths to host devices c6t9d10 and c6t8d11 will be deallocated (Figure 162). Deallocating storage from a host 183 Configuring and Controlling Your Datacenter Figure 162 Paths to be deallocated The administrator confirms that the paths are correct and clicks Next. The Review Deallocation Task dialog box appears. Reviewing and executing the deallocation task The Review Deallocation Task dialog box provides summaries of the Deallocation Policy and the Paths to Deallocate (Figure 163 on page 185). 184 EMC Ionix ControlCenter 6.1: Taking Control of Your Datacenter Configuring and Controlling Your Datacenter Figure 163 Review Deallocation Task The administrator completes the deallocation task as follows: 1. Reviews the summaries and clicks Execute. The Execute Now dialog box appears. 2. Creates a Task List name, selects View progress/status of tasks, and clicks OK. The deallocation begins. 3. Follows the progress of the deallocation in the Properties - Task List Viewer. Figure 164 on page 186 shows the completed task. Deallocating storage from a host 185 Configuring and Controlling Your Datacenter Figure 164 Deallocation succeeded The administrator verifies that the deallocation was successful by comparing the initial Free Space View to Free Space View of the host after the deallocation. Figure 165 shows that the Host Device free space is now 8.52 GB as opposed to 48.51 GB before the deallocation (Figure 159 on page 180). 40 GB was successfully deallocated. 186 EMC Ionix ControlCenter 6.1: Taking Control of Your Datacenter Configuring and Controlling Your Datacenter Figure 165 Free Space view showing successful deallocation Allocating storage using AutoPath In “Allocating CLARiiON devices (LUNs) to a host” on page 155, a storage administrator added storage to a host connected to a CLARiiON array using the standard method of allocating storage with Ionix ControlCenter. In this scenario, the administrator intends to allocate storage that is already mapped to a port on the CLARiiON array, but uses an Ionix ControlCenter wizard called Autopath to streamline the zoning and LUN masking portion of the storage allocation process. The administrator completes the following tasks to allocate storage from the CLARiiON array using AutoPath: ◆ Determines if storage is available on the CLARiiON array ◆ Ensures the CLARiiON is accessible from the host ◆ Uses the AutoPath Wizard to establish the path between host and array by setting up zoning and LUN masking Allocating storage using AutoPath 187 Configuring and Controlling Your Datacenter ◆ Adds LUNs to an existing storage group (or creates one) so the host sees the LUNs Determining if storage is available on the CLARiiON array The administrator uses Properties view to determine if mapped storage is available on the CLARiiON array. To do this, the administrator: 1. In the Console tree, expands the folders Storage Systems, CLARiiON. 2. Right-clicks the array and selects Properties. The CLARiiON properties appear in Properties view (Figure 166). This view shows that there is over 3000 GB of locally unallocated capacity available. Figure 166 CLARiiON array properties 3. In the Console tree, expands the CLARiiON array. 4. Drags the mapped LUNs into the Properties view. 5. Sorts on the configuration column by clicking the column heading to show the RAID-level protection of the LUNs (Figure 167). Figure 167 CLARiiON LUN properties 188 EMC Ionix ControlCenter 6.1: Taking Control of Your Datacenter Configuring and Controlling Your Datacenter Determining if type of connection is available The administrator uses Topology view to verify that Fibre Channel connections to the array exist. To do this, the administrator: 1. Clicks the Topology button on the Console toolbar. 2. In the Console tree, expands the folders Storage Systems, CLARiiON. 3. Drags array WRE00022201023 into the Topology view. 4. Drags hosts l82ar134 and L82AR136 into the Topology view. 5. Turns on Show Links to ensure that the cabling is in place between host l82ar136 and the CLARiiON array in this fabric (Figure 168 on page 189). Figure 168 Verify that a fibre channel connection exists using topology view Configuring the connection The administrator determined in the previous section that mapped LUNs are available for allocation. Now the administrator checks to see if a zoned path exists between the host and array. If the path does not exist, the administrator will use AutoPath to create one. Allocating storage using AutoPath 189 Configuring and Controlling Your Datacenter Checking for existing path between host and array The administrator checks for an existing path as follows: 1. On the Console toolbar, clicks Storage Allocation and selects Path Details from the drop-down menu. 2. Drags the host into the Path Details view. There are no paths associated with this host (Figure 169 on page 190). 3. Clicks the Relationship view button. 4. Drags the host into the Relationship view. There is no path between the host and the array. Figure 169 Path Details showing no zoned paths between host and target array Confirming storage allocation Once the task succeeds, the administrator uses Properties view on the CLARiiON array to confirm that additional storage was allocated (Figure 170). 190 EMC Ionix ControlCenter 6.1: Taking Control of Your Datacenter Configuring and Controlling Your Datacenter Figure 170 Properties view showing new storage allocated to host Discovering host devices The administrator has completed storage allocation and now updates the disk information on the host after the configuration change. To do this, the administrator: 1. In the Console tree, right-clicks host l82ar136 and selects Host, Rescan Disks. Note: Host agent must be installed in order to see the Hosts, Rescan Disks option. A login dialog box appears the first time during the session when an attempt is made to perform a command that requires user authentication on this host. 2. Enters the Username and Password that provide the necessary privileges to complete the rescan task on this host. 3. Once the rescan completes, right-clicks host l82ar136 and selects Rediscover. The Discover data collection policy runs, and the host information in the Console is updated. Allocating storage using AutoPath 191 Configuring and Controlling Your Datacenter 192 EMC Ionix ControlCenter 6.1: Taking Control of Your Datacenter Configuring and Controlling Your Datacenter Allocating storage using AutoPath 193 Configuring and Controlling Your Datacenter 194 EMC Ionix ControlCenter 6.1: Taking Control of Your Datacenter Configuring and Controlling Your Datacenter Allocating storage using AutoPath 195 Configuring and Controlling Your Datacenter 196 EMC Ionix ControlCenter 6.1: Taking Control of Your Datacenter Configuring and Controlling Your Datacenter Allocating storage using AutoPath 197 Configuring and Controlling Your Datacenter 198 EMC Ionix ControlCenter 6.1: Taking Control of Your Datacenter Configuring and Controlling Your Datacenter Allocating storage using AutoPath 199 Configuring and Controlling Your Datacenter 200 EMC Ionix ControlCenter 6.1: Taking Control of Your Datacenter Configuring and Controlling Your Datacenter Allocating storage using AutoPath 201 Configuring and Controlling Your Datacenter 202 EMC Ionix ControlCenter 6.1: Taking Control of Your Datacenter Configuring and Controlling Your Datacenter Allocating storage using AutoPath 203 CHAPTER 5 Virtual Provisioning of Your Symmetrix Devices Virtual Provisioning is EMC's implementation of thin provisioning. EMC Ionix ControlCenter 6.1 can be used to provision, monitor, and report the usage of virtually provisioned devices. The information provided in this chapter is specific for datacenters that use Symmetrix DMX-3 or DMX-4 storage arrays with Enginuity 5773 or Symmetrix V-Max with Enginuity 5874, and use Ionix ControlCenter to manage their information infrastructure. This chapter contains the following scenarios: ◆ ◆ ◆ ◆ Creating, mapping, and masking Symmetrix thin devices to a host ................. Monitoring Symmetrix thin pool utilization using Ionix ControlCenter alerts .... Reporting on virtual provisioned storage using StorageScope......................... Analyzing performance of virtually provisioned storage .................................. Virtual Provisioning of Your Symmetrix Devices 194 227 227 247 193 Virtual Provisioning of Your Symmetrix Devices Creating, mapping, and masking Symmetrix thin devices to a host This example demonstrates how a storage administrator uses Ionix ControlCenter and SMC (Symmetrix Management Console) to establish Virtual Provisioning ™. Creating new thin pool device from Ionix ControlCenter The storage administrator logs in to Ionix ControlCenter Console and performs the following tasks: 1. From the Console tree view, expands the folders Storage Systems, Symmetrix. Figure 171 Launch of SMC from console tree 2. Finds the Symmetrix array running Enginuity™ 5773 or later. 3. Right-clicks on the Symmetrix SID and selects Device Pool Management, New Thin Pool (SMC) (Figure 171). The SMC Launch dialog box opens with the available SMC server options. The SMC Console Launch dialog box lists all SMC Servers registered with this Symmetrix array in the list box (Figure 172). 194 EMC Ionix ControlCenter 6.1: Taking Control of Your Datacenter Virtual Provisioning of Your Symmetrix Devices Figure 172 SMC launch dialog box 4. Selects the preferred SMC Server. The SMC configured https port automatically fills in. 5. Checks Remember SMC Server for this Symmetrix. 6. Enters the Client ID. 7. Clicks Launch. Log in to SMC will be automatic and the Device Pool Management - Create Device Pool dialog box opens (Figure 172). Creating, mapping, and masking Symmetrix thin devices to a host 195 Virtual Provisioning of Your Symmetrix Devices . Figure 173 Create Device Pool dialog 8. Enters the following in the CreateDevice Pool dialog: • Pool Name — CC61_Upgrade Note: Special characters and spaces are not allowed in Pool Name field. • Pool Type — Selects Thin • Emulation — Selects FBA • Clicks OK and acknowledges the message stating “Successfully created Thin pool.” 196 EMC Ionix ControlCenter 6.1: Taking Control of Your Datacenter Virtual Provisioning of Your Symmetrix Devices Verifying thin pool creation In SMC Console 1. From tree view, expands the Pools, Thin Pools folders for the Symmetrix array that the new thin pool was created on and confirms the new thin pool CC61_Upgrade (Figure 174 on page 197). Figure 174 Expanded pools folder in SMC In Ionix ControlCenter Console Creating, mapping, and masking Symmetrix thin devices to a host 197 Virtual Provisioning of Your Symmetrix Devices From the tree view, expands the Pools, Thin Pools folders for the Symmetrix that the new thin pool was created on and views the new thin pool CC61_Upgrade (Figure 174 on page 197). Figure 175 Expanded pools folder in Ionix ControlCenter 2. From the menu selects the Properties view. 3. Selects and drags the newly created thin pool CC61_Upgrade into the Properties view (Figure 176 on page 198). Figure 176 Thin Pool displayed in Properties view Note: Changes will not be reflected in StorageScope until the ETL process is run. This is scheduled once a day at 4 A.M. (default) but can also be manually run. 198 EMC Ionix ControlCenter 6.1: Taking Control of Your Datacenter Virtual Provisioning of Your Symmetrix Devices Creating data devices from Ionix ControlCenter To create data devices the System Administrator performs the following tasks: 1. From the Ionix ControlCenter Console tree view, right-clicks the Symmetrix SID and selects Device Configuration, Create Device (SMC). SMC launches and the Device Configuration – Create Device dialog box opens (Figure 177 on page 199). Figure 177 Create Device dialog box 2. Clicks the Data Device tab. 3. Enters the following in the Data Device dialog: • Number of Devices — 5 • Configuration — 2-way Mirror Creating, mapping, and masking Symmetrix thin devices to a host 199 Virtual Provisioning of Your Symmetrix Devices • Emulation — FBA • Capacity — 1024 Cyl (960 MB data device) • Disk Group Number — Any Available Disk • Device State in Pool — Enabled • Add to pool — clicks Select to open the Select Device Pool dialog box (Figure 178 on page 200). Figure 178 Select Device Pool dialog box 4. Selects the pool named CC61_Upgrade and clicks OK to fill in the pool name in the Create Device dialog box. 5. Clicks Add to Config Session List and the Config Session dialog box opens (Figure 179 on page 201). 200 EMC Ionix ControlCenter 6.1: Taking Control of Your Datacenter Virtual Provisioning of Your Symmetrix Devices Figure 179 Config Session dialog/ My Active Tasks 6. Reviews the My Active Tasks tab to verify the parameters for the device creation then clicks Commit All. 7. Acknowledges the pop-up information boxes by selecting Yes. 8. Checks the Log window for the completion of the Sym Config Session (Figure 180 on page 202). Creating, mapping, and masking Symmetrix thin devices to a host 201 Virtual Provisioning of Your Symmetrix Devices Figure 180 SMC Log window Verifying data device creation In SMC Console 1. From the tree view, expands the Pools, Thin Pools folders for the Symmetrix array that the new data devices were created on and selects the thin pool CC61_Upgrade. 2. Clicks the Properties tab below the menu bar. The CC61_Upgrade thin pool data appears under the General tab:. 3. Observes the Enabled, Allocated, and Free capacity of the thin pool. 4. Observes the Allocated % and the Current and Maximum Subscription %. 202 EMC Ionix ControlCenter 6.1: Taking Control of Your Datacenter Virtual Provisioning of Your Symmetrix Devices In Ionix ControlCenter Console 1. From the tree view, expands the Pools, Thin Pools folders, and expands the thin pool CC61_Upgrade and views the new data devices (Figure 181 on page 203). Figure 181 Expanded thin pool with data devices 2. From the menu selects Properties view. 3. Multi-selects the five data devices and drags them into the Properties View (Figure 182 on page 203). Figure 182 Data devices displayed in Properties view Creating, mapping, and masking Symmetrix thin devices to a host 203 Virtual Provisioning of Your Symmetrix Devices 4. Confirms each Data Device has a LUN Capacity (0.94 GB) and compares this to the information shown in the SMC Data Devices tab. Creating and Binding thin devices to a pool To create and bind thin devices to a pool, the system administrator performs the following tasks: 1. From Ionix ControlCenter tree view, right-clicks on the Symmetrix SID and selects Device Configuration > Create Device (SMC). 2. SMC launches and the Device Configuration – Create Device dialog box opens (Figure 183 on page 204). Figure 183 Create thin device dialog 204 EMC Ionix ControlCenter 6.1: Taking Control of Your Datacenter Virtual Provisioning of Your Symmetrix Devices 3. Clicks the Thin Device tab. 4. Enters the following in the Thin Device dialog box: • Number of Devices — 10 • Configuration — TDEV • Emulation — FBA • Capacity for each device — 1024 Cyl (960 MB data device) • Bind to pool — CC61_Upgrade • Preallocated Capacity for each device — Leave this field blank 5. Clicks Add to Config Session List and the Config Session dialog box opens. 6. Reviews the My Active Tasks tab to verify the parameters for the device creation then clicks Commit All. 7. Acknowledges the pop-up information boxes by selecting Yes. 8. Checks the Log window for the completion of the Sym Config Session. Verifying thin device creation In Ionix ControlCenter Console 1. From the tree view, expands the Pools, Thin Pools folders, then expands the thin pool CC61_Upgrade and views the new thin devices (Figure 184 on page 206). Creating, mapping, and masking Symmetrix thin devices to a host 205 Virtual Provisioning of Your Symmetrix Devices . Figure 184 Expanded thin pool with thin devices 2. From the menu selects Properties View. 3. Selects and drags the thin pool CC61_Upgrade into the Properties View. 4. Observes the Total Allocated Capacity for CC61_Upgrade (Figure 185 on page 206). Figure 185 Thin Pool with bound thin devices in Properties view 206 EMC Ionix ControlCenter 6.1: Taking Control of Your Datacenter Virtual Provisioning of Your Symmetrix Devices 5. From the tree view, right-clicks thin pool CC61_Upgrade selects Arrange By > Type and groups devices into DATA Devices and Standard Thin Devices (Figure 186 on page 207). Figure 186 Grouped data devices and thin devices Note: Thin devices may be listed as Standard Thin Devices, Meta Thin Devices, R1 Thin Devices, R2 Thin Devices, Meta R1 Thin Devices, or Meta R2 Thin Devices. 6. From the tree view, selects and drags the Standard Thin Devices and the DATA Devices into the Properties View and displays these devices in the Standard View table (Figure 187 on page 208). Creating, mapping, and masking Symmetrix thin devices to a host 207 Virtual Provisioning of Your Symmetrix Devices 7. Reviews the Configuration, LUN Capacity, and Allocated columns and observes the differences between the Data Devices and TDevs. Figure 187 Data devices and thin devices displayed in Properties view 8. Observes that the Data Devices are System Allocated. This is a new allocation term. Data devices are internal to the Symmetrix array, and when a data device is configured and enabled it is System Allocated. 9. Observes that the Data Pool now displays five data devices in the pool with a total capacity of 4.69 GB. 10. Observes the Total Capacity Allocated of the 10 TDevs (9.38 GB) and the Percent Full. 11. Observes the Used Capacity (7.50 MB). This reflects the capacity of the pool that is consumed through the configuration of the thin pool. 208 EMC Ionix ControlCenter 6.1: Taking Control of Your Datacenter Virtual Provisioning of Your Symmetrix Devices In SMC Console Selects the CC61_Upgrade Properties, Bound Thin Devices to observe the new thin devices. Mapping thin devices to host To map thin devices to the host, the system administrator performs the following tasks: 1. From the Ionix ControlCenter Console tree view, expands the Pools, Thin Pools folders, then expands the thin pool CC61_Upgrade. 2. Selects the TDevs to be mapped, then right-clicks on the TDevs and selects Device Mapping > SDR Device Mapping. 3. Acquires a lock on the TDevs and clicks Yes on the SDR Mapping warning that displays. 4. Enters the following in the SDR Device Mapping dialog box (Figure 188 on page 210): a. Select Devices — Expands Unmapped Devices and selects the listed TDevs. b. Select a Port — Expands the Host Directors and selects an FA port. Creating, mapping, and masking Symmetrix thin devices to a host 209 Virtual Provisioning of Your Symmetrix Devices c. Clicks Move then clicks OK on the SDR Device Mapping - Move warning that displays. Figure 188 SDR device mapping dialog 5. When the devices have successfully been moved, clicks Continue to move to the next screen. 6. Reviews mapping information then clicks Execute. 7. Answers Yes to the pop-up window, then clicks OK after the mapping operation completes successfully. 8. Clicks Close to return to the Ionix ControlCenter console. Verifying mapped thin devices To verify the mapped thin devices: 1. From the Ionix ControlCenter Console tree view, expands the Pools, Thin Pools folders, then expands the thin pool CC61_Upgrade. 210 EMC Ionix ControlCenter 6.1: Taking Control of Your Datacenter Virtual Provisioning of Your Symmetrix Devices 2. Verifies the reservation lock icon on the TDevs (Figure 189 on page 211). Figure 189 TDevs displayed in tree view with locked icon Note: Symmetrix arrays can change the configuration after being discovered. These changes are updated in Ionix ControlCenter after the Symmetrix Agent configuration polling executes. The Configuration Data Collection Policies define the frequency that the Symmetrix agent will poll known Symmetrix units for configuration changes. Reservation locks are cleared by the Storage Agent for Symmetrix Configuration DCP, which runs every 10 minutes by default 3. In the tree view, from the Symmetrix array folder expands the Host Directors folder, expands host director FA-10A, port number Sym824_10AB and verifies that the assigned thin devices are mapped to the port (Figure 190 on page 212). Creating, mapping, and masking Symmetrix thin devices to a host 211 Virtual Provisioning of Your Symmetrix Devices Figure 190 Mapped thin devices displayed under assigned port Masking thin devices to host To mask thin devices, the System Administrator performs the following tasks: 1. From the Ionix ControlCenter Console, clicks the drop-down menu next to Storage Allocation on the Ionix ControlCenter menu bar, and selects Masking view. 2. Clears any checked boxes in the tree view and selects the host that is mapped to the thin devices and drags it into the Masking view. Note: If the SAN is not discovered, then no array will be populated in the Masking View. Select All SAN Storage from the Select Storage Type drop-down menu. You will also need to know the FA port the host is using. 3. Enters the following in the Masking View dialog (Figure 192 on page 214): • Select Storage Type — Symmetrix • Select Storage Array — Selects desired the Symmetrix SID • Select Storage Port — Selects desired storage port name 212 EMC Ionix ControlCenter 6.1: Taking Control of Your Datacenter Virtual Provisioning of Your Symmetrix Devices 4. Clicks Show Devices and displays all of the devices mapped to this FA port with all devices masked to this host highlighted in green. 5. Multi-selects the thin devices 5FF6 and 5FF7, right-clicks on selected devices and selects Grant Masking to open the Modify Masking Configurations dialog (Figure 191 on page 213). Figure 191 Thin devices granted masking in Modify Masking Configurations view 6. Selects the Initiator (will be automatically populated if the SAN is discovered). 7. Selects the Activate the vcmdb checkbox. 8. Clicks Execute. Creating, mapping, and masking Symmetrix thin devices to a host 213 Virtual Provisioning of Your Symmetrix Devices Upon completion, displays the new thin devices highlighted in green, indicating that the masking has been granted and the host can now see the devices (Figure 192 on page 214). Figure 192 Mapped thin devices displayed in Masking View Verifying masked thin devices To verify masked thin devices: 1. Runs the symcli commands symcfg discover then Syminq and views the thin devices seen by the host. 2. From the host, navigates to Disk Management and views the new volumes. Auto-provisioning groups Auto-provisioning groups creates a group of devices (storage group), a group of director ports (port group), and a group of host initiators (initiator group) and associates them in a masking view. When the masking view is created, the devices 214 EMC Ionix ControlCenter 6.1: Taking Control of Your Datacenter Virtual Provisioning of Your Symmetrix Devices are automatically mapped and masked and accessible to the hosts. It provides an easier and faster way to provision storage in Symmetrix V-Max™ storage arrays running Enginuity 5874. Mapping and masking thin devices using Auto-provisioning groups To map and mask thin devices using Auto-provisioning groups, the System Administrator performs the following tasks: 1. From the Ionix ControlCenter Console tree selects and right-clicks the Symmetrix array that is running on Enginuity 5874. 2. Selects Masking , Masking View Maintenance, Create Masking View (SMC) and displays the Masking View Management – Create dialog screen (Figure 193 on page 215 and Figure 194 on page 216). Figure 193 Navigating to the create masking view Creating, mapping, and masking Symmetrix thin devices to a host 215 Virtual Provisioning of Your Symmetrix Devices Figure 194 Masking View Management— Create dialog 216 EMC Ionix ControlCenter 6.1: Taking Control of Your Datacenter Virtual Provisioning of Your Symmetrix Devices 3. Enters a Masking View Name and selects New for Storage Group Name or chooses Select and selects and an existing storage group. The Storage Group Management – Create screen appears (Figure 195 on page 217). Figure 195 Storage Group Management -Create dilaog 4. Enters the following in the Storage Group Management - Create dialog: • Storage Group Name — Enters name for storage group • Devices Source Type — Symmetrix • Device Source Name — Enters the Symmetrix SID 5. Selects and highlights the desired thin devices from Available Devices table (Filter icon button can be used to reduce the number of devices). Creating, mapping, and masking Symmetrix thin devices to a host 217 Virtual Provisioning of Your Symmetrix Devices 6. Clicks Add to move the devices to the Group Members table (Figure 196 on page 218). Figure 196 Storage Group Management -Create dilaog with thin devices moved to storage group 7. Clicks OK and the Masking View Management – Create screen displays with the Storage Group Name field filled in (Figure 197 on page 219). 218 EMC Ionix ControlCenter 6.1: Taking Control of Your Datacenter Virtual Provisioning of Your Symmetrix Devices Figure 197 Masking View Management — Create dialog with storage group Creating, mapping, and masking Symmetrix thin devices to a host 219 Virtual Provisioning of Your Symmetrix Devices 8. Selects New for Port Group Name or chooses Select and selects an existing port group. The Port Group Management – Create screen appears (Figure 198 on page 220). Figure 198 Port Group Management - Create dialog 9. Enters the Port Group Name. 10. Selects and highlights the desired storage ports from Available Ports table . 11. Clicks Add to move the devices to the Group Members table (Figure 198 on page 220). 12. Clicks OK and the Masking View Management – Create screen displays with the Port Group Name field filled in (Figure 199 on page 221). 220 EMC Ionix ControlCenter 6.1: Taking Control of Your Datacenter Virtual Provisioning of Your Symmetrix Devices Figure 199 Masking View Management — Create dialog with port group Creating, mapping, and masking Symmetrix thin devices to a host 221 Virtual Provisioning of Your Symmetrix Devices 13. Selects New for Initiator Group Name or choose Select if it is an existing initiator group. The Initiator Group Management – Create screen appears (Figure 200 on page 222). Figure 200 Initiator Group Management - Create dialog 14. Enters the Initiator Group Name. 15. Selects and highlights the desired initiators from Available Initiators table. 16. Clicks Add to move the initiators to the Selected Initiators table (Figure 200 on page 222). 17. Clicks OK and the Masking View Management – Create screen displays with the Initiator Group Name field filled in (Figure 201 on page 223). 222 EMC Ionix ControlCenter 6.1: Taking Control of Your Datacenter Virtual Provisioning of Your Symmetrix Devices Figure 201 Masking View Management - Create dialog with initiator group 18. Clicks OK to create the masking view. Verifying masking view creation In SMC Console 1. From the menu selects Properties. 2. From tree view, expands the Symmetrix Arrays folder, selects the Symmetrix SID specified in the Storage Group Management dialog , expands Symmetrix Masking, Masking Views folders. 3. Selects the masking view Test_ControlCenter and the masking view displays under the General tab (Figure 202 on page 224). Creating, mapping, and masking Symmetrix thin devices to a host 223 Virtual Provisioning of Your Symmetrix Devices Figure 202 Masking view displayed in SMC Properties view In Ionix ControlCenter Console 1. From the menu selects Properties. 2. From tree view, expands the Symmetrix Arrays folder, selects the Symmetrix SID specified in the Storage Group Management dialog box, expands Symmetrix Masking, Masking Views folders. 3. Selects and drags Test_ControlCenter into the Properties view and displays the masking view (Figure 203 on page 225). 224 EMC Ionix ControlCenter 6.1: Taking Control of Your Datacenter Virtual Provisioning of Your Symmetrix Devices Figure 203 Masking View displayed in Ionix ControlCenter Properties view Creating a thin file system on a Windows host To create a thin file system on a Windows host the System Administrator performs the following tasks: 1. On the host, rescans the bus to present the new devices to the operating system. 2. Navigates to Disk Management, selects the new device and initializes it. Creating, mapping, and masking Symmetrix thin devices to a host 225 Virtual Provisioning of Your Symmetrix Devices 3. Creates a primary partition and assigns a drive letter. Creating a thin file system on a Linux host To create a thin file system on a Linux host the System Administrator performs the following tasks: 1. On the host, rescans the bus to discover the new thin devices. Note: Currently QLogic and Emulex provide the FC HBA LUN Scan Utility to rescan all HBAs dynamically. The QLogic FC HBA LUN Scan Utility is available from the EMC-approved site on the QLogic website. The Emulex LUN Scan Utility is available from the EMC-approved site on the Emulex website. 2. Creates a new partition for the new physical volume (thin device) if necessary. 3. Creates a new file system using Logical Volume Manager: a. Creates a new physical volume on the new partition. b. Creates and activates a new volume group. c. Creates a logical volume in the new volume group. d. Creates a file system on the new logical volume. 4. Resizes the existing file system using the Logical Volume Manager: a. Adds the physical volume to the existing volume group. b. Extends the logical volume in the existing volume group. c. Resizes the existing file system. 5. Creates the mount point for the new file system and mounts the new file system. 6. Updates /etc/fstab to add the new file system. Note: For creating a thin file system on a host other than Window or Linux host refer to the EMC Host Connectivity Guide. 226 EMC Ionix ControlCenter 6.1: Taking Control of Your Datacenter Virtual Provisioning of Your Symmetrix Devices Observing the changing capacity of the thin file system In Ionix ControlCenter Console Selects and drags the host with the thin file system into the Properties View and observes the changing capacity of the thin file system in the Free, % Free and Available columns. Monitoring Symmetrix thin pool utilization using Ionix ControlCenter alerts This example demonstrates how a storage administrator uses Ionix ControlCenter alerts to monitor thin pool utilization and then take appropriate action to expand a thin pool. 1. Observes alerts displayed in the Console that % pool utilization on the Symmetrix has reached a warning level (Figure 204 on page 227). 2. Expands the thin pool as follows: a. Uses the procedure “Creating data devices from Ionix ControlCenter” on page 199 and adds more data devices to the pool. b. Uses the procedures “Creating and Binding thin devices to a pool” on page 204, , and “Masking thin devices to host” on page 212 and adds more virtual storage to the pool. Figure 204 Alerts showing data pool utilization at minor level (65%) and warning level (75%) Reporting on virtual provisioned storage using StorageScope These examples demonstrate how a storage administrator uses Ionix ControlCenter StorageScope to report thin pool utilization: 1. Logs in to Storage Scope as follows: Monitoring Symmetrix thin pool utilization using Ionix ControlCenter alerts 227 Virtual Provisioning of Your Symmetrix Devices a. Opens a web browser window and types the following URL: https://<StorageScope_host_name>:30002/srm where <StorageScope_host_name> is the name of the host where StorageScope is installed. b. Enters credentials in the StorageScope login screen and the StorageScope dashboard appears. Displaying a thin pool configured on a Symmetrix (StorageScope SRM/Array View) 1. From the StorageScope menu, selects Analysis, SRM View. 2. From SRM View selects Arrays (Figure 205 on page 229). 228 EMC Ionix ControlCenter 6.1: Taking Control of Your Datacenter Virtual Provisioning of Your Symmetrix Devices Figure 205 StorageScope SRM/All Arrays/Summary and Consumption Details view 3. From the drop-down list, selects All Arrays. 4. Observes the capacity Summary at the top. 5. Observes the Consumption Details for each array. 6. Clicks the Reclaimable Capacity tab and observes the Unused Accessible column (Figure 206 on page 229). Figure 206 StorageScope SRM/all Arrays/Reclaimable Capacity view 7. Locates and selects the desired array from the array name column and displays the array summary and details (Figure 207 on page 230). Reporting on virtual provisioned storage using StorageScope 229 Virtual Provisioning of Your Symmetrix Devices Figure 207 StorageScope SRM/Array Summary and details view 8. From the drop-down list, selects All Pools. 9. Locates and selects the desired thin pool from the Thin Pool tab and displays the thin pool summary and details (Figure 208 on page 231) 230 EMC Ionix ControlCenter 6.1: Taking Control of Your Datacenter Virtual Provisioning of Your Symmetrix Devices Figure 208 StorageScope SRM/Array/Thin Pools Summary and details view 10. Observes the thin devices allocated to the pool and their utilization. Displaying thin pools (StorageScope SRM/Thin Pools View) 1. From the StorageScope menu, selects Analysis > SRM View. Reporting on virtual provisioned storage using StorageScope 231 Virtual Provisioning of Your Symmetrix Devices 2. From SRM View selects Thin Pools (Figure 209 on page 232). Figure 209 StorageScope SRM/all Thin Pools Summary and details view 3. From drop-down list, select All Pools, and observes all the known thin pools. 4. Clicks the Array Name column header and sorts the thin pools by array name. 232 EMC Ionix ControlCenter 6.1: Taking Control of Your Datacenter Virtual Provisioning of Your Symmetrix Devices 5. Locates and selects the desired thin pool (Figure 210 on page 233). Figure 210 StorageScope SRM/Thin Pool Summary and details view 6. From the Summary, observes the Pool Capacity, Pool Used, and %Used. 7. Uses the procedure “Verifying thin device creation” on page 205 and verifies this data is consistent with the data displayed in the thin pool Properties View from the Ionix ControlCenter Console. The Pool Subscribed displays the virtual provisioned pool capacity. It is also displayed in the Ionix ControlCenter console Properties view of the thin pool as Total Capacity Allocated. The %Subscribed displays the subscription rate which is caculated from the Pool Subscribed divided by the Pool Capacity. Using StorageScope to identify thin pools requiring additional storage Alerts from the Ionix ControlCenter Console are generated for thin pools that have reached 50% used. 1. From the StorageScope menu, selects Analysis, SRM View. 2. From SRM View selects Thin Pools (Figure 211 on page 234). Reporting on virtual provisioned storage using StorageScope 233 Virtual Provisioning of Your Symmetrix Devices Figure 211 StorageScope SRM/all Thin Pools Summary and details view 3. From the drop-down list, select All Pools. 4. Selects the %Used column header and sorts the thin pools in descending order. 5. Locates and notes the pools that are greater than 50% used and considers these for additional storage. 6. Selects %Subscribed column header and sorts the thin pools in descending order. 7. Observes if any pools are greater than 100% subscribed and considers these for additional storage. Expanding thin pools To expand thin pools: 1. Uses the procedure “Creating data devices from Ionix ControlCenter” on page 199 and adds more data devices to the pool. 234 EMC Ionix ControlCenter 6.1: Taking Control of Your Datacenter Virtual Provisioning of Your Symmetrix Devices 2. Uses the procedures “Creating and Binding thin devices to a pool” on page 204, “Mapping thin devices to host” on page 209, and “Masking thin devices to host” on page 212 and adds more virtual storage to the pool. 3. From Utilities > Settings > ETL Scheduler, runs the StorageScope Extraction, Translation, and Load (ETL) process (Figure 212 on page 235 and Figure 213 on page 235). Figure 212 StorageScope navigation to ETL Scheduler Figure 213 StorageScope ETL Scheduler successful run Reporting on virtual provisioned storage using StorageScope 235 Virtual Provisioning of Your Symmetrix Devices Verifying additional storage added to pools To verify added storae to pools: 1. After the ETL scheduler is run, selects Analysis > SRM View from the StorageScope menu. 2. From SRM View selects Thin Pools. 3. Reviews the %Subscribed and %Used for the thin pools and verifies that values reflect the expanded pools. For example, if a 300 GB thin pool has 100 GB of thin devices allocated to each of the four hosts and each of the four hosts is using 50 GB of storage on the thin devices, then the thin pool is 67 percent used (4x50/300) and 133 % Subscribed or (4x100/300) 33 % OverSubscribed. After allocating an additional 200 GB of storage to the pool (500 GB total) and running ETL, the SRM views now should indicate the pool is 40 percent used (4x50/500) and 80 percent Subscribed (4x100/500). Using built-in reports to report Virtual Provisioning Enterprise report To run an Enterprise report: 236 EMC Ionix ControlCenter 6.1: Taking Control of Your Datacenter Virtual Provisioning of Your Symmetrix Devices 1. From the StorageScope menu, selects Analysis, Reports, Built-in/Custom Reports and displays the 12 built-in reports (Figure 214 on page 237). Figure 214 StorageScope built-in reports 2. Selects the Enterprise Summary report and clicks Run Report and displays Enterprise Summary (Figure 214 on page 237). Reporting on virtual provisioned storage using StorageScope 237 Virtual Provisioning of Your Symmetrix Devices Figure 215 StorageScope Enterprise Summary 3. Clicks Run Now. When Interactive Reports screen displays, checks the Status column and waits for a Completed status. 238 EMC Ionix ControlCenter 6.1: Taking Control of Your Datacenter Virtual Provisioning of Your Symmetrix Devices Figure 216 StorageScope Enterprise Summary report complete 4. Selects desired Enterprise Summary report and clicks View to review the report. Array reports To run a report for arrays: 1. From Built-in/Cu stom Reports, selects Arrays and runs the report. 2. When report is completed, selects the report, clicks View and opens Arrays report. Reporting on virtual provisioned storage using StorageScope 239 Virtual Provisioning of Your Symmetrix Devices 3. From the Array Report, Details for All Arrays, All Arrays table reviews thin pool aggregate data (Figure 217 on page 240). Figure 217 StorageScope All Arrays report displaying aggregate thin pool data for all arrays 4. Using the Find box in Adobe Reader, searches for the desired array serial number and reviews the thin pool data (Figure 218 on page 240). Figure 218 StorageScope Array Report Displaying Thin Pool Data 240 EMC Ionix ControlCenter 6.1: Taking Control of Your Datacenter Virtual Provisioning of Your Symmetrix Devices Host reports To run a report for hosts: 1. From Built-in/Custom Reports, selects Hosts and runs the report. 2. When report is completed, selects the report, clicks View and opens the Hosts Report. 3. From the Hosts Report, Details for All Hosts, All Hosts table reviews thin pool aggregate data (Figure 219 on page 241). Figure 219 StorageScope All Hosts Report displaying aggregate thin pool data for all hosts Reporting on virtual provisioned storage using StorageScope 241 Virtual Provisioning of Your Symmetrix Devices 4. Using the Find box in Adobe Reader, searches for the desired host name and reviews the thin pool data (Figure 220 on page 242). Figure 220 StorageScope Host report displaying thin pool data Using built-in queries to report Virtual Provisioning Thin pools query To report thin pools using queries: 1. From the StorageScope menu, selects Analysis, Queries, Query Builder and displays the built-in Query Listing. 2. Selects Thin Pools, clicks Run and displays the query result (Figure 221 on page 243). 242 EMC Ionix ControlCenter 6.1: Taking Control of Your Datacenter Virtual Provisioning of Your Symmetrix Devices Figure 221 StorageScope Thin Pools query result showing all pools on all arrays Thin Pools End-to-end Relationship query From Query Listing selects Thin Pools End-to-end Relationship, clicks Run and displays the query result (Figure 222 on page 243). Figure 222 StorageScope Thin Pools End-to-end Relationship query result showing all pools on all hosts Reporting on virtual provisioned storage using StorageScope 243 Virtual Provisioning of Your Symmetrix Devices Note: The SAN must be discovered for this query data to be available Thin Pools Thin Devices Chargeback query From Query Listing selects Thin Pools Thin Devices Chargeback Query, clicks Run and displays the query result (Figure 223 on page 244). Figure 223 StorageScope Thin Pools Thin Devices Chargeback query result showing all hosts with thin pool access. Note: This query displays usage details for all hosts with accessible devices from a thin pool, where the Thin Device Accessible Total for the specific host is greater than 0. Additional reporting capabilities using user-defined fields User-defined files can be added to many of the Managed Objects discovered by Ionix ControlCenter. The storage administrator can use user-defined fields using the StorageScope Query Builder as follows: ◆ 244 Configuring User-defined fields/Groups for thin pools and thin devices. EMC Ionix ControlCenter 6.1: Taking Control of Your Datacenter Virtual Provisioning of Your Symmetrix Devices ◆ In the StorageScope Query Builder, creating a new query by selecting Create and using the Query Builder wizard. ◆ Retrieving previously configured user-defined fields/groups with Query Builder. Creating a dashboard snapshot for thin pools 1. From the StorageScope menu, selects Analysis, Queries, Query Builder and displays the built-in Query Listing. 2. Selects Thin Pools, clicks View SQL and displays SQL window (.Figure 224 on page 245). Figure 224 StorageScope thin pools SQL view 3. Copies the text in the SQL window and closes the window. 4. From the StorageScope menu, selects Utilities > Snapshots. Reporting on virtual provisioned storage using StorageScope 245 Virtual Provisioning of Your Symmetrix Devices 5. From the Snapshot listing, clicks the Custom Snapshots tab, clicks Create, and displays the Create Snapshot window (Figure 225 on page 246). 6. Enters the following information: • Type — Table • Category — Hosts • Title — Thin Pools by Host • SQL query — pastes the text copied from the SQL window Figure 225 StorageScope Create Snapshot view 7. Clicks Save. 246 EMC Ionix ControlCenter 6.1: Taking Control of Your Datacenter Virtual Provisioning of Your Symmetrix Devices 8. From the StorageScope menu, selects Dashboard > Customize and displays the Customize Dashboard view ( Figure 226 on page 247). Figure 226 StorageScope Customize Dashboard view 9. Selects the custom snapshot from the available list of snapshots. 10. Assigns a position for the snapshot on the dashboard and clicks OK. 11. Verifies the custom snapshot by selecting Dashboard from the StorageScope menu and viewing the Thin Pools by Host snapshot. Analyzing performance of virtually provisioned storage These examples demonstrate how a storage administrator uses Ionix ControlCenter Performance Manager to analyze I/O and throughput performance statistics of virtually provisioned storage. Performance is monitored by viewing real-time performance data for a period of time or by viewing performance trends. Analyzing performance of virtually provisioned storage 247 Virtual Provisioning of Your Symmetrix Devices Identifying host connected to thin pool To identify the host connected to the thin pool: 1. From the Ionix ControlCenter Relationship view, selects the desired thin pool and displays the host, host devices, thin pool, thin devices, data devices, and back-end physical disks (Figure 227 on page 248). Figure 227 Ionix ControlCenter Relationship view displaying end-to-end relationship 2. Notes the host that is connected to the thin pool. 3. From the Ionix ControlCenter Console, selects File > Launch > Performance Manager. 248 EMC Ionix ControlCenter 6.1: Taking Control of Your Datacenter Virtual Provisioning of Your Symmetrix Devices 4. Enters credentials in Performance Manager login screen and displays the Data Selection dialog (Figure 228 on page 249). Figure 228 Performance Manager Data Selection view — host Analyzing host I/O or throughput performance To analyze host I/O or throughput: 1. In the Class field selects Host. 2. In the Identifier field, selects the hostname that was identified in Figure 227 on page 248 as a host connected to the thin pool. 3. Selects a specific Interval: Daily, Weekly, or Monthly from Archives, Revolving, Analyst, or a specific file from Private Data and clicks OK and displays the Performance Manager console (Figure 229 on page 250). Analyzing performance of virtually provisioned storage 249 Virtual Provisioning of Your Symmetrix Devices Figure 229 Performance Manager console displaying host physical drives 4. Selects Metrics in the bottom pane. 5. Selects Physical Device from Host tree view in the top pane. 6. Selects the physcial devices from the middle pane 7. Selects the desired metric from the bottom pane and displays the metric for the physical devices. 8. Observes metric for the host physical drives (Figure 229 on page 250). Analyzing Symmetrix array I/O and throughput performance To analyze array I/O or throughput: 250 EMC Ionix ControlCenter 6.1: Taking Control of Your Datacenter Virtual Provisioning of Your Symmetrix Devices 1. From Performance Manager console, selects File > Open and displays the Data Selection dialog box (Figure 231 on page 252). Figure 230 Performance Manager Data Selection view - Symmetrix 2. In the Class field, selects Symmetrix. 3. In the Identifier field, selects the Symmetrix serial number for an array with connected thin pools. 4. Selects a specific Interval: Daily, Weekly, or Monthly from Archive, Revolving, Analyst, or a specific file from Private Data and clicks OK and displays the selected data in the Performance Manager console (Figure 231 on page 252). Analyzing performance of virtually provisioned storage 251 Virtual Provisioning of Your Symmetrix Devices Figure 231 Performance Manager console displaying selected thin device data Thin devices To display thin device performance metrics: 1. Selects Metrics in the bottom pane. 2. Selects Devices from Symmetrix tree view in the top pane. 3. Selects the thin devices from the middle pane. 4. Selects the desired metric from the bottom pane and displays the metric for the thin devices. 5. Observes metric for thin devices (Figure 231 on page 252). 252 EMC Ionix ControlCenter 6.1: Taking Control of Your Datacenter Virtual Provisioning of Your Symmetrix Devices Data devices To display data device performance metrics: 1. Selects Metrics in the bottom pane. 2. Selects Devices from Symmetrix tree view in the top pane. 3. Selects the data devices from the middle pane. 4. Selects the desired metric from the bottom pane and displays the metric for the data devices. 5. Observes metric for data devices (Figure 232 on page 253). Figure 232 Performance Manager console displaying selected data device data Back-end physical disks To display physical disk performance metrics: Analyzing performance of virtually provisioned storage 253 Virtual Provisioning of Your Symmetrix Devices 1. Selects Metrics in the bottom pane. 2. Selects Disks from Symmetrix tree view in the top pane. 3. Selects the disks from the middle pane. 4. Selects the desired metric from the bottom pane and displays the metric for the back-end physical disks. 5. Observes metric for back-end physical disks (Figure 233 on page 254). Figure 233 Performance Manager console displaying selected back-end disks 254 EMC Ionix ControlCenter 6.1: Taking Control of Your Datacenter APPENDIX A About Virtual Provisioning EMC Ionix ControlCenter has extended it capabilites to perform Virtual Provisioning, also known as Thin Provisioning. This appendix discusses why datacenters should consider Virtual Provisioning, what it is, and how it works. This appendix contains the following information: ◆ ◆ Virtual Provisioning overview.......................................................................... 256 Virtual Provisioning glossary .......................................................................... 262 About Virtual Provisioning 255 About Virtual Provisioning Virtual Provisioning overview Why Virtual Provisioning Businesses and organizations continually search for ways to both simplify storage management processes and improve storage capacity utilization. When provisioning storage for a new application, storage administrators must consider the application's future capacity requirements rather than simply its current requirements. In order to reduce the risk that the application will run out of data storage capacity, administrators have often allocated more physical storage to an application than is needed. This allocated but unused storage impacts utilization planning and introduces higher operational costs. In other cases, organizations do not allocate enough storage. Even with the most careful planning, they cannot accurately predict the application's data growth. Therefore, it is often necessary to provision additional storage in the future, which can potentially require an application outage. This is where Virtual Provisioning can address these challenges, as data devices can be added to a storage pool to meet the growing trend of applications without interruptingg a host or application. What is Virtual Provisioning Virtual Provisioning builds on the base "thin provisioning" functionality, which is the ability to have a large "thin" device (volume) configured and presented to the host while consuming physical storage from a shared pool only as needed. There are two types of devices in Virtual Provisioning, thin devices (TDevs) and data devices. A thin device is the device that is configured to customer requirements. It does not have storage associated with it at first. A data device is an internal device that contains physical storage chunks that can be associated with "thin device extents," which are small units of storage. All data devices are organized into pools and are shown as System Allocated devices. A thin pool is a collection of data devices and TDevs that are bound together. Within a thin pool, TDevs that are mapped and masked to hosts are bound to data devices within the virtual pool. Data devices provide the actual storage used by the host. The thin pool can have data devices that are either "enabled" or "disabled." This feature is always useful for quick capacity growth or for a reserve of actual storage that can be reallocated to another thin pool. 256 EMC Ionix ControlCenter 6.1: Taking Control of Your Datacenter About Virtual Provisioning How Virtual Provisioning works Storage allocation operations are performed in thin device extents. A round-robin mechanism balances the allocation of data device extents across all of the data devices in the pool that are enabled and that have unused capacity. The initial bind of a thin device to a pool causes one thin device extent, or 12 tracks (768 KB), to be allocated per thin device. When a read is performed on a thin device, the data being read is retrieved from the appropriate data device in the storage pool to which the thin device is bound. Reads directed to an area of a thin device that has not been mapped do not trigger allocation operations. The result of reading an unmapped block is that a block in which each byte is equal to zero will be returned. When a write to a thin device is serviced, storage is allocated to the thin device from the data devices in the associated storage pool. When more storage is required, data devices can be added to existing thin storage pools. New thin devices can also be created and associated with existing thin pools. It is possible for a thin device to be presented for host use before all of the reported capacity of the device has been mapped. It is also possible for the sum of the reported capacities of the thin devices using a given pool to exceed the available storage capacity of the pool. Such a thin device configuration is said to be “oversubscribed.” Unbinding a thin device from a pool frees all the space that the thin device had consumed from that pool. The data cannot be recovered after the thin device is unbound. Supported Symmetrix arrays Virtual Provisioning is supported in EMC Ionix ControlCenter 6.1 for Symmetrix DMX-3 or DMX-4 storage arrays with Enginuity 5773 or Symmetrix V-Max storage arrays with Enginuity 5874. It requires the Symmetrix Management Console (SMC) version 6.1 or later and Solutions Enabler 6.5.0 or later. Virtual Provisioning overview 257 About Virtual Provisioning Graphical representations of Virtual Provisioning are shown in Figure 234 and Figure 235. Figure 234 High-level representation of Virtual Provisioning 258 EMC Ionix ControlCenter 6.1: Taking Control of Your Datacenter About Virtual Provisioning Figure 235 Thin device relationship to storage pool devices Benefits of Virtual Provisioning and the role of Ionix ControlCenter Virtual Provisioning creates new benefits and new challenges for storage management. When managed properly, Virtual Provisioning can provide dynamic changes in how capacity utilization is managed and provisioned. Before Virtual Provisioning, metavolumes were used to stripe data over many physical disks. Virtually provisioned devices are automatically wide striped over many disks. Wide striping can improve performance for some application workloads. In addition, virtually provisioned devices can be oversubscribed, creating new dynamics for host storage provisioning. Administrators can allocate a volume size to a host in excess of the actual storage provided to the virtually provisioned environment. Virtual Provisioning provides storage administrators with more flexibility to be generous with advertised storage, while still maintaining high utilization rates. Virtual Provisioning overview 259 About Virtual Provisioning Virtual Provisioning can improve storage capacity utilization and simplify storage management by presenting the application with sufficient capacity for an extended period of time, reducing the need to frequently provision new storage and avoiding the cost of allocated but unused storage. Ionix ControlCenter extends the same advanced storage management capabilities to virtually provisioned Symmetrix devices that it provides provides to other EMC arrays and third-party storage arrays. These capabilities include: Ionix ControlCenter Console centralized roll-up of an entire enterprise data center, storage provisioning, performance analysis, comprehensive reporting, and overall health monitoring. Considerations for Implementing Virtual Provisioning Virtual Provisioning provides datacenters with capability to dynamically manage capacity utilization, however it is important to understand what may negatively affect the thin pool and what monitoring is needed as follows: ◆ Storage pool needs to be monitored carefully to avoid running out of space, causing an application failure and requiring a data restore. ◆ Oversubscription must be monitored and managed as it does allow the possibility of a host running out of available storage. ◆ Careful selection of which servers, applications, and devices are going to effectively share the pool to avoid spindle contention between I/O-sensitive applications. ◆ It is important to understand an application's behavior to determine the consumed space that cannot be reclaimed. Many file systems do not efficiently reuse the space associated with deleted files. Some databases pre-allocate space and format it. As a result, unnecessary space is allocated in a thin pool, reducing the capacity utilization benefits. Therefore, when implementing Virtual Provisioning, new operational procedures need to be established to ensure that storage is available and provisioned before a host runs out of available storage. Ionix ControlCenter makes these tasks not only possible, but easy. 260 EMC Ionix ControlCenter 6.1: Taking Control of Your Datacenter About Virtual Provisioning Performance implications of Virtual Privisioning The performance implications for the use of thin devices depends on the nature of the workload and the state of the thin device. In a thin device implementation, there are response time and throughput overheads that are incurred the first time a write is performed on an unallocated region of a thin device. The back-end layout of the thin device tends to be widely striped, typically spanning a much greater number of drives than a regular device. This makes it easier to keep the workload balanced across many physical spindles, which can improve performance for the random read and write workloads. Virtual Provisioning overview 261 About Virtual Provisioning Virtual Provisioning glossary High level terminology Virtual Provisioning EMC’s corporate term for thin provisioning. Storage Pool Umbrella term for storage pools used by virtual architectures. Commonly used terminology Thin Device Host accessible device that has no storage directly associated with it, referred to as a TDev. Device Logical unit of storage defined within an array. Data Device Internal device that provides storage capacity to be used by thin devices. Thin pool Collection of data devices and TDevs that is linked to host visible logical devices, and is dynamically allocated as needed. Bind Associating one or more thin devices with a thin pool. Unbind Disassociating one or more thin devices from a thin pool. 262 EMC Ionix ControlCenter 6.1: Taking Control of Your Datacenter About Virtual Provisioning Thin pool terminology Thin Pool Total Capacity Total (writeable) size of the thin pool, excluding the overhead associated with RAID, mapping, binding, etc. Thin Pool Raw Capacity Total size of the thin pool, including the overhead associated with RAID, mapping, binding, and reserve capacity. Thin Pool Available Capacity Amount of storage in the thin pool that can be allocated. Thin Pool Allocated Capacity Amount of storage in the pool that has been allocated to thin devices. Thin Pool Oversubscribed Capacity Difference between the stated size of all thin devices and the capacity of the thin pool. Thin Pool Reserve Capacity Capacity of the thin pool that is reserved for use when the normal (unreserved) capacity is consumed. Thin Pool Reserve Total Capacity Amount of capacity in the thin pool set aside for reserve allocations. Thin Pool Reserve Available Capacity Amount of reserve capacity in the thin pool available for use by thin devices. Thin Pool Reserve Allocated Capacity The capacity in the reserve portion of the thin pool that has been allocated to thin devices. Virtual Provisioning glossary 263 About Virtual Provisioning Thin device terminology Thin Device Subscribed Capacity The size of the thin device, as seen by the host. Thin Device Allocated Reserve Capacity The amount of reserve storage that has been used by a thin device. Thin Device Allocated Capacity The capacity that has been withdrawn from the thin pool for the exclusive use of this thin device. Alert and threshold terminology Thin Pool - % Allocated A threshold point at which an alert may be sent and the administrator may take actions to ensure that sufficient thin pool storage is available. Thin Pool Reserve - % Allocated A threshold point at which an alert may be sent and the administrator may take actions to ensure that sufficient thin pool reserve storage is available. Thin Device - % Allocated The expression of Thin Device Allocated Capacity as a percentage. 264 EMC Ionix ControlCenter 6.1: Taking Control of Your Datacenter INDEX A acknowledging Free Space alert 89 switch port alert 79 alerts acknowledging 79, 89 addressing for a switch port 78, 87 assigning to a user 93 diagnosing for switch port 80 disk transfer rate 93, 95 Free Space 88, 89 Physical Disk Bottleneck 93, 95 receiving in BMC Patrol 88 allocating storage for a database 26, 27 from a CLARiiON array 155, 163 from a Symmetrix array 119, 155 from CLARiiON metaLUNs 163, 169 from HP XP array 179 from HP XP LUSE 179 using AutoPath 191 assigning alerts 93 AutoPath 191 configuring host connection to Symmetrix 189 B BCVs adding to device groups 149, 153 creating 133 establishing with standard volumes 153 BMC Patrol 88 Business Continuance Volumes. See BCVs C capacity planning for a database 36 for virtual machines 42 CLARiiON arrays adding LUNs to Storage Groups 160 allocating LUNs to a host 155, 163 allocating storage using AutoPath 191 configuring host connection 158, 163 deallocating storage from a connected host 179, 187 determining available configured storage 157 determining available storage 155 expanding a metaLUN 163, 164, 169 Storage Groups 159, 161 viewing host connections 156, 164 configuring CLARiiON metaLUN 163, 169 host connection to a CLARiiON array 158, 163 host connection to a Symmetrix array 134, 149 host connection to Symmetrix array, using AutoPath 189 storage on a CLARiiON array 155, 163 storage on a CLARiiON array, using AutoPath 191 storage on a Symmetrix array 131, 134 storage on an HP XP array 170, 179 VSANs 136, 140 creating EMC Ionix ControlCenter 6.1: Taking Control of Your Datacenter 265 Index a VSAN 136, 140 deallocation policies 181 device groups 149, 153 HP XP LUSE LUSEs 172 StorageScope queries 8, 14, 16, 18, 256 StorageScope reports 21, 27, 36, 45, 46, 49, 50, 53, 58 zones 141 D databases allocating storage for 26, 27 Oracle 96 planning capacity for 36 StorageScope reports of 37, 41, 52 datacenters configuring and controlling 101 monitoring 77 reporting 7 deallocating storage 179, 187 device groups adding devices to 149, 153 creating on a Symmetrix array 149, 153 diagnosing alerts 93 Free Space alert 88 discovering host devices 154, 162, 178, 191 disk transfer rate, fixing 93, 95 E establishing BCVs with standard volumes 153 expanding a CLARiiON metaLUN 163, 169 extending a volume 92 F fan-in ratio, viewing for a Symmetrix array port 128 266 fixing disk transfer rate 93, 95 free space alerts 91 locating for a host 91 Free Space view 130, 180 H host devices discovering 154, 162, 178, 191 discovering from CLARiiON array 169 host groups, adding a host to 174 hosts adding to a host group 174 deallocating storage 179, 187 granting access HP XP array 174, 178 viewing connections to a CLARiiON array 156, 164 viewing connections to a Symmetrix array 125 zoning ports 141, 146 Hosts By Group report 28, 29 HP XP arrays creating LUSEs 170, 172, 179 masking devices 174, 178 I identifying array performance problem 64, 76 host performance problem 59, 63 loss of signal from a switch port 78, 87 old and large files 53 introduction 5 L Logical Unit Size Expansions. See LUSEs LUNs adding to a CLARiiON metaLUN 164 adding to a CLARiiON Storage Group 160 LUSEs EMC Ionix ControlCenter 6.1: Taking Control of Your Datacenter Index configuring creating 172 M mapping storage devices on Symmetrix arrays 134 masking granting host access to a Symmetrix array 147, 149 HP XP array 175 HP XP arrays 174, 178 Symmetrix devices 146, 149 Masking view 147, 176 monitoring a datacenter 77 P Path Details view 82, 157, 159 Performance Manager array performance problem 64, 76 host performance problem 59, 63 Performance view 129 planning a SAN 101, 119 capacity for a database 36 capacity for a virtual machine 42 ports determining the number of mapped Symmetrix devices 128 determining throughput for a Symmetrix array 129 verifying settings on a Symmetrix array 126, 129 Properties view 26, 44, 91, 129, 131, 160, 179, 188, 191 R Relationship view 42, 43, 44, 89, 94, 95, 164, 169, 171, 190 reports filtering 54 Hosts By Group 28, 29 of databases 37, 41, 52 of NAS file systems 45 StorageScope 28, 29, 37, 41, 45, 52, 54, 125, 156, 158 S SAN Advisor 101, 119 SANs planning 101, 119 validating 101, 119 Storage Groups, adding LUNs to 160 Storage Provisioning Services using AutoPath 187, 191 StorageScope creating reports 8, 19, 21, 27, 36, 45, 46, 49, 50, 53, 58, 256 filtering reports 54 identifying IT assets 8, 256 reports 28, 29, 37, 41, 45, 52, 125, 156, 158 tracking IT assets for a department 19, 21 use cases 8, 19, 21, 36, 45, 46, 49, 50, 53, 58, 256 switches addressing port alert 78, 87 diagnosing port alert 80 Symmetrix arrays 131, 134 allocating storage 119, 155 configuring host connection 134, 149 creating BCVs 133 creating device groups 149, 153 determining available storage 130 determining number of devices mapped to a port 128 determining port throughput 129 granting host access 147, 149 EMC Ionix ControlCenter 6.1: Taking Control of Your Datacenter 267 Index mapping storage devices 134 masking devices 146, 149 verifying port fan-in ratio 128 verifying port settings 126, 129 viewing host connections 125 zoning ports 141, 146 T Task List viewer 161, 186 TimeFinder, establishing BCVs to standard volumes 153 Topology view 23, 25, 120, 126, 189 U use cases adding devices to a CLARiiON metaLUN for a host 163, 169 adding HP XP LUSEs to a host 170, 179 allocating CLARiiON devices (LUNs) to a host 155, 163 allocating storage for a new application 26 allocating storage to a host from a Symmetrix array 119, 155 allocating storage using AutoPath 191 automating the resolution to an Oracle tablespace space shortage 96, 99 collecting utilization statistics for management 50 configuring and controlling a datacenter 101 configuring database space for a new application 36, 41 deallocating storage from a host 179, 187 fixing a disk transfer rate alert 93, 95 identifying a host performance problem 268 59 identifying an array performance problem 64 identifying and diagnosing loss of signal from a switch port 78, 87 identifying array performance problem 76 identifying host performance problems 63 identifying IT assets for accounting 8, 256 identifying old and large files 53, 58 pooling storage resources 46, 49 predicting storage needs more accurately 45 preventing a space shortage on a host logical volume 88, 92 preventing application outages due to out-of-space conditions 42 reporting 7 StorageScope 8, 19, 21, 36, 45, 46, 49, 50, 53, 58, 256 tracking IT assets for a department 22 tracking which assets belong to a department (CTO) 19, 21 understanding how much storage is allocated to an application 27 validating and optimizing a SAN configuration 101, 119 user defined groups 23 V validating a SAN 101, 119 views Alerts 90 Free Space 130, 180 Masking 147, 176 Path Details 82, 157, 159 EMC Ionix ControlCenter 6.1: Taking Control of Your Datacenter Index Performance 129 Properties 26, 44, 90, 91, 129, 131, 160, 179, 188, 191 Relationship 43, 44, 89, 91, 94, 95, 164, 169, 171, 190 Task List viewer 161, 186 Topology 25, 120, 126, 189 virtual machines planning capacity for 42 viewing relationship to VMware ESX Server 42 virtual provisioning creating a thin pool 194 creating and binding thin devices to thin pool 204 creating data devices 199 creating thin file system 225 mapping and masking thin devices using auto-provisioning groups 215 mapping thin devices to host 209 masking thin devices to host 212 thin pool utilization alerts 227 virtual provisioning performance analysis back-end physical devices 253 data devices 253 host 249 identifying host connected to thin pool 248 thin devices 252 virtual provisioning reporting creating dashboard snapshots 245 displaying thin pool on a Symmetrix 228 displaying thin pools 231 identifying thin pools requiring additional storage 233 using built-in queries 242 using built-in reports 236 virtual SANs. See VSANs VMware ESX Server viewing relationship to virtual machines 42 volumes extending 92 preventing space shortage for 88, 92 VSANs configuring 136, 140 creating 136, 140 Z zoning activating a zone set 143 adding a zone to a zone set 143 creating a zone 141 creating a zone set 143 hosts and Symmetrix ports 141, 146 EMC Ionix ControlCenter 6.1: Taking Control of Your Datacenter 269 Index 270 EMC Ionix ControlCenter 6.1: Taking Control of Your Datacenter