1
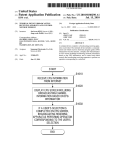
HEALTH MONITORING
ANALYTICS
Final Report
Software Engineering
Group #1
Edited by
GRADEIGH D. CLARK
XIANYI GAO
RUI XU
LI XU
YIHAN QIAN
XIAOYU YU
Rutgers University
School of Engineering
December 20th, 2013
http://www.healthmonitoringanalytics.com/HTMLApp2/public html/index.php
1
1
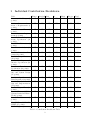
Individual Contribution Breakdown
Task
Summary Of Changes (5
points)
Sec.1: Customer Statement of Requirements (6
points)
Sec.2 Glossary of Terms (4
points)
Sec.3 System Requirements (6 points)
Sec.4 Functional Requirements Specification (30
points)
Sec.5 Effort Estimation (4
points)
Sec.6 Domain Analysis (25
points)
Sec.7a: Interaction Diagrams (30 points)
Sec.7b: Design Patterns
(10 points)
Sec.8a Class Diagram and
Interface Specification (10
points)
Sec.8b OCL Contract
Specification (10 points)
Sec.9: System Architecture and System Design
(15 points)
Sec.10: Algorithms and
Data Structures (4 points)
Sec.11: User Interface Design and Implementation
(11 points)
Sec.12: Design of Tests (12
points)
Sec.13: History of Work,
Current Status and Future
Work(5 points)
Sec. 14: References (5
points)
PROJECT
MANAGEMENT (17 points)
TOTALS (points)
Xianyi
16.7%
Gradeigh Rui
16.7%
16.7%
Li
16.7%
Yihan
16.7%
Xiaoyu
16.7%
Total
100%
16.7%
16.7%
16.7%
16.7%
16.7%
16.7%
100%
16.7%
16.7%
16.7%
16.7%
16.7%
16.7%
100%
16.7%
16.7%
16.7%
16.7%
16.7%
16.7%
100%
16.7%
16.7%
16.7%
16.7%
16.7%
16.7%
100%
16.7%
16.7%
16.7%
16.7%
16.7%
16.7%
100%
16.7%
16.7%
16.7%
16.7%
16.7%
16.7%
100%
16.7%
16.7%
16.7%
16.7%
16.7%
16.7%
100%
16.7%
16.7%
16.7%
16.7%
16.7%
16.7%
100%
16.7%
16.7%
16.7%
16.7%
16.7%
16.7%
100%
16.7%
16.7%
16.7%
16.7%
16.7%
16.7%
100%
16.7%
16.7%
16.7%
16.7%
16.7%
16.7%
100%
16.7%
16.7%
16.7%
16.7%
16.7%
16.7%
100%
16.7%
16.7%
16.7%
16.7%
16.7%
16.7%
100%
16.7%
16.7%
16.7%
16.7%
16.7%
16.7%
100%
16.7%
16.7%
16.7%
16.7%
16.7%
16.7%
100%
16.7%
16.7%
16.7%
16.7%
16.7%
16.7%
100%
16.7%
16.7%
16.7%
16.7%
16.7%
16.7%
100%
33.4
33.4
33.4
33.4
33.4
33.4
200
Table 1: Contribution Breakdown Table
2
Contents
1 Individual Contribution Breakdown
2
2 Summary of Changes
6
3 Customer Statement of Requirements
3.1 Problem Statement . . . . . . . . . . . . . . . . . . . . . . . . . . . . . . . .
3.2 Background on Health Monitoring Analytics . . . . . . . . . . . . . . . . . .
3.3 Project Overview . . . . . . . . . . . . . . . . . . . . . . . . . . . . . . . . .
7
7
9
11
4 Glossary of Key Terms
13
5 System Requirement Analysis
5.1 Functional Requirements Table . . . . . . . . . . . . . . . . . . . . . . . . .
5.2 Non-Functional Requirements Table . . . . . . . . . . . . . . . . . . . . . . .
5.3 On-Screen Appearance Requirements . . . . . . . . . . . . . . . . . . . . . .
14
14
14
15
6 Functional Requirements Specifications
6.1 Stakeholders . . . . . . . . . . . . . . . .
6.2 Actors and Goals . . . . . . . . . . . . .
6.3 Use Cases . . . . . . . . . . . . . . . . .
6.3.1 Casual Descriptions . . . . . . . .
6.3.2 Use Case Diagrams . . . . . . . .
6.3.3 Fully Dressed Descriptions . . . .
6.3.4 Deprecated Use Cases . . . . . .
6.4 Traceability Matrix . . . . . . . . . . . .
6.5 System Sequence Diagrams . . . . . . . .
.
.
.
.
.
.
.
.
.
18
18
18
19
19
20
21
23
24
24
7 User Interface Specification
7.1 Preliminary Design . . . . . . . . . . . . . . . . . . . . . . . . . . . . . . . .
7.2 User Effort Estimation . . . . . . . . . . . . . . . . . . . . . . . . . . . . . .
31
31
32
8 User Interface Analysis
8.1 Domain Model . . . . . . . .
8.1.1 Concept Definitions . .
8.1.2 Association Definitions
8.1.3 Attribute Definitions .
8.1.4 Traceability Matrix . .
8.2 System Operation Contracts .
8.3 Mathematical Model . . . . .
8.3.1 Before Gathering Data
8.3.2 After Gathering Data .
35
35
35
35
36
36
36
37
37
37
.
.
.
.
.
.
.
.
.
.
.
.
.
.
.
.
.
.
.
.
.
.
.
.
.
.
.
.
.
.
.
.
.
.
.
.
9 Interaction Diagrams
.
.
.
.
.
.
.
.
.
.
.
.
.
.
.
.
.
.
.
.
.
.
.
.
.
.
.
.
.
.
.
.
.
.
.
.
.
.
.
.
.
.
.
.
.
.
.
.
.
.
.
.
.
.
.
.
.
.
.
.
.
.
.
.
.
.
.
.
.
.
.
.
.
.
.
.
.
.
.
.
.
.
.
.
.
.
.
.
.
.
.
.
.
.
.
.
.
.
.
.
.
.
.
.
.
.
.
.
.
.
.
.
.
.
.
.
.
.
.
.
.
.
.
.
.
.
.
.
.
.
.
.
.
.
.
.
.
.
.
.
.
.
.
.
.
.
.
.
.
.
.
.
.
.
.
.
.
.
.
.
.
.
.
.
.
.
.
.
.
.
.
.
.
.
.
.
.
.
.
.
.
.
.
.
.
.
.
.
.
.
.
.
.
.
.
.
.
.
.
.
.
.
.
.
.
.
.
.
.
.
.
.
.
.
.
.
.
.
.
.
.
.
.
.
.
.
.
.
.
.
.
.
.
.
.
.
.
.
.
.
.
.
.
.
.
.
.
.
.
.
.
.
.
.
.
.
.
.
.
.
.
.
.
.
.
.
.
.
.
.
.
.
.
.
.
.
.
.
.
.
.
.
.
.
.
.
.
.
.
.
.
.
.
.
.
.
.
.
.
.
.
.
.
.
.
.
.
.
.
.
.
.
.
.
.
.
.
.
.
.
.
.
.
.
.
.
.
.
.
.
.
.
.
.
.
.
.
.
.
.
.
.
.
.
.
.
.
.
.
.
.
.
.
.
.
.
.
.
.
.
.
.
.
.
.
.
.
.
.
39
3
10 Class Diagram and Interface Specification
10.1 Class Diagram . . . . . . . . . . . . . . . .
10.2 Data Types and Operation Signature . . .
10.2.1 Identity List . . . . . . . . . . . . .
10.2.2 DisplayChart . . . . . . . . . . . .
10.2.3 AccessProfile . . . . . . . . . . . .
10.2.4 Database . . . . . . . . . . . . . .
10.2.5 LocalUser . . . . . . . . . . . . . .
10.2.6 TwitterData . . . . . . . . . . . . .
10.2.7 Search . . . . . . . . . . . . . . . .
10.2.8 SendMessage . . . . . . . . . . . .
10.2.9 Controller . . . . . . . . . . . . . .
10.3 Traceability Matrix . . . . . . . . . . . . .
.
.
.
.
.
.
.
.
.
.
.
.
.
.
.
.
.
.
.
.
.
.
.
.
.
.
.
.
.
.
.
.
.
.
.
.
.
.
.
.
.
.
.
.
.
.
.
.
.
.
.
.
.
.
.
.
.
.
.
.
.
.
.
.
.
.
.
.
.
.
.
.
.
.
.
.
.
.
.
.
.
.
.
.
.
.
.
.
.
.
.
.
.
.
.
.
.
.
.
.
.
.
.
.
.
.
.
.
.
.
.
.
.
.
.
.
.
.
.
.
.
.
.
.
.
.
.
.
.
.
.
.
.
.
.
.
.
.
.
.
.
.
.
.
.
.
.
.
.
.
.
.
.
.
.
.
.
.
.
.
.
.
.
.
.
.
.
.
.
.
.
.
.
.
.
.
.
.
.
.
.
.
.
.
.
.
.
.
.
.
.
.
.
.
.
.
.
.
.
.
.
.
.
.
.
.
.
.
.
.
.
.
.
.
.
.
.
.
.
.
.
.
.
.
.
.
.
.
56
56
57
57
59
59
63
64
64
65
66
67
68
11 System Architecture and System Design
11.1 Architectural Styles . . . . . . . . . . . . . . . . . . . . .
11.1.1 Browser/Server Structure and 2-Tier Architecture
11.1.2 Tier Architecture . . . . . . . . . . . . . . . . . .
11.2 Identifying Subsystems . . . . . . . . . . . . . . . . . . .
11.3 Mapping Subsystems to Hardware . . . . . . . . . . . . .
11.4 Network Protocols . . . . . . . . . . . . . . . . . . . . .
11.5 Global Control Flow . . . . . . . . . . . . . . . . . . . .
11.6 Hardware Requirements . . . . . . . . . . . . . . . . . .
.
.
.
.
.
.
.
.
.
.
.
.
.
.
.
.
.
.
.
.
.
.
.
.
.
.
.
.
.
.
.
.
.
.
.
.
.
.
.
.
.
.
.
.
.
.
.
.
.
.
.
.
.
.
.
.
.
.
.
.
.
.
.
.
.
.
.
.
.
.
.
.
.
.
.
.
.
.
.
.
.
.
.
.
.
.
.
.
68
68
69
69
70
70
71
71
71
12 Algorithms and Data Structures
12.1 Algorithm . . . . . . . . . . . . . . . . . . . . . . .
12.1.1 Estimation of population concerning health
12.1.2 Word Cloud Algorithm . . . . . . . . . . . .
12.1.3 Database Querying for Word Cloud . . . . .
12.2 Data Structure . . . . . . . . . . . . . . . . . . . .
.
.
.
.
.
.
.
.
.
.
.
.
.
.
.
.
.
.
.
.
.
.
.
.
.
.
.
.
.
.
.
.
.
.
.
.
.
.
.
.
.
.
.
.
.
.
.
.
.
.
.
.
.
.
.
71
71
71
72
72
74
.
.
.
.
.
.
.
.
.
.
.
.
.
.
.
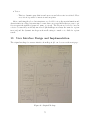
13 User Interface Design and Implementation
75
14 Design of Tests
14.1 Test Cases . . . . . . . . . . .
14.1.1 Deprecated Use Cases
14.2 Test Coverage . . . . . . . . .
14.2.1 Deprecated Cases . . .
.
.
.
.
82
82
83
85
86
.
.
.
.
.
89
89
90
90
90
90
.
.
.
.
.
.
.
.
.
.
.
.
.
.
.
.
.
.
.
.
.
.
.
.
.
.
.
.
.
.
.
.
.
.
.
.
.
.
.
.
.
.
.
.
.
.
.
.
.
.
.
.
.
.
.
.
.
.
.
.
15 History of Work, Current Status, and Future Work
15.1 Plan of Work . . . . . . . . . . . . . . . . . . . . . . . .
15.2 Project Coordination and Progress Report . . . . . . . .
15.3 Future Work . . . . . . . . . . . . . . . . . . . . . . . . .
15.4 Breakdown of Responsibility . . . . . . . . . . . . . . . .
15.4.1 The breakdown would expected to be as follows:
4
.
.
.
.
.
.
.
.
.
.
.
.
.
.
.
.
.
.
.
.
.
.
.
.
.
.
.
.
.
.
.
.
.
.
.
.
.
.
.
.
.
.
.
.
.
.
.
.
.
.
.
.
.
.
.
.
.
.
.
.
.
.
.
.
.
.
.
.
.
.
.
.
.
.
.
.
.
.
.
.
.
.
.
.
.
.
.
.
.
.
15.4.2 Merging the Contributions from Individual Team Members . . . . . .
16 Reference List
91
91
5
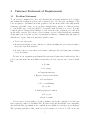
2
Summary of Changes
Our project goals from the beginning have changed substantially. Below are an itemization
of some of the most relevant changes.
• We no longer put an emphasis on integrating user experience and social engineering
with the product. It was far too ambitious in the planning stages to execute the ideas
we set out with given the level of resources within the team.
• User profiles and discussions about users and use cases related to users have been
removed.
– There are still references to users and profiles in this report. Section 8 preserves
a class diagram that could be used with an updated product that has users in it.
– There are deprecated use cases that can be seen in several sections, e.g. 12.1.1
and 12.1.2. These are preserved for posterity.
• There are several removed references to community tracking and providing health
suggestions. This is far too difficult of a task to carry out. We instead narrowed
our focus to more simple health tracking of the United States rather than specific
communities.
– As such, we have struck out this concept of a “hot city” and instead focus on
state-level segregation of tweet data.
• We streamlined our use cases down into the few that the system now implements.
There are clarifications added to specific use cases that deal with issues on using the
software.
• The algorithms section has been updated to match our statistical analyses and useful
equations when dealing with the weight of the word cloud.
• There are discussions on filtering that can be seen in the section on Interaction Diagrams.
• Several sections have been updated in the sense that they add more descriptions on the
final product as well as just cut down on material that is no longer relevant and this
applies to most if not all sections (including the Customer Statement of Requirements).
6
3
Customer Statement of Requirements
3.1
Problem Statement
To our devoted consumer base, It is our belief that the most important factors to a happy
and healthy life is physical exercise and a balanced diet. We can work our fingers to the
bone and party to our limits but it isnt possible to live the most balanced life without first
balancing our health. Some of you out there struggle with a variety of conditions related
to your health: type 2 diabetes, high blood pressure, high cholesterol, et cetera. It would
be much easier to manage these illnesses or even eradicate some of them if you could work
up the will to exercise. It is often too late for many of you to realize that theres something
wrong until your body hits a point of peak physical distress; communicating through you
with the use of pain. Pain is an undesired signal because:
• You do not enjoy pain.
• It arises in moments of severe distress; i.e. when something has gone wrong enough to
the point of medical attention.
• It often comes too late when you’d want to anticipate the problems pain is alerting
you to in advance.
We here at our organization understand the various problems related with exercise. In a
poll of our customers, the most likely reasons why you don’t exercise can be found on this
list:
• No time
• No energy
• Competing interests
• Haven’t developed the habits
• No motivation
• Too overwhelming
• Poor diet
• Current physical condition
• No access
• Lack of results
So how can we work together, you, the consumer, and us, the company, to break down
these barriers to entry for a healthier life? We have heard and understand your complaints,
and well take this opportunity now to explain how we think we can help you get in shape!
The operating principle is this: man is a social creature; it does not do well on its own
7
and needs community support to survive and thrive. This logic can be applied to you,
the consumer, as well; you are more likely to perform a task if you know you will have a
compatriot along for the ride. As such, we know you can be motivated to exercise by seeing
people you know working-out (and subsequently joining them) or by meeting more people
in your community who exercise as well, transforming a previously solo venture into a social
activity. We posit the following to you: there exists a definitive culture around those who
exercise regularly; it is not uncommon for people to be swept up in the exercise habits of
their friends. If your friend starts cycling as part of their commute and tells you that it gives
him/her clarity of mind, freedom of transport, and exercise as if that is an afterthought
then you are more likely to also start cycling in some way. There is no guarantee but it can
be asserted that at least the probability that you will take up cycling as a means to better
yourself. Fundamentally, this operating principle of exposure and awareness can serve as
a hook to a healthier lifestyle. Visual impacts cannot be ignored either; what if strangers
witness the newborn cyclist on his commute? It wouldnt be wrong to assume that this could
serve as the spark for an engine of change in yet another person to begin cycling: If them,
why not me? Now there is a domino effect of changing peoples lifestyles for the better. What
we assert now formally is the power of the acquaintance, the friend, to influence both you
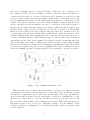
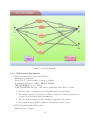
and their community-at-large by extrapolating the bicycle example to all types of exercise.
Figure 1: The community influencing a user.
This is all well and good. But we know that many of you have voiced that you lack the
social structure that would encourage this type of domino effect. More specifically, you may
lack friends or acquaintances who exercise daily and eat right or have not been impressed
upon by the friends you have about the importance of exercise in a fulfilling life. So the
question is no longer: How do I exercise? but How can I meet people who exercise? and
How can I find out how much of my community is exercising? This additional question is
important because we are, at our cores, competitive creatures. You are willing to better
yourself to match your community if you can. And this, finally, is where we step in to help
you, the customer.
8
To solve your problem, we plan to design and implement software to track the health
activities of your community, analyze the progress as a whole, and feedback the analysis to
you as a motivator. We intend on keeping track of whether your community becomes healthier or at least more physically active as a whole by aggregating any and all available data
in your neighborhood and surrounding communities. And there already exists a veritable
ocean of information to draw from: Twitter! This real-time social media engine generates
tweets by the thousands per minute on any variety of topics; the goal would be to focus on
the health related aspects and localization of the tweets.
With the big data analysis, we would be hoping to target some of the issues relating to
why people dont exercise:
• For many of you, no time is a baseless complaint; it often arises among those who are
unable to manage time effectively themselves. Obtaining a map of someones daily using
tweets can allow us to, if effectively compared against a person who has similar time
constraints that is exercising effectively, generate a plan of action or socially network
the lazy man and the exercising man together.
• We should be able to provide a means to understand why a person has no energy
from their social media data, if there is any. A mechanism should be put in place to
provide suggestions on how to improve their energy for exercise, be it comparison to
their friends, small changes in diets (using advertising), or adjusting their schedule to
find hours of the day where they dont feel tired and suggesting exercise there.
• For the problem of competing interests, a person could be informed about a type of
opportunity cost related to doing one task versus not exercising at all.
• This part is easy enough; it is only necessary for the person to be informed about how
their friends might be changing their activities or by viewing the status of a community
health board.
The last issue to address is of a personal nature to you, the consumer. We want the
software to be free and readily available to you at no cost. We expect it to be easy to find
what type of information you are looking for. We want you to be able to use wherever you
want; mobile or desktop. We also want to implement privacy options so that you have total
control over what you are showing to your friends or to your community, but we hope you
will share as much as possible! It takes a village to make a man.
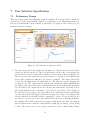
3.2
Background on Health Monitoring Analytics
Most systems today for personal activity monitoring focus on the benefits and rewards for an
individual user. The user may share this information with his or her friends, but everything
revolves around an individual. We have aggregated some active research work in analyzing
the health of an entire community based on big data from a social network.
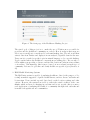
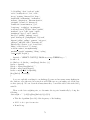
1. Healthcare Hashtag Project
9
Figure 2: The front page of the Healthcare Hashtag Project
The stated goal of this project is to make the use of Twitter more accessible for
providers and the healthcare community as a whole. How it works is that users are
able to use a search bar to scan the web for relevant hashtag data. The web would then
extract data from Twitter and display it in an analyzed, digestible form for the user.
Users can it to search for specific topics in natural language or by a specific hashtag.
People can find where the healthcare conversations are taking place, discover who to
follow within your specialty or disease, and find the best from conferences in real-time
or in archive. Unfortunately, this is more focused on an academic/research type of
community. It is used to globalize and clarify health care specific topics (diseases, et
al).
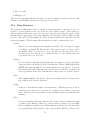
2. HMS Health Monitoring Systems
The EpiCenter system is capable of analyzing healthcare data for the purpose of detecting anomalies suggestive of public health threats, such as disease outbreaks and
bioterrorism. Users can find reported data based on the location, settings and other
options. However, the system is not able to reflect the actual condition of the community which we know is changing in real time and is not specific; this is a macro
scale application of analyzing the health of a community through viral outbreaks and
is meant for hospitals and not communities.
10
Figure 3: HMS: Health Monitoring Systems
These are the only two products we could find being offered to consumers and neither of
them, even combined, fully implement what we plan to do here. So we can conclude, with
some aplomb, that this approach is highly innovative.
3.3
Project Overview
To fulfill the requirements of our customer statement, we have defined the following criteria
as being mandatory for implementation with the software:
1. Generate real time health statistics for a certain area
We expect to be able to aggregate the Twitter data and extrapolate it to figure out
how much of a community (or city) is physically active and how much it isnt. We also
want to know the distribution of the involvement in different regions. This should be
updated as soon as tweets involving exercise come in.
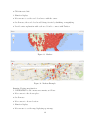
2. Heat Map
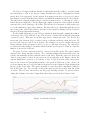
Based on the existing tweets from Twitter, we developed a graphical representation of
the distribution and concentration of the tweets across a given area; a heat map, where
different colors indicate different intensity levels. And how much of a community (or
city) is physically active in sports or other health related topics.
3. Marker Map
We will also display an output of the exact tweet data in a location on a map that
11
is separate from the heat map. This gives us the more discrete nature of the tweets
versus the distribution (although it can be used for that as well).
4. Tag Cloud
Tag cloud is used to display the frequency of the hashtags used when querying Twitter
for tweets.. The bigger the size of a hashtag is, the higher its frequency is. When
clicking a hashtag, the user will be redirected to the Twitter search site that shows the
most recent results for that tag.
12
4
Glossary of Key Terms
• Hashtags
– A word or a phrase prefixed with a pound symbol (#). Its typically used in social
media for denoting important phrases. On Twitter, its used for grouping topics.
• User/Customer
– A person who uses the Health Monitoring Analytics software.
• Administrator
– The person who is in charge of maintaining the software.
• Tweets
– 140 character statements delineated by hashtags that we are using to analyze the
health of a community.
• Database
– This is where the tweet information is stored after being pulled from Twitter.
• Real-time Graphics
– Used to illustrate aspects of regions of the United States as a function of how the
tweets are distributed. Analysis types include tweet aggregation by hour of day,
location, or distribution.
• Tag Cloud
– A pictorial representation of the most frequent hashtags using the size or color of
the words as a weighting factor.
• Heatmap
– A pictorial representation of the distribution of the tweets by grouping close-by
tweets together and assigning warmer colors to highly grouped messages.
13
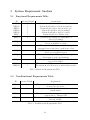
5
System Requirement Analysis
5.1
Functional Requirements Table
ID
REQ-1a
REQ-1b
REQ-1c
REQ-2a
REQ-2b
REQ-3
REQ-4
Priority Weight
5
5
5
5
5
5
4
REQ-5
4
REQ-6
4
REQ-7
3
REQ-8
3
REQ-9
2
REQ-10a
REQ-10b
1
1
Requirement
System should retrieve data from Twitter.
System should retrieve data from database.
System should retrieve data from Google.
System should filter data by hashtag.
System should filter data by location.
System should store Twitter data.
System should display the distribution of
data via a heatmap.
System should display all relevant
tweets as markers on a map.
The system should display a chart showing
aggregated tweet data based on the hour of day.
The system should provide statistics
based on geographical region.
The system should provide a tag cloud to display
the frequency of the used hashtags.
The system should link to Twitter when the
tag cloud is clicked.
The system should have a search function for users.
The system should allow users to find facilities nearby.
Table 2: Functional Requirements Table
5.2
Non-Functional Requirements Table
ID
Priority Weight
REQ-11
5
REQ-12
4
REQ-13
3
REQ-14
2
Requirement
The system should require minimum maintenance,
at most once per week.
Keep two copies of data for record in case of
system failure.
The system should remain functioning in the event
of an update to Twitters API.
The software shall present the graph and words in a neat
and tidy website.
Table 3: Non-Functional Requirements Table
14
5.3
On-Screen Appearance Requirements
The following represents the initial draft of what should be major on-screen requirements.
This is meant to be referenced with the figure below. The draft and this analysis has since
deprecated.
1. Welcome/Landing Page:
This is sort of the pre-website page. It displays information about what the interior
of the website contains and gives the user an idea of what he can expect and invites
them inside. A button would be on the screen somewhere that the user can press to
enter the website.
2. Home Screen:
This is more of the main page of the website. The home screen is the central hub for
the user to interface with the system and access all of its functionalities. Once on the
screen, the user would be faced with the following components:
(a) Search bar:
It allows the user to search for cities, communities, neighborhoods, relevant hashtags, or other users.
(b) Main Page:
This is an area of the screen that displays relevant information based on what is
typed into the search bar. If there is no text available, it will list the following
criteria:
i. Available cities - This is a list of hot cities relevant to the user.
ii. Facilities- This is a list of exercise or health related venues in the surrounding
area or in the hot cities.
iii. Search results list - This lists the results of a given search when a query is
entered into the search bar (see 1.).
(c) Output window:
This pane of the screen displays information about the community entered into
the search bar or selected from the main page. This type of information includes:
the current health of the population in the city, notifications about activities in
the city, and statistical results.
(d) Account drop-down menu:
This portion of the screen reveals a drop down list of buttons for the user to
interact with. This screen is mostly about preferences for the users profile.
i. Log in - This button brings the user to the login screen where he may log in
to the website.
ii. Personal page - This button brings the user to his personal profile page.
iii. Account settings - This button brings the user to the account settings page.
iv. Log out - This button is visible only if the user is logged in and will log the
user out.
15
(e) Google map window: This is a modified map ported over from Google Maps that
displays the locations of facilities and tweeters in the system.
(f) Data analysis windows: This displays real time analytics of the communitys twitter data. A user can view a histogram, chart, etc; any type of analytic data for
the community.
(g) Help link: This is a link that takes the user to the help screen.
(h) About link: This is a link that takes the user to the about screen.
3. Log in screen:
This is a dialog box where the user enters his or her login name and password to gain
access to his profile on the website. There exists a button on this box to register for
the service and this button navigates the user to the registration screen.
4. Registration screen:
This page is where the user enters their personal information to create an account for
the software.
5. Help page:
This is a page where tutorials are supplied for the user to help themselves learn how
to use the system.
6. About page:
This describes the motivation for the project.
7. Personal page:
This is a page where the users personal information is displayed back to them along
with other such relevant things like location, their recent activity, browsing history,
search history, and social networks.
8. Account settings page:
This page is where the user manages their personal account such as changing their
login or password or location, et cetera.
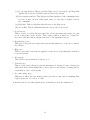
A sketch is listed below that explain most of what this section has enumerated.
16
Figure 4: Paper prototype of the user interface.
17
6
Functional Requirements Specifications
6.1
Stakeholders
1. Fitness Buffs
These are considered the most serious of people in the system; they are people who
spend an inordinate amount of their time on managing their health and well-being,
typically working-out around 3 6 hours per day and managing their intake of vitamins,
calories, complex sugars, carbohydrates, et cetera. There is no other person in the
system who is as serious about their fitness as they are. Their interest is in their own
fitness, almost exclusively.
2. Average Consumers
The average consumer is a person who does not work out regularly but is interested in
the system and what it can help them do. The system is geared towards helping this
subset of person by encouraging them to work out and broadcast their activities while
monitoring the community at large. Their interest is in using the system to improve
their health and in the health of his/her community.
3. Business Owners
Business owners are, more narrowly, people who own or operate gyms, health food
stores, health products lines, et cetera. Their interest is in using the system to figure
out how to target consumers that are more physically active and thus more likely to
use the product or to find new venues in areas that are lacking them but have the
potential to support them.
4. Academics/Researchers
This set includes those who work in universities or in corporate research that are
working in fields that require aggregation and analysis of data related to the health
of communities. The members could be from many different disciplines: nutrition,
dietetics, psychology, sociology, et cetera. Their main interest is in using the system
to further research results.
5. Government Officials Government officials is a highly diverse and wide spanning group
that includes people from local townships and municipalities all the way to the state
and federal levels with job titles ranging anywhere from councilperson to state senator.
Their interest in the system is in using it to guide policies or reform for a targeted
region by changing laws that could have an impact on health (e.g. Bloombergs soda
ban in New York City).
6.2
Actors and Goals
1. User
• Initiating type
18
• Goals: To interact with the system to find information about the health of a region,
to find people in his or her area who exercises a lot, and to leverage the systems full
functionality to assist themselves in living a healthier life.
2. Administrator
• Initiating type
• Goals: To further develop the system and improve its functionalities as well as maintain
the website and interface. Additionally, they perform customer service and deal with
maintaining the members quality of interaction.
3. Web User Interface
• Participating type
4. Tweets Database
• Participating type
5. Google
• Participating type
6.3
6.3.1
Use Cases
Casual Descriptions
• UC#1 Searching for Locations and Facilities
Requirements: REQ1c, REQ11a, REQ11b The user wants to perform a search for
locations or facilities nearby such that they can evaluate the statistics for that area
for their own perusal. They will be required to navigate to the search bar and enter a
query and then press Enter.
• UC#2 Viewing Statistical Breakdown
Requirements: REQ1a, REQ1b, REQ3, REQ6, REQ7
The user wants to view the statistical breakdown for the geographical regions of the
United States. They will navigate over to the charts and graphs region of the website
to view information such as: tweet data broken down by location, where the most
frequent tweets are coming from, and what time of day the most tweets are being
generated.
• UC#3 Viewing Results
Requirements: REQ1b, REQ2b, REQ3
The user wants to view how many tweets are collected, how many tweets come from
the U.S., how many of them have a location, and what fraction of the population that
is tweeting is exercising.
19
• UC#4 Viewing Map
Requirements: REQ1b, REQ1c, REQ2b, REQ3, REQ4, REQ5
The user wants to know how the tweets are distributed graphically using a map. The
user can view the information as a distribution via a heatmap or directly view all of
the tweets plotted on a map, where the marker can be interacted with to show the
content of a tweet.
• UC#5 Viewing Word Cloud
Requirements: REQ2a, REQ3, REQ9, REQ10
A user wants to view a word cloud containing the hashtags used to filter the data.
They will visit the website and view the word cloud from their home page which could
reflect the frequency of the hashtags depending on the size of the tag inside of the
cloud. Clicking on the tag will take the user to Twitter.
6.3.2
Use Case Diagrams
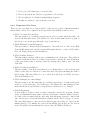
The use case diagram is shown in the figure below. Member, Visitor and Administrator
”initiate” all use cases, except for UC-2 (Choose Hot Cities), which is ”extend” from UC-1
(Location/facilities Search) as sub-use-case. Database A store tweet data for Member and
Visitor. Database B store members information for Member and Administrator. Thus, they
are ”participate” in all use cases. Member is generated from a Visitor when the Visitor chose
to run UC-10 (Register).
20
Figure 5: Use Case Diagram
6.3.3
Fully Dressed Descriptions
• UC#1 Searching for Locations and Facilities
Initiating Actor-Member
Actor Goal- To search available location or facilities.
Requirement Addressed - REQ1c, REQ10a, REQ10b
PRE-CONDITION- No precondition
POST CONDITION-The user could achieve results they want. Flow of events:
1. The user, visitor or member, types in his interested location/facility.
2. The system requests for the data from Twitter database about the tweets from a
location or about some facilities information.
3. The raw data get analyzed in data analysis component of the system.
4. The statistical and graphical results are shown in the interface page.
• UC#2 Viewing Statistical Breakdown
Initiating Actor - Member
21
Actor Goal - To view statistical breakdown
Requirements: REQ1a, REQ1b, REQ3, REQ6, REQ7
PRE-CONDITION- Data must be present in the database
POST CONDITION- The information is displayed to the user
Flow of events:
1. User goes to the main page to view the data
2. Data, if present in the database, is pipelined to the user
3. Charts are populated and presented as a breakdown
• UC#3 Viewing Results
Initiating Actor- Member
Actor Goal- To view results Requirement Addressed REQ1b, REQ2b, REQ3
PRE-CONDITION- Data must be present in the database
POST CONDITION- The information is displayed to the user
1. User goes to the main page to view the data
2. Data, if present in the database, is pipelined to the user after filtering
3. Results buttons at top are populated and presented numerically
• UC#4 Viewing Map
Initiating Actor- Member
Actor Goal- To view maps
Requirement Addressed REQ1b, REQ1c, REQ2b, REQ3, REQ4, REQ5
PRE-CONDITION- Data must be present in the database, Google connection must
be open
POST CONDITION- The information is displayed to the user
1. User goes to the main page to view the data
2. Data, if present in the database, is pipelined to the website
3. Map fragment is loaded in by Google
4. The map is populated with various tweets after geographic filtering
5. User can view the map breakdown
• UC#5 Viewing Word Cloud
Initiating Actor- Member
Actor Goal- To view results Requirement Addressed REQ1b, REQ2a, REQ3, REQ8,
REQ9
PRE-CONDITION- Data must be present in the database, Twitter website must be
available
POST CONDITION- The information is displayed to the user
22
1. User goes to the main page to view the data
2. Data, if present in the database, is pipelined to the website
3. Word weight size is calculated using hashtag frequency
4. Weights are updated, cloud is shown to the user
6.3.4
Deprecated Use Cases
These are use cases that are no longer viable because project goals to implement member
functionality could not be completed in the given time and with the team resources.
• UC#5 Accessing Personal Page
The user wants to access their personal page in order to peruse what the public can
view about them (the user). User will need to click on their name in the top right of
the screen or access the page through a drop down window.
• UC#6 Editing Personal Information
The user wants to change his/her information. User will need to click on the Edit
Personal Information tab and the system will navigate them to a series of fields where
they can change their personal information.
• UC#7 Sending Messages
The user wants to message a fellow user or administrator about an issue. They will need
to interact with the website by creating a new message, entering the user information
of the person they want to message, enter the message they wish to send, and then
click Send.
• UC#8 Viewing Search History
The user wants to view their search history to see things theyve looked at in the past
either because they are curious or because they have forgotten something and wish to
find it again. The user will need to go to their Personal Page via UC#5 and select
View Search History tab.
• UC#9 Changing Account Settings
The user wants to modify what they see on their personal page or what another user
would see on the users page. User will head to the Change Account Settings tab and
make alterations in various fields corresponding to what needs to be changed.
• UC#10 Registering
A user wishes to register a new account so that they can use the program; alternatively, an administrator may want to generate additional accounts for whatever reason.
Account creation requires that the user enter their full name, password, email, birth
date, and an array of optional information (Twitter handle, Facebook page, et cetera).
The user will navigate to this screen via either logging out if they are logged in and
hitting Sign Up or by finding the option on the landing page if they are not already
users. A registered users information is entered into the Member Database.
23
• UC#11 Backup Member Data
An administrative user wants to back up database memory in the event of runtime
failure. They will requisition the system to store data in parallel; one set is actively
updated during system runtime and the other set is updated periodically by polling
the active set.
• UC#12 Deleting Member Account
A user wants to delete their account because they are either not using the service
anymore, have made a new account, or are taking a leave of absence from it. They will
have the option of permanent deletion from the member database versus a suspension
of the account where it can be reactivated but is no longer visible by other users.
6.4
Traceability Matrix
UC#
Req #
1a
1b
1c
2a
2b
3
4
5
6
7
8
9
10a
10b
1
2
x
x
x
x
3
4
5
x x x
x
x
x x
x x x
x
x
x
x
x
x
x
Table 4: Traceability Matrix
6.5
System Sequence Diagrams
The traceability matrix shows the distribution of the requirements for each of the use cases.
These use cases are the key features of our software. Any user of our software can access
these. The user will interact with the the system (the website) and from there the websitre
will interact directly with the database and pipeline results back to the user.
24
Figure 6: Use Case Diagram 1a
25
Figure 7: Use Case Diagram 1b
26
Figure 8: Use Case Diagram 2
27
Figure 9: Use Case Diagram 3
28
Figure 10: Use Case Diagram 4
29
Figure 11: Use Case Diagram 5
30
7
User Interface Specification
7.1
Preliminary Design
This section represents our preliminary design and analysis. It is not updated to match the
current specs because it was initially planned as a drafting proposal. Many things mentioned
here are not implemented such as member databasing or logging in. Here is the proposed
main user interface webpage:
Figure 12: User interface specification draft.
1. The visitor (user who is not registered) can input one of his/her interested cities in the
search bar, and hit search icon. The google map will zoom in to the corresponding city
and the tweeter users locations will be marked red in the map as shown in Figure 4-1.
The tweeter users who mentioned physical activities or concerns about health in their
tweets will be marked in different color (blue for example). The visitor will clearly
see how the distribution spreads within this city. The map also enables dragging and
zooming in/out. The output window will show the statistical results estimating the
percentage of the tweeter users who actually mentioned about health in this particular
city. In addition, the output window also shows some notifications depending on how
this citys health awareness comparing to other cities in our database. For example, if
the city shows low percentage of people mentioned about physical activities and health
concerns, the system will output a notification saying, According to our analysis, this
city has relatively low health activities comparing to others. People in this city are
encouraged to exercise more. Or some notification about how it is changing with time.
For example, The health activity is decreasing recently in this city. The data analysis
window will show the variation of this statistical result (in percentage) corresponding
to time. The visitor can see how peoples awareness/concern of their health changes
31
over time in this city. It can also switch to other types of diagrams such as tables when
the visitor click on the switching layout within this graphic window.
2. Alternatively, the visitor can click on one of the hot cities shown under main page
section. Same results will show in these output windows as stated above. However, in
this case, visitor doesnt have to input the city in the search bar.
3. The visitor can input a health facility in the search bar. The map will mark all the
locations of the health facility in the United States. The visitor can zoom in to different
cities to see the distribution of these facilities in different places. For example, searching
for swimming pools would result in showing all large/popular swimming pool facilities
in the United State. At the same time, the map will mark twitter users who mentioned
similar topic in their tweets with blue dots and mark all twitter users in database with
red dots. The visitor can see distribution and percentage of people mentioning about
this facility or the corresponding activity.
4. The member (user who has registered) can use these two features stated above that all
visitors can use.
5. The member can log in to use some additional features about accessing his/her own
page, managing friends, and sending messages to friends.
6. For managing friends, a member can add a friend from a list of recommended members
of our software who are interested in talking about health activities. A member may
also delete a friend.
7. For sending messages, a member can send a message to a friend talking about heath
topic or whether they want to walk out together.
Above are the main features for our software. More features would be added in as stated
in the system requirements.
7.2
User Effort Estimation
Our system is very easy to use. We tried to design it with minimum user effort to accomplish their goal of checking community health activity awareness and entering simple social
networking platform.
The visitor who just wants to check the health activities awareness in certain city and
obtain some statistical data:
1. NAVIGATION (several keystrokes and one click)
• Navigate to our software webpage (several keystrokes; inputting http address)
• Main interface page is brought to the visitor
• Close our webpage when finished (one click)
2. DATA ENTRY (several keystrokes and one click)
32
• Input city/facility in the search bar (several keystrokes)
• Click on the search icon (one click)
• The analyzed statistical data and graph will show to the visitor (0 effort)
3. Or Alternatively, (only one click)
• Click on one of the hot cities in main page window (one click)
• The analyzed statistical data and graph will show to the visitor (0 effort)
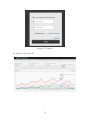
The visitor who wants to register to a member:
1. REGISTRATION NAVIGATION (two clicks)
• Click on log in button (one click)
• A new page pops up asking for user name and password, and an option of registration. (0 effort)
• Click on the register link (one click)
• A registration page pops up asking for information
• Done with registration
2. INFORMATION FILLING (several keystrokes)
• Account Registration Part 1 (Instructions and how to use the application)
• Account Registration Part 2 (Disclaimers and Permissions)
• Account Registration Part 3 (User information)
• Done with registration and a personal page is set at the same time.
The member who wants to add a friend:
1. ADDING FRIEND (five clicks and several keystrokes)
• Click log in button (one click)
• Input user name and password in the coming page (several keystrokes)
• Click done to go back to the main page (one click)
• Click on drawdown button and select personal page button (two clicks)
• In the personal page, look for a friend in the recommended list and click + symbol
to add. (one click)
• Done adding a friend.
• The page will show the access to this friend.
The member who wants to send a message to a friend:
• Click log in button (one click)
33
• Input user name and password in the coming page (several keystrokes)
• Click done to go back to the main page (one click)
• Click on drawdown button and select personal page button (two clicks)
• In the personal page, select one added friend (one click)
• A message box shows up asking for message content.
• Type in message (several keystrokes) 8] Click send (one click).
34
8
8.1
User Interface Analysis
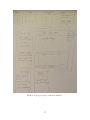
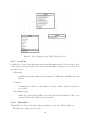
Domain Model
Figure 13: User Domain Model
8.1.1
Concept Definitions
To analyze the domain model, we first derive the domain model concepts and corresponding
responsibilities from the formerly defined system use cases. Table 5-1 lists all the domain
model concepts and corresponding responsibilities.
Type
Concept
Responsibilities
Handle requests from user
/
Controller
Display data in numerical/graphical form
/
Interface
Analyze data depending on the search request.
D
Data Analysis
Render search request to Tweet Database
D
Communicator
Access Tweet Database and execute request.
D
DB Connection
Receive notification from Data Connection
D
Controller
Table 5: Responsibilities, Types, and Concepts Table
8.1.2
Association Definitions
Some of the concepts defined above as domain concepts have to work in certain patterns to
finish some target requirements. Table 5-2 gives the corresponding association definitions
based on the defined domain concepts.
35
Concept Pair
Database
DB
Data Analysis
DB Connection
Database
Data Analysis
Association Description
Association Name
Connection Database forms a DBConnection
Store/Retrieve
to send information to the system.
DBConnection passes the information from
Render
the Database to DataAnalysis.
Database sends information through
Calculate
Data Analysis to be processed.
Table 6: Association Definitions
8.1.3
Attribute Definitions
Responsibilities
Attribute
Know if the user input keywords to search
Awaiting Search Request
for data and information
Display a map to show results
Map
Display a list of results that have been searched
Search Result
Display analyzed data in visualized form
Data Display
Analyze data from Twitter database
Analyze Data
Table 7: Attribute Definitions
8.1.4
Traceability Matrix
Domain Concept
Controller
Interface
Data Analysis
Communicator
DB Connection
UC1 UC2 UC3 UC4 UC5
x
x
x
x
x
x
x
x
x
x
x
x
x
x
x
x
x
x
x
x
x
x
x
x
Table 8: Traceability Matrix
8.2
System Operation Contracts
System Operation Contracts for the operations of the fully-dressed user cases.
• Searching for Locations and Facilities
1. PRE-CONDITION- No precondition
2. POST CONDITION-The user could achieve results they want.
• Viewing Statistical Breakdown
36
Concept
Controller
Interface
Interface
Interface
Data Analysis
1. PRE-CONDITION- Data must be present in database
2. POST CONDITION-The information is displayed to the user.
• Viewing Results
1. PRE-CONDITION- Data must be present in database
2. POST CONDITION-The information is displayed to the user.
• Viewing Map
1. PRE-CONDITION- Data must be present in the database, Google connection
must be open
2. POST CONDITION- The information is displayed to the user
• Viewing Map
1. PRE-CONDITION- Data must be present in the database, Twitter website must
be available
2. POST CONDITION- The information is displayed to the user
8.3
Mathematical Model
8.3.1
Before Gathering Data
At any time, the user will want to perform analysis on city or location theyre searching for.
The system will need to search for information based on tweets in the area, of which there
are N. They will process data based on M hashtags identified b the system as being relevant
to analysis. There are assumed to be A users in a given area that tweet about health and B
users in an area that do not tweet about health (and are, for simplicity, assumed not health).
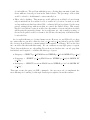
For simple statistics, the analysis becomes:
% Of Healthy P opulation =
8.3.2
A
∗ (P opulation Census)
A+B
(1)
After Gathering Data
There is always noise present in the data when we search for tweets and the system needs to
compensate for that. There will be users who discuss information in a sarcastic way or attach
hashtags to their tweets that are irrelevant to what theyre saying and can be mislabeled by
the system. To compensate, we need to target a users tweet directly and then search their
history. If their history gives an indication that they are health conscious or that theyve
used this hashtag multiple times before in a relevant way (gauged by retweets), then the
data is compensated. As time goes on, tweeters will be given a probability weight that their
tweet is useful and compared to a threshold.
We collected all the tweets about health and exercise with a set of hashtags. After filtering
out all the tweets having no information about location, we counted the number of tweets
in US concerning about the health and exercise (noted as B). After researching online, we
37
found that 8% of US people use Twitter. Therefore, dividing the number of tweets from US
by 8% (denoted as B/0.08), we get the number of people in US who exercise. But this is not
the total number of people in US who exercise because we havent collected all the health
related tweets in US. The tweets we obtained is just a subset of all health related tweets
from US. As we collect more data, the number of collected tweets will increase, so as the
number of people in US who exercise. Our estimated number will get closer and closer to
the true value as time goes. There are some limitations on the accuracy of our estimated
number of people in the US who exercise. We can only get closer to the true value by may
never be able to reach that number. Another factor is that there may be more than one
tweets about exercise sent out by one person. This person is counted more than once. Future
improvement on this project can refine the algorithm to count the number of Twitter users
who tweets about health and exercise instead of the number of tweets.
Originally, we were planning to get all the tweets from one area (either a city or a state).
Then, we planned to find out the number of tweets having physical exercise information by
finding some keywords from the tweet content. Then we will have the total number of tweets
T and the number of tweets that are health or exercise concerned A. In that case, we can
calculate the percentage of people in that area who concern about health and exercise. As
we start implementing it, we realized that this is kind of impractical. The number of tweets
from a city (for example NYC) is so large and the number of tweets mentioning health and
exercise is so small. We have storage problem for the massive Twitter data and we would
get a lot of noisy tweets (not related to health) at the same time. Therefore, we switch to
some more practical ways. We only pull the tweets having specific set of hashtags. Although
there is no any total number of tweets from one area for percentage calculation, we can
still compare the difference in health related tweet number across different states. This also
indicates the popularity of health and exercise across different states.
38
9
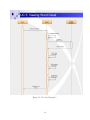
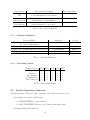
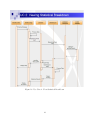
Interaction Diagrams
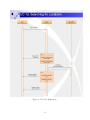
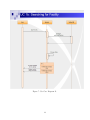
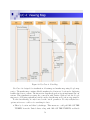
Figure 14: Use Case 1a: Searching for Locations
39
Use Case 1a is designed with the intention of giving the user the privilege of searching for
location data through the user interface. This is important for the general functionality of
the application; the ability to search for health-related data is the crux of the design goals.
The interaction diagram displays the process the system needs to go through in order to
handle a query from the user and correctly display the output. The user needs to navigate
to the index page or any page of the website where the search functionality is enabled. From
there, they can type their query into the search bar and wait as results are compiled for
them from the system. There is visible error handling in the diagram for the instance where
the strings are not valid (or if they are partially complete).
40
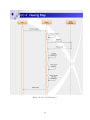
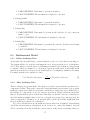
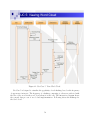
Figure 15: Use Case 1b: Searching for Facilities
41
Use Case 1b is designed with the intention of giving the user the privilege of searching
for facility data through the user interface. This is important for less ancillary goals of the
application; the ability to search for facility data is used to suggest places for the user to go
rather than showing data. The interaction diagram displays the process the system needs
to go through in order to handle a query from the user and correctly display the output.
The user needs to navigate to the index page or any page of the website where the search
functionality is enabled. From there, they can type their query into the search bar and wait
as results are compiled for them from the system. There is visible error handling in the
diagram for the instance where the strings are not valid (or if they are partially complete).
42
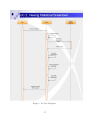
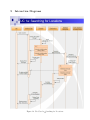
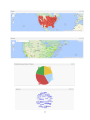
Figure 16: Use Case 2: View Statistical Breakdown
43
Use Case 2 is designed with the intention of giving the user the ability to view statisitcal
breakdown data. Graphical data here refers to the breakdown of tweets by contiguous regions
of the United States. The interaction diagram displays the process the system needs to go
through in order to handle the users input and correctly display the output; it waits for a
user request and then generates the correct chart type off of that. The user needs to navigate
to their index page to see the analysis in a more direct fashion. The user will see pie charts
that split the tweets into four regions of the United States, and those four regions are further
broken down into the later 50 states that make them up.
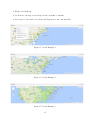
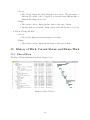
Following is the description about how we collected tweet data and categorize them based
on the location:
All of our tweets are pulled corresponding to a set of hashtags. Most of the tweets that
we collected don’t have location data, so the latitude and longitude values are 0 for them.
Only a small portion of the tweets that we collected have location information provided with
latitude and longitude. Ideally, we can use reverse geo coding to obtain the exact address
for each tweet that has latitude and longitude values. However, Google map service for
geo coding has special limitation of the number of requests we can make in one day. Our
massive twitter data needs more than Google’s limitation. Sticking with less cost policy for
our class project, we decided to use an alternative way: the bounding box idea for each state.
Considering the difficulty to use bounding box for each city, we divided the US tweets for
different state. To define a bounding box for one state, we only need to know the minimum
latitude, minimum longitude, maximum latitude, and maximum longitude that the state
covers. Therefore, we defined these four extreme values for the bounding box of each state.
All the tweet locations that fall into a box will be marked as tweets from that corresponding
state. Since bounding boxes are rectangular, they wouldn’t fit the state boundary perfectly.
This would cause some mistakes in the state determination. However, this is the second best
way we can find besides using the reverse geo coding.
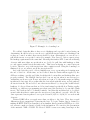
We obtain the extreme values of latitude and longitude for each state online. Then all
of these data are included in the program to estimate the state of each tweet location. In
other words, each tweet with location has to go through a loop to determine which state it
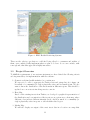
belongs to. See Figure 1 for an example of the bounding box for Arkansas. This is plotted
with one of our bounding box data. Four makers indicate four corners of the bounding box.
We can see from the figure that one of the marker lands on Mississippi.
44
Figure 17: Example of a bounding box
We couldn’t design the filter to have a set of hashtags and a specific location during our
data mining. In other words, we can choose to pull all the tweets with a set of hashtags, but
we have no control on where these tweets should be from. Alternatively, we can choose to
pull all the tweets on a specific location (for example “New Jersey”), but we cannot set up
the hashtag requirement at the same time. Knowing that twitter API doesnt allow filtering
of tweets with more than one specification, we decided to pull data with hashtags so that
we only extract useful data from twitter site. This leaves us having no control in tweets
location. Therefore, we got the tweets from other countries as well. Using the bounding box
illustrated above, we extract out all the tweets from US.
As for the data, the period collected initially was over a one month period starting near
the end of October. At the time, we had believed that the Twitter filters applied by the
API were working correctly and didnt check that the location filter and hashtag filter were
properly working. The MySQL database had been set up but when it was reviewed no
outstanding errors were seen. It was only when we begin to do the marker maps and filling
in with tweet data text did we realize that the data was horrifically noisy; we had gathered
all tweets from the US and added onto that tweets filtered by our specific health related
hashtags. So the problem was that we did not understand specifically how Twitter applies
its filters; e.g. this was a programming error that caused the database to become full of junk
tweets. The database had to be flushed entirely. And then the modifiers had to be played
around with after that to make sure the tweets were being filtered correctly. All told, the
demo represented tweets gathered over a period from 11/29/13 to 12/06/13 one week worth
of tweets.
Twitter DOES allow you apply more than one filter to the data. They have several
different predicate parameters for querying the data. To begin, Twitter data is obtained by
making an HTTP POST (as I am sure you are familiar, this is a standard HTTP protocol for
web servers to make a request for data) for the information. We can select the presentation
of the material: XML or JSON. We selected JSON because were using Javascript on the
45
server side to data processing and rendering. The data, when queried from our DB, would be
sent as a JSON to be parsed by Javascript later on. As for the query structure, an example
would be as the one they supply in their API code:
https://stream.twitter.com/1.1/statuses/filter.json?delimited=length&track=twitterapi:
This is what we are POSTing to. Everything after the filter.json? are parameters that we
can set ourselves and then append onto the URL with ’&’ symbols. The parameters are:
• Follow
– Follow is a comma separated set of user IDs. (So follow=twitterapi to find @twitterapi tweets ). The server will return all tweets for the specified user IDs containing:
∗
∗
∗
∗
User generated tweets
Tweets retweeted by the user
Replies to any tweet the user made
Retweets of the users tweets by other people
– It does not have:
∗ Tweets with the users name in it
∗ Tweets from users with privacy centric settings (e.g. private users)
• Track
– These are the list of keywords to track (in other words, the hashtags). This is
also a comma separated list of characters. We are not able to do exact searching(e.g. like typing “donuts krispy Kreme” into Google with quotes to ensure the
results contain these words). We can’t exactly delimit by hashtag either, because
the streaming API for this parameter when we search for “twitter” returns any
instance of it; TWITTER, twitter, “Twitter”, #twitter, twitter, etc. So even
if we search for “#twitter” we’re still going to introduce noise that isnt related
to our hashtag. We can search for multiple hashtags with this; it’s the primary
parameter for our search.
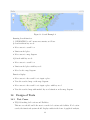
• Locations
– This is a CSV list as well of parameters. The Twitter API parses in sets of twos
to look at the latitudes and longitudes. The API takes four GPS coordinates (two
latitudes, two longitudes) and uses those to create a “bounding box” as shown
below:
46
– The bounding box has the two GPS pairs as red dots in the corners. We capture
the black point inside the red filled box and ignore everything outside of it.
– Bounding box is NOT used in conjunction with other filters. Using location and
track together (say location is set to New York and track is looking at #twitter,
then we would get all tweets related to New York and all tweets related to twitter. So you’ll pull about 1,000 tweets from NY about things totally unrelated
to #twitter and then youll pull all tweets worldwide as well that only deal with
#twitter.
• Delimited
– This parameter lets you set how long you want the tweet to be that you’re searching for.
• Stall warnings
– This is a logical yes or no that just sets whether or not you want stall warning
set. This sends messages back to you about whether or not you’re about to
be disconnected. People using the streaming API have their bandwidth limited.
Since we are using firehose on the streaming API, we grab as many tweets as
we can before Twitter truncates our connection. Ideally, we would keep it open
forever but at some point, since we are not business customers, we cannot make
heavy demands on their servers for very long. Connections can be unlimited but
the bandwidth used by it is capped; a status warning would send typical warning
back to you about how much percent you are towards getting cut off so you can
adjust your stream requests on the server end.
Since we are running a Linux server on our host, we have access to what is called a cron
job. A cron job is just a script that is scheduled by the server to occur at periodic intervals
by invoking the cron command on the PHP script. So the task can be scheduled by our web
host to run two times an hour per any job at a specified time (xx:05 & xx:15, for example so
twice an hour at 5 minutes after and 15 minutes after). However, we can schedule multiple
cron jobs to occur per hour. So this means the tweet retrieval script can be run once a
minute if we schedule 30 jobs that occur at (xx:00, xx:01) and (xx:02,xx:03) et cetera. Our
setup is two cron jobs to do the tweet retrieval that run at (xx:00,xx:15) and (xx:30,xx:45).
More can be scheduled but it didnt seem worth the benefit because we can retrieve tweets
we already have before; it is a delicate balance.
47
The alternative was to keep the stream open as long as possible by having the server
execute the tweet retrieval script in the back ground. Designating a script with nohup when
running it in Linux tells the server to continue running the script even if the user who called
it is disconnected from it. This seemed very ideal for us because that means we could get
tweets forever without impunity. However, two issues arose:
• The bandwidth limiting from Twitter. We can keep the stream open as long as we want
but at some point Twitter itself will cut us off anyway. We didnt exactly experience
this because of the second reason.
• We were running off of shared hosting from our web host, GoDaddy. Shared hosting
is an inexpensive hosting service where we share the server time and space with other
user accounts on the website. Running a script with nohup on shared hosting means
that youre stealing resources away from everyone else. A nohup will run for a little
whiel (about 7 minutes I believe) on GoDaddys shared hosting before they step in and
terminate the script forcibly.
So these two reasons are why we had to resort to cron jobs to pull tweets. This data
was collected at these discrete time intervals. So it’s not a continuous open socket of data
retrieval; the data is retrieved for about 3 5 minutes at a time before the connection is
severed. So we retrieve tweets for 3 5 minutes every 15 minutes or so. So there are gaps
where there are no tweets collected at all until the next time marker for another scheduled
cron job.
48
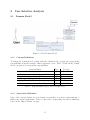
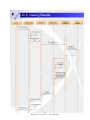
49
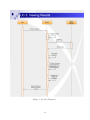
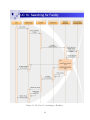
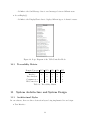
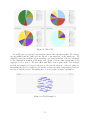
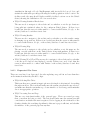
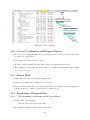
Figure 18: Use Case 3: View Results
Use Case 3 is designed with the intention of giving the user the ability to view the results
the system has to offer on its data processing. Results here refers to displaying how many
tweets have been aggregated by the system, how many tweets have a proper geolocation,
how many tweets are from the United States, and finally how many tweets are in each state.
The interaction diagram displays the process the system needs to go through in order to
handle the user’s input and correctly display the output; it waits for a user request and then
generates the correct chart type off of that. The user needs to navigate to their index page
to see the analysis in a more direct fashion. The user will see pie charts that split the tweets
into four regions of the United States, and those four regions are further broken down into
the later 50 states that make them up.
For the result displaying, we also added a statistical analysis graph counting the number
of tweets produced over 24 hours of day. The tweets we obtained also include the time when
a tweet is posted. This gives us another approach to analyze the data. We divided the
tweets into four divisions based on their location: northeast, midwest, south, and west. We
processed the data for each location division. For example, we need to analyze the tweets
from northeast. In the program, we have a loop to go through each tweet. For each tweet,
we extract the time string to determine which hour the tweet is posted. Then we count the
number of tweets for each hour.
We plotted “tweet count vs hour-in-day” curves for four US regions. The curves change
when we have larger amount of tweets. We constantly pulling data from twitter and our
website automatically updates with the most recent data. From the curves we showed in
demo 2, west seemed to tweet about exercise at about 6pm after work. Figure 2 shows the
current distribution of tweets over 24 hours of day. People from west (blue curve) tweet
more about exercise in 7pm judging from the curve peak at 17th hour of days. As we can
see from current curves, people in south tweets most at around 10am and 5pm judging from
the two peaks of the curve. The curves generally becomes more flat comparing to what we
had in the demo day. We can still see the hours when people tweet more from the peaks
of curves. The red curve shows the total US people tweeting activity. People tweet more
during the daytime from 9am to 10pm than other time periods such as 12am to 6am.
Figure 19: Statistical Graph
50
It is possible that your results are affected by a small sample size We only have a small
number of users collected for a given community, so their individual habits can become
prominent, especially if the time they tweet at during a given day is presumably constant.
We only collect tweets 3 5 minutes every 15 minutes so if users tweet at the same time every
day then we could be biasing our data with that information.
We have about 300k users from whom we pulled data from over the 1.5 weeks. Not all of
these users are relevant; the problem is many do not have location enabled on their devices
and of the ones that do not all of them reside in the United States. So, as the problem before
with gathering many useless tweets, we have many tweets from what we can consider to be
useless users. The interface should be updated with the amount of users who are generating
useful tweets as well os we can obtain an idea of how large a subset we are dealing with as
far as people who tweet and people who care about their health.
51
Figure 20: Use Case 4: Veiw Map
Use Case 4 is designed for visualization of heatmap and marker map using Google map
service. The marker map contains clickable markers placed in tweets’ locations for displaying
health-related tweet content. The interaction diagram shows how it gets implemented in our
system. This visualization requires the connection with Twitter database and the Google
map service. Following explains in detail about the data filtering and location categorization:
For the data filtering, we only focused on the “track” parameter. We only really had two
options as far as we could see for searching for data:
• Filter by location and filter by hashtags. This means we could pull ALL OF THE
TWEETS from the United States along with ALL OF THE TWEETS worldwide
52
about healthcare. The problem with this is were collecting huge amounts of junk data;
theres millions of tweets per hour in the United States. The percentage of those that
would be related to health must be astronomically low.
• Filter only by hashtag. This means we would pull tweets worldwide about relevant
subject material but we wouldnt be able to restrict it by location. As such, we would
end up with tweets that have their GPS coordinates hidden (as adjusted by the users
privacy settings) along with tweets that are outside the United States. This seemed
like the best solution because it would reduce the number of tweets and the noise while
still keeping the material relevant. As it would turn out, only a small percentage of
the tweets we pulled would be relevant to the US since the majority of them have their
location hidden.
As for explicit filtering, we obtained many tweets. However, in our SQL table, we have
two entries that we can use to filter the data: geo lat and geo long (when we get the JSON
file of a tweet from Twitter it contains latitude and longitude coordinates. We sort the data
into our tables like that with this name). We can construct an easy SQL query to request
Tweet data such that we are only pulling Tweets from our database into our web page that
has latitude and longitude coordinates like this type of query:
• $latquery = “SELECT geo lat FROM tweets WHERE geo lat!=0 ORDER BY geo long”;
• $longquery = “SELECT geo long FROM tweets WHERE geo long!=0 ORDER BY
geo long”;
• $textquery = “SELECT tweet text FROM tweets WHERE geo lat !=0 ORDER BY
geo long”;
Then just execute the query via PHP commands. On our server end, we implement the
tweet filtering via bounding box through JavaScript as explained in another answer.
53
Figure 21: Use Case 5: View Word Cloud
Use Case 5 is designed to visualize the popularity of each hashtag based on the frequency
of appearance in tweets. The frequency of a hashtag comparing to others are reflected with
the size of the word in the word cloud when it is in focus. The interaction diagram shows
the general data process of word cloud implementation. Following shows the hashtags for
the word cloud.
54
’#run’
’#running’
’#jogger’
’#marsic’
’#fitness’
’#fit’
’#fitforlife’
’#mefirst’
’#chest’
’#workout’
’#diet’
’#cardio’
’#fitspo’
’#instahealth’
’#fitspiration’
’#fitnessmotivation’
’#resultssofar’
’#transformation’
’#morningrun’ ’#workoutsoicaneat’
’#trainhard’
’#grow’
’#instafitness’
’#ripped’
’#pushup’
’#pushups’
’#pushpullgrind’
’#bigbench’
’#gymrats’
’#eattogrow’
’#fitnessmodel’
’#fitnessaddict’
’#lifting’
’#addictedtoiron’
’#smashfit’
’#squash’
’#losing weight’
’#keepfit’
’#gym’
’#jog’
’#jogging’
’#exercise’
’#exercising’
’#exercises’
’#fitfam’
’#seenonmyrun’
’#fitnessfriday’,
’#gymtime’
’#healthy’
’#bodybuilding’
’#getfit’
’#active’
’#healthychoices’
’#strong’
’#training’
’#fitnessaddict’
’#trailrunning’ ’#trailrunner’
’#trailrun’
’#gettingfit’
’#dreambody’
’#fitnessgoal’
’#goal’
’#dontgiveup’
’#weightloss’
’#TFLers’
’#tflers’
’#gymlife’
’#bulk’
’#squat’
’#squats’
’#swole’
’#muscle’
’#shredded’
’#sweat’
’#grind’
’#fitnessgear’
’#fitgram’
’#pullup’
’#pullups’
’#physique’
’#nikeplus’
’#nike+’
’#trainer’
’#yoga’
’#ironaddicts’
’#bootcamp’
’#workout’
’#strengthtraining’
’#swimming’
’#biking’
’#cycling’
Table 9: Table of Used Hashtags
These tweets were selected by looking at the hashtags correlated with tweets about fitness.
Since we are not limited by the number of hashtags, we grabbed any that seemed relevant.
Problematic hashtags are ones that seemed good but ended up generating junk data. #health
always seemed to correlate to news results or current events; e.g. bioterrorism. Never saw
any tweets with #health that had anything to do with our study. #train was also similar;
it generated results about trains and accidents that occurred recently or people complaining
about being late for the train. So this is an issue with context.
As for when we do the search, we get a list of hashtags associated with the tweet every
hashtag the user used. So if we don’t know what hashtags to look for, we only need a
few health related ones (e.g. fitness) and then we would get tweets from users that are
relevant with #fitness and would contain many more hashtags with it that were likely relevant
because the users tend to group their tags in this way (heuristically). So one can increase
the sample space of where to search for by increasing their tag number, of course at some
point increasing hashtags in this way must result in no returns at all. We imagine the curve
would be something like a decaying exponential that rises to a constant value and stops or
a sort of log(t) graph (again, heuristically). So the # of hashtags is generally greater in
our data base than the # of tweets themselves and this makes sense (200k hashtags for 10k
tweets, so about 20 hashtags on average per tweet).
55
10
Class Diagram and Interface Specification
In this section, we describe the framework of our application.
We originally intended for users to be integrated into the system, but after final review it
wasn’t possible. However, this design could be implemented later as well with what we
have finished to fully integrate users into the system. So we elected not to make changes to
preserve its functionality.
10.1
Class Diagram
Figure 22: Class Diagram
56
The figure illustrates most of classes and their interaction in this software-to-be. In this
project, we mainly have five classes and two derived class LocalUser and TwitterData. Every
time user reaches the user interface and makes a request, then the controller will pass data
retrieve request to the database. In response, database would send requested data package
to the controller. The controller would then call relevant functions with data package to
meet the user request.
10.2
Data Types and Operation Signature
10.2.1
Identity List
The first class, IdentityList, contains all of the users personal information inside the following
variables:
• Username
– String variable corresponding to the users username.
• Password
– String variable corresponding to users password.
• Email
– String variable corresponding to users email.
• Administrator
– Boolean variable indicating whether or not a user is an administrator (TRUE) or
a normal user (FALSE).
The functions of this class are listed below. These include various set and get functions
for class encapsulation along with functionality for the administrator to manage a given users
account information.
• getUsername()
– Typical get function. Is used when the system needs to retrieve a username from
an associated instance of the IdentityList object. Returns the current value of the
username variable.
• setUsername($username)
– Typical set function. It is used when the system needs to change/specify a username for an associated instance of the IdentityList object. This would be called
when the user is registering or trying to change their personal information (as detailed in the use cases). Calling this function updates the value of the username
variable and forwards the change to the database.
• getPassword()
57
– Typical get function. Is used when the system needs to retrieve a password from
an associated instance of the IdentityList object. Returns the current value of the
password variable.
• setPassword($password)
– Typical set function. It is used when the system needs to change/specify a password for an associated instance of the IdentityList object. This would be called
when the user is registering or trying to change their personal information (as
detailed in the use cases). Calling this function updates the value of the password
variable and forwards the change to the database.
• getEmail()
– Typical get function. Is used when the system needs to retrieve an email from an
associated instance of the IdentityList object. Returns the current value of the
email variable.
• setEmail()
– Typical set function. It is used when the system needs to change/specify an email
for an associated instance of the IdentityList object. This would be called when
the user is registering or trying to change their personal information (as detailed
in the use cases). Calling this function updates the value of the email variable
and forwards the change to the database.
• isAdmin()
– This is called by the system in the event that a user attempts to access Administrator level privileges. Returns the current value of the administrator variable.
• setAdmin(admin:boolean)
– Typical set function. It is used when the system needs to change/specify Administrator privileges for an associated instance of the IdentityList object. This would
be called when the system or another Administrator is changing user privileges.
Calling this function updates the value of the administrator variable and forwards
the change to the database.
• addUser($newUser)
– This function is called when a new user is registering for the system. The
$newUser reference is presumed to be an IdentityList object whose set functions
were called after the registration button was pushed and populated with values
from the form fields. The new user is inserted into the database at the end of the
function call.
• deleteUser($username)
58
– This function is called when an administrator is attempting to purge a user account from the database. The function takes a String variable and loops through
the database until it finds an IdentityList with a matching username. Once found,
the IdentityList is removed from the database.
• equals(object:Object)
– Superclass method of the Java Object class. This is overridden and returns TRUE
if two variables match each other all classes have this functionality (String included).
10.2.2
DisplayChart
The DisplayChart class implements the main functionality for the chart and map user interface elements. It contains the following variables:
• googleMapChart
– This is a MapFragment variable that is stored directly inside the class (MapFragment is coming from the Google API).
• Color
– This is a String variable that holds the value of the color the user wants the map
markers to display.
The function of this class is listed below.
• displayHotCities ($googleMapChart,$color)
– The user will input where they want to look and what color they want the markers
on their map to be. A MapFragment is then dynamically generated/updated to
match their preferences and passed to this displayHotCities function. This will
propagate through the system to the output.
10.2.3
AccessProfile
When dealing with the use case where the user needs to modify their personal information, an
additional class needed to be introduced to handle the information outside of what is needed
for simple registration (e.g. name and email). As such, we have this class: AccessProfile.
These include various set and get functions for class encapsulation. AccessProfile exists as
a class since it needs to be instantiated for more than one user who accesses their profiles at
a time. The variables for the class are listed below:
• Username
– String variable corresponding to the users username.
• Password
59
– String variable corresponding to users password.
• Email
– String variable corresponding to users email.
• Age
– Integer variable corresponding to the users age.
• Year
– Integer variable corresponding to the year the user was born.
• Month
– Integer variable corresponding to the month the user was born.
• Sex
– Boolean variable corresponding to gender. (FALSE) = Female and (TRUE) =
Male.
• Day
– Integer variable corresponding to the day the user was born (this is day of the
month, not day of the year).
The functions for this class are outlined below.
• setAge ($age):
– Typical set function. It is used when the system needs to change/specify the
age for an associated instance of the class. This would be called when the user
trying to change their personal information (as detailed in the use cases) or when
the system is attempting automatic updates once the users birthday has been
reached. Calling this function updates the value of the age variable and forwards
the change to the database.
• getAge ():
– Typical get function. Is used when the system needs to retrieve an age from an
associated instance of the object. Returns the current value of the age variable.
• setSex ($sex):
– Typical set function. It is used when the system needs to change/specify the sex
for an associated instance of the class. This would be called when the user trying
to change their personal information (as detailed in the use cases). Calling this
function updates the value of the sex variable and forwards the change to the
database.
60
• getSex ()
– Typical get function. Is used when the system needs to retrieve a sex from an
associated instance of the object. Returns the current value of the sex variable.
• setNewName ($name):
– Typical set function. It is used when the system needs to change/specify the
name for an associated instance of the class. This would be called when the user
trying to change their personal information (as detailed in the use cases). Calling
this function updates the value of the username variable and forwards the change
to the database.
• getNewName ():
– Typical get function. Is used when the system needs to retrieve a sex from an
associated instance of the object. Returns the current value of the username
variable.
• setNewPin ($pass):
– Typical set function. It is used when the system needs to change/specify the
password for an associated instance of the class. This would be called when the
user trying to change their personal information (as detailed in the use cases).
Calling this function updates the value of the password variable and forwards the
change to the database.
• getNewPin ():
– Typical get function. Is used when the system needs to retrieve a password from
an associated instance of the object. Returns the current value of the password
variable.
• setYear ($year):
– Typical set function. It is used when the system needs to change/specify the year
for an associated instance of the class. This would be called when the user trying
to change their personal information (as detailed in the use cases). Calling this
function updates the value of the year variable and forwards the change to the
database.
• setMonth ($month)
– Typical set function. It is used when the system needs to change/specify the
month for an associated instance of the class. This would be called when the user
trying to change their personal information (as detailed in the use cases). Calling
this function updates the value of the month variable and forwards the change to
the database.
61
• setDay ($day)
– Typical set function. It is used when the system needs to change/specify the day
for an associated instance of the class. This would be called when the user trying
to change their personal information (as detailed in the use cases). Calling this
function updates the value of the day variable and forwards the change to the
database.
• getYear ():
– Typical get function. Is used when the system needs to retrieve a year from an
associated instance of the object. Returns the current value of the year variable.
• getMonth()
– Typical get function. Is used when the system needs to retrieve a month from an
associated instance of the object. Returns the current value of the month variable.
• getDay()
– Typical get function. Is used when the system needs to retrieve a day from an
associated instance of the object. Returns the current value of the day variable.
• setEmail ($email):
– Typical set function. It is used when the system needs to change/specify the
email for an associated instance of the class. This would be called when the user
trying to change their personal information (as detailed in the use cases). Calling
this function updates the value of the email variable and forwards the change to
the database.
• getEmail ():
– Typical get function. Is used when the system needs to retrieve an email from an
associated instance of the object. Returns the current value of the email variable.
• manageFriendList ():
– This operation allows a user to manage his own friend list. It prompts the user
with his/her friend list and gives the user the freedom to add or delete a friend.
• manageInbox ():
– This operation prompts the users inbox and shows his messages. A user can delete
or save messages.
• changeProfilePicture ():
– This would allow a user to change his picture on his/her personal profile.
62
10.2.4
Database
The Database class defines operations connected with database. This class is in charge of
storing and updating users personal information, as well as getting data for other classes.
There are 5 operations and 2 derived class.
• storeNewName ($name):
– This function would be called internally within any setName function and would
update an associated value (e.g. username) within in the DB for that update.
• storeNewPin ($pass):
– This function would be called internally within any setNewPin function and would
update an associated value (e.g. password) within in the DB for that update.
• storeAge (Int)
– This function would be called internally within any setAge function and would
update an associated value (e.g. age) within in the DB for that update.
• storeSex ($char)
– This function would be called internally within any setSex function and would
update an associated value (e.g. sex) within in the DB for that update.
• storeDOB ($year, $month, $day):
– This function would be called internally within any call of setMonth/setDay/setYear
function and would update an associated value (e.g. day, month, year) within in
the DB for that update.
• storeEmail ($email):
– This function would be called internally within any setEmail function and would
update an associated value (e.g. email) within in the DB for that update.
As shown in Figure 3.2, class Database has two derived classes: LocalUser and TwitterData. These two derived classes contain lists of data for other classes.
63
Figure 23: Logic Diagram of the VGA Controller Block
10.2.5
LocalUser
LocalUser is a derived class that represents a users information inside of the database. Most
of the private attributes in this class are personal information that has been described in
previous sections.
• Friendlist
– A String pointer that points to the beginning of a linked list of userIDs the users
friends.
• Password:
– A String variable that is a data member of class LocalUser. Password variable as
seen earlier.
• LocalDatabase ():
– This is an operation that grants access to the system when it makes a call to open
a portal between the database and the website.
10.2.6
TwitterData
TwitterData is a derived class used when requesting access to the Twitter Database.
The functions of this class are below.
64
• AccessTwitterDB ():
– This operation is used whenever we need to access the Twitter Database and
obtain data from it. Obtained data will be used in other classes and operations.
10.2.7
Search
This class is meant to implement the functionality behind the searching function in the
application. The data stored in this class is:
• hotCities
– This is a String variable that contains a list of all the hot cities requested in a
query.
• healthSuggestion
– This is an (as-of-yet) unimplemented class that would contain a series of suggestions on how to improve the users health.
• Tweets
– This is a String variable that holds the Tweet query that is typed in by the user.
• Exercise
– This is a String variable that holds the exercise query that is typed in by the user.
• Facility
– This is a String variable that holds the facility query that is typed in by the user.
The class methods are described below.
• setHotCities($city):
– Typical set function. Is called when the user begins typing their query for a city
and presses the search button. The variable in the class is what gets set.
• getHotCities():
– Typical get function. Is used when the system needs to retrieve a Hot Cities from
search results and send back to the screen.
• setFacility($city)
– Typical set function. Is called when the user begins typing their query for a
facility and presses the search button. The variable in the class is what gets set.
• getFacility():
65
– Typical get function. Is used when the system needs to retrieve facilities from
search results and send back to the screen.
• setExercise($exercise):
– Typical set function. Is called when the user begins typing their query for an
exercise and presses the search button. The variable in the class is what gets set.
• getExercise():
– Typical get function. Is used when the system needs to retrieve exercises from
search results and send back to the screen.
• setTweets($tweet):
– Typical set function. Is called when the user begins typing their query for a tweet
and presses the search button. The variable in the class is what gets set.
• getTweet():
– Typical get function. Is used when the system needs to retrieve tweets from search
results and send back to the screen.
10.2.8
SendMessage
This class implements the functionality described in previous use cases for when users want
to communicate directly with each other through the website. The class variables are as
below:
• userID
– A String variable containing the userID the user wants to message.
• Message
– A String variable containing the message the user wants to send to the user
specified by userID.
The class methods are explained below.
• findFriend($userID):
– This function will loop through the user database until it finds a user that matches
the userID (effectively a series of get calls).
• addFriend($userID):
– Takes the userID and updates the String pointer in a users database to include
this new ID as well.
• deleteFriend($userID):
66
– Takes the userID and updates the String pointed in a users database to remove
the ID associated with the variable.
• writeMessage($message):
– It allows user to edit text content he/she wants to send as a message to friends. If
the content is legal, it returns 1 and would calls the function messageFriend($userID),
otherwise, it returns 0 and requests a re-enter to user.
• messageFriend($userID):
– It works as a communicator in this class. It is called by writeMessage($message)
functions and sends the edited message to the target user ID. It also utilizes the
findFriend($userID) function to locate the correct user ID.
10.2.9
Controller
This class works as a central controller and communicator in the system-to-be. It contains seven derived functions : DBConnection(), CheckIdentity(), CreatePersonalProfile(),
UpdatePersonalProfile(), AccessPersonalProfile(), MessageManager() and AccessDisplay().
Each function is linked to the other classes to perform user requests. It also contains ten
status of the current system. This class is essential to system performance; we would get
nowhere without it.
• DBConnection():
– It establishes a connection to the database for either stored local user profile or
Tweet data.
• CheckIdentity():
– It links to the IdentityList class when users try to login or edit profile.
• CreatePersonalProfile():
– It links to the AccessProfile class to create personal profile when a new user
registers for the system. It also links to Database class to store the newly created
data.
• UpdatePersonalProfile():
– It provides a link to both of the AccessProfile and Database class when the logged
in user attempts to edit his/her profile.
• AccessPersonalProfile():
– It links to the AccessProfile class for users to gain access to their profile.
• MessageManager():
67
– It links to the SendMessage class to send messages between different users.
• AccessDisplay():
– It links to the DisplayChart class to display different types of charts for users.
Figure 24: Logic Diagram of the VGA Controller Block
10.3
Traceability Matrix
Domain Concept
Controller
Interface
Data Analysis
Communicator
DB Connection
UC1 UC2 UC3 UC4 UC5
x
x
x
x
x
x
x
x
x
x
x
x
x
x
x
x
x
x
x
x
x
x
x
x
Table 10: Traceability Matrix
11
11.1
System Architecture and System Design
Architectural Styles
In our software, there are three abstraction layers being implemented in our design:
• User Interface
68
– This is top level of the software system and is the only part the user is aware of. It
displays all the relevant information that the user needs when searching the site,
inputting queries, et cetera. This tier communicates with other tiers by sending
results to the browser and the other branches of the network. A website forms
the front end and it can be accessed by any computer. Information is displayed in
a static form and the user isnt given any ability to directly modify the Database
(except by initiating process management functions; e.g. changing password).
• Process Management
– This middle level forms the core functionality behind the user interface. It controls
application functionality by performing detailed processing with related function
calls (as seen in the use cases). This tier is concerned with system functioning and
processing functionality, e.g. searching for data, recording updated information,
retrieving login information and related tasks.
• Database
– Database in this tier is kept independent of application servers and user interface.
The database management system on the database server contains the computer
data storage logic. When a request is sent to this tier, database will look up the
desired data.
Our system is a web based application which needs to serve a large amount of users. Much
of the functionality weve discussed so far depends on database interactions and queries. We
determined that a system like our software needs Browser/Server architecture so that it can
set up a communication pathway between the user side and the data side.
11.1.1
Browser/Server Structure and 2-Tier Architecture
Browser/Server (B/S) structure is an extension of Client/Server (C/S) architecture. In such
a structure, the user interface is through a web browser (Chrome, Firefox, Internet Explorer,
etc.), rather than installing the application in a Client/Server structure. This greatly simplifies the client computers load, reduces system maintenance, and reduces upgrade costs and
the workload and the overall cost of the user (TCO). It is differentiated from C/S structures
2-tier architecture, B/S structure usually needs a middleware between the front end and the
backend, forming a 3-Tier Structure.
11.1.2
Tier Architecture
This is well suited to separate the roles of three components of the system: the presentation
tier, the application tier and the data tier. And each component is a tier that can be
located on a physically separate computer. They generally use platform specific methods for
communication instead of a message-based approach. Different from 2-tier model, the 3-tier
architecture describes the separation of functionality into segments, which independently
keeps the process management and model logic delineated. Additionally, 3-tier architecture
allows any one of the three tiers to be upgraded or replaced independently.
69
Compared with the 2-tier B/S model, this 3-tier architecture style will improve system
reliability and flexibility. The main benefits of the 3-tier architectural style are:
• Maintainability
– Because each tier is independent of the other tiers, updates or changes can be
carried out without affecting the application as a whole.
• Scalability
– Because tiers are based on the deployment of layers, scaling out an application is
reasonably straightforward.
• Flexibility
– Because each tier can be managed or scaled independently, flexibility is increased.
• Availability
– Applications can exploit the modular architecture of enabling systems using easily
scalable components, which increases availability.
11.2
Identifying Subsystems
Figure 25: Logic Diagram of the VGA Controller Block
In this system, there are two subsystems. One is the client side - the web browser, the other
side is server - web server. The client package mainly refers to the website framework, and
it contains the building structure of the user interface. For the server side, when the user
uses sends a request to the web server, the server would response through processing it in
its logic package. The logic unit would analyze it and further pass it to the server resource
package. This package is responsible for retrieving data from local Twitter database and
internal communication.
11.3
Mapping Subsystems to Hardware
As shown in Figure 4.1, the subsystem can be mapped into the following hardware component
easily. The Web Browser package are allocated in clients PC, and the user would use this
to access the application user interface. The Web Server as well as Server Logic package is
allocated in the server. They would use this to appropriately analyze and process the user
requests. The Server Resource package is allocated in the central server.
70
11.4
Network Protocols
There are many network protocols such as FTP (File Transfer Protocol), HTTP (Hyper
Text Transfer Protocol) and SSH (Secure Shell). In this system, a user uses the website to
log into his/her personal account and access the software user interface. Since we have a
web design, we need to use HTTP so users can navigate to the website from their personal
computer.
11.5
Global Control Flow
For execution order in this software-to-be, it is event-driven so the system is waiting in a
loop for emerged events (user requests). For example, an user may want to search for the
hot city New York City in the search bar, before this request, the system is waiting in a
certain a loop for interruption, after receiving the interruption, the system jumps out of the
waiting loop and executes appropriate subroutines. The designed system-to-be is a real time
system, which means the system would continuously download tweets, hashtag as well as
user profiles from Twitter and store valid information in the local Twitter database. This
system- to-be is not a multiple threads application.
11.6
Hardware Requirements
To achieve full functionality, the server side needs a server computer for providing local
Twitter database. The computer can run basic database as well as Java IDE. It should have
enough disk storage (for example, 4 Gbytes hard disk space) and be able to perform network
communication. For the client side, it needs a normal computer that can open websites and
access to the Internet.
12
Algorithms and Data Structures
12.1
Algorithm
12.1.1
Estimation of population concerning health
Originally, we were planning to get all the tweets from one area (either a city or a state).
Then, we planned to find out the number of tweets having physical exercise information
by finding some keywords from the tweet content. Then we would have the total number
of tweets “T” and the number of tweets that are health-related “A”. In that case, we can
calculate the percentage of people in that area who concern about health and exercise as
shown in following formula:
A
∗ (P opulation Census)
(2)
T
As we start implementing it, we realized that this is impractical. The number of tweets
from a city (for example NYC) is so large and the number of tweets mentioning health and
exercise is so small. We have storage problem for the massive twitter data and we would
get a lot of noisy tweets (not related to health) at the same time. Therefore, we switch to
% Of Healthy P opulation =
71
some more practical ways. We only pull the tweets having specific set of hashtags. Although
there is no any total number of tweets from one area for percentage calculation, we can
still compare the difference in health related tweet number across different states. This also
indicates the popularity of health and exercise across different states.
We collected all the tweets about health and exercise with a set of hashtags. After filtering
out all the tweets having no information about location, we counted the number of tweets
in US concerning about the health and exercise (noted as B). After researching online, we
found that 8% of US people use twitter. Therefore, dividing the number of tweets from US
by 8% (denoted as B/0.08), we get the number of people in US who exercise (E):
B
(3)
8%
But this is not the total number of people in US who exercise because we havent collected
all the health related tweets in US. The tweets we obtained is just a subset of all health related
tweets from US. As we collect more data, the number of collected tweets will increase, so as
the number of people in US who exercise. Our estimated number will get closer and closer
to the true value as time goes. There are some limitations on the accuracy of our estimated
number of people in the US who exercise. We can only get closer to the true value by may
never be able to reach that number. Another factor is that there may be more than one
tweets about exercise sent out by one person. This person is counted more than once. Future
improvement on this project can refine the algorithm to count the number of twitter users
who tweets about health and exercise instead of the number of tweets.
E=
12.1.2
Word Cloud Algorithm
As for how to algorithimically generate the size for the word cloud, we heuristically assigned
the following formula:
Size = (log10 (F requency + 1) + 1) ∗ 2
(4)
We add a one to the frequency before taking the logarithm in the chance that there are
no instances of a hashtag; a 1 is added after to make the weight, when multipled by 2, a
little more meaningful (e.g. the size of the text is always greater than unity, at the very
least, so it is legible).
12.1.3
Database Querying for Word Cloud
The plugin we used is called TagCanvas (http://www.goat1000.com/tagcanvas.php). This
is an HTML5 plugin that allows us to plot the hashtags onto the map through HTML. The
problem is that we need to generate the weights of the words ourselves. We can obtain
rankings of our hashtags by first querying our database like so:
$tags = array(’run’,’running’,’gym’,’jog’,
’jogging’,’jogger’,’marsic’,’exercise’,
’exercising’,’exercises’,’fitness’,’fit’,
’fitfam’,’seenonmyrun’,’fitnessfriday’,
’fitforlife’,’mefirst’,’gymtime’,’healthy’,
72
’bodybuilding’,’chest’,’workout’,’getfit’,
’active’,’healthychoices’,’diet’,’cardio’,
’strong’,’training’,’fitnessaddict’,’fitspo’,
’instahealth’,’trailrunning’, ’trailrunner’,
’trailrun’, ’fitspiration’, ’fitnessmotivation’,
’gettingfit’,’dreambody’,’fitnessgoal’,
’resultssofar’,’transformation’,’goal’,
’dontgiveup’, ’weightloss’, ’morningrun’,
’workoutsoicaneat’,’TFLers’,’tflers’,’gymlife’,
’trainhard’,’grow’,’bulk’,’squat’,’squats’,
’instafitness’,’ripped’,’swole’,’muscle’,
’shredded’,’pushup’,’pushups’,’sweat’,
’grind’,’fitnessgear’,’pushpullgrind’,’bigbench’,
’fitgram’,’pullup’,’pullups’,’gymrats’,’eattogrow’,
’physique’,’nikeplus’,’nike+’,’fitnessmodel’,
’fitnessaddict’,’trainer’,’yoga’,’ironaddicts’,
’lifting’,’addictedtoiron’,’bootcamp’,
’workout routines’,’strengthtraining’,
’smashfit’,’squash’,’swimming’,’biking’,’cycling’,
’losing weight’,’keepfit’);
$partial = ”SELECT COUNT(*) FROM tweet tags WHERE tag = ”’;
$count = 0;
for ($index = 0; $index ¡ count($tags); $index++) {
$query = $partial;
$query = $query.$tags[$index].””’;
$result = mysql query($query);
$value = mysql fetch row($result);
$freq[$index] = $value[0];
}
So we are explicitly searching for our hashtags (because we have many, many hashtags in
the database; were interested in seeing how well OUR tags are performing, not all the tags
we have just yet). We can obtain how many times they occur in the tables this is the $freq
variable.
Then on the data weighting size, we determine the tag size heuristically by doing the
following:
data-weight = `‘ ”.(ceil((log($freq[$index]+1))+1)*2)
• Take the logarithm (base 10) of the frequency of the hashtag.
• Add 1 to it to give it some size.
• Round it up.
73
• Add one again.
• Multiply by 2.
This was done experimentally and it seemed to generate satisfactory sizes in relation to the
frequency of the hashtags and the size of the tag cloud we used.
12.2
Data Structure
The system we implemented stores a variety of values that may or may not need to be
referenced by the system for any one of the use cases detailed earlier. These values go
without saying at this point; we need to store user data and tweet data and require a data
structure that is appropriate to the task. Simplistic data structures will not suffice for this
project because speed and modularity is a factor in improving the user experience and the
system performance. The following data structures were under consideration by us:
• Array
– This is one of the simplest data structures available. We can map an output
according to an integer ID. But the size of the array is fixed; it cant be varied
and must be final. So if we were to store our data into the array wed need to
pre-allocate the size and if it got too small wed have to create another array and
copy all the data over. Not ideal.
• Queue
– An ordered list of elements where the principal operations can only be performed
on the end (tail) or front (head) of the data structure. This is a First-In-First-Out
(FIFO) data structure that wed access through the use of pointers to objects in
the list (head and tail). This isnt ideal for the storage because the operations can
only be performed at the ends of the list and we may yet need objects in between.
• List
– This is highly similar to the Queue, only that it is much easier to perform searching, addition, and deletion operations.
• Map
– A map is a data structure where several variables of different types are stored in
an abstract way and need to be referenced or pulled out according to a key pair
value. Addition, removal, modification, and searching is quite easy with this data
structure.
• Tree
– A tree is an abstract data type where nodes contain a series of values along with
a pointer to the children of that node. Its very fast to search for objects within
the tree, making it optimal for us. Disadvantages are that nodes can only really
access points that it has pointers to; they cant reach the children of other nodes.
74
• Vector
– This is a dynamic array that is random access and whose size is not fixed. However, it is not possible to insert at random points.
After considering the above data structures, we decided to store the user information and
characteristics in a Map data structure because there are several fields that are easy to get
if you request the right key (password, name, et cetera). The Tweets we decided to store in
a vector because they are mostly un-ordered (the hashtags are always the same for a given
tweet set) and the dynamic size keeps us from allocating too much or too little for a given
search.
13
User Interface Design and Implementation
The original mockup for our user interface from Report #1 can be seen on the next page:
Figure 26: Original Mockup
75
Figure 27: Login UI
We kept the same Login UI.
76
77
Figure 28: Whole UI
In our UI part, we kept the basic structure but modified the functionality. We removed
the hyperlinks from the dashboard and left all of the functions on the main page. We
designed several data analysis options including a pie chart breakdown of tweets, a heatmap
for the distribution, markers on the maps, and a graph of tweet volume versus time of day
aggregated over a period. The user effort with this screen is quite small. The webpage
is clean and simple; it is easy for the user to find exactly what he or she is looking for.
Everything they need is clearly labeled and the websites modular design makes it easy for
the user to run the services. Everything here does not require extensive explanation.
Figure 29: Cloud Example 1
78
Figure 30: Cloud Example 2
Figure 31: Cloud Example 3
Figure 32: Cloud Example 4
Running Word Cloud function:
1. NAVIGATION: total 5 mouse movements, as follows.
• Move cursor to the chosen word cloud.
• Move cursor to find the chosen word if not in this page.
• Scroll mouse.
• Click the chosen word cloud.
79
• Click interested info
2. Function display:
• Move mouse to see the word cloud move with the cursor.
• Scroll mouse, the word cloud would change its size by shrinking or magnifying.
• Provide extra explanation with each word cloud to connect with Twitter.
Figure 33: Markers
Figure 34: Markers Example
Running Viewing map function.
1. NAVIGATION: total 3 mouse movements, as follows:
• Move cursor to the chosen place.
• Scroll mouse.
• Move cursor to chosen location.
2. Function display:
• Move mouse to see the map displaying sports map.
80
• (Figure 11.9 Markers).
• Scroll mouse, the map would change its size as shrink or magnify.
• Move sursor to the mark, our website will display more info automatically.
Figure 35: Search Example 1
Figure 36: Search Example 2
Figure 37: Search Example 3
81
Figure 38: Search Example 4
Running Search function.
1. NAVIGATION: total 5 mouse movements, as follows.
i) Search without key words
• Move cursor to search box.
• Print searched place.
• Move cursor to map diagram.
ii) Search with key words
• Move cursor to search box.
• Print searched place with key word.
• Move back to map diagram.
Function display:
• Move cursor to the search box to input a place.
• View the searched map on the map diagram.
• Move cursor to the search box to input a place with key word.
• View the searched map with marked key word situation on the map diagram.
14
14.1
Design of Tests
Test Cases
• UC#1 Searching for Locations and Facilities
This use case should enable the user to search for locations and facilities. For location
search, the functional system should display results in the form of graphical analysis,
82
visualization through a Google MapFragment with tweets labeled as red dots, and
statistical results with percentages showing the health population of the location. For
facility search, the map should display available facility locations across the United
States, showing the distribution of it over several cities.
• UC#2 Viewing Statistical Breakdown
The user needs to navigate to the website and see whether or not the pie charts are
being split into statistical values for the contiguous United States. If there is no
breakdown, then the server is either unable to connect with Twitter, Google, or the
website/database doesn’t have tweet data.
• UC#3 Viewing Results
The user needs to navigate to the website and see whether or not the results counter
is changing across an hour. If there is no breakdown, then the server is either unable
to connect with Twitter, Google, or the website/database doesn’t have tweet data.
• UC#4 Viewing Map
The user needs to navigate to the website and see whether or not the maps are displaying correctly with heat on the United States along with markers. If there is no
breakdown, then the server is either unable to connect with Twitter, Google, or the
website/database doesn’t have tweet data.
• UC#5 Viewing Word Cloud The user needs to navigate to the website and see whether
or not the word cloud is being displayed correctly. If there is no word cloud, then the
server is either unable to connect with Twitter or the website/database doesn’t have
tweet data.
14.1.1
Deprecated Use Cases
These use cases have been deprecated due after updating our goals but we leave them here
on the instruction that they should be kept.
• UC#2 Selecting Hot Cities
This is another user or member input option as selecting hot cities instead of searching
through search bar. The test should make sure the system gets what the user selected,
and make sure that the system has a good user interface to avoid any possible mistakes
due to in-appropriate operation.
• UC#5 Accessing Personal Page
This use case tests functionality of the personal page. There are several processes
that occur when its being accessed. The test should make sure the system gives full
consideration on whether the user is registered before logging in, the verification of the
identity, whether the searching algorithm for this user’s page is efficient, and whether
the interface of the personal page has any flaw.
83
• UC#6 Editing Personal Information
This use case test should focus on the UI and data connection with member database.
The test should make sure whether the information is successfully updated if the logged
in user (member) has changed his information. A lot of emphasis should also be put
on the user interface testing to make sure the system functions correctly.
• UC#7 Sending Messages
In order to send messages, the user has to be a member of our software system. The
test should make sure the sender is a registered user after sending message and at the
same time, the receiver should be notified. The message should be sent without error.
The system should also take into account possible transmission errors.
• UC#8 Viewing Search History
This is also inside the personal page. Viewing search history can be tested to make sure
the most recent member searches can be saved into the database. The test should make
sure the system handles the search history correctly when there are a lot of entries.
• UC#9 Changing Account Settings
This allows the user to change their username or password. The test should make sure
whether the password can be reset. Members can also edit the username. The system
should be tested on three kinds of changing scenarios: changing username, changing
password, and changing both username and password.
• UC#10 Registering
Any user can register to be a member to access some additional functions. Testing
on registration should make sure the user is added into the system member database
successfully. The registered member should not be registering again, which is also a
part of the test.
• UC#11 Backup Member Data
This test should make sure the member data is backed up periodically to another
database in case of runtime failure.
• UC#12 Deleting Member Account
As stated in the user case description in previous section, deleting member account
has two options depending on whether the member wants to permanently delete the
account or just make the account invisible to others. The test should consider both
scenarios.
• UC#13 Viewing Map
This is visualization test of the Google MapFragment object. The test should make
sure the map can be easily manipulated. The user should have an option to request
the display of partial data if the data set is too big. However, the user can still obtain
full statistical results from the output window.
84
• UC#14 Viewing Word Cloud
This is a dynamic graphic on the key word from twitter and can be displayed in a
globular figure, it can change size and position with mouse and connected to detailed
information with clicking.
• UC#15 Viewing Line Chart
This is a Line chart to display the average sport time in different place, it updated
over time, and implies local lifestyle and sport degree.
• UC#16 Viewing fan chart
This is a fan chart to displace sport degree in every single state and for other appointed
region, and also display the ratio. We also display some dynamic animation effect on
move cursor in each section.
14.2
Test Coverage
• UC#1 Searching for Locations and Facilities
– Success
∗ User inputs a location they want to query. The system undergoes the task
of verifying if the location is valid and can be displayed. When the match
occurs, the MapFragment is updated along with other relevant portions of
the user interface.
∗ User inputs a facility they want to query. The system undergoes the task of
verifying if the facility is valid and can be displayed. When the match occurs,
the MapFragment is updated along with other relevant portions of the user
interface.
∗ User inputs a friend they want to search for. The system undergoes the task
of verifying if the friend is valid and if a list of matches can be shown on the
screen.
– Failure
∗ User inputs a location but the system is unable to verify it. It displays a “No
Results Found” error message and waits for new input from the user.
∗ User inputs a facility but the system is unable to verify it. It displays a “No
Results Found” error message and waits for new input from the user.
• UC#2 Selecting Hot Cities
– Success
∗ User selects a hot city that is available from a list on the screen. The system
checks the available city and updates the statistical data accordingly.
– Failure
85
∗ User selects a hot city but the system is unable to verify it. It displays a No
Results Found error message and waits for new input from the user.
• UC #2, #3, UC#4, UC#5 Viewing Graphical (Data, Results, Map, Word Cloud)
– Success
∗ The object under question in the above list delimited by “/” will correctly
display to the screen if the server is able to interface with the website and
update the information content on the screen.
– Failure
∗ The website is unable to communicate with the server. An error message is
displayed on the screen and requests that the user check their connection or
try again.
14.2.1
Deprecated Cases
• UC#2 Selecting Hot Cities
– Success
∗ User selects a hot city that is available from a list on the screen. The system
checks the available city and updates the statistical data accordingly.
– Failure
∗ User selects a hot city but the system is unable to verify it. It displays a No
Results Found error message and waits for new input from the user.
• UC#6 Editing Personal Information
– Success
∗ The user will opt to change the information stored in the database that
correlates to their personal profile. They can change their email, location,
gender, age, et cetera. If done correctly, the database will be updated with
the new values and the screen will refresh to show that.
– Failure
∗ The server is unable to change their location. An error message is displayed
on the screen and requests that the user try again.
∗ The server is unable to change their gender. An error message is displayed
on the screen and requests that the user try again.
∗ The server is unable to change the age. An error message is displayed on the
screen and requests that the user try again.
∗ The website is unable to communicate with the server. An error message is
displayed on the screen and requests that the user check their connection or
try again.
∗ The website screen doesnt refresh to show the updated information.
86
∗ The website screen refreshes and the data is changed in the database but the
information displayed remains unchanged.
• UC#7 Editing Personal Information
– Success
∗ The user will select another user they wish to send a message to. If executed
correctly, that message will be sent through the website to the other users
inbox and that user will receive a notification that a message was sent.
– Failure
∗ The website is unable to communicate with the server. An error message is
displayed on the screen and requests that the user check their connection or
try again.
∗ The message is correctly sent but the notification about a new message is not
displayed.
∗ The message appears in the users chat portlet but does not appear in the
inbox.
• UC#9 Changing Account Settings
– Success
∗ The user will opt to change the information needed to log into the website.
They can change their username or password, et cetera. If done correctly, the
database will be updated with the new values.
– Failure
∗ The server is unable to change their username. An error message is displayed
on the screen and requests that the user try again.
∗ The server is unable to change their password. An error message is displayed
on the screen and requests that the user try again.
∗ The website is unable to communicate with the server. An error message is
displayed on the screen and requests that the user check their connection or
try again.
• UC#10 Registering
– Success
∗ The user will enter their username and password on the registration page and
hit submit. This will succeed if there is no conflict with the system.
– Failure
∗ The website is unable to communicate with the server. An error message is
displayed on the screen and requests that the user check their connection or
try again.
87
∗ The username is taken by another user. The system will request that they
try again with another username.
∗ The password is taken by another user. The system will request that they
try again with another password.
• UC#11 Backup Member Data
– Success
∗ The administrator opts to back up the member data and if it is properly
copied to another database then the case is successful.
– Failure
∗ The system is unable to communicate with the server. An error message is
displayed on the screen and requests that the user check their connection or
try again.
∗ The database it is attempting to copy to does not exist or the server is out
of space.
• UC#12 Deleting Member Account
– Success
∗ The administrator opts to delete another members account and it is removed
from the system.
– Failure
∗ The system is unable to communicate with the server. An error message is
displayed on the screen and requests that the user check their connection or
try again.
∗ The account doesnt exist in the database. An error message is sent back to
the console.
• UC#14 Viewing Word Cloud
– Success
∗
∗
∗
∗
The website display all word Cloud integrated and clearly.
User could change the size with scroll the mouse.
The word could would move and rotate with the movement of cursor.
User could get more info with clicking every single word cloud.
– Failure
∗ The website could no display the word cloud or only some of them.
∗ The word cloud is not dynamic, which could not move with cursor.
∗ Failed to connect with the twitter or connect to irrelative info.
• UC#15 Viewing Line Chart
88
– Success
∗ The website display line chart integrated and clearly. The percentage of
different US regions could be displaced as tendency with different time to
illustrate the change in one day.
– Failure
∗ The website could no display the line chart or only some of them.
∗ The line chart is not dynamic, which could not show the tendency of one day.
• UC#16 Viewing fan chart
– Success
∗ The website display fan chart integrated and clearly.
– Failure
∗ The website could no display the fan chart or only some of them.
15
15.1
History of Work, Current Status, and Future Work
Plan of Work
The Plan of Work is illustrated in the two figures below.
Figure 39: Plan of Work 1
89
Figure 40: Plan of Work 2
15.2
Project Coordination and Progress Report
• We succeeded in implementing all use cases that weren’t related to user specific functionality (e.g. messaging).
• The login page works as static content.
• Website is fully dynamic; updates with Twitter data many times an hour.
• Data analysis is performed through a variety of graphical mechanisms; maps, charts,
word cloud, et cetera.
15.3
Future Work
• Implement the login and user management part.
• Improve the maintenance routine for our system.
• Increase functionality such as viewing search history, providing individual suggestions,
sending messages, adding social networks for members, etc.
15.4
15.4.1
Breakdown of Responsibility
The breakdown would expected to be as follows:
• Twitter API, Data Mining
– Rui Xu, Xiaoyu Yu, Gradeigh Clark
• Google Map, sending messages, friend invitation.
90
– Li Xu, Yihan Qian, Xianyi Gao
• Webpage design, Data analysis, database and server set up, main documentation writing.
– Gradeigh Clark and Xianyi Gao
15.4.2
Merging the Contributions from Individual Team Members
Gradeigh and Xianyi took control of compiling the final report, doing the formatting, ensuring consistency, and uniform formatting and appearance. No extreme issues were encountered in compiling the report.
16
Reference List
1. Software Engineering Project: Health Monitoring Analytics
http://www.ece.rutgers.edu/ marsic/books/SE/projects/HealthMonitor/ analytics.html
2. Kumar, Shamanth, Morstatter, Fred , and Huan Liu. Twitter Data Analytics. Springer,
2013 http://tweettracker.fulton.asu.edu/tda/
3. Kenneth. M. Anderson, Aaron Schram, Design and Implementation of a Data Analytics Infrastructure in Support of Crisis Information Research
(NIER Track)” http://epic.cs.colorado.edu/wp-content/uploads/icse2011.pdf
4. Twitter Developers, https://dev.twitter.com/
5. Engrammi,
http://engrammi.blogspot.com/2011/10/nanni-balestrini-original-tag- cloud.html
6. Where DO Twitter F-Bombs Come From? Heat Map Shows Rudest Places
http://mashable.com/2012/08/22/twitter-rudeness-heat-map/
7. Healthcare Social Media Analytics, http://www.symplur.com/healthcare- social-mediaanalytics/
8. HMS Health Monitoring Systems,
http://www.hmsinc.com/media/EpiCenter 2.17 User Manual.pdf
9. Sylwia Krol, Bozena Zabiegala, Jacek Namiesnik,”Monitoring and analytics ofsemivolatile
organic compounds (SVOCs) in indoor air”, Anal Bioanal Chem
(2011) 400:1751 1769 DOI 10.1007/s00216-011-4910-x
10. Monitoring the health of web page analytics code,
http://www.google.com/patents/US20110035486
91
11. Apoorv Agarwal Boyi Xie Ilia Vovsha Owen Rambow Rebecca Passonneau,”Sentiment
Analysis of Twitter Data”, Department of Computer Science,
Columbia University,New York, NY 10027 USA, fapoorv@cs, xie@cs, iv2121@, rambow@ccls, [email protected]
12. Twitter Data Analysis –Gaurish Chaudhari,Under the Guidance of Prof. Sunita Sarawagi,
http://www.cse.iitb.ac.in/ gaurish/Seminar Presentation.pdf
13. Kenneth M. Anderson and Aaron Schram, Design and Implementation of a Data Analytics Infrastructure in Support of Crisis Informatics Research”,
Proceedings of the the 33rd International Conference on Software Engineering (ICSE2103), Honolulu, Hawaii, May 2011.
14. Great deal of useful information and relevant papers is available on the site by Frank
Bentley, Yahoo: Health Mashups”.
15. Ming Hao, Christian Rohrdantz, Halldr Janetzko, Umeshwar Dayal, Daniel A. Keim,
Lars-Erik Haug, Mei-Chun Hsu,
”Visual Sentiment Analysis on TwitterData Streams”
16. Mateus Santos Abdul Hassan evin Kobilinski Daihou Wang KBrien Range Sujana
Gangadharbatla, Workout with Friends Health
Monitoring for Fitness Applications
17. Web user Interface
http://creately.com/diagram/example/goc8uhkx/Copy+of+Web+iRis
18. User Interface Design
http://www.elsevierdirect.com/companions/9780120884360/casestudies/Chapter 01.pdf
19. Methods for improvement
http://www.doc.ic.ac.uk/ nd/surprise 97/journal/vol2/hafj/
20. Methods to create a user interface/user experience mock-ups
http://www.codingrobots.com/screensketcher/
21. Create Mock-ups and wireframes
http://spyrestudios.com/15-quality-web-based-applications-to-create-mock-ups-and-wireframes/
22. Estimating with Use Case Points
http://www.cs.cmu.edu/ jhm/Readings/Cohn
23. Expert estimation
http://www.idi.ntnu.no/grupper/su/publ/ebse/RK15-reviewexpertestim-jorgensen-jss04.pdf
24. Compared Formal Models and Expert Judgment
http://citeseerx.ist.psu.edu/viewdoc/download?doi=10.1.1.163.9404&rep=rep1&type=pdf
25. Genetic programming (GP)
http://profs.info.uaic.ro/ ogh/files/sbse/articles/new-articles/sdarticle.pdf
92
26. Mateus Santos, Abdul Hassan, evin Kobilinski Daihou Wang, KBrien Range, Sujana
Gangadharbatla
93