1
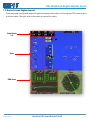
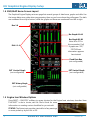
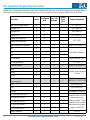
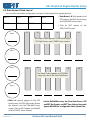
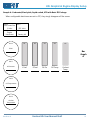
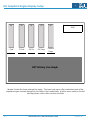
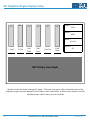
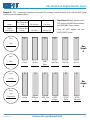
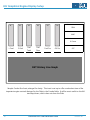
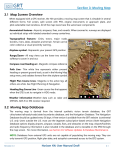
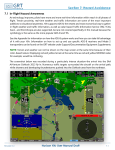
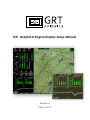
HXr Graphical Engine Display Setup Manual
Revision A
04-Nov-2013
HXr Graphical Engine Display Setup
Section 1: HXr Graphical Engine Display Layout
1.1 Introduction
When connected to a Grand Rapids Technologies EIS (Engine Information System), the HXr is capable of
displaying a multitude of engine and environmental parameters. Two suites of systems information are
presented on the Home screens, along with configurable Engine inset windows and a dedicated
Engine/Moving Map split-screen designed for multi-display systems.
This section of the manual covers basic arrangement and configuration of the graphical engine display
on the HXr. Please refer to the EIS manual and individual probe wiring diagrams, supplements and
information sheets for wiring and configuration of your EIS system and probes.
1.2 Working with the GRT Engine Information System (EIS)
A GRT EIS (Engine Information System) is required to gather most of the engine and systems data. The
EIS is the computer that gathers information from all of the sensors and probes and feeds it into the
HXr. The EIS is connected to the HXr through one of the serial ports.
Some sensors have the option of being wired directly to the EFIS system. For example, fuel level probes
can be connected directly to the HXr using the Analog inputs. Outside Air Temperature (OAT) can be
wired directly to the AHRS or the EIS.
Blind-Mounting the EIS
The EIS does not have to be mounted to the instrument panel face. Due to the size of the HXr, many
builders choose to mount their EIS in a tucked-away location that is accessible only for initial
programming. Because warnings on the EIS can not be canceled in flight if the unit is out of pilots’ reach,
the HXr is programmed with all of the engine limits, and the EIS limits are set to “0,” with few exceptions.
The EIS will send all of the raw sensed data to the HXr, which then detects any out-of-limit parameters
and displays a warning for the pilot. Warnings on the HXr are acknowledged by pressing the yellow
MSG softkey.
Monitoring Oil Pressure at Engine Start
The HXr should not be wired to the master circuit because of possible current spikes during engine start.
However, the EIS will not be bothered by these spikes and should be wired to the master for the sole
reason of showing an oil pressure reading during engine start. The minimum oil pressure limit should
be set in the EIS regardless of whether the unit is blind-mounted. A simple warning light can be wired
to the EIS and placed on the instrument panel to monitor oil pressure before the HXr is booted up.
2
Horizon HXr User Manual Draft
Revision A1
HXr Graphical Engine Display Setup
1.3 Home Screen Engine Layout
There are several configurable areas of engine and systems information on the map and PFD Home screens,
as shown below. The right side of the screen is omitted for clarity.
Data Boxes
1-8
Dials
ENG Inset
Revision A1
Horizon HXr User Manual Draft
3
HXr Graphical Engine Display Setup
1.4 ENG/MAP Home Screen Layout
The Graphical Engine Display set menu page lists several groups of data boxes, graphs and dials. Use
the image below as a guide when programming them so you know where they will appear. The dials
are numbered from top to bottom, while the graphs and boxes are numbered from left to right.
Box 1-8
Bar Graph A1-A6
Bar Graph B1-B6
Note: B6 is OFF in
this screenshot. If all
B graphs are “OFF,”
STATUS Inset
information appears
here instead.
Dial # 1-4
Fixed Data Box
(not configurable)
CHT Vertical Graph
(not configurable)
EGT Vertical Graph
(not configurable)
EGT History Graph
(not configurable)
1.5 Engine Inset Window Options
Press INSET > ENG/STAT softkeys to access choices for the Engine Inset windows, described here.
“CHECKLIST” is also a choice; see HXr Pilot’s Guide for more
information on creating custom checklists for your aircraft.
STATUS: The Status inset provides a textual list of any warnings
or errors picked up by the HXr or EIS.
4
Horizon HXr User Manual Draft
Revision A1
HXr Graphical Engine Display Setup
COMBO Inset: A mix of
graphs and data boxes
including the EGT history
line graph, Bar Graph
A1-A6, and the Combo
Boxes. The Combo Box
fields have the same
choices as the Box 1-8
data fields, but are
shown only in the
Combo Inset window.
EGT/CHT BAR Inset:
Displays the EGT history
graph accompanied by
the EGT and CHT bar
graphs. Very useful for
Lean Assist mode, as
leaning can easily be
accomplished with the
PFD in full view. Press
INSET>ENG/STAT>
LEAN for Lean Assist.
Bar Graph
A1-A6
EGT History
Graph
CHT Vertical
Graph
EGT
Vertical
Graph
EGT History
Graph
EGT/CHT History Inset: Displays the CHT
History Graph above the EGT History Graph.
The EGT line graph is often overlooked, but
it is very useful for instantly noticing EGT
trends which can signal the beginning of a
plugged injector, stuck valve, or other
cylinder-specific engine malfunction.
Revision A1
Combo
Box 1-4
Horizon HXr User Manual Draft
CHT
History
Graph
EGT
History
Graph
5
HXr Graphical Engine Display Setup
Section 2: Choosing Engine & Systems Data to Display
2.1 Displaying Engine Information on the HXr
There are 53 engine and systems data sets to choose from for the Graphical Engine Display. This might
seem like a daunting number, but you will not use them all. They are all there to accommodate a wide
range of engines and airframes. Some choices, such as N1/N2, TIT and Torque, are available for turbine
engines. Others, such as Air Pressure, are available for aircraft with pneumatic systems.
This section provides you with some tools to decide which engine and systems data sets to display and
where to put them. The table lists all of the choices for the Graphical Engine Display and where they
can be displayed on screen. It also includes part numbers and/or descriptions of the sensors required
to collect and display the information. All of the sensor part numbers listed are available from GRT.
Some sensors may be provided with your engine, and some engines may require a different type of
sensor. If your engine requires a type of sensor not listed here, give us a call. The reason we offer such
a large list of options is because our customers are always asking for expansion of our software and
hardware to include more sensors and information.
Your engine/systems layout will depend heavily on the type of engine you have and the type of flying
you will do. Use the worksheet in Section 2.2 to lay out the data fields that work best for you. The table
presented in 2.3 lists all of the data sets, along with the places they can be located.
TIP: Fields shaded in gray in the table are always shown on the ENG/MAP home screen in the Fixed
Data Boxes. Because they are always present, you may choose not to redundantly display them in the
programmable data fields. If the sensors required are not installed, these values are shown as a horizontal
dashed line.
6
Horizon HXr User Manual Draft
Revision A1
HXr Graphical Engine Display Setup
2.2 Sequence for Setting Up the Graphical Engine Display
Because some menu options are activated by other menu options, follow this sequence to set up your
Graphical Engine Display. It will save some time and eliminate some page flipping in the Set Menu.
1. Gather documentation for your engine limitations, electrical system, Sensed Value
fuel system, and EIS wiring. During this process, you will program the
Graph Max
limits for the graphs and dials, as well as configure the HXr to match
the EIS auxiliaries.
Max Limit
2. Press MORE > Set Menu > Graphical Engine Display. Scroll down past
the Dial settings. Set the minimum and maximum values for the various
bar graphs listed that apply. These numbers represent the “Graph Max” Min Limit
and “Graph Min” as shown to the right, and should normally be set a
little bit above and below the absolute limits. You will set the limits
Graph Min
later on.
3. Continuing down the Graphical Engine Display page, you will see the Aux Functions. These must
match the Aux functions wired and programmed into the EIS. Set each applicable Aux function
source and decimal/integer setting to match your EIS wiring and setup. Set the Graph Min and Max
levels for these as well. Data provided by EIS Aux functions will not show up as a choice for the Dials
until this step is complete.
4. Finish up by setting up the other graphs listed on the page. If they will not be used, set “0” for each
limit. SAVE YOUR SETTINGS!
5. Use the diagrams and worksheets in the next section of this supplement to choose the functions for
the various Bar Graphs, Boxes, and Dials. Assign the graphs and dials on the Graphical Engine Display
page, starting with the Dials, and work down to Bar Graphs A & B, Boxes 1-8 and Combo Boxes.
Unused graphs, boxes and dials should be set to OFF so they will not appear on the screen.
NOTE: If all Bar Graphs in the B block are “OFF,” the STATUS box appears instead on the ENG/MAP
page. See Inset description in Section 1.5 of this manual for more information on the STATUS box.
6. SAVE YOUR SETTINGS!!
7. Press MORE > Set Menu and scroll to Engine Limits. Get out your engine documentation and set up
all of the limits for the dials and graphs. This sets the Max and Min Limits as illustrated above, as well
as the colored bands on the Dials. When each parameter exceeds the maximum or fails to meet the
minimum limits set on this page, the graph, dial or box will flash red and a message will appear that
describes the problem. SAVE SETTINGS when finished.
Revision A1
Horizon HXr User Manual Draft
7
HXr Graphical Engine Display Setup
8. If you have a Manifold Pressure sensor (MAP-01 or MAP-02), scroll to Engine Performance and press
the knob to bring up the performance table. Fill in the horsepower and change-in-horsepower (delta)
values in the table according to your engine documentation. This will enable the HXr to calculate
Percent Power and Specific Fuel Consumption (SFC). If you do not have original documentation for
your engine, there are some performance tables for common engines on the EIS Documentation
section of the GRT Avionics website.
9. If you haven’t already, fill in the Fuel Data Scales table to calibrate your fuel gauge indications. See
the Resistive Float Senders Supplement for Horizon, also available on the GRT website under EIS
Documentation.
10.
This is a great time to backup all of the EFIS settings onto a memory stick.
NOTE: We do not recommend using the Backup Settings feature to program Engine Limits and
Graphical Engine Display in a second or third EFIS because it will overwrite ALL settings in the display
unit. Usually it will cause some critical settings such as serial port assignments to be overwritten and
cause more work than it saved.
To backup EFIS settings:
a. Insert the USB thumb drive into the display unit.
b. Go to SET MENU > DISPLAY UNIT MAINTENANCE.
c. Right at or near the top is EFIS Settings Backup. Highlight this and push the knob.
d. Highlight Backup All Settings and push the knob. Answer YES at the prompt. The system will
back up all the display unit’s settings onto the USB drive.
e. If it ever becomes necessary to restore your settings, use the Restore All Settings option.
8
Horizon HXr User Manual Draft
Revision A1
HXr Graphical Engine Display Setup
2.2 Data Sets and Location Options
Each “x” marks a location that the Data Set can be displayed. Gray shaded data sets are always visible in
the Fixed Data Box on the ENG/MAP screen. Sensors listed may not apply to all engines.
Dials
Bar
Graphs
A/B
Box 1-8/
Combo
Air Pressure
x
x
x
Included w/ Engine
Amp
x
x
x
Amp2
x
x
x
CS-01 or CS-02
Current Sensor
Carb Temperature
x
x
CHT 1
x
CHT-XX-01
CHT 2
x
CHT-XX-01
Coolant Temperature
x
Data Set
x
Density Altitude
Required Sensor(s)
CARB-01
x
x
FT-1827-02
x
OAT-Included w/EFIS
EFIS Power Bus 1 Volts
x
x
x
N/A- Internal
EFIS Power Bus 2 Volts
x
x
x
N/A- Internal
EFIS Power Bus 3 Volts
x
x
x
N/A- Internal
EGT 1
x
EGT-XXX-01
EGT 2
x
EGT-XXX-01
EIS Volts
x
x
Engine Hour Meter
Fuel (Combined)
Revision A1
Fixed
Data
Box
N/A- Internal
x
x
See “RPM”
Fuel level senders +
FF-EI-FT-60
x
Fuel Economy-Air
x
x
FF-EI-FT-60 + GPS
Fuel Economy-Ground
x
x
FF-EI-FT-60+ GPS
Fuel Endurance
x
x
FF-EI-FT-60
Fuel Flow
x
x
x
FF-EI-FT-60
Fuel Flow-Fuel Remaining
x
x
x
FF-EI-FT-60
Fuel Level (L, R, Center)
x
x
Fuel Pressure
x
x
Fuel level senders
x
LPS-02
Fuel Range
x
x
FF-EI-FT-60
Fuel Used
x
x
FF-EI-FT-60
Horizon HXr User Manual Draft
9
HXr Graphical Engine Display Setup
NOTE: Any monitored parameters that are exceeded will show up as a flashing warning box regardless of
the engine instruments currently displayed, so it is not critical to see all engine indications at all times.
Bar Graphs Box 1-8/
Dials
A/B
Combo
Data Set
x
Sensor Required
Gear Box Temperature
x
x
Highest CHT
x
x
CHT-XXX-01
Highest EGT
x
x
EGT-XXX-01
Highest TIT
x
x
EGT-HCSLL-01
Hydraulic Pressure 1
x
x
x
Hydraulic Pressure 2
x
x
x
MAP (Manifold Pressure)
x
x
N1
x
x
N2
x
x
N3
x
x
Oil Pressure
x
x
x
HPS-01 or HPS-02
Oil Temperature
x
x
x
FT-LC-01
Percent Power
x
x
RPM
x
x
RPM2
x
x
RPM3
x
x
SFC (Specific Fuel
Consumption)
x
FT-1827-02
HPS-2500
MAP-01 or MAP-02
Included w/ Engine
x
MAP-01 or MAP-02
Typically uses magneto
P-lead
x
MAP-XX + FF-EI-FT-60
TIT1
x
EGT-HCSLL-01
TIT2
x
EGT-HCSLL-01
Torque
x
x
VP-200 Aux Batt Volt
x
VP-200 Bus A AMP
x
VP-200 Bus A VOLT
x
VP-200 Bus B AMP
x
VP-200 Bus B VOLT
x
Water Pressure
10
Fixed
Data
Box
x
x
Included w/ Engine
Vertical Power VP-200
electronic circuit
breaker system. Other
Vertical Power models
have their own status
page on the EFIS.
x
Horizon HXr User Manual Draft
LPS-02
Revision A1
HXr Graphical Engine Display Setup
2.3 Data Boxes & Dials Layout
You may fill in the blanks to help plan your layout. See Appendix for sample layouts.
BOX 1
BOX 2
BOX 3
BOX 4
BOX 5
BOX 6
BOX 7
BOX 8
Ÿ Data Boxes 1-8 (left) appear on all
PFD screens, the MAP home screen,
and ENG/MAP home screen.
Ÿ They do NOT appear on the
MAP/CHART screen.
DIAL 1
A1
A2
A3
A4
A5
A6
Bar Graph A data appears on ENG/MAP page,
PFD Split Screen, and COMBO Inset window.
DIAL 2
DIAL 3
B1
B2
B3
B4
B5
B6
Bar Graph B data appears on ENG/MAP
page only, above the Fixed Data Boxes.
DIAL 4
Ÿ Dials 1-4 (above) appear on the PFD
home screen, the PFD Split screen (across
the bottom), and the ENG/MAP home
screen. They do NOT appear on the MAP
or MAP/CHART home screens.
Revision A1
On the ENG/MAP screen, the Fixed Data Boxes, CHT
and EGT Bar Graphs, and EGT Time History line graph
appear BELOW the configurable fields shown here.
Horizon HXr User Manual Draft
11
HXr Graphical Engine Display Setup
NOTE: Any monitored parameters that are exceeded will show up as a flashing warning box regardless
of the engine instruments currently displayed, so it is not critical to see all engine indications at all times.
A1
A2
A3
A4
A5
A6
COMBO 1
COMBO 2
COMBO 3
COMBO 4
EGT History Line Graph
The only customizable inset is the Combo, shown here enlarged for clarity.
12
Horizon HXr User Manual Draft
Revision A1
HXr Graphical Engine Display Setup
Sample A- Carbureted/fixed pitch, liquid cooled, VFR with Basic EIS Package
When configurable data boxes are set to OFF, they simply disappear off the screen.
BOX 1
BOX 2
EFIS Power Bus
1 Volts
BOX 5
EIS Volts
BOX 6
Engine
Hourmeter
Dial 1
Density Alt
A1
A2
A3
A4
A5
RPM
Bar
Graph
A
Dial 2
Oil Pressure
L Fuel
R Fuel
Oil Prs
Oil Temp
Coolant
Temp
Dial 3
Oil Temperature
Dial 3
Coolant
Temperature
Revision A1
Horizon HXr User Manual Draft
13
HXr Graphical Engine Display Setup
A1
A2
A4
A3
A5
COMBO 1
RPM
L Fuel
R Fuel
Oil Prs
Oil Temp
Coolant
Temp
EGT History Line Graph
Sample Combo Box Inset, enlarged for clarity. This inset is set up to offer a redundant view of the
important engine controls featured by the Dials in the Combo fields. It will be most useful on the fullsize Map screen, which does not show the Dials.
14
Horizon HXr User Manual Draft
Revision A1
HXr Graphical Engine Display Setup
Sample B- VFR, Advanced Lycoming/Continental EIS package + Carburetor Temperature
BOX 1
BOX 2
Amps
BOX 5
BOX 3
Oil Pressure
BOX 6
EFIS Power Bus
1 Volts
Dial 1
BOX 4
SFC
BOX 7
Oil Temp
A1
Ÿ Data Boxes 1-8 (left) appear on all
PFD screens, the MAP home screen,
and ENG/MAP home screen.
Fuel Flow
BOX 8
Carb Temp
A2
Ÿ They do NOT appear on the
MAP/CHART screen.
Density Alt
A3
A4
A5
A6
RPM
Bar
Graph
A
Dial 2
MAP
Dial 3
L Fuel
B1
R Fuel
Fuel
Total
Fuel Flow
Fuel Prs
Carb
Temp
B2
% Power
Bar
Graph
B
Dial 4
Fuel Combo
Amps
Revision A1
EFIS Bus
1
Horizon HXr User Manual Draft
15
HXr Graphical Engine Display Setup
A1
A2
A3
A4
A5
A6
COMBO 1
RPM
COMBO 2
MAP
COMBO 3
% Power
COMBO 4
L Fuel
R Fuel
Fuel
Total
Fuel
Flow
Fuel Prs
Carb
Temp
SFC
EGT History Line Graph
Sample Combo Box Inset, enlarged for clarity. This inset is set up to offer a redundant view of the
important engine controls featured by the Dials in the Combo fields. It will be most useful on the fullsize Map screen, which does not show the Dials.
16
Horizon HXr User Manual Draft
Revision A1
HXr Graphical Engine Display Setup
Sample C- IFR, Lycoming/Continental Advanced EIS package, constant-speed prop with Vertical Power
electronic circuit breaker system
BOX 1
BOX 2
Amps
BOX 5
BOX 3
EFIS Power Bus
1 Volts
BOX 6
Engine
Hourmeter
Dial 1
BOX 4
Oil Pressure
BOX 7
EFIS Power Bus
2 Volts
A1
Ÿ Data Boxes 1-8 (left) appear on all
PFD screens, the MAP home screen,
and ENG/MAP home screen.
Fuel Flow
BOX 8
Oil Temp
A2
Ÿ They do NOT appear on the
MAP/CHART screen.
Density Alt
A3
A4
A5
A6
RPM
Bar
Graph
A
Dial 2
MAP
Dial 3
L Fuel
B1
R Fuel
B2
Fuel
Total
B3
Fuel Flow
B4
Fuel Prs
B5
Oil Prs
B6
% Power
Bar
Graph
B
Dial 4
Fuel
Combination
Revision A1
Amps
EFIS Bus
1
EFIS Bus
2
VP200
Amps
Horizon HXr User Manual Draft
VP200
Volts
VP200
Batt Volt
17
HXr Graphical Engine Display Setup
A1
A2
A3
A4
A5
A6
COMBO 1
RPM
COMBO 2
MAP
COMBO 3
% Power
L Fuel
R Fuel
Fuel
Total
COMBO 4
Fuel
Flow
Fuel Prs
Oil Prs
SFC
EGT History Line Graph
Sample Combo Box Inset, enlarged for clarity. This inset is set up to offer a redundant view of the
important engine controls featured by the Dials in the Combo fields. It will be most useful on the fullsize Map screen, which does not show the Dials.
18
Horizon HXr User Manual Draft
Revision A1