1
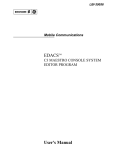
MICROCOMPUTER
MN101C00
MN101C00 Series
C Source Code Debugger
for Windows R
User's Manual
Pub.No.11431-012E
MS-DOS is a registered trademark of Microsoft Corporation.
Windows is a trademark of Microsoft Corporation.
PanaXSeries is a trademark of Matsushita Electric Industrial Co., Ltd.
The other corporation names, logotype and product names written in this book are trademarks or registered
trademarks of their corresponding corporations.
Request for your special attention and precautions in using the technical
information and semiconductors described in this book
(1) An export permit needs to be obtained from the competent authorities of the Japanese
Government if any of the products or technologies described in this book and controlled under
the "Foreign Exchange and Foreign Trade Law" is to be exported or taken out of Japan.
(2) The contents of this book are subject to change without notice in matters of improved function.
When finalizing your design, therefore, ask for the most up-to-date version in advance in order
to check for any changes.
(3) We are not liable for any damage arising out of the use of the contents of this book, or for any
infringement of patents or any other rights owned by a third party.
(4) No part of this book may be reprinted or reproduced by any means without written permission
from our company.
If you have any inquries or questions about book or our semiconductors, please contact one of
our sales offices listed at tha back of this book or Matsushita Electoronics Corporation’s Sales
Department.
CONTENTS
Chapter 1. Overview
Chapter 2. Installation
Chapter 3. Using Debugger for First Time
0
1
2
3
Chapter 4. Creating User Program to Debug
4
Chapter 5. Window Commands
5
Chapter 6. Dialog Command Data Expressions
6
Chapter 7. Dialog Command Reference
7
Chapter 8. Appendices
8
INDEX
9
About This Manual
This manual is for those debugging software for the MN101C00 series. Chapters 1 through 3
describe the overall features of the C Source Code Debugger for Windows, installation, and loading
for the first time. Chapter 4 outlines the procedure for preparing a C program for debugging. Chapter
5 contains detailed explanations of debugger windows, their on-screen elements, and operations.
Chapters 6 covers data expressions for the dialog commands used in the [Command]. Chapter 7 is a
command reference for dialog commands. Chapter 8 contains three appendices covering the incircuit emulator specifications, interface board settings, and error messages.
Finding Information
This manual provides four different aids for rapidly finding necessary information.
(1) The thumbnail index at the front of the manual indicates the beginnings of chapters.
(2) The table of contents at the front of the manual lists sections by title.
(3) The upper right hand corner of right hand pages gives the chapter title; the bottom of each
page, the section title. Together these give you an overview of the information available as
you flip through the pages.
(4) The index at the back of the manual provides references by keywords.
Related Manuals
In addition to this manual, the following manuals are available for the MN101C00 series.
MN101C00 Series Installation Manual
MN101C00 Series LSI User's Manual
(Description of device hardware)
MN101C00 Series Instruction Manual
(Description of instruction set)
MN101C00 Series C Compiler User's Manual: Usage Guide
(Description of installation, loading, and options)
MN101C00 Series C Compiler User's Manual: Language Description
(Description of compiler's C implementation)
MN101C00 Series C Compiler User's Manual: Library Reference
(Description of standard library functions included with the compiler)
MN101C00 Series Cross Assembler User's Manual
(Description of assembly language syntax and notation)
Contact
If you have any questions related to the contents of this manual, direct them to your nearest
Matsushita Semiconductor Design Center. (The Centers are included in the list of sales offices
appearing at the end of this manual.)
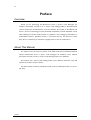
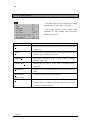
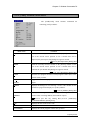
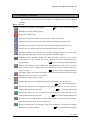
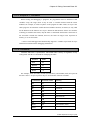
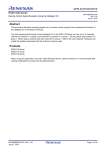
Page Layout
The contents of this manual may be roughly divided into the following parts: titles, summaries,
main text, notes, and comments. The fifures accompanying the summaries are screen shots of
operation under Windows 95.
Header
Title
Chapter.3. Using Debugger for First Time 45
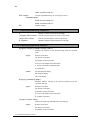
Summary
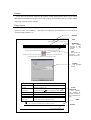
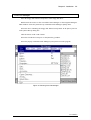
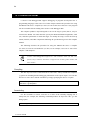
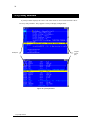
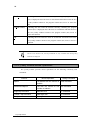
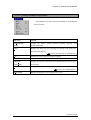
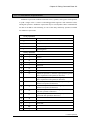
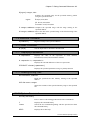
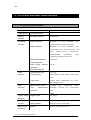
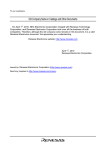
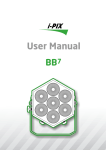
3.3 Create Environment Settings File
Create the environment settings file (ENV101C.TXT) in the working directory by editing
the model-specific definition file (PICE101C.ENV) matching the target probe used
Clicking the mouse on the <ENV> button
on the Pset101C tool bar produces the
following dialog box. The Table below lists the settings provided.
This
provides
overview
section.
material
a brief
of the
Icon
This shows an
on-screen
icon
relevant to the text.
Figure
This illustrates
the text.
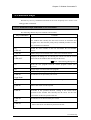
Figure 25 [Environment Setting] Dialog Box
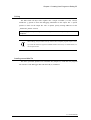
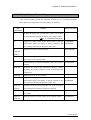
Item
Description
Interface
method
Choose either dedicated interface board in the desktop
computer or PCMCIA card.
Interface board
I/O address
Enter the I/O address specified with the DIP switches on
“7.2 Configuring Interface Board”]
the interface board. [
CPU
Select the device being used.
BUS SIZE
Select the bus size.
Memory mode
Stack
after reset
pointer
Select the memory mode.
Cross
reference
This
indicates
the
location
of
related information.
This illustrates the
text.
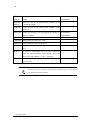
Enter an initial value for the stack pointer. (This address
must be within memory physically present.)
Note
C Source Code Debugger/Win reads the environment settings file when it loads.
Be careful not to accidentally delete or modify the contents.
Create Environmental Setting File
Footer
CONTENTS
2
CONTENTS
CHAPTER 1. OVERVIEW ............................................................................ 13
1.1 Features ................................................................................................................... .....................14
1.1.1 Enhanced Features ..................................................................................................14
1.1.2 Powerful Data Display/Editing Functions...............................................................14
1.1.3 Tool Bar................................................................................................................. .14
1.1.4 User Customization.................................................................................................14
1.1.5 On-the-Fly Support .................................................................................................15
1.1.6 Macros ....................................................................................................................15
1.1.7 Trace Functions ......................................................................................................15
1.1.8 Performance Evaluation Functions .........................................................................15
1.2 Important Notes............................................................................................................................16
1.2.1 Hardware ................................................................................................................16
1.2.2 Software..................................................................................................................17
1.2.3 ROM and RAM ......................................................................................................17
1.2.4 [Go], [Step], and [Come] Commands .....................................................................17
1.2.5 Breakpoints.............................................................................................................18
1.2.6 Tracing....................................................................................................................18
1.2.7 On-the-Fly Support .................................................................................................19
1.2.8 Miscellaneous .........................................................................................................19
1.3 Basic Operating Procedure...........................................................................................................20
CHAPTER 2. INSTALLATION ..................................................................... 25
2.1 Preparing for Installation................................................................................................. .............26
2.1.1 Install Interface Board ............................................................................................26
2.1.2 Connect In-Circuit Emulator...................................................................................26
2.1.3 Back Up Floppy Disks............................................................................................26
2.1.4 Start Windows ........................................................................................................26
2.2 Installation............................................................................................................... .....................27
2.2.1 Read README.WRI .............................................................................................27
2.2.2 Run Installation Program ........................................................................................27
2.2.3 Windows V3.1 Installation .....................................................................................28
2.2.4 Windows 95 Installation .........................................................................................30
2.2.5 Specify Installation Directories...............................................................................32
CONTENTS
3
2.2.6 Copying Files..........................................................................................................33
2.2.7 Interrupting Installation ..........................................................................................34
CHAPTER 3.USING DEBUGGER FOR FIRST TIME................................... 35
3.1 Set Up Environment with Pset101C.............................................................................................36
3.1.1 Load Pset101C........................................................................................................37
3.2 Check Files...................................................................................................................................43
3.2.1 Files Necessary for Loading ...................................................................................43
3.2.2 Files Saved at Exit ..................................................................................................44
3.2.3 Other Files ..............................................................................................................44
3.3 Create Environment Settings File.................................................................................................45
3.4 Specify Starting Options ..............................................................................................................46
3.4.1 Specifying Starting Options via Dialog Box...........................................................46
3.4.2 Specifying Starting Options via Command Line.....................................................47
3.5 Load the Debugger .......................................................................................................................50
3.5.1 Debugger Loads Normally......................................................................................50
3.5.2 Debugger Does Not Load .......................................................................................51
CHAPTER 4.CREATING USER PROGRAM TO DEBUG ............................ 53
4.1 Convert to ROM...........................................................................................................................54
CHAPTER 5. WINDOW COMMANDS ......................................................... 57
5.1 Screen Layout.............................................................................................................. .................58
5.1.1 Structural Elements.................................................................................................58
5.1.2 Screen Display ........................................................................................................60
5.2 Menus...................................................................................................................... .....................61
5.2.1 [File] Menu .............................................................................................................6 1
5.2.2 [Edit] Menu.............................................................................................................62
5.2.3 [Search] Menu ........................................................................................................63
5.2.4 [View] Menu...........................................................................................................63
5.2.5 [Run] Menu.............................................................................................................64
5.2.6 Local Menus for Individual Windows ....................................................................65
5.2.7 [Window] Menu......................................................................................................69
5.2.8 [Options] Menu.......................................................................................................70
5.2.9 [Help] Menu ...........................................................................................................70
5.3 Shortcut Keys ...............................................................................................................................71
CONTENTS
4
5.3.1 Shortcut Keys Available in All Windows ...............................................................71
5.3.2 Window-Specific Shortcut Keys.............................................................................73
5.4 Mouse Operations ........................................................................................................................74
5.4.1 Mouse Operations Available in All Windows ........................................................74
5.4.2 Window-Specific Mouse Operations ......................................................................75
5.5 [Code] Window............................................................................................................................76
5.5.1 [Code] Window Shortcut Keys ...............................................................................77
5.5.2 [Code] Window Local Menu ..................................................................................79
5.5.3 [Code] Window Mouse Operations ........................................................................80
5.6 [Command] Window....................................................................................................................81
5.6.1 [Command] Window Shortcut Keys .......................................................................81
5.6.2 [Command] Window Local Menu ..........................................................................83
5.7 [Memory] Window.......................................................................................................................84
5.7.1 [Memory] Window Shortcut Keys..........................................................................84
5.7.2 [Memory] Window Local Menu .............................................................................85
5.7.3 [Memory] Window Mouse Operations ...................................................................85
5.8 [Register] Window .......................................................................................................................86
5.8.1 [Register] Window Shortcut Keys ..........................................................................86
5.8.2 [Register] Window Local Menu .............................................................................87
5.8.3 [Register] Window Mouse Operations ...................................................................87
5.9 [Stack] Window ...........................................................................................................................88
5.9.1 [Stack] Window Shortcut Keys...............................................................................88
5.9.2 [Stack] Window Local Menu..................................................................................88
5.10 [Local] Window .........................................................................................................................89
5.10.1 [Local] Window Shortcut Keys ............................................................................89
5.10.2 [Local] Window Local Menu................................................................................90
5.10.3 [Local] Window Mouse Operations......................................................................90
5.11 [BackTrace] Window.................................................................................................................91
5.11.1 [BackTrace] Window Shortcut Keys ....................................................................91
5.11.2 [BackTrace] Window Local Menu .......................................................................92
5.11.3 [BackTrace] Window Mouse Operations .............................................................92
5.12 [Watch] Window........................................................................................................................93
5.12.1 [Watch] Window Shortcut Keys ...........................................................................93
5.12.2 [Watch] Window Local Menu ..............................................................................94
5.12.3 [Watch] Window Mouse Operations ....................................................................94
5.13 [Break] Window.........................................................................................................................95
CONTENTS
5
5.13.1 [Break] Window Shortcut Keys............................................................................95
5.13.2 [Break] Window Local Menu ...............................................................................96
5.13.3 [Break] Window Mouse Operations .....................................................................97
5.14 [Trace] Window .........................................................................................................................98
5.14.1 [Trace] Window Shortcut Keys ............................................................................98
5.14.2 [Trace] Window Local Menu ...............................................................................99
5.15 [Inspect] Window.....................................................................................................................100
5.15.1 [Inspect] Window Shortcut Keys........................................................................100
5.15.2 [Inspect] Window Local Menu ...........................................................................101
5.15.3 [Inspect] Window Mouse Operations .................................................................101
5.16 [Memo] Window......................................................................................................................102
5.16.1 [Memo] Window Shortcut Keys .........................................................................102
5.16.2 [Memo] Window Local Menu ............................................................................103
5.17 [RAM Monitor] Window .........................................................................................................104
5.17.1 [RAM Monitor] Window Shortcut Keys ............................................................104
5.17.2 [RAM Monitor] Window Local Menu................................................................105
5.18 Tool Bar ...................................................................................................................................106
5.18.1 Tool Bar Configuration.......................................................................................106
5.18.2 Button Functions.................................................................................................107
5.19 Window Bar .............................................................................................................................109
5.20 Status Bar .................................................................................................................................110
5.21 Dialog Boxes............................................................................................................................111
5.21.1 [File Open] Dialog Box ......................................................................................111
5.21.2 [Font] Dialog Box...............................................................................................112
5.21.3 [Tool Bar] Dialog Box........................................................................................112
5.21.4 [Color] Dialog Box.............................................................................................113
5.21.5 [Find String] Dialog Box ....................................................................................113
5.21.6 [Set Inspect data] Dialog Box.............................................................................114
5.21.7 [Set Watch data] Dialog Box ..............................................................................114
5.21.8 [Module] Dialog Box..........................................................................................115
5.21.9 [Set line no.] Dialog Box ....................................................................................115
5.21.10 [Addressing (Code/RAM Monitor)] Dialog Box..............................................116
5.21.11 [Command History] Dialog Box.......................................................................116
5.21.12 [Expand Symbol] Dialog Box...........................................................................117
5.21.13 [Addressing(Memory)] Dialog Box..................................................................117
5.21.14 [Set Data] Dialog Box ......................................................................................118
5.21.15 [Register] Dialog Box.......................................................................................118
CONTENTS
6
5.21.16 [Flags] Dialog Box ...........................................................................................119
5.21.17 [Event] Dialog Box...........................................................................................119
5.21.18 [Hardware Breakpoint] Dialog Box..................................................................120
5.21.19 [Set Software Breakpoint] Dialog Box .............................................................120
5.21.20 [Jump Frame no.] Dialog Box ..........................................................................121
5.21.21 [Area Events] Dialog Box.................................................................................121
5.21.22 [Area Breakpoint] Dialog Box..........................................................................122
5.21.23 [Additional Options] Dialog Box......................................................................122
CHAPTER 6.DIALOG COMMAND DATA EXPRESSIONS ........................ 123
6.1 Data Expressions........................................................................................................................124
6.1.1 Symbols ................................................................................................................124
6.1.2 Global Symbols ....................................................................................................124
6.1.3 Local Symbols ......................................................................................................125
6.1.4 Predefined Symbols ..............................................................................................126
6.1.5 Numerical Values .................................................................................................126
6.1.6 Addresses..............................................................................................................126
6.1.7 Line Numbers .......................................................................................................127
6.1.8 Strings...................................................................................................................128
6.1.9 Register Names .....................................................................................................128
6.1.10 Arithmetic Expressions.......................................................................................129
6.2 Data Expressions Using C Syntax ..............................................................................................131
6.2.1 C Expressions .......................................................................................................131
6.2.2 C Variables ...........................................................................................................132
6.2.3 Scope of C Variables ............................................................................................133
6.2.4 Constants ..............................................................................................................133
6.2.5 Operators ..............................................................................................................134
6.2.6 Expressions with Side Effects...............................................................................135
CHAPTER 7.
DIALOG COMMAND REFERENCE................................... 137
7.1 Command Description Conventions...........................................................................................138
7.2 Commands Grouped by Function...............................................................................................139
7.2.1 Loading User Program..........................................................................................139
7.2.2 Running User Program .........................................................................................139
7.2.3 Breakpoint Commands..........................................................................................139
7.2.4 Area Event Commands .........................................................................................140
7.2.5 Real-Time Tracing Commands .............................................................................140
CONTENTS
7
7.2.6 Hardware-Related Commands ..............................................................................141
7.2.7 Displaying/Modifying Registers ...........................................................................142
7.2.8 Displaying/Modifying Memory ............................................................................142
7.2.9 Assemble Command .............................................................................................143
7.2.10 Radix Command .................................................................................................143
7.2.11 Displaying Expressions.......................................................................................143
7.2.12 Reading/Writing Files.........................................................................................143
7.2.13 System Commands..............................................................................................143
7.2.14 Displaying/Modifying Symbols ..........................................................................144
7.2.15 Displaying Code .................................................................................................144
7.2.16 Displaying/Modifying C Data.............................................................................144
7.2.17 Setting Options ...................................................................................................145
7.2.18 Memo Commands...............................................................................................145
7.2.19 Logging/Running Batch Commands ...................................................................145
7.2.20 Screen Control/Miscellaneous Commands .........................................................145
7.2.21 Predefined Symbols ............................................................................................146
7.2.22 Macro Commands...............................................................................................146
CHAPTER 8. APPENDICES ...................................................................... 147
8.1 In-Circuit Emulator Specifications......................................................................................... ....148
8.1.1 Functional Specifications......................................................................................148
8.1.2 Electrical Specifications .......................................................................................149
8.1.3 Environment Specifications ..................................................................................149
8.1.4 External Dimensions.............................................................................................149
8.2 Configuring Interface Board ......................................................................................................150
8.2.1 Interface Board for PC/AT ...................................................................................151
8.3 Error Messages...........................................................................................................................152
INDEX ......................................................................................................... 159
CONTENTS
8
Preface
Overview
Thank you for purchasing the MN101C00 Series C Source Code Debugger for
Windows (hereinafter referred to as "C Source Code Debugger/Win"), Windows-based
control software for the PanaXSeries in-circuit emulator. This update to the MN101C00
Series C Source Code Debugger retains backward compatibility with the MS-DOS version
while adding new features made possible by Windows: more debugging information, a
multiwindow interface, pull-down menus, a convenient tool bar, and extensive on-line
help. We are certain that you will find it a highly effective tool for continued use.
About This Manual
The manual set for the software consists of the MN101C00 Series Installation Manual
and the MN101C00 Series C Source Code Debugger for Windows User's Manual
(hereinafter referred to as the "C Source Code Debugger/Win User's Manual").
This manual, the C Source Code Debugger/Win User's Manual, details the setup and
operation procedures for the software.
For further details on dialog commands entered via the [Command] window, see the online help.
Preface
9
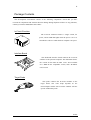
Package Contents
The development environment consists of the following components. Check that you have
received all components and examine them for damage during shipment. If there are any problems,
contain your nearest Matsushita Sales Office.
In-Circuit Emulator
The in-circuit emulator features a single switch, for
power, and an LED that lights when the power is on. It is
OPT
OFF
/O
IO
N
controlled as a device within the host computer's I/O space.
N
A
R
TO B
EC R
NN TO
CONNEC
CO
Interface Board
This dedicated interface board connects the in-circuit
emulator to the personal computer. The illustration shows
the version for the NEC PC-9801 series. Also available
are a IBM PC/AT compatible version, and a PCMCIA
card version.
Target Probe
This probe connects the in-circuit emulator to the
target board. The exact shape depends on the
microcomputer model. The in-circuit emulator will not
operate without this probe.
Preface
10
34-Lead Flat Cable (1.5 m)
This cable connects the in-circuit emulator
to the dedicated interface board in the host
computer.
Option Probe
The option probe supplies the target probe with
power to confirm the booting of the in-circuit
emulator. Use the option probe's power supply only
for this purpose.
Floppy Disk
The package contains two floppy disks, labeled
"Setup Disk" and "Disk 2." Always use the setup
program on the former to install C Source Code
Debugger/Win.
Manuals
MN101C00 Series C Source Code Debugger for Windows User's
Manual (this manual)
This manual gives the procedures for installing the software and using it under
Windows.
MN101C00 Series Installation Manual
This manual gives the procedures for connecting the in-circuit emulator, installing and
configuring the interface board, and connecting to a PanaXSeries device.
Preface
11
Operating Environment
This section describes the hardware and software necessary for installing the C Source
Code Debugger/Win package. Before proceeding to the actual installation, check your
hardware and software.
Necessary Hardware
Personal Computer and Memory
The package requires a personal computer that has a CPU that is an 80386 or better, has
at least eight megabytes of memory, runs either Windows V3.1 or Windows 95, and
contains an expansion bus matching the specifications of the in-circuit emulator's
dedicated interface board.
Display
The display can be either external or built into the personal computer, but it must
support Windows V3.1 or Windows 95.
Hard Disk
C Source Code Debugger/Win requires a hard disk with at least five megabytes of free
space.
Floppy Disk Drive
Setting up C Source Code Debugger/Win requires at least one floppy disk drive. This
drive must match the specifications of the floppy disks included with the package.
Mouse
To derive the full benefit of C Source Code Debugger/Win's many features, you must
have a Windows V3.1/Windows 95-compatible mouse attached to your personal computer.
Preface
12
Necessary Software
MS-DOS
The Windows V3.1 version requires that the MS-DOS be running on the computer used.
The Windows 95 version runs under both English- and Japanese-language versions of the
operating system.
Windows
The package requires Windows 95 or Windows V3.1. Before starting the C Source
Code Debugger/Win installation procedure, make sure that Windows is running on the
computer.
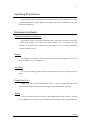
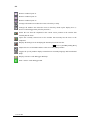
Typographical Conventions
This manual uses the following typographical conventions.
[Menu]
Menu names are enclosed in square brackets.
[Menu]-[Command]
Commands are also shown in square brackets and preceded
with the name of the menu on which they appear.
[Dialog]
Dialog boxes are also shown in square brackets.
<Button>
Button names are shown in angle brackets.
On-Line Help
C Source Code Debugger/Win includes on-line help for on-screen viewing of
explanations for functions and procedures. To display these help screens, press the End,
type the HELP dialog command, select the [Help]-[Contents] command, or click the
mouse on the <Help> button.
Preface
Chapter 1. Overview
1.1 Features
1.2 Important Notes
1.3 Basic Operating Procedure
14
1.1 Features
C Source Code Debugger/Win incorporates many features to make work easier for the
developer.
1.1.1 Enhanced Features
Users of the MS-DOS version should have no trouble making the transition since most
keyboard operations (including function keys) for the [Code] and [Command] windows
are the same. The software has been enhanced, however, with such standard Windows
features as pull-down menus, scroll bars, a tool bar, and on-line help. Setting up such
complex operations as a hardware breakpoint or a real-time trace involves only simple
mouse operations within the corresponding dialog box.
1.1.2 Powerful Data Display/Editing Functions
This new version features greatly enhanced facilities for displaying and editing data.
Moving the mouse cursor to a variable, array, or bit value in a [Code] window and doubleclicking, for example, is all that it takes to open the [Inspect] window for viewing and
editing the corresponding data in the appropriate data structure. Data display/editing is
equally easy in the [Watch], [Local], [Register], and [Memory] windows.
1.1.3 Tool Bar
Buttons on the user-configurable tool bar provide instant access, with a single mouse
click, to such frequently used commands as those for loading the user program to be
debugged, running it, and inspecting a variable.
1.1.4 User Customization
The tool bar, text fonts, display colors, window layouts, etc. are all freely configurable.
Up to three window layouts may be defined.
1.1 Features
Chapter 1. Overview 15
1.1.5 On-the-Fly Support
On-the-fly support allows you to set breakpoints, specify/display traces, and display/edit
data in RAM without stopping the user program. You can thus debug without halting
operation of the target CPU.
1.1.6 Macros
The debugger supports a macro language with such C-like control structures as if, for,
while, and do. Macros combine multiple commands into a single new command. Together
with breakpoints, they greatly improve debugging efficiency.
1.1.7 Trace Functions
These functions update the display of trace memory contents every machine cycle as the
user program executes.
1.1.8 Performance Evaluation Functions
C Source Code Debugger/Win includes a profiler for determining the functions where
the user program spends most of its time and a [RAM Monitor] window for displaying the
contents of RAM on the screen as the user program executes.
1.1 Features
16
1.2 Important Notes
This section lists important things to watch out for when using the in-circuit emulator.
1.2.1 Hardware
·
The pins on the probe are precision parts that must be protected from physical shocks.
When storing the probe, cover the connectors with the caps provided.
·
Do not touch the surface of the interface board or the circuit board inside the incircuit emulator.
·
The emulator only supports separately excited oscillation (OSC, XI) for the target.
·
There is a certain amount of error in execution time measurements over extended
periods.
The in-circuit emulator does not operate properly under the following conditions.
·
The clock is supplied by the target, and the clock waveform either does not have the
proper levels or contains excessive noise.
·
The power to the target is off.
·
The bus request signal from the target is active for longer than a specific interval
(approximately 0.1 seconds).
·
The reset signal from the target is active for longer than a specific interval
(approximately 0.1 seconds).
·
The target is operating in the handshake mode, and the NDK signal from the target
does not become active within a specific interval.
·
The NDEAD signal from the target is active for longer than a specific interval
(approximately 0.1 seconds).
1.2 Important Notes
Chapter 1. Overview 17
1.2.2 Software
·
After installing the software on the hard disk, put the floppy disks away in a safe
place for use as master disks. Backing up the C Source Code Debugger/Win disks for
purposes of maintenance and security is the only type of copying permitted. Backups
can be made with such commands as the MS-DOS DISKCOPY and COPY
commands.
·
Add an extra ten bytes to the program user stack for use by the monitor program.
1.2.3 ROM and RAM
·
The addresses from 38000H through to the end of the 256-kilobyte address space are
not available for use as emulation memory.
·
The D, E, U, and other commands cannot display or modify data in the expanded
ROM area if that is assigned to the target.
1.2.4 [Go], [Step], and [Come] Commands
·
The microcomputer does not accept interrupts during [Step] command execution.
·
The [Go], [Step], and [Come] commands are not available when the microcomputer
is in STOP or HALT mode.
·
Add an extra ten bytes to the program user stack for use by the monitor program. This
stack must be in either the RAM emulation memory or the RAM on the target.
·
TI, the in-circuit emulator's command for measuring execution time, does not give
correct results during single-step execution.
1.2 Important Notes
18
1.2.5 Breakpoints
·
Setting a software breakpoint to a byte other than an opcode replaces the operand
with the PI code (0xFF).
·
Since a software breakpoint stops execution just before the instruction specified as
the breakpoint, you cannot specify a count.
·
A hardware breakpoint stops after executing one or two instructions after the
instruction specified as the breakpoint. The exact number depends on the instruction
sequence. Since a ROM hardware breakpoint is based on the microcomputer's ROM
read address, there are sometimes breaks at points other than the specified instruction.
·
You cannot set breakpoints for the microcomputer's Auto Transfer Control (ATC)
operation.
·
You cannot set RAM breakpoints for data sizes word and long.
·
When a trace full breakpoint is in effect, only forced breakpoints and software
breakpoints are available.
·
Setting a RAM area breakpoint in the stack area interferes with execution of the user
program.
1.2.6 Tracing
·
Using single-step operation clears the contents of the trace memory.
·
When a trace full breakpoint is in effect or the number of steps traced is less than 511,
tracing sometimes does not show the first and last instructions executed.
·
Tracing does not show the first instruction executed.
·
You cannot trace the microcomputer's Auto Transfer Control (ATC) operation.
·
You cannot disassemble the trace if the microcomputer is in STOP or HALT mode or
if the target board is in the middle of a reset.
·
When the JSR instruction pushes the return address onto the stack, the trace
sometimes does not show the result until the next instruction.
·
Modifying an event while a direct trigger trace is in effect leads to faulty tracing.
·
Specifying a trace full stop while the user program is running does not stop execution.
1.2 Important Notes
Chapter 1. Overview 19
1.2.7 On-the-Fly Support
·
Displaying or modifying data (e.g., displaying disassembler output) while the user
program is running temporarily suspends execution. The maximum delay per byte is
5 machine cycles for access to the emulation memory and 500 machine cycles for
access to the microcomputer's special registers or external memory on the target
board. During this interval, the debugger displays the message "Warning: CPU
STOPPED" on the status line.
·
You cannot display/edit the contents of memory, the microcomputer's special
registers, or external memory on the target board or disassemble the trace if the
microcomputer is in STOP or HALT mode or if the target board is in the middle of a
reset.
·
Changing event settings while the user program is running clears all previous events.
·
When the in-circuit emulator's RAM monitor and real-time watch functions read the
monitor RAM contents, they do so within a 10-cycle period after the user program
reads memory at a different address. The data cannot be displayed if the user program
accesses that address during that interval. Neither can it be displayed if there is no
access to a different address.
1.2.8 Miscellaneous
·
There is a certain amount of error in execution time measurements over extended
periods.
·
Execution time measurements do not include the execution time for the first
instruction.
·
If the target is operating in the handshake mode, the in-circuit emulator does not issue
acknowledge signals when the microcomputer accesses the external memory space.
You must therefore provide a circuit or other mechanism for generating acknowledge
signals for all external memory regions used.
·
Note that the in-circuit emulator does not issue acknowledge signals even for
accesses to external memory space regions assigned to the emulation memory inside
the in-circuit emulator (with the EX command).
1.2 Important Notes
20
1.3 Basic Operating Procedure
This section describes the basic operating procedure for C Source Code Debugger/Win.
(1) Install software.
Install C Source Code Debugger/Win on the hard disk with the installation program.
[
"Chapter 2. Installation "]
(2) Set up environment
Set up the C Source Code Debugger/Win operating environment with Pset101C.
[
"3.1 Set Up Environment with Pset101C”]
There is a separate setup program for this purpose.
Figure 1. Environment Configuration Program Pset101C
(3) Load debugger.
After setting up the operating environment, load C Source Code Debugger/Win.
Figure 2. C Source Code Debugger/Win Starting Screen
1.3 Basic Operating Procedure
Chapter 1. Overview 21
(4) Load user program.
Load the user program to be debugged.
[
, L command, [File]-[Load] command ]
Figure 3. Loading Target Program
(5) Set breakpoint.
Click the mouse on the line number in a [Code] window to set a breakpoint at the
corresponding address.
[
"5.5.3 [Code] Window Mouse Operations," [Child(Break)]-[Add]]
Figure 4. Setting Breakpoint
1.3 Basic Operating Procedure
22
(6) Run user program.
Run the user program and wait for it to stop at the breakpoint set in step 5. Alternatively,
press the Esc key to force a halt.
[
,[Run]-[Run program],
]
(7) Inspect variable.
Double-click the mouse on a variable to display its contents for editing in the [Inspect]
window.
[
, "5.5.1 [Code] Window Shortcut Keys"]
Figure 5. [Inspect] Window
1.3 Basic Operating Procedure
Chapter 1. Overview 23
(8) Add watch variable.
Add a variable to the [Watch] window.
[
, "5.5.1 [Code] Window Shortcut Keys"]
Figure 6. [Watch] Window
(9) Exit.
Exit C Source Code Debugger/Win.
[
, [File]-[Exit]]
Figure 7. C Source Code Debugger/Win Exit Confirmation
1.3 Basic Operating Procedure
24
1.3 Basic Operating Procedure
Chapter 2. Installation
2.1 Preparing for Installation
2.2 Installation
26
2.1 Preparing for Installation
Before running the C Source Code Debugger/Win installation program, make sure that
the host computer and the in-circuit emulator are properly connected. (You may postpone
the steps in this section if you are only installing the software, however.)
2.1.1 Install Interface Board
Install the in-circuit emulator's dedicated interface board.
[
"8.2 Configuring Interface Board"]
2.1.2 Connect In-Circuit Emulator
1.
Mount the interface board in an expansion slot inside the host computer.
2.
Connect the interface board mounted in the computer to the in-circuit emulator with
the 34-lead flat cable.
3.
Connect the target probe to the in-circuit emulator.
4.
Connect the option connector and the connector extending from the top of the QFP
conversion board under the target probe with the option probe.
For further details on the connection procedure, see the MN101C00 Series Installation
Manual.
2.1.3 Back Up Floppy Disks
After installing the software on the hard disk, put the floppy disks away as master
copies. Backing up the C Source Code Debugger/Win disks for purposes of maintenance
and security is the only type of copying permitted.
2.1.4 Start Windows
Confirm that Windows loads properly.
2.1 Preparing for Installation
Chapter 2. Installation
27
2.2 Installation
This section describes the procedures for running the installation program under
Windows V3.1 or Windows 95.
The files for C Source Code Debugger/Win are stored on the floppy disks in a
compressed format, so installing them involves more than simply copying them to the
hard disk. Always use the C Source Code Debugger/Win installation program supplied
on the first floppy disk.
2.2.1 Read README.WRI
The floppy disk may contain a README.WRI file containing additions to the manual,
cautionary notes, and other late-breaking material. Be sure to read this file with Write,
WordPad, or similar program before running the C Source Code Debugger/Win
installation program.
2.2.2 Run Installation Program
The proper procedure for installing C Source Code Debugger/Win is to insert the floppy
disk labeled "Setup Disk" and run the included installation program SETUP.EXE from
Windows. If you are running Windows V3.1, proceed to Section 2.2.3. If you are running
Windows 95, skip to Section 2.2.4.
2.2 Installation
28
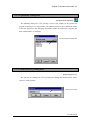
2.2.3 Windows V3.1 Installation
From Program Manager
Insert the floppy disk labeled "Setup Disk" in the floppy disk drive.
Open the Program Manager's [Icon] menu and select the [Run...] command.
In the [Run...] dialog box that appears, enter the name of the drive containing the "Setup
Disk" and the file name SETUP.EXE in the [Command line] text box.
Figure 8. Running from [Run...] Dialog Box
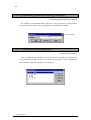
Alternatively, click the mouse on the <Browse> button and select the name of the drive
containing "Setup Disk" and the program name (setup.exe) in the [File Browser] dialog
box that appears.
Click the mouse on the <OK> button to run the program.
Figure 9. Running from [File Browser] Dialog Box
2.2 Installation
Chapter 2. Installation
29
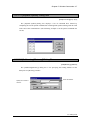
From File Manager
Insert the floppy disk labeled "Setup Disk" in the floppy disk drive.
Double-click the mouse on the icon labeled "File Manager" in the Program Manager's
Main window. Select the [Select drive] command on File Manager's [Disk] menu.
Select the drive containing the floppy disk labeled "Setup Disk" in the [Drive] list box
in the [Select Drive] dialog box.
Click the mouse on the <OK> button.
Select the icon labeled "setup.exe" in the [Directory] window.
Select the [Open] command on File Manager's [File] menu to run the program.
Figure 10. Running from File Manager
2.2 Installation
30
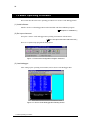
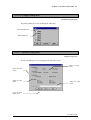
2.2.4 Windows 95 Installation
By Specifying File Name
Insert the floppy disk labeled "Setup Disk" in the floppy disk drive.
On the [Start] menu, select the [Run...] command.
In the [Run...] dialog box that appears, enter the name of the drive containing the "Setup
Disk" and the file name (setup.exe) in the [Command line] text box.
Figure 11. Running from [Run...] Dialog Box
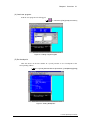
Alternatively, click the mouse on the <Browse> button and select the name of the drive
containing "Setup Disk" and the program name (setup.exe) in the [File Browser] dialog
box that appears.
Click the mouse on the <OK> button to run the program.
Figure 12. Running from [File Browser] Dialog Box
2.2 Installation
Chapter 2. Installation
31
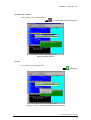
From Explorer
Insert the floppy disk labeled "Setup Disk" in the floppy disk drive.
On the [Start] menu, select [Programs] and then click the mouse on Explorer to run the
program.
In the left panel showing the disk drives and folders, select the name of the drive
containing the "Setup Disk": [Desktop]-[My Computer]-[3.5-inch floppy disk].
When the contents of the disk appear in the right panel, double-click the mouse on the
icon labeled "Setup.exe" to launch the program.
Figure 13. Running from Explorer
2.2 Installation
32
2.2.5 Specify Installation Directories
The installation program starts by asking for directories.( Figure 14)
Figure 14. [Installation Directories] Dialog Box
To change directories for C Source Code Debugger/Win components, enter the path
names from the keyboard.
Debugger
Specify the directory for installing the C Source
Code Debugger/Win program files.
Projects
Specify the working directory.
Sample programs
Specify the directory for installing the sample
programs.
If you do not wish to install a particular group of files, click the mouse on the check box
next to it to erase the check mark. To restore the check mark, click the mouse a second
time on the empty box.
Click the mouse on the <Install> button to start installation.
2.2 Installation
Chapter 2. Installation
33
2.2.6 Copying Files
Clicking on the <Install> button starts file copying. After a while, a dialog box asks for
the second disk. Change floppy disks and click the mouse on the <OK> button.
When it has finished copying the files, the program creates the PanaXSeries group in
the Program Manager (Windows V3.1) or the [Start]-[Program] menu (Windows 95).
This completes the C Source Code Debugger/Win installation. Windows 95 displays
the following window.
Figure 15. New PanaXSeries Group
When C Source Code Debugger/Win installation is complete, put the floppy disks away for
safe keeping.
2.2 Installation
34
2.2.7 Interrupting Installation
You may exit the program when the [Installation Directories] dialog box is on the
screen or the program is copying files. In the latter case, however, the program leaves the
newly created directories on the hard disk. Before repeating the installation, remove these
with Explorer, File Manager, or the DOS DEL command.
2.2 Installation
Chapter 3.Using Debugger for First
Time
3.1 Set Up Environment with Pset101C
3.2 Check Files
3.3 Create Environment Settings File
3.4 Specify Starting Options
3.5 Load the Debugger
36
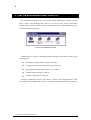
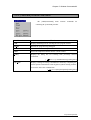
3.1 Set Up Environment with Pset101C
The installation program creates a new group called "PanaXSeries." Before you can
load C Source Code Debugger/Win, however, you must specify certain environment
settings. Double-click the mouse on the icon labeled "Pset101C" in the PanaXSeries group
to load the program for doing so.
Figure 16. PanaXSeries Group
Configuring the C Source Code Debugger/Win operating environment consists of the
following steps.
l
Specifying a working directory (pages 38 and 40)
l
Creating an environment settings file (pages 38 and 45)
l
Specifying the starting options (pages 39, 41, and 46)
l
Creating a shortcut (pages 39 and 41)
l
Saving the setup (pages 39 and 42)
Correctly completing the above steps allows C Source Code Debugger/Win to load
successfully. The icon labeled "Pset101C" is a utility for performing these setup operations.
3.1 Set Up Environment with Pset101C
Chapter.3. Using Debugger for First Time 37
3.1.1 Load Pset101C
The icon labeled "Pset101C" is a utility for setting up the C Source Code
Debugger/Win operating environment.
Load it by double-clicking the mouse on the icon labeled "Pset101C" in the
PanaXSeries group.
Figure 17. Pset101C Starting Screen
There are three possibilities, depending on whether you are creating a new environment,
upgrading from the MS-DOS version of the debugger, or modifying an existing
environment previously created with Pset101C.
If you are upgrading from the MS-DOS version of the debugger, skip to page 39.
If you are modifying an existing environment created with Pset101C skip to page
42.
3.1 Set Up Environment with Pset101C
38
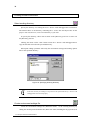
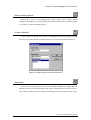
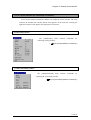
Creating a New Environment
Select working directory.
Specify the directory for creating the new C Source Code Debugger/Win environment.
The normal choice is the directory containing the C source files and object files for the
project. You can, however, create a new directory if you wish.
To specify the directory, either enter its name in the [Directory] text box or select it in
the [Directory] list box.
Clicking the mouse on the <OK> button causes the C Source Code Debugger/Win to
copy the files that it needs to the specified directory.
Subsequent editing operations affect only the environment settings and starting options
files in the specified directory.
Figure 18. Specifying Working Directory
If the files necessary for loading are not present in the specified directory, C Source Code
Debugger/Win will not load properly.
Create environment settings file.
Create the environment settings file (PICE101C.ENV) in the working directory by
editing the model-specific definition file (ENV101C.TXT) matching the target probe used.
3.1 Set Up Environment with Pset101C
Chapter.3. Using Debugger for First Time 39
For further details on the items to be specified (interface board type, I/O port address, CPU
type, bus size, stack pointer after a reset, and memory mode), see Section 3.3 "Creating
Environment Settings File."
Specify starting options.
Specify the C Source Code Debugger/Win starting options. These options tell the
debugger such things as the operating mode and memory configuration. For further details,
see Section 3.4 "Specify Starting Options."
Create a shortcut.
Create a shortcut to the current C Source Code Debugger/Win setup by double-clicking
the mouse on a group. Double-clicking the mouse on that icon then loads the debugger.
Figure 19. Creating Shortcut Labeled "WICE101C"
Save setup
Save the edited setup in the project file. The environment configuration program (the
icon labeled "Pset101C") then automatically reads in these settings the next time that you
run it. To modify the settings, use the procedures in "Modifying an Existing Environment"
below.
3.1 Set Up Environment with Pset101C
40
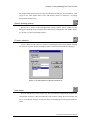
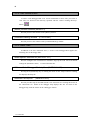
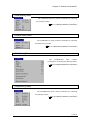
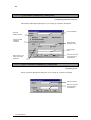
Upgrading from MS-DOS Version
Select working directory.
Select as the directory for creating the C Source Code Debugger/Win environment the
one already in use by the MS-DOS version of the debugger.
Clicking the mouse on the <OK> button produces the warning message box shown in
Figure 21. Click the mouse on the <No> button to keep from overwriting your existing
environment settings file (PICE101C.ENV) .
Figure 20. Specifying Working Directory
Figure 21. [Confirm] Message Box
3.1 Set Up Environment with Pset101C
Chapter.3. Using Debugger for First Time 41
Specify starting options.
Specify the C Source Code Debugger/Win starting options. These options tell the
debugger such things as the operating mode and memory configuration. For further details,
see Section 3.4 "Specify Starting Options."
Create a shortcut.
Create a shortcut to the current C Source Code Debugger/Win setup by double-clicking
the mouse on a group. Double-clicking the mouse on that icon then loads the debugger.
Figure 22. Creating Shortcut Labeled "WICE101C"
Save setup.
Save the edit setup in the project file. The environment configuration program (the icon
labeled "Pset101C") then automatically reads in these settings the next time that you run it.
To modify the settings, use the procedures in "Modifying an Existing Environment" below.
3.1 Set Up Environment with Pset101C
42
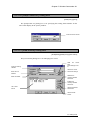
Modifying an Existing Environment
Open existing setup.
Open the setup previously saved with the <Save setup> button.
Modify environment.
Modify the items accessible via the <Environment settings> button
<Starting options> button
and
.
Create a shortcut.
Create a shortcut to the current C Source Code Debugger/Win setup by double-clicking
the mouse on a group. Double-clicking the mouse on that icon then loads the debugger.
Figure 23. Creating Shortcut Labeled "WICE101C"
Save setup.
Save the edited setup in the project file.
3.1 Set Up Environment with Pset101C
Chapter.3. Using Debugger for First Time 43
3.2 Check Files
C Source Code Debugger/Win works with the following files.
3.2.1 Files Necessary for Loading
This section lists the files necessary for loading C Source Code Debugger/Win. The
debugger reads the first three files from the directory specified with the <NEW> button
.
Environment settings file (PICE101C.ENV)
This file specifies such things as the target board configuration and target resources
used by the in-circuit emulator. C Source Code Debugger/Win shares this file with the
MS-DOS version of the debugger.
Windows initialization file (WICE101C.INI)
This file contains environment settings for the Windows version: window positions, text
fonts, color specifications, tool bar configuration, breakpoints, etc.
Starting options file (WICE101C.INF)
This file contains C Source Code Debugger/Win starting options. It is automatically
created with the procedure in Section 3.4 "Specify Starting Options".
Monitor program (MON101C.EX)
This file contains a monitor program that runs on the target CPU. It is identical to the
file supplied with the MS-DOS version of the debugger.
Message file (PICE101C.MES)
This resource file contains messages displayed by C Source Code Debugger/Win.
Auto-execute file (INIT.MCR)
C Source Code Debugger/Win automatically executes the contents of this macro file in
the [Command] when it loads. In other words, you can store commands for any necessary
preliminary processing here to have them automatically run when the debugger loads.
3.2 Check Files
44
3.2.2 Files Saved at Exit
C Source Code Debugger/Win saves session information in these files just before it
exits. They are located in the directory specified with the <Select working directory>
button
.
[Memo] Window contents (MEMO.PT)
This file preserves the contents of the [Memo] window.
[Command History] Window (PT101C.DAT)
This file preserves the contents of the [Command History] window.
3.2.3 Other Files
In addition to the files mentioned above, C Source Code Debugger/Win supplies the
following files on the floppy disks.
Model-specific definition file (ENV101C.TXT)
This file configures the environment to match the target probe used. The environment
settings file (PICE101C.ENV) is created from this file.
C Source Code Debugger/Win help file
(WICE101C.HLP)
Pressing the keyboard Help key or clicking the mouse on the <Help> button in a dialog
box displays this help file.
Instruction set help file
(NEM101C.HLP)
This file provides help for the MN101C00 series instruction set. Clicking the mouse on
the <Instruction set> button in the debugger help displays this file. To return to the
debugger help, click the mouse on the <Debugger> button.
3.2 Check Files
Chapter.3. Using Debugger for First Time 45
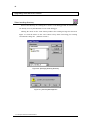
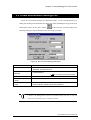
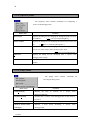
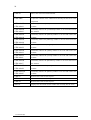
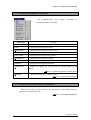
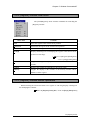
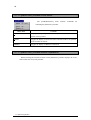
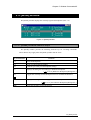
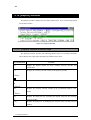
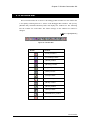
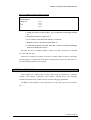
3.3 Create Environment Settings File
Create the environment settings file (PICE101C.ENV) in the working directory by
editing the model-specific definition file (ENV101C.TXT) matching the target probe used.
Clicking the mouse on the <Env> button
on the Pset101C tool bar produces the
following dialog box. The Table below lists the settings provided.
Figure 24. [Environment Settings] Dialog Box
Items
Interface method
Description
Interface board I/O
address
CPU
Memory expansion
mode
Stack pointer after
reset
Choose either dedicated interface board in the desktop
computer or PCMCIA card.
Enter the I/O address specified with the DIP switches on the
interface board.
"8.2 Configuring Interface Board"]
[
Select the device being used.
Select the memory mode.
Enter an initial value for the stack pointer. (This address
must be within memory physically present.)
C Source Code Debugger/Win reads the environment settings file when it loads. Be
careful not to accidentally delete or modify the contents.
3.3 Create Environment Settings File
46
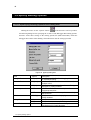
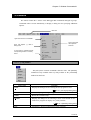
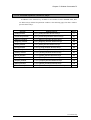
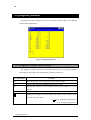
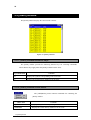
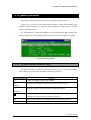
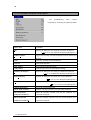
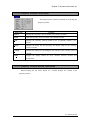
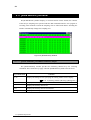
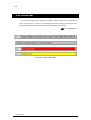
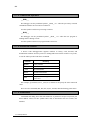
3.4 Specify Starting Options
3.4.1 Specifying Starting Options via Dialog Box
Clicking the mouse on the <Option> button
on the Pset101C tool bar produces
the following dialog box for specifying the C Source Code Debugger/Win starting options.
Pset101C writes these settings to the starting options file (WICE101C.INF), which the
debugger then reads in when loading. The Table below lists the settings provided.
Figure 25. [Option] Dialog Box
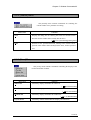
Items
Debug buffer size
Option
-B{nnn}
Macro buffer size
-B,{nnn}
Extension
-E{ext}
Source step mode
-SP
-ST
Tab size
-TAB{n}
Debug info mode
-X
-XC
-SD
Source Path
3.4 Specify Starting Options
Description
Specifies size of buffer for debugging information
(in 16-kilobyte units).
Specifies size of buffer for macro definitions (in 1kilobyte units)
Adds an extension to the list of source file types
displayed in [Code] windows.
Specifies use of software breakpoints for source
single-step execution.
Specifies use of assembler steps for source singlestep execution.
Specifies the tab size for displaying source code in
[Code] windows.
Specifies the assembler debug mode.
Specifies the CC101C compiler debug mode.
Specifies the directories containing the source
files displayed in [Code] windows.
Chapter.3. Using Debugger for First Time 47
3.4.2 Specifying Starting Options via Command Line
C Source Code Debugger/Win starting options are normally specified via the Pset101C
[Options] dialog box. The specified starting options are then automatically added to the
command line generated by clicking on the shortcut. You can, however, also modify these
without using Pset101C. For Windows 95, right-click the mouse on the icon, select
Properties, and edit the [Target] text box. For Windows V3.1, use Program Manager's
[Icon]-[Properties...] command and edit the [Command line] text box on the [Program
Item Properties] dialog box.
C Source Code Debugger/Win supports the following starting options.
-B option
This option specifies the sizes of the two buffers for debugging information and for
macro definitions. The debugging information area holds a wealth of information: global
symbols, local symbols, line numbers, and type information for functions and variables,
for example.
-B[<size D>][,<size M>]
<size D>
Size of the debugging information area (in 16-kilobyte
units). The default is 512 kilobytes.
<size M>
Size of macro definition area (in 1-kilobyte units). The
default is 2 kilobytes.
-D option
This option specifies the current directory for C Source Code Debugger/Win. The
specified directory must contain the environment settings file (PICE101C.ENV) , the
monitor program (MON101C.EX) , and the Windows initialization file (WICE101C.INI) .
[
"3.2.1 Files Necessary for Loading"]
-D<directory>
C Source Code Debugger/Win uses the specified directory as its current directory. If
this option is omitted, the debugger first looks for a directory specified via the [Execution
directory] text box on the [Program Item Properties] dialog box and, if that is empty,
obtains the directory containing the program file from the [Command line] text box.
3.4 Specify Starting Options
48
-E option
This option adds an extension to the list of source file types displayed in [Code]
windows.
-E <extension>
The specified extension becomes the default for displaying source files. Do not include
the period. If this option is omitted, the default list consists of the extensions .C and .ASM.
-S options
These options specify the source single-step execution mode.
-SP
This option specifies the use of software breakpoints for source single-step execution.
(It is the default.)
-ST
This option specifies the use of assembler steps for source single-step execution. If the
default (-SP) fails to produces correct single-step execution, use the -ST option. Note that
the -ST option slows down execution speed.
-SD option
This option specifies the directories containing the source files displayed in [Code]
windows. You can specify more than one directory by delimitting the directories with
semicolons (;).
-SD<directory>
The specified directory becomes the directory with the source files.
For example, enter the following in the icon’s [command line] text box when the source
files exist in the directory, C:¥PANAX¥PRJ.
C:¥WICE101C¥BIN¥WICE101C.EXE –SDC :¥WICE101C¥PRJ
3.4 Specify Starting Options
Chapter.3. Using Debugger for First Time 49
-TAB option
This option specifies the tab size for displaying source code in [Code] windows. Use it
to change the tab size to that used in your editor.
-TAB<tab size>
This option sets the tab size to the specified number. If the option is omitted, the default
is eight.
For example, to set tabs every four columns, enter the following in the icon's
[Command line] text box.
C:¥WICE101C¥BIN¥WICE101C.EXE –TAB4
-X options
These options specify either the assembler or the C debug mode. Using the wrong
specification interferes with proper debugging or limits access to particular functions.
-X
This option specifies assembler debug mode. (It is the default.)
C Source Code Debugger/Win loaded in this mode does not support such C-related
commands as stack backtracing and the display of local variables.
-XC
This option specifies CC101C compiler debug mode.
3.4 Specify Starting Options
50
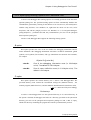
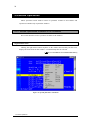
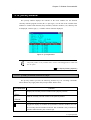
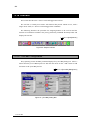
3.5 Load the Debugger
To load C Source Code Debugger/Win, double-click the mouse on the shortcut created with
Pset101C.
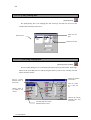
3.5.1 Debugger Loads Normally
If all goes well, C Source Code Debugger/Win starts by displaying a screen similar to
the following.
Figure 26. C Source Code Debugger/Win Starting Screen
3.5 Load the Debugger
Chapter.3. Using Debugger for First Time 51
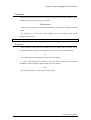
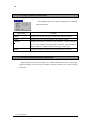
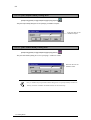
3.5.2 Debugger Does Not Load
If C Source Code Debugger/Win fails to load, however, see Section 8.3 "Error
Messages" for help interpreting the message box that appears.
Figure 30.
Figure 27.
Figure 31.
Figure 28.
Figure 29.
The messages in Figure 27 through Figure 31 indicate that C Source Code Debugger/Win is
unable to read the files necessary for loading. Either copy the necessary files into the working
directory or rerun the environment configuration program (Pset101C).
[
"3.1.1 Load Pset101C", "3.2.1 Files Necessary for Loading"]
Figure 29, for example, reports a problem with the environment settings file (PICE101C.ENV) .
Use Pset101C to edit the model-specific definition file and recreate the file.
[
"3.3 Create Environment Settings File"]
3.5 Load the Debugger
52
3.5 Load the Debugger
Chapter 4.Creating User Program to
Debug
4.1 Convert to ROM
54
4.1 Convert to ROM
C Source Code Debugger/Win supports debugging of programs developed in the C
programming language at the source level. This Chapter outlines the procedure for using
the MN101C00 series C compiler (CC101C) to convert the source files for a user program
into an executable file for loading into C Source Code Debugger/Win.
The compiler produces output designed to run on the target system (that is, may be
converted to ROM). You must therefore specify the ROM and RAM assignments, stack
size, and other parameters to match the target. To modify the setup, rewrite the start-up
routine, link file, and other components following the specifications given in the compiler
manual.
The following describes the procedure for using the MN101C00 series C compiler
(CC101C) to create an executable file (.ex file). As an example, it uses two C source files
sample1.c and sample2.c.
C Source Code Debugger/Win supports all C data constructs: scalars (int, char, etc.),
pointers, arrays, structures, and unions. It supports local variables, global variables, and
static variables.
Compiling
The first step is to create .rf files from the C source files. Always include the compiler's
-g option for including detailed debugging information in the object output. You can also
have the CC101C driver call the assembler by simply specifying the driver's -c option.
>CC101C -c -g sample1.c
>CC101C -c -g sample2.c
Assembling
Use the assembler to convert .asm files to .rf files. If the assembly language file is
startup.asm, for example, the following command produces an object file. The -g is the
debug option.
>AS101C -g startup.asm
4.1 Convert to ROM
Chapter 4. Creating User Program to Debug 55
Linking
The linker links all object files together into a single executable (.ex file). Always
include the -g option to retain the debugging information in the output. The -o option
specifies a name for the output file. The -T options specify starting addresses for the
_TEXT and _DATA sections.
>LD101C -g -j -osample.ex -T_TEXT=4100 -T_DATA=100 startup.rf sample1.rf
sample2.rf
When linking, always include a start-up routine. Microcomputer programs require a startup routine that initializes registers and RAM and then calls main(). For further details, see
the compiler manual.
Loading executable file
The above procedure produces an executable file (sample.ex). Load this user program
into C Source Code Debugger/Win with the load (L) command.
4.1 Convert to ROM
56
4.1 Convert to ROM
Chapter 5. Window Commands
5.1 Screen Layout
5.2 Menus
5.3 Shortcut Keys
5.4 Mouse Operations
5.5 to 5.17 Window Descriptions
5.18 Tool Bar
5.19 Window Bar
5.20 Status Bar
5.21 Dialog Boxes
58
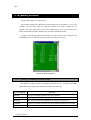
5.1 Screen Layout
This section describes the major structural elements making up the C Source Code
Debugger/Win screen: menus, tool bar, status bar, and debugging windows.
5.1.1 Structural Elements
The figure shows the various window elements.
[Main] window
Menu
Tool bar
Window bar
[Register]
window
[Stack]
window
[Code]
window
[BackTrace]
window
[Inspect]
window
[Break]
window
[Command]
window
[Memo]
window
[Watch]
window
[Trace]
window
[Memory]
window
[Local]
window
[RAM
Monitor]
window
Status bar
Figure 32. Screen Elements
[Main] Window
This is the C Source Code Debugger/Win main window. It includes such features as the
menu bar, tool bar, and status bar.
[Code] Windows
These windows display source code and disassembler output. The program counter
(PC) position is indicated in reverse video; software breakpoints, with underlining. There
are two such windows available.
[Command] Window
This window is for entering dialog commands and displaying execution results using a
traditional TTY interface.
5.1 Screen Layout
Chapter 5. Window Commands 59
[Memory] Window
This window displays memory contents. It is automatically updated when the CPU
stops.
[Register] Window
This window displays the contents of the CPU registers. It is automatically updated
when the CPU stops.
[Stack] Window
This window displays the stack contents. It is automatically updated when the CPU
stops.
[Local] Window
This window displays the contents of the local variables for the C function that the
program counter (PC) is currently accessing. It is automatically updated when the CPU
stops.
[Watch] Window
This window displays the contents of watch data. It is automatically updated when the
CPU stops.
[BackTrace] Window
This window displays the call history for the current C function. It is automatically
updated when the CPU stops.
[Break] Window
This window lists the currently specified breakpoints.
[Memo] Window
This window is a simple editor for taking notes during debugging. C Source Code
Debugger/Win automatically saves the contents at exit.
[Inspect] Window
This window displays the contents of variables for inspection.
[Trace] Window
This window displays a dump of real-time trace memory or disassembler output.
5.1 Screen Layout
60
[RAM Monitor] Window
This window displays a real-time dump of memory while the user program is executing.
5.1.2 Screen Display
Most windows do not allow horizontal scrolling to display data that spills off the right
of the window. To display such data, you must adjust the window size and/or the font size.
The only windows supporting horizontal scrolling are the [Code] and the [Memo]
windows.
When the results of a [Find] command lie in the hidden part of the window, three right
angle brackets (>) appear in the corresponding line. (Figure 33) To display the search
results, adjust the window size and/or the font size and issue the [Search]-[Next] command.
Figure 33. Search Text in Hidden Part of Window
5.1 Screen Layout
Chapter 5. Window Commands 61
5.2 Menus
The menus contain the C Source Code Debugger/Win commands arranged in groups.
Commands either execute immediately or display a dialog box for specifying additional
options.
Menu bar
Light-color items are not available.
Some commands
offer keyboard
shortcuts.
Items with ellipses (...) lead to
dialog boxes.
A check mark (ü) indicates that the
corresponding function is currently
active.
5.2.1 [File] Menu
The [File] menu contains commands related to files. The [Module]
command is only available when a [Code] window or the [Command]
window has the focus.
Menu Item
Load
Function
Displays the dialog box for selecting the user program to load.
[
"5.21.1 [File Open] Dialog Box"]
Reload
Reloads the program being debugged.
Reset
Resets the evaluation chip.
Module
Displays the dialog box for selecting a source code module for the
loaded user program for display in a [Code] window.
[
Exit
"5.21.8 [Module] Dialog Box"]
Terminates C Source Code Debugger/Win execution.
5.2 Menus
62
5.2.2 [Edit] Menu
The [Edit] menu contains commands for passing text
between windows via the Clipboard.
When the [Memo] window has the focus, the [Edit] menu
expands to the menu shown to the left.
Menu Item
Function
Paste
Inserts the Clipboard contents into the current window.
Copy Page
Copies all data from the window to the Clipboard.
Undo
Reverses the results of the last editing command
Cut
Moves the currently selected text to the Clipboard.
Copy
Copies the currently selected text to the Clipboard.
Delete
Deletes the currently selected text.
Clear All
Deletes the entire contents of the [Memo] window.
5.2 Menus
Chapter 5. Window Commands 63
5.2.3 [Search] Menu
The [Search] menu contains commands for searching the
current window for a particular text string.
Menu Item
Find
Function
Displays the dialog box for entering the search text and the search
direction for the window that currently has the focus.
[
Next
"5.21.5 [Find String] Dialog Box"]
Searches in the specified direction, starting at the current cursor
position in the window that currently has the focus, for the specified
text.
5.2.4 [View] Menu
The [View] menu contains commands controlling the display of the
tool bar and other elements.
Menu Item
Status Bar
Function
Alternately displays and hides the status bar.
[
Tool Bar
"5.20 Status Bar"]
Alternately displays and hides the tool bar.
[
Window Bar
Alternately displays and hides the window bar.
[
Flyover Hints
"5.18 Tool Bar"]
"5.19 Window Bar"]
Alternately enables and disables the display of button hints.
5.2 Menus
64
5.2.5 [Run] Menu
The [Run] menu contains commands for starting
and stopping execution of the user program.
The [Come] and [Set Software Break point]
commands are only available when the [Code]
window has the focus.
Menu Item
Go
Function
Resumes execution of the user program from the current program
counter (PC).
Come
Executes the user program from the current program counter (PC)
to the line at the current cursor position.
Single Step
Single-steps execution in units of source lines or machine
language instructions.
Function Step
Function-steps in units of source lines or machine language
instructions.
Until Return
Executes the user program until the current function returns to its
caller.
Set Software
Break
Activates or disables a software breakpoint.
point
Forcible Break
Forcefully terminates execution of the user program, returning
control to C Source Code Debugger/Win. (Interrupts execution of
a repeated command or macro.)
5.2 Menus
Chapter 5. Window Commands 65
5.2.6 Local Menus for Individual Windows
A local menu contains commands available only within the current window. The local
menu for the window that currently has the focus appears on the menu bar. Clicking the
right mouse button on the display also displays the local menu.
[Child(Code)] Menu
The
[Child(Code)]
menu
contains
commands
for
controling [Code] windows.
[
"5.5.2 [Code] Window Local Menu"]
[Child(Command)] Menu
The [Child(Command)] menu contains commands for
controling the [Command] window.
[
"5.6.2 [Command] Window Local Menu"]
5.2 Menus
66
[Child(Memory)] Menu
The [Child(Memory)] menu contains commands for controling
the [Memory] window.
[
"5.7.2 [Memory] Window Local Menu"]
[Child(Register)] Menu
The [Child(Register)] menu contains commands for controling the
[Register] window.
[
"5.8.2 [Register] Window Local Menu"]
[Child(Stack)] Menu
The [Child(Stack)] menu contains commands for controling the
[Stack] window.
[
"5.9.2 [Stack] Window Local Menu"]
[Child(Local)] Menu
The [Child(Local)] menu contains commands for controling
the [Local] window.
[
5.2 Menus
"5.10.2 [Local] Window Local Menu"]
Chapter 5. Window Commands 67
[Child(Watch)] Menu
The [Child(Watch)] menu contains commands for controling
the [Watch] window.
[
"5.12.2 [Watch] Window Local Menu"]
[Child(BTrace)] Menu
The [Child(BTrace)] menu contains commands for controling
the [BackTrace] window.
[
"5.11.2 [BackTrace] Window Local Menu"]
[Child(Break)] Menu
The
[Child(Break)]
menu
contains
commands for controling the [Break] window.
[
"5.13.2 [Break] Window Local Menu"]
[Child(Memo)] Menu
The [Child(Memo)] menu contains commands for controling
the [Memo] window.
[
"5.16.2 [Memo] Window Local Menu"]
5.2 Menus
68
[Inspect] Menu
The [Inspect] menu contains commands for controling the
[Inspect] window.
[
"5.15.2 [Inspect] Window Local Menu"]
[Child(Trace)] Menu
The [Child(Trace)] menu contains commands for controling the
[Trace] window.
[
"5.14.2 [Trace] Window Local Menu"]
[Child(RAM Monitor)] Menu
The [Child(RAM Monitor)] menu contains commands for
controling the [RAM Monitor] window.
[
5.2 Menus
"5.17.2 [RAM Monitor] Window Local Menu"]
Chapter 5. Window Commands 69
5.2.7 [Window] Menu
The [Window] menu contains commands that
operate on windows.
Menu Item
Function
Cascade
Arranges all windows not reduced to icons so that they overlap.
Tile
Arranges all windows not reduced to icons so that they divide up
the display area. (C Source Code Debugger/Win picks the
positions.)
Arrange Icons
Aligns the windows reduced to icons.
User1
Restores the window layout to that stored with the [User Save][User1] command.
User2
Restores the window layout to that stored with the [User Save][User2] command.
User3
Restores the window layout to that stored with the [User Save][User3] command.
User Save
Saves current window layout.
5.2 Menus
70
5.2.8 [Options] Menu
The [Options] menu contains commands for configuring C
Source Code Debugger/Win.
Menu Item
Select Color
Function
Displays the dialog box for changing the background and text colors
for windows.
Custm ToolBar
"5.21.4 [Color] Dialog Box"]
Displays the dialog box for modifying the button layout on the tool
bar.
Font Select
[
[
"5.21.3 [Tool Bar] Dialog Box"]
Displays the dialog box for changing the font, font style, and font
size for text in the window that currently has the focus.
[
Option Set
"5.21.2 [Font] Dialog Box"]
Displays the dialog box for modifying other C Source Code
Debugger/Win settings.
Resize Window
Adjusts the sizes of all child windows to the size of the [Main]
window.
5.2.9 [Help] Menu
The [Help] menu contains commands for
accessing the help system.
Menu Item
Help Contents
Function
Displays the table of contents for C Source Code
Debugger/Win help.
Keyword Search
Searches the C Source Code Debugger/Win on-line help by
keyword.
Help on help
Displays a help file for the Windows help system.
About C Source Code
Displays
Debugger
Debugger/Win.
5.2 Menus
a
brief
screen
describing
C
Source
Code
Chapter 5. Window Commands 71
5.3 Shortcut Keys
Shortcut keys are key combinations defined for the most frequently run C Source Code
Debugger/Win commands.
5.3.1 Shortcut Keys Available in All Windows
The following shortcut keys are common to all windows.
Key Combination
F1
Function
Duplicates the action of the <Maximize>/<Restore> button, switching
the window that currently has the focus between its maximum and
original sizes. Note that the [Code] and [Command] windows use this
key for different commands.
F2
Sends the active window to the rear and makes the next window
CTRL+O
active.
CTRL+B
Makes the previous window active. (Reverse of F2 and Ctrl+O)
F4
Displays the dialog box for entering the search text and the search
CTRL+Q F
direction for the window that currently has the focus.
[
F5
"5.21.5 [Find String] Dialog Box"]
Runs the user program from the current program counter (PC)
position.
F8
Single-steps execution of the user program.
F10
Function-steps through the user program.
CTRL+C
Scrolls the screen upward by one screen.
Page Down
CTRL+D
Moves the cursor one character position to the right.
®
CTRL+E
Moves the cursor one line upward.
CTRL+L
Searches in the specified direction, starting at the current cursor
position in the window that currently has the focus, for the next
occurrence of the text specified with F4.
CTRL+R
Scrolls the screen downward by one screen.
-Up
CTRL+S,
¬
Moves the cursor one character position to the left.
5.3 Shortcut Keys
72
CTRL+X
Moves the cursor one line downward.
¯
CTRL+INS
Copies the contents of the window that currently has the focus to the
Clipboard.
CTRL+Alt+F1
Alternately reduces [Code] window 0 to an icon and restores the
CTRL+Alt+0
window.
CTRL+Alt+F2
Alternately reduces the [Command] window to an icon and restores
CTRL+Alt+C
the window.
CTRL+Alt+F3
Alternately reduces the [Watch] window to an icon and restores the
CTRL+Alt+W
window.
CTRL+Alt+F4
Alternately reduces the [Memory] window to an icon and restores the
CTRL+Alt+M
window.
CTRL+Alt+F5
Alternately reduces the [Register] window to an icon and restores the
CTRL+Alt+R
window.
CTRL+Alt+F6
Alternately reduces the [Stack] window to an icon and restores the
CTRL+Alt+S
window.
CTRL+Alt+F7
Alternately reduces the [Local] window to an icon and restores the
CTRL+Alt+L
window.
CTRL+Alt+F8
Alternately reduces the [BackTrace] window to an icon and restores
CTRL+Alt+T
the window.
CTRL+Alt+F9
Alternately reduces the [Break] window to an icon and restores the
CTRL+Alt+B
window.
CTRL+Alt+F10
Alternately reduces the [Memo] window to an icon and restores the
CTRL+Alt+E
window.
CTRL+1
Restores the screen to user layout 1.
CTRL+2
Restores the screen to user layout 2.
CTRL+3
Restores the screen to user layout 3.
Alt+F10
Displays the local menu for the window that currently has the focus.
5.3 Shortcut Keys
Chapter 5. Window Commands 73
5.3.2 Window-Specific Shortcut Keys
In addition to the shortcut keys available in all windows listed in Section 5.3.1, there
are shortcut keys defined for particular windows. The following pages list these windowspecific shortcut keys.
Window
Related Section
Page
[Code] window
5.5.1 [Code] Window Shortcut Keys
77
[Command] window
5.6.1 [Command] Window Shortcut Keys
81
[Memory] window
5.7.1 [Memory] Window Shortcut Keys
84
[Register] window
5.8.1 [Register] Window Shortcut Keys
86
[Stack] window
5.9.1 [Stack] Window Shortcut Keys
88
[Local] window
5.10.1 [Local] Window Shortcut Keys
89
[BackTrace] window
5.11.1 [BackTrace] Window Shortcut Keys
91
[Watch] window
5.12.1 [Watch] Window Shortcut Keys
93
[Break] window
5.13.1 [Break] Window Shortcut Keys
95
[Trace] window
5.14.1 [Trace] Window Shortcut Keys
98
[Inspect] window
5.15.1 [Inspect] Window Shortcut Keys
100
[Memo] window
5.16.1 [Memo] Window Shortcut Keys
102
[RAM Monitor] window
5.17.1 [RAM Monitor] Window Shortcut Keys
104
5.3 Shortcut Keys
74
5.4 Mouse Operations
Mouse operations inside window consist of operations common to all windows and
operations available only in particular windows.
5.4.1 Mouse Operations Available in All Windows
This section describes mouse operations available in all windows.
Right button click
Clicking the right mouse button anywhere in the window that currently has the focus
displays the local menu for that window. A command may then be selected.
[
"5.2.6 Local Menus for Individual Windows"]
Figure 34. [Code] Window Local Menu
5.4 Mouse Operations
Chapter 5. Window Commands 75
Left button drag
Holding down the left mouse button and dragging the mouse across the text defines an
area that appears in reverse. Releasing the left button copies the currently selected area to
the Clipboard.
selected area
Figure 35. Selecting a Region to Copy
Dragging means moving the mouse with a button pressed.
5.4.2 Window-Specific Mouse Operations
In addition to the mouse operations available in all windows listed in Section 5.4.1,
there are mouse operations available only in particular windows. The following pages list
these window-specific mouse operations.
Window
Related Section
Page
[Code] window
5.5.3 [Code] Window Mouse Operations
80
[Memory] window
5.7.3 [Memory] Window Mouse Operations
85
[Register] window
5.8.3 [Register] Window Mouse Operations
87
[Local] window
5.10.3 [Local] Window Mouse Operations
90
[BackTrace] window
5.11.3 [BackTrace] Window Mouse Operations
92
[Watch] window
5.12.3 [Watch] Window Mouse Operations
94
[Break] window
5.13.3 [Break] Window Mouse Operations
97
[Inspect] window
5.15.3 [Inspect] Window Mouse Operations
101
5.4 Mouse Operations
76
5.5 [Code] Window
A [Code] window displays the source code either alone or mixed with assembler. There
are two [Code] windows. They support a variety of display configurations.
Program
counter
(PC)
Breakpoint
Figure 36. [Code] Window
5.5 [Code] Window
Chapter 5. Window Commands 77
5.5.1 [Code] Window Shortcut Keys
The [Code] windows provide the following shortcut keys for executing commands.
These shortcut keys apply when a [Code] window has the focus.
Key
Function
Dialog command
Combination
F1
Displays the dialog box for selecting a source code module
for the loaded user program for display in a [Code] window.
[
F3
"5.21.8 [Module] Dialog Box"]
Toggles the [Code] window display between source code and V command,
disassembler output. The display is always centered on the U command
line currently containing the program counter (PC).
F6
Inspects the currently selected variable.
INS command
CTRL+F6
CTRL+I
F7
Runs the user program from the current program counter
(PC) to the current cursor position.
F9
Creates/removes a software breakpoint at the current cursor BP command
position.
CTRL+F1
Duplicates the action of the <Maximize>/<Restore> button,
switching the [Code] window between its maximum and
original sizes.
CTRL+F2
Shifts the focus to the next window.
CTRL+F3
Toggles the [Code] window display between source code and V command,
disassembler output. The display is always centered on the U command
line currently containing the program counter (PC).
CTRL+F4
Searches for the previously specified text in the previously
CTRL+L
specified direction from the current cursor position.
CTRL+F5
Executes the user program until the current function returns G command
to its caller.
CTRL+F7
Adds the currently selected variable to the [Watch] window.
W command
CTRL+W
5.5 [Code] Window
78
CTRL+F8
Views the currently selected variable in the [Command] VAL command,
CTRL+V
window.
CTRL+F9
Inserts the text at the current cursor position in the
CTRL+G
[Command] window.
CTRL+F1
Copies the text at the current cursor position to the
0
Clipboard.
? command
CTRL+Q L Displays the dialog box for specifying the line number or V command,
address to display.
CTRL+QR
Displays the start of the source code.
CTRL+QC
Displays the end of the source code.
U command
CTRL+Q J Returns windows to the starting layout.
CTRL+Q
Displays the line currently containing the program counter
P
(PC).
CTRL+F
For the source code display, moves the cursor to the next
word. For the disassembler output display, moves the
cursor in the order address -> code -> mnemonic.
CTRL+A
For the source code display, moves the cursor to the
previous word.
The [Code] window also supports the shifted key combinations given in Section 5.6.1
"[Command] Window Shortcut Keys."
5.5 [Code] Window
Chapter 5. Window Commands 79
5.5.2 [Code] Window Local Menu
The [Child(Code)] menu contains commands for
controling [Code] windows.
Menu item
Inspect
Function
Displays the currently selected variable in the [Inspect] window. If the
text at the current cursor position is not a variable that can be
inspected, the [Set Inspect data] dialog box appears instead.
[
Watch
"5.21.6 [Set Inspect data] Dialog Box"]
Adds the currently selected variable to the [Watch] window. If the
text at the current cursor position is not a variable that can be
watched, the [Set Watch data] dialog box appears instead.
[
Come
"5.21.7 [Set Watch data] Dialog Box"]
Runs the user program from the current program counter (PC) to the
current cursor position.
Disassemble/
Toggles the window display between source code and disassembler
Source
output.
Module
Displays the dialog box for selecting a source code module for the
loaded user program for display in a [Code] window.
[
"5.21.8 [Module] Dialog Box"]
Line no/
Displays the dialog box for specifying the starting line number
Address
(source code) or starting address (disassembler output).
[
"5.21.9 [Set line no.] Dialog Box","5.21.10 [Addressing
(Code/RAM Monitor)] Dialog Box"]
Top
Displays the start of the source code.
Bottom
Displays the end of the source code.
PC Location
Displays the current program counter (PC) position.
5.5 [Code] Window
80
File Focus
Checking this item while the file currently containing the program counter
(PC) is displayed causes the focus to switch back and forth between the two
[Code] windows whenever the program counter (PC) leaves or enters the
file.
Function Focus
Checking this item while the function currently containing the program
counter (PC) is displayed causes the focus to switch back and forth between
the two [Code] windows whenever the program counter (PC) leaves or
enters the function.
Flip
Checking this item causes the focus to switch back and forth between the
two [Code] windows whenever the program counter (PC) enters or leaves a
function.
The file lock, function lock, and flip commands are only available when both [Code]
windows are displayed.
5.5.3 [Code] Window Mouse Operations
The [Code] window provides mouse equivalents for the following commonly used
commands.
Function
Inspect
Mouse Operation
Left double-click the mouse on
Dialog Command
INS command
variable
Software breakpoint
Left click the mouse on line
BP command
number or address
Single-step execution
Shift+left click
T command
Function -step execution
Shift+right click
P command
[Run] menu
Ctrl+right click
5.5 [Code] Window
Chapter 5. Window Commands 81
5.6 [Command] Window
The [Command] window is for entering dialog commands and displaying execution
results using a traditional TTY interface.
For further details on dialog commands entered via the [Command] window, see
Chapters 6 and 7 and the on-line help.
Figure 37. [Command] Window
5.6.1 [Command] Window Shortcut Keys
The [Command] window provides the following shortcut keys for executing commands.
These shortcut keys apply when the [Command] window has the focus.
Key Combination
Function
SHIFT+F1
Copies one character from the immediately preceding command. (C1)
SHIFT+F2
Displays the dialog box for selecting from previously entered commands.
[
SHIFT+F3
"5.21.11 [Command History] Dialog Box"]
Copies all characters beyond the current cursor position from the immediately
preceding command. (CA)
SHIFT+F4
Moves the cursor to the beginning of the command line. (Ln Top)
CTRL+A
SHIFT+F5
Moves the cursor to the end of the command line. (Ln Bot)
CTRL+F
5.6 [Command] Window
82
SHIFT+F6
Displays a dialog box listing command lines formed by completing the
current partial command line with all global symbols starting with the word at
the end of the command line.
[
SHIFT+F7
"5.21.12 [Expand Symbol] Dialog Box"】
Clears the command line.
CTRL+U
SHIFT+F8
Clears the command line and the command history
BS
Deletes the character to the left of the cursor.
CTRL+H
¬
Moves the cursor one character to the left.
SHIFT+¬
CTRL+S
®
Moves the cursor one character to the right.
SHIFT+®
CTRL+D
DEL
Deletes the character at the current cursor position.
CTRL+G
INS
Toggles between the insert and overwrite modes.
CTRL+V
SHIFT+-
Scrolls backward through the command history starting with the most recent
CTRL+W
command. If there is text on the command line, only commands beginning
with that text are displayed.
SHIFT+¯
Scrolls forward through the command history starting with the oldest
command. If there is text on the command line, only commands beginning
with that text are displayed.
SHIFT+INS
Inserts the text from the Clipboard on the command line.
The [Command] window supports most of the same function keys and Ctrl+function key
combinations as the [Code] window. The only exceptions are the commands related to
cursor movement.
[
5.6 [Command] Window
"5.5.1 [Code] Window Shortcut Keys"]
Chapter 5. Window Commands 83
5.6.2 [Command] Window Local Menu
The [Child(Command)] menu contains commands for
controling the [Command] window.
Menu Item
Function
Load
Displays the dialog box for selecting the user program to load.
Reload
Reloads the program being debugged.
Reset
Resets the evaluation chip.
Paste
Inserts the Clipboard contents into the current window.
History
Displays the dialog box for selecting from previously entered
commands.
[
Exp. Sym
"5.21.11 [Command History] Dialog Box"]
Displays a dialog box listing command lines formed by completing the
current partial command line with all global symbols starting with the
word at the end of the command line.
[
"5.21.12 [Expand Symbol] Dialog Box"]
5.6 [Command] Window
84
5.7 [Memory] Window
The [Memory] window displays the contents of memory in various formats.
Figure 38. [Memory] Window
5.7.1 [Memory] Window Shortcut Keys
The [Memory] window provides the following shortcut keys for executing commands.
These shortcut keys apply when the [Memory] window has the focus.
Key Combination
F7
Function
Displays the dialog box for specifying the starting address for the display.
A
[
F6
Displays the dialog box for modifying data.
"5.21.13 [Addressing(Memory)] Dialog Box"]
E
[
B
Displays the memory data in bytes.
W
Displays the memory data in words.
D
Displays the memory data in double words.
S,F
Displays the memory data in short floats.
L
Displays the memory data in long floats.
C
Displays the memory data in ASCII.
6,H
Displays the memory data in hexadecimal.
1
Displays the memory data in decimal.
5.7 [Memory] Window
"5.21.14 [Set Data] Dialog Box"]
Chapter 5. Window Commands 85
5.7.2 [Memory] Window Local Menu
The
[Child(Memory)]
menu
contains
commands
for
controling the [Memory] window.
Menu Item
Function
Byte
Displays the memory data in bytes.
Word
Displays the memory data in words.
Double word
Displays the memory data in double words.
Short Floats
Displays the memory data in short floats.
Long Floats
Displays the memory data in long floats.
Char(ASCII)
Displays the memory data in ASCII.
Hexadecimal
Displays the memory data in hexadecimal.
Decimal
Displays the memory data in decimal.
Address Set
Displays the dialog box for specifying the starting address for the
display.
[
Edit data
"5.21.13 [Addressing(Memory)] Dialog Box"]
Displays the dialog box for modifying data.
[
"5.21.14 [Set Data] Dialog Box"]
5.7.3 [Memory] Window Mouse Operations
Double-clicking the left mouse button on the data portion of the window displays a
dialog box for modifying the data.
[
"5.21.14 [Set Data] Dialog Box"]
5.7 [Memory] Window
86
5.8 [Register] Window
The [Register] window displays the contents of registers and CPU flags. It also displays
register-related information.
Figure 39. [Register] Window
5.8.1 [Register] Window Shortcut Keys
The [Register] window provides the following shortcut keys for executing commands.
These shortcut keys apply when the [Register] window has the focus.
Key Combination
Function
F3
Zeros the register or CPU flag at the current cursor position.
F6
Displays the symbol corresponding to the register value.
F7
Displays the contents of the memory location whose address is in the
register.
F9
Displays the register contents in decimal.
Displays the dialog box for modifying the register at the current cursor
position or the CPU flags.
[
"5.21.15 [Register] Dialog Box,"
"5.21.16 [Flags] Dialog Box"]
5.8 [Register] Window
Chapter 5. Window Commands 87
5.8.2 [Register] Window Local Menu
The [Child(Register)] menu contains commands for controling the
[Register] window.
Menu Item
Function
Zero
Zeros the register at the current cursor position.
Increment
Increments the register at the current cursor position.
Decrement
Decrements the register at the current cursor position.
Change
Displays the dialog box for modifying the register at the current cursor
position or CPU flags.
[
"5.21.15 [Register] Dialog Box,"
"5.21.16 [Flags] Dialog Box"]
Decimal
Toggles the register display between decimal and hexadecimal
formats.
Symbol
Displays the symbol corresponding to the register value.
Memory
Toggles the display of the contents of the memory location whose
address is in the register.
5.8.3 [Register] Window Mouse Operations
Double-clicking the left mouse button on a register or CPU flag displays a dialog box
for modifying the contents.
[
"5.21.15 [Register] Dialog Box," "5.21.16 [Flags] Dialog Box"]
5.8 [Register] Window
88
5.9 [Stack] Window
The [Stack] window displays the current stack contents.
Figure 40. [Stack] Window
5.9.1 [Stack] Window Shortcut Keys
The [Stack] window provides the following shortcut keys for executing commands.
These shortcut keys apply when the [Stack] window has the focus.
Key Combination
Function
F6
Displays the symbols corresponding to the stack data.
F7
Displays the actual memory addresses for the stack.
5.9.2 [Stack] Window Local Menu
The [Child(Stack)] menu contains commands for controling the
[Stack] window.
Menu Item
Function
Symbols
Displays the symbols corresponding to the stack data.
Addresses
Displays the actual memory addresses for the stack.
5.9 [Stack] Window
Chapter 5. Window Commands 89
5.10 [Local] Window
The [Local] window displays the contents of the local variables for the function
currently with the program counter (PC). A plus sign (+) to the left of the variable name
indicates a variable with elements (array members, structure members, etc.) that may also
be displayed; a minus sign (-), a variable with its elements displayed.
Figure 41. [Local] Window
The [Local] window is only available when C Source Code Debugger/Win is loaded with
the -XC option.
[
"3.4 Specify Starting Options"]
5.10.1 [Local] Window Shortcut Keys
The [Local] window provides the following shortcut keys for executing commands.
These shortcut keys apply when the [Local] window has the focus.
Key Combination
F6
Function
Displays the currently selected variable in the [Inspect] window.
CTRL+I
F7
Adds the currently selected variable to the [Watch] window.
CTRL+W
F9
Toggles the display of offsets for the local variables on and off.
Toggles the display of elements (array members, structure members, etc.) for
the currently selected variable on and off. This command is only available for
variables marked with a plus or minus sign.
5.10 [Local] Window
90
5.10.2 [Local] Window Local Menu
The [Child(Local)] menu contains commands for controling
the [Local] window.
Menu Item
Function
Inspect
Displays the currently selected variable in the [Inspect] window.
Watch
Adds the currently selected variable to the [Watch] window.
Element
Toggles the display of elements (array members, structure members,
etc.) for the currently selected variable on and off. This command is
only available for variables marked with a plus or minus sign.
Offset
Toggles the display of offsets for the local variables on and off.
5.10.3 [Local] Window Mouse Operations
Double-clicking the left mouse button on a variable marked with a plus or minus sign
toggles the display of elements (array members, structure members, etc.) for that variable
on and off.
5.10 [Local] Window
Chapter 5. Window Commands 91
5.11 [BackTrace] Window
The [BackTrace] window traces the call hierarchy from the current function back to
main().
Figure 42. [BackTrace] Window
The [BackTrace] window is only available when C Source Code Debugger/Win is loaded
with the -XC option.
[
"3.4 Specify Starting Options"]
5.11.1 [BackTrace] Window Shortcut Keys
The [BackTrace] window provides the following shortcut keys for executing commands.
These shortcut keys apply when the [BackTrace] window has the focus.
Key Combination
Function
F6
Displays, in a [Code] window, the source code for the line at the current
CTRL+I
cursor position.
F7
Toggles the display of symbols in the window on and off.
F9
Toggles the display of source files and line numbers for symbols in the
window on and off.
5.11 [BackTrace] Window
92
5.11.2 [BackTrace] Window Local Menu
The [Child(BackTrace)] menu contains commands for
controling the [BackTrace] window.
Menu Item
Inspect
Function
Displays, in a [Code] window, the source code for the line at the
current cursor position.
Source
Toggles the display of source file names and line numbers for symbols
in the window on and off.
Address
Toggles the display of addresses on and off.
5.11.3 [BackTrace] Window Mouse Operations
Double-clicking the left mouse button on the [BackTrace] window displays the source
code for that line in a [Code] window.
5.11 [BackTrace] Window
Chapter 5. Window Commands 93
5.12 [Watch] Window
The [Watch] window displays the contents of specified variables (max. 16).
A plus sign (+) to the left of the variable name indicates a variable with elements (array
members, structure members, etc.) that may also be displayed; a minus sign (-), a variable
with its elements displayed.
If a watch address is within the sampling area specified with the SM command, the
window displays the corresponding variable in real time while the program is executing.
Figure 43. [Watch] Window
5.12.1 [Watch] Window Shortcut Keys
The [Watch] window provides the following shortcut keys for executing commands.
These shortcut keys apply when the [Watch] window has the focus.
Key Combination
Function
F3
Clears the [Watch] window of all variables.
F6
Displays the currently selected variable in the [Inspect] window.
CTRL+I
F7
Adds the currently selected variable to the [Watch] window.
CTRL+W
Toggles the display of the variables with elements (the variables with a plus
or minus sign on the left of their names) on and off.
INS
Displays the dialog box for adding variables to the [Watch] window.
DEL
Deletes the currently selected variable from the [Watch] window.
5.12 [Watch] Window
94
5.12.2 [Watch] Window Local Menu
The [Child(Watch)] menu contains commands for controling
the [Watch] window.
Menu Item
Function
Inspect
Displays the currently selected variable in the [Inspect] window.
Watch
Adds the currently selected variable to the [Watch] window.
Element
Toggles the display of contents of the local variables with elements
(array members, structure members, etc.) on and off.
Add
Displays the dialog box for adding variables to the [Watch] window.
Clear
Deletes the currently selected variable from the [Watch] window.
All Clear
Clears the [Watch] window of all variables.
5.12.3 [Watch] Window Mouse Operations
Double-clicking the left mouse button on a variable marked with a plus or minus sign
toggles the display of elements (array members, structure members, etc.) for that variable
on and off.
5.12 [Watch] Window
Chapter 5. Window Commands 95
5.13 [Break] Window
The [Break] window displays the currently registered breakpoints (max. 16).
Figure 44. [Break] Window
5.13.1 [Break] Window Shortcut Keys
The [Break] window provides the following shortcut keys for executing commands.
These shortcut keys apply when the [Break] window has the focus
Key Combination
Function
F3
Clears all breakpoints.
F4
Saves current breakpoint settings.
F6
Loads the previously saved breakpoint settings.
F7
Displays the dialog box for setting up a hardware breakpoint.
[
"5.21.18 [Hardware Breakpoint] Dialog Box"]
F9
Toggles the currently selected breakpoint between enabled and disabled.
INS
Displays the dialog box for setting up a software breakpoint.
[
DEL
"5.21.19 [Set Software Breakpoint] Dialog Box"]
Clears the currently selected breakpoint.
5.13 [Break] Window
96
5.13.2 [Break] Window Local Menu
The
[Child(Break)]
menu
contains
commands for controling the [Break] window.
Menu Item
Add
Function
Displays the dialog box for setting up a software breakpoint.
"5.21.19 [Set Software Breakpoint] Dialog Box"]
[
Disable /Enable
Toggles the currently selected breakpoint between enabled and
disabled.
Clear
Clears the currently selected breakpoint.
Clear All
Clears all breakpoints.
Save Setting
Saves current breakpoint settings.
Load Setting
Loads the previously saved breakpoint settings.
Hardware breakpoint
Displays the dialog box for setting up a hardware breakpoint.
[
Area breakpoint
"5.21.18 [Hardware Breakpoint] Dialog Box"]
Displays the dialog box for setting area event conditions.
[
Area events
"5.21.22 [Area Breakpoint] Dialog Box"]
Displays the dialog box for managing area events.
[
"5.21.21 [Area Events] Dialog Box"]
External breakpoint
Sets up an external breakpoint.
Add to AND condition
Adds the currently selected event to the AND condition.
Make sequential
Makes the currently selected event the first condition for a
breakpoint condition 1
sequential breakpoint.
Makes sequential
Make the currently selected event the second condition for a
breakpoint condition 2
sequential breakpoint.
5.13 [Break] Window
Chapter 5. Window Commands 97
5.13.3 [Break] Window Mouse Operations
Double-clicking the left mouse button on a breakpoint toggles it between enabled and
disabled.
5.13 [Break] Window
98
5.14 [Trace] Window
The [Trace] window displays either a hexadecimal dump of the real-time trace memory or the
disassembler output.
Figure 45. [Trace] Window
Figure 46. [Trace] Window
(Disassembler Output)
(Dump Display)
5.14.1 [Trace] Window Shortcut Keys
The [Trace] window provides the following shortcut keys for executing commands.
These shortcut keys apply when the [Trace] window has the focus.
Key Combination
F3
Function
Toggles the display format between assembly language and hexadecimal
dump.
F6
Displays the dialog box for specifying the starting frame number for the trace
buffer display.
[
F7
"5.21.20 [Jump Frame no.] Dialog Box"]
Toggles the real-time trace function on and off while the user program is
executing.
F9
Displays the dialog box for specifying real-time trace events.
[
"5.21.17 [Event] Dialog Box"]
Ctrl+Q R
Displays the start of the trace window contents.
Ctrl+Q C
Displays the end of the trace window contents.
5.14 [Trace] Window
Chapter 5. Window Commands 99
5.14.2 [Trace] Window Local Menu
The [Child(Trace)] menu contains commands for controling the
[Trace] window.
Menu Item
Function
Disassemble/
Toggles the display format between assembly language and
Dump
hexadecimal dump.
Jump
Displays the dialog box for specifying the starting frame number for
the trace buffer display.
[
"5.21.20 [Jump Frame no.] Dialog Box"]
Top
Displays the start of the trace window contents.
Bottom
Displays the end of the trace window contents.
Trace Go/
Toggles the real-time trace function on and off while the user program
Trace Stop
is executing.
Event
Displays the dialog box for specifying real-time trace events.
[
Area events
"5.21.17 [Event] Dialog Box"]
Displays the dialog box for managing area events.
5.14 [Trace] Window
100
5.15 [Inspect] Window
The [Inspect] window displays the specified variables (max. 16) in a format appropriate
for the data structure.
Figure 47. [Inspect] Window
5.15.1 [Inspect] Window Shortcut Keys
The [Inspect] window provides the following shortcut keys for executing commands.
These shortcut keys apply when the [Inspect] window has the focus.
Key Combination
F5
Function
Toggles the display format for array variables between decimal and
hexadecimal.
F6
Displays the currently selected variable in the [Inspect] window.
I
CTRL+I
F7
Adds the currently selected variable to the [Watch] window.
W
CTRL+W
F8
Displays the currently selected variable in the [Command] window's view
V
format.
CTRL+V
F9
Displays the dialog box for specifying the display range for the currently
R
selected variable.
F10
Displays the dialog box for modifying the contents of the currently selected
C
variable.
5.15 [Inspect] Window
Chapter 5. Window Commands 101
5.15.2 [Inspect] Window Local Menu
The [Inspect] menu contains commands for controling the
[Inspect] window.
Menu Item
Function
Inspect
Displays the currently selected variable in the [Inspect] window.
Watch
Adds the currently selected variable to the [Watch] window.
View
Displays the currently selected variable in the [Command] window's view
format.
Range
Displays the dialog box for specifying the display range for the currently
selected variable.
Change
Displays the dialog box for modifying the contents of the currently selected
variable.
Radix
Toggles the display format for array variables between decimal and
hexadecimal.
5.15.3 [Inspect] Window Mouse Operations
Double-clicking the left mouse button on a variable displays the variable in the
[Inspect] window.
5.15 [Inspect] Window
102
5.16 [Memo] Window
The [Memo] window is a simple editor.
This window supports the Clipboard for moving data between windows, so you can, for
example, copy the values from the [Register] window here before running the user
program, copy them again after a break, and compare the two sets. You can also edit a
macro in the [Memo] window and then copy it to the [Command] window.
C Source Code Debugger/Win automatically saves the contents of this window to the
file MEMO.PT at exit and reads them back in the next time that it loads.
Figure 48. [Memo] Window
5.16.1 [Memo] Window Shortcut Keys
The [Memo] window provides the following shortcut keys for executing commands.
These shortcut keys apply when the [Memo] window has the focus.
Key Combination
Function
Ctrl+Ins
Copies the currently selected text to the Clipboard.
Ctrl+Del
Deletes the entire contents of the [Memo] window.
Shift+Ins
Inserts the text from the Clipboard at the current cursor position.
Shift+Del
Copies the currently selected text to the Clipboard and deletes the original.
Alt+BS
Reverses the results of the last editing command.
5.16 [Memo] Window
Chapter 5. Window Commands 103
5.16.2 [Memo] Window Local Menu
The [Child(Memo)] menu contains commands for controling
the [Memo] window.
Menu Item
Function
Paste
Inserts the text from the Clipboard at the current cursor position.
Undo
Reverses the results of the last editing command.
Cut
Copies the currently selected text to the Clipboard and deletes the
original.
Copy
Copies the currently selected text to the Clipboard.
Delete
Deletes the currently selected text.
Clear All
Deletes the entire contents of the [Memo] window.
5.16 [Memo] Window
104
5.17 [RAM Monitor] Window
The [RAM Monitor] window displays, in real time and in various formats, the contents
of the 64-byte sampling area specified with the SM command while the user program is
executing. Data locations outside the sampling area are filled with dashes. Scrolling the
window automatically changes the sampling area.
Figure 49. [RAM Monitor] Window
5.17.1 [RAM Monitor] Window Shortcut Keys
The [RAM Monitor] window provides the following shortcut keys for executing
commands. These shortcut keys apply when the [RAM Monitor] window has the focus
Key Combination
F7, A
Function
Displays the dialog box for specifying the starting address for the display.
[
"5.21.13 [Starting Address (Memory)] Dialog Box"]
B
Displays the memory data in bytes.
I
Displays the memory data in bits.
6, H
Displays the memory data in hexadecimal.
1
Displays the memory data in decimal.
5.17 [RAM Monitor] Window
Chapter 5. Window Commands 105
5.17.2 [RAM Monitor] Window Local Menu
The [Child(RAM Monitor)] menu contains commands for
controling the [RAM Monitor] window.
Menu Item
Function
Bit
Displays the memory data in bits.
Byte
Displays the memory data in bytes.
Hexadecimal
Displays the memory data in hexadecimal.
Decimal
Displays the memory data in decimal.
Address
Displays the dialog box for specifying the starting address for the display.
[
Zoom in/out
"5.21.13 [Addressing(Memory)] Dialog Box"]
Displays the all memory datas or 32byte datas.
5.17 [RAM Monitor] Window
106
5.18 Tool Bar
This section describes the C Source Code Debugger/Win tool bar.
The tool bar is a handy new feature with buttons that provide instant access, with a
single mouse click, to C Source Code Debugger/Win commands.
The following describes the procedure for assigning buttons to the tool bar and the
function of each button available. The [View]-[Tool Bar] command alternately hides and
displays the tool bar.
[
"5.2.4 [View] Menu"]
Figure 50. Sample Tool Bar
5.18.1 Tool Bar Configuration
The [Options]-[Custm ToolBar] command displays the [Tool Bar] dialog box. Select a
button from the [List of Button] list box and click the mouse on the <Add> button to add
the button to the [Tool Bar] list box.
[
Figure 51. [Tool Bar] Dialog Box
5.18 Tool Bar
"5.21.3 [Tool Bar] Dialog Box"]
Chapter 5. Window Commands 107
5.18.2 Button Functions
The following is a list of the buttons available for assignment to the tool bar and their
functions.
Button Function
Loads the user program to be debugged.
[
"5.21.1 [File Open] Dialog Box"]
Reloads the currently loaded program.
Resets the evaluation chip.
Runs the user program from the current program counter (PC) position.
Single-steps execution in source line units or machine language instruction units.
Function-steps execution in source line units or machine language instruction units.
Executes the user program until the current function returns to its caller.
Forcefully terminates execution of the user program, returning control to C Source Code
Debugger/Win. (Interrupts execution of a repeated command or macro.)
Adds the currently selected variable to the [Watch] window. If the text at the current
cursor position is not a variable that can be watched, the [Add to Watch] dialog box
appears instead.
[
"5.21.7 [Set Watch data] Dialog Box"]
Displays the currently selected variable in the [Inspect] window. If the text at the current
cursor position is not a variable that can be inspected, the [Add to Inspect] dialog box
appears instead.
[
"5.21.6 [Set Inspect data] Dialog Box"]
Alternately enables and disables the display of button hints that appear on the status line
when the mouse cursor passes over buttons.
Switches the tool bar display position.
Displays the dialog box for changing the background and text colors for windows.
[
"5.21.4 [Color] Dialog Box "]
Displays the dialog box for changing the font, font style, and font size for text in the
window that currently has the focus.
[
"5.21.2 [Font] Dialog Box"]
Displays the dialog box for entering the search text and the search direction for the
window that currently has the focus.
[
"5.21.5 [Find String] Dialog Box"]
Searches in the specified direction, starting at the current cursor position in the window
that currently has the focus, for the specified text.
Displays the dialog box for selecting a source code module for the loaded user program
for display in a [Code] window.
[
"5.21.8 [Module] Dialog Box"]
5.18 Tool Bar
108
Restores window layout #1.
Restores window layout #2.
Restores window layout #3.
Arranges all windows not reduced to icons so that they overlap.
Arranges all windows not reduced to icons so that they divide up the display area. (C
Source Code Debugger/Win picks the positions.)
Inserts the text from the Clipboard at the current cursor position in the window that
currently has the focus.
Copies the currently selected text in the window that currently has the focus to the
Clipboard.
Displays the dialog box for modifying the button layout on the tool bar.
[
"5.21.3 [Tool Bar] Dialog Box"]
Adjusts the sizes of all child windows to the size of the [Main] window.
Toggles the [Code] window display format between assembly language and hexadecimal
dump.
Displays C Source Code Debugger/Win help.
Exits C Source Code Debugger/Win.
5.18 Tool Bar
Chapter 5. Window Commands 109
5.19 Window Bar
This section describes the C Source Code Debugger/Win window bar. The window bar
is for rapidly switching between C Source Code Debugger/Win windows. The [View][Window Bar] command alternately hides and displays the window bar. The following
lists the window for each button. The button settings on the window bar cannot be
changed.
[
"5.2.4 [View] Menu"]
Figure 52. Window Bar
Button
Window
[Code] window 0
[Command] window
[Watch] window
[Memory] window
[Register] window
[Stack] window
[Local] window
[BackTrace] window
[Break] window
[Memo] window
[Trace] window
[RAM Monitor] window
[Code] window 1
5.19 Window Bar
110
5.20 Status Bar
The status bar displays the real-time trace address, hints for shortcut keys, buttons, and
menu, error messages, C Source Code Debugger/Win status messages, and the like. The
[View]-[Status Bar] command alternately hides and displays the status bar.
[
Figure 53. Sample Status Bars
5.20 Status Bar
"5.2.4 [View] Menu"]
Chapter 5. Window Commands 111
5.21 Dialog Boxes
C Source Code Debugger/Win has many dialog boxes. This section discusses them
individually.
5.21.1 [File Open] Dialog Box
[File]-[Load],
The [File Open] dialog box is for selecting and loading the user program to be
debugged.
Select the user
program to be
debugged.
Double-click
the
mouse on the folder
containing the user
program
to
be
debugged
Select the
drive.
Select the type of files to display in the [File name] list box.
5.21 Dialog Boxes
112
5.21.2 [Font] Dialog Box
[Options]-[Font],
The [Font] dialog box is for changing the font, font style, and font size for text in the
window that currently has the focus.
Select the font
style.
Select the font.
Select the font size.
5.21.3 [Tool Bar] Dialog Box
[Options]-[Custm ToolBar],
The [Tool Bar] dialog box is for modifying the button layout on the tool bar. Selecting a
button in the [Tool Bar] list box and pressing the Del key removes the currently selected
button from the tool bar.
Specify the position
of the button.
Add the currently
selected button to
the tool bar.
Shift the button
up or down the
list.
Select a button to
be added to the
tool bar.
Remove the currently
selected button from
the tool bar.
This area gives the currently
selected button's function.
5.21 Dialog Boxes
Chapter 5. Window Commands 113
5.21.4 [Color] Dialog Box
[Options]-[Select Color],
The [Color] dialog box is for changing the background and text colors for windows.
This panel shows the new
colors.
Adjust the red component.
Adjust the green component.
Adjust the blue component.
Select the window to modify.
5.21.5 [Find String] Dialog Box
[Search]-[Find],
The [Find String] dialog box is for entering the search text and the search direction for
the window that currently has the focus.
Enter the search string.
Specify the
direction.
search
The default search direction is <Upward> for the [Command] window and <Downward> for the
others.
5.21 Dialog Boxes
114
5.21.6 [Set Inspect data] Dialog Box
[Child(Code)]/[Child(Local)]/[Child(Watch)]/[Inspect]-[Inspect],
The [Set Inspect data] dialog box is for specifying a variable to inspect.
Enter the name of the
variable to inspect.
5.21.7 [Set Watch data] Dialog Box
[Child(Code)]/[Child(Local)]/[Child(Watch)]/[Inspect]-[Watch],
The [Set Watch data] dialog box is for specifying a variable to watch.
Enter the name of the
variable to watch.
Only C variables may be specified in these dialog boxes. To specify arbitrary locations in
memory, use the W command. For further details, see the on-line help.
5.21 Dialog Boxes
Chapter 5. Window Commands 115
5.21.8 [Module] Dialog Box
[File]/[Child(Code)]-[Module],
The [Module] dialog box is for selecting a source code module for the loaded user
program for display in a [Code] window. The [Module name] list box contains the names
of all files specified in the debugging information within the loaded user program plus
those added with the V command.
This panel lists the available files.
5.21.9 [Set line no.] Dialog Box
[Child(Code)]-[Line no.]
The [Set line no.] dialog box is for specifying the starting line number for the source
code in a [Code] window.
Enter the line number.
5.21 Dialog Boxes
116
5.21.10 [Addressing (Code/RAM Monitor)] Dialog Box
[Child(Code)]/[Child(RAM Monitor)]-[Address]
The [Address (Code/RAM Monitor)] dialog box is for specifying the starting address
for the disassembler output in the [Code] window or [RAM Monitor] window.
Enter the address.
5.21.11 [Command History] Dialog Box
[Child(Command)]-[History]
The [Command History] dialog box is for selecting from commands previously entered
in the [Command] window. If there is text at the current prompt on the command line,
only commands beginning with that text are displayed.
5.21 Dialog Boxes
Chapter 5. Window Commands 117
5.21.12 [Expand Symbol] Dialog Box
[Child(Command)]-[Exp. Sym]
The [Expand Symbol] dialog box displays a list of command lines formed by
completing the current partial command line with all global symbols starting with the word
at the end of the command line. (The following example is for the partial command line
"ins P")
5.21.13 [Addressing(Memory)] Dialog Box
[Child(Memory)]-[Address]
The [Addressing(Memory)] dialog box is for specifying the starting address for the
dump list in a [Memory] window.
Enter the address.
Specify the number of
columns.
5.21 Dialog Boxes
118
5.21.14 [Set Data] Dialog Box
[Child(Memory)]-[Enter Data]
The [Set Data] dialog box is for modifying the contents of memory.
Enter the data.
Enter the address.
Clicking the mouse on the <OK> button modifies the data and advances to the next address.
To close this dialog box, click the mouse on the <Cancel> button.
5.21.15 [Register] Dialog Box
[Child(Register)]-[Change]
The [Register] dialog box is for modifying the contents of the selected register.
Enter the value.
5.21 Dialog Boxes
Chapter 5. Window Commands 119
5.21.16 [Flags] Dialog Box
[Child(Register)]-[Change]
The [Flags] dialog box is for modifying the CPU flags.
Unchecked flags are 0.
Checked flags are 1.
5.21.17 [Event] Dialog Box
[Child(Trace)]-[Event]
The [Event] dialog box is for specifying real-time trace events.
Select the trace
mode.
Select the trace
option.
Select the trace
status.
Select the area
mode.
Enter the delay
trigger count.
5.21 Dialog Boxes
120
5.21.18 [Hardware Breakpoint] Dialog Box
[Child(Break)]-[Hardware breakpoint]
The [Hardware Breakpoint] dialog box is for setting up a hardware breakpoint.
Select the
breakpoint status.
Specify the data
breakpoint
conditions.
Enter the address.
Enter the data
breakpoint value.
Enter the pass
count.
Select match or nonmatch for the data
breakpoint.
Enter the command
to be executed at
the breakpoint.
5.21.19 [Set Software Breakpoint] Dialog Box
[Child(Break)]-[Add]
The [Set Software Breakpoint] dialog box is for setting up a software breakpoint.
Enter the address.
Enter the command
to be executed at
the breakpoint.
5.21 Dialog Boxes
Chapter 5. Window Commands 121
5.21.20 [Jump Frame no.] Dialog Box
[Child(Trace)]-[Jump]
The [Jump Frame no.] dialog box is for specifying the starting frame number for the
trace buffer display in the [Trace] window.
Enter the frame number.
5.21.21 [Area Events] Dialog Box
[Child(Break)]/[Child(Trace)]-[Area events]
The [Area Events] dialog box is for managing area events.
Enter the starting
address.
Enter the end
address.
Select the status.
Adds the current
area
event settings to the
li t
Clears the current
area event settings.
Disables the
currently selected
area event.
Enables the
currently selected
area event.
List of area
events
Clears all selected
area events.
Clears all area
events.
5.21 Dialog Boxes
122
5.21.22 [Area Breakpoint] Dialog Box
[Child(Break)]-[Area breakpoint]
The [Area Breakpoint] dialog box is for setting area event conditions.
Select area event
conditions.
5.21.23 [Additional Options] Dialog Box
[Options]-[Option Set]
The [Additional Options] dialog box is for specifying C Source Code Debugger/Win
options.
Checking this box
makes case significant
in symbol names.
5.21 Dialog Boxes
Chapter 6.Dialog Command Data
Expressions
6.1 Data Expressions
6.2 Data Expressions Using C Syntax
124
6.1 Data Expressions
C Source Code Debugger/Win dialog commands are backward compatible with those
of the MS-DOS version. The debugger supports a wide variety of symbolic and arithmetic
expressions for specifying addresses and data.
6.1.1 Symbols
C Source Code Debugger/Win supports two types of symbols: global symbols, valid
everywhere in the user program, and local symbols, valid only inside the current function.
6.1.2 Global Symbols
Global symbols may be used as address values for label and address input to
disassemble commands. They include C extern variables and function names. C normally
prefixes (or suffixes) variable names and function names with an underscore (_). Since
entering this underscore each time that you enter a global symbol can get tiresome, C
Source Code Debugger/Win allows you to omit it. It also allows you to choose whether or
not to make case significant.
[
”OPTION command, [Options]-[Option Set”]
Note, however, that if a symbol has the same name as a CPU register, the CPU register
takes precedence. In other words, you cannot access variables with the same names as
CPU registers.
Using a global symbol to specify an address
>u _main
>u main
/*Disassemble starting at symbol _main */
/* Same as above */
Figure 54. Using Symbol _main in [Addressing] Dialog Box
6.1 Data Expressions
Chapter 6. Dialog Command Data 125
Using a global symbol inside a macro
>i=5
Defined symbol
>while{ i!=0
?T
?i=i-1
?}
>
/* 1 */
/* 2 */
/* 3 */
/* 4 */
/* 5 */
1. Assign the value 5 to the symbol i. (If i is undefined, the debugger defines
it.)
2. Compare the value of symbol i to 0.
3. If i is nonzero, trace execution with the T command.
4. Subtract 1 from i and store the result back in i.
5. Terminate the while{ command. Execution of this line sends the debugger
back to the while{ test in line 2.
Executing the above commands produces a while{ loop that executes the T command
five times and then stops.
In the above example, the symbol i represents a variable similar to those in such highlevel languages as C and BASIC. Note that this symbol must not have the same name as a
previously defined global or local variable.
6.1.3 Local Symbols
Local symbols are variables that are only valid inside the function (i.e, automatic
variables and function arguments) and variables declared static. The debugger
automatically defines local symbols when it reads the debugging information.
In addition to their addresses, local symbols have a scope and a type (int, char, double,
etc.).
6.1 Data Expressions
126
6.1.4 Predefined Symbols
_ _ERR_ _
The debugger sets the predefined symbol __ERR__ to 1 when the previously executed
command resulted in an error and to 0 otherwise.
Use this symbol to add error processing to macros.
_ _RUN_ _
The debugger sets the predefined symbol __RUN__ to 1 when the user program is
running and to 0 during a break.
Use this symbol to detect user program breaks in macros.
6.1.5 Numerical Values
C Source Code Debugger/Win supports numbers in binary, octal, decimal, and
hexadecimal notations and uses prefixes to distinguish between them. If there is no prefix,
it uses the radix specified with the N command.
Notation
Meaning
@num
binary number
¥num
octal number
_num
decimal number
$num
hexadecimal number
0xnum
hexadecimal number
interpreted according to current radix
(16 or 10)
num
For example, @11001010, ¥312, _202, $CA, and 0xCA all specify the same numerical
value.
There are also commands (DS, DL, DT, SS, SL, and ST) that take floating point values.
6.1.6 Addresses
Commands and dialog boxes that take addresses as parameters accept as input not just
direct address values, but also symbol names and, as described in the next section, line
numbers.
6.1 Data Expressions
Chapter 6. Dialog Command Data 127
6.1.7 Line Numbers
C Source Code Debugger/Win supports debugging at the source level using line
numbers from the source file.
Line numbers are used to specify locations in source files. They are only available,
however, when the debugging information loaded with the user program includes them.
There are three formats for entering line numbers.
(1) .[file name:]line number
(2) .<plus_minus> line number
(3) .symbol<plus_minus> line number
These line number specifications consist of a decimal number (line number or number
of lines) following a file name or symbol and specify a particular line in a source file for
the program being debugged.
The first format specifies an absolute line number. If there is a file name, the
specification indicates the specified line number in the specified file. Otherwise, it
indicates the specified line number in the current file, the one displayed in the [Code]
window.
>u.100
>u.sample:120
/* Line 100 in the currently selected source file */
/* Line 120 in sample.c */
The second format expresses the target address as a line number relative to the source
line currently containing the program counter (PC). A plus (+) indicates the line the
specified number of lines after the current source line; a minus (-), the one the specified
number of lines before. The format produces an input error if the specified line does not
exist.
>v.+10
/* 10 lines past the line containing the program counter
(PC) */
The third format expresses the target address as a line number relative to the specified
symbol. A plus (+) indicates the line the specified number of lines after the symbol; a
minus (-), the one the specified number of lines before. The format produces an input error
if the specified line does not exist.
>bp.main+10
/* 10 lines past the symbol main */
6.1 Data Expressions
128
6.1.8 Strings
C Source Code Debugger/Win supports the use of ASCII text strings instead of
numerical values. Put such strings inside single quotes (').
‘A’ = $41
‘AB’ = $4142
‘ABCD’ = $41424344
The E/EB command, for example, accepts up to 16 such characters as input.
A single quote inside the string terminates it, causing the rest to be ignored. Use its
numerical value (e.g., $27) instead.
6.1.9 Register Names
C Source Code Debugger/Win provides access to register and flag contents through
symbols consisting of an underscore (_) plus the register or CPU flag name (A, DE, etc.).
The following registers and flags are available.
Register Names
D0,D1,D2,D3,DW0,DW1,A0,A1,SP,HA
PC,PSW
Flag Names
C,N,V,Z,I,IM
>while{ _D0!=_D1
?T
?}
>
/* Compare contents of D0 and D1 registers */
/* Trace execution command */
/* End of macro */
The above example executes the T (trace) command until the registers D0 and D1
contain the same value. Note that if a symbol has the same name as a CPU register, the
CPU register takes precedence.
6.1 Data Expressions
Chapter 6. Dialog Command Data 129
6.1.10 Arithmetic Expressions
Arithmetic expressions combine numerical values, symbols, and registers with operators
to yield a single value. C Source Code Debugger/Win supports C-like numerical values
and logical operators. Arithmetic expressions may be used anywhere that a command calls
for data or an address. The following is a list of the unary and binary operators available
for arithmetic expressions.
Unary operators
*
16-bit data at the specified address (pointer to word)
+
unary plus
-
unary minus
~
NOT (1's complement)
!
logical negation
Binary operators
1
*
multiplication
1
/
division
1
%
modulo operation (remainder)
2
+
addition
2
-
subtraction
3
>>
right shift
3
<<
left shift
4
>=
4
<=
4
>
4
<
5
==
5
!=
6
&
comparison operator (1 when the right operand is greater
than or equal to the left operand, 0 otherwise)
comparison operator (1 when the right operand is less
than or equal to the left operand, 0 otherwise)
comparison operator (1 when the right operand is greater
than the left operand, 0 otherwise)
comparison operator (1 when the right operand is less
than the left operand, 0 otherwise)
comparison operator (1 when the right operand is equal
to the left operand, 0 otherwise)
comparison operator (1 when the right operand is not
equal to the left operand, 0 otherwise)
bitwise AND
7
^
bitwise XOR
8
|
bitwise OR
9
&&
10
||
logical AND
logical OR
6.1 Data Expressions
130
System function VAL
The VAL dialog command evaluates the specified C expression.
The numbers on the left of each operator indicate operator precedence. If two operators
have the same precedence, they group from left to right. Note, however, that parentheses
may be used to override this precedence order.
Compare, logical AND and logical OR expressions are available for processing
decision conditions for macro (for {, while { commands,etc) and condition decision
commands (such as if { command). For the compare, logical AND and
instructions, only the lower 16 bits are subject to operation.
>h -(1+2*3)
oct
37777777771
>
6.1 Data Expressions
dec
-7
hex
asc
FFFFFFF9 ‘....’
float
-6.805644e++38
logical OR
Chapter 6. Dialog Command Data 131
6.2 Data Expressions Using C Syntax
Section 6.1 "Data Expressions" described how assembler-like expressions based on
global symbols, local symbols, and line numbers may be used to express addresses. These
expressions are supported by virtually all dialog commands. The program being debugged,
however, uses expressions following C syntax, and these expressions cover a wider range.
C Source Code Debugger/Win therefore adds support for C syntax to the following dialog
and window commands: inspect commands, watch commands, VAL command, and ?
command.
6.2.1 C Expressions
Commands that support C syntax interpret expressions differently from those using the
syntax described in Section 6.1 "Data Expressions." To see the difference, consider the
following expressions based on the C global variable abc.
>d abc
/* Display memory starting at variable abc */
3628 00 01 02 03 .......
>d abc+10
/* Display memory starting at address 10 bytes past variable abc */
3638 AA BB CC DD .......
>? abc
/* Display value of variable abc (expression evaluated using C syntax) */
(int) 1 (0x1)
>? abc+10
/* Display value of variable abc plus 10 (expression evaluated using C syntax) */
(int) 11 (0xB)
>
This example illustrates how the same expressions abc and abc+10 have different
meanings depending on whether they are evaluated with assembler (D command) or C (?
command) syntax. The inspect commands, watch commands, VAL command, and ?
command interpret abc as a C variable. The other commands interpret it as an address.
6.2 Data Expressions Using C Syntax
132
6.2.2 C Variables
These C expressions may use any of the variables and functions declared in source files
compiled with the options for including detailed debugging information in output files.
They may also use the following pseudo-variables for registers and flags. These pseudovariables are of type unsigned int.
Register
Register/Flag
Pseudo-Variable
_D0
D0 register
_D1
D1 register
_D2
D2 register
_D3
D3 register
_DW0
DW0 register
_DW1
DW1 register
_A0
A0 register
_A1
A1 register
_SP
SP register
_HA
HA register
_PC
PC register
_PSW
PSW register
_C
C flag
_N
N flag
_V
V flag
_Z
Z flag
_I
I flag
_IM
IM flag
6.2 Data Expressions Using C Syntax
Chapter 6. Dialog Command Data 133
6.2.3 Scope of C Variables
When creating and debugging C programs, the programmer must be mindful of each
variable's scope, the range where it may be used. A variable declared with the extern
modifier, for example, is valid everywhere in the program. In other words, its scope is the
entire program. An automatic variable declared within a function, in contrast, is only valid
for the duration of the function. Its scope is limited to that function. If there are variables
of both types with the same name, only the latter is valid inside the function. The former is
not accessible. Outside the function, however, the latter no longer exists anywhere in
memory, so is not accessible.
C Source Code Debugger/Win automatically supports C variable scope based on scope
information contained in the debugging information.
6.2.4 Constants
Constants follow the C specifications. The default radix is always 10 regardless of any
setting made with the N command for modifying the radix.
Notation
Radix
num
10
0xnum
16
0Xnum
16
0num
8
For example, 4096 (decimal), 0x1000 (hexadecimal), and 010000 (octal) all represent
the same value. C escape sequences may be used to define character constants.
C Character Numerical Value
'¥a'
0x7
Meaning
Bell
'¥b'
0x8
Backspace
'¥f'
0xC
Form feed
'¥n'
0xA
Line feed
'¥r'
0xD
Return
'¥t'
0x9
Horizontal tab
'¥v'
0xB
Vertical tab
'¥¥'
0x5C
Backslash
'¥nnn'
nnn
Octal number (8-bit)
'¥xnn'
nn
Hexadecimal number (8-bit)
6.2 Data Expressions Using C Syntax
134
6.2.5 Operators
C Source Code Debugger/Win supports C operators and C operator syntax. It supports
all operators except the assignment operators for floating point values.
The operators have the following precedence.
Precedence
Operators
Level
1
function(n) array[n] n.n n->n n++ n--
2
&n *n -n ~n !n ++n --n sizeof n
3
(cast) n
4
n%n n/n n*n
5
n+n n-n
6
n<<n n>>n
7
n>n n<n n>=n n<=n
8
n==n n!=n
9
n&n
10
n^n
11
n|n
12
n&&n
13
n||n
14
nn?nn:nn
15
n=n n*=n n/=n n%=n n+=n n-=n n<<=n n>>=n n&=n n^=n n|=n
16
n, n
If two operators have the same precedence, they group from left to right. Note, however,
that only the assignment operators ( precedence level 16 ) group from right to left, and that
parentheses may be used to override this precedence order.
6.2 Data Expressions Using C Syntax
Chapter 6. Dialog Command Data 135
6.2.6 Expressions with Side Effects
C expressions containing ++, --, =, assignment operators, or function calls have side
effects<em_dash>that is, they change the contents of variables. While there are times
when you may wish to deliberately change the contents of a variable with an assignment
operator, debugging usually just means viewing the contents of variables. There is
relatively little call for modification.
To prevent accidental modification of variables as the result of expression evaluation,
therefore, C Source Code Debugger/Win blocks C expressions containing operators with
side effects from the watch, inspect, and ? commands. Only the VAL command permits
them. If your primary interest is merely viewing data, stick to the ? and inspect commands.
Save the VAL command for when you deliberately wish to use operators that have side
effects.
Function calls are even more dangerous since a function may very well modify global
variables, static variables, or, via pointers, other data areas that do not appear in the
expression. If you are not careful, it may even become impossible to resume program
execution. Be extremely careful when using the VAL command to evaluate an expression
containing a function call.
>? abc=1234
Operators with side effects not allowed.
>val abc=1234
/* Set abc to 1234 */
(int) 1234 (0x4D2)
>val fnc(1,2,3)
/* Call function fnc */
(int) 10 (0xA)
>
6.2 Data Expressions Using C Syntax
136
6.2 Data Expressions Using C Syntax
Chapter 7.
Dialog Command
Reference
7.1 Command Description Conventions
7.2 Commands Grouped by Function
138
7.1 Command Description Conventions
C Source Code Debugger/Win commands consist of a command name followed by a
parameter list. Sometimes a parameter can be omitted. Such a parameter appears in square
brackets ([...]). A parameter offering two or more choices appears in braces ({...}) with
bars (|) separating the choices. When a parameter is omitted, C Source Code
Debugger/Win substitutes a default value or one based on a previously executed command.
,
Parameter delimiter
[...]
Optional parameter
{A|B}
Choice of A or B
ABCD
Underlining indicates key input.
7.1 Command Description Conventions
Chapter 7. Dialog Command Reference 139
7.2 Commands Grouped by Function
7.2.1 Loading User Program
L [<file name>]
Reads in the user program to be debugged and the debugging
information.
LP [<file name>]
Reads in the user program to be debugged only.
7.2.2 Running User Program
T [<count>]
Traces execution of the user program. (F8)
P [<count>]
Single-steps through the user program. (F10)
G [=<execution address>][<breakpoint address>][,/W]
Runs the user program. (F5, F7)
/W
Disables on-the-fly functions.
RESET
Resets the target chip.
7.2.3 Breakpoint Commands
BP [<address>][,<status>[,<data>][,/N]][,/<count>][,/C<command>]
Set a breakpoint at the specified address. (F9)
<status>
EX: instruction execution hardware breakpoint
RW: RAM read/write
R: RAM read
W: RAM write
(blank): software breakpoint
/N
Breaks on mismatch with the specified data.
/C<command>Automatically executes the specified command at the
breakpoint.
BP PAREA
Sets up a ROM area breakpoint.
BP DAREA
Sets up a RAM area breakpoint.
BP EXT
Sets up an external breakpoint.
BPS S:<list>,E:<list>[,/B]
Sets up the specified list of breakpoints as a sequential event. A
sequential event may be used for partial time measurement.
S:
First event condition.
E:
Second event condition.
/B
Sets up the specified list of breakpoints as a sequential event.
BPA <list>
Sets up the specified list of breakpoints as an AND breakpoint.
BC <list>
Cancels the specified list of breakpoints.
7.2 Commands Grouped by Function
140
BD <list>
Disables the specified list of breakpoints.
BE <list>
Enables the specified list of breakpoints.
7.2.4 Area Event Commands
AREA [<range>[,<mode>]]
Sets up an area event for the specified range.
<mode>
EX: ROM read area event
RW: RAM read/write area event
W: RAM write area event
(blank): ROM read area event
AREAC <list>
Cancels the specified list of area events.
AREAD <list>
Disables the specified list of area events.
AREAE <list>
Enables the specified list of area events.
7.2.5 Real-Time Tracing Commands
TD[U]
Switches to the mode for displaying real-time trace data. Adding
'U' switches to the disassembler output mode.
Subcommands available in real-time trace display mode
[-]B
Moves the display's starting frame to the beginning (end) of trace
memory.
N <address> Moves the display's starting frame to the specified address.
D [<range>] Displays the frame range data in hexadecimal.
U [<range>] Displays the frame range data in hexadecimal and as
disassembler output.
TDW
Displays the real-time trace data in window mode.
7.2 Commands Grouped by Function
Chapter 7. Dialog Command Reference 141
7.2.6 Hardware-Related Commands
SM [<address>]
Specifies/displays the sample area.
SMB <address>
Specifies the address for displaying in bits.
SMC <address>
Clears the address for displaying in bits.
PROF [<mode>]
Displays statistics on subroutine access. (profiler)
<mode>
ON: Turns profiler ON.
OFF: Turns profiler OFF.
CLR: Clears profiler statistics.
TG
Resumes tracing.
TI [<mode>]
Sets up/displays timer mode.
<mode>
RUN: Measures time elapsed from program start to stop.
PAR1: Measures time elapsed up to first sequential event.
MAX: Measures time elapsed for repeated sequential events and
determines maximum value.
STOP: Terminates timer mode.
TM [<mode>][,/T[<count>]][,<status>][,<option>]
Sets up/displays trace mode.
<mode>
PAREA: ROM area trace mode
DAREA: RAM area trace mode
ORAREA: ROM and RAM area OR condition trace mode
ANDAREA: ROM and RAM area AND condition trace mode
/T[<count>]
Traces specified number of times after trigger condition
detected and then stops.
<status>
MEM: Memory access trace mode
ALL: All cycle trace mode
<option>
/B: Breaks when trace memory is full.
/C: Continues tracing until program stops.
/S: Stops only tracing when the trace memory is full. Does not
stop the user program.
TM /F
Sets up free-running trace mode.
TRIG [<mode>]
Sets up/displays external trigger output.
<mode>
ON: Enables trigger.
OFF: Disables trigger.
TS
Stops tracing.
EXI <expanded area> Assigns expanded memory to memory inside the emulator.
<expanded area>
ROM: Expanded ROM area
7.2 Commands Grouped by Function
142
RAM: Expanded RAM area
EXE <range>
Assigns expanded memory to user target resources.
<expanded area>
ROM: Expanded ROM area
RAM: Expanded RAM area
EX
Display settings.
7.2.7 Displaying/Modifying Registers
R
Displays contents of all register and flags.
<register>+REG=<value> Sets the specified register to value of expression.
<flag>+FLG=<value>
Sets the specified flag to value of expression.
R <register>
Modifies contents of specified register or CPU flag.
7.2.8 Displaying/Modifying Memory
D[<type>] [<range>][,<display count>][,<radix>]
Displays the contents of the specified range with the specified
radix.
<type>
B: Byte (8-bit) data
W: Word (16-bit) data
D: Double word (32-bit) data
S: 4-byte real number (short float) data
L: 8-byte real number (long float) data
A: ASCII data
<radix>
/H: Hexadecimal display
/D: Decimal display
/O: Octal display
E[<type>] [<address>][<data>]
Modifies memory starting at the specified address using the
specified data type.
<type>
B: Byte (8-bit) data
W: Word (16-bit) data
D: Double word (32-bit) data
S: 4-byte real number (short float) data
E: Nybble (4-bit) data
F[<type>] <range>,<data>
Fills the specified range with data of the specified type.
<type>
B: Byte (8-bit) data
W: Word (16-bit) data
D: Double word (32-bit) data
7.2 Commands Grouped by Function
Chapter 7. Dialog Command Reference 143
S[<type>] <range>,<list>
Searches the specified range for the specified memory pattern
using the specified format.
<type>
B: Byte (8-bit) data
W: Word (16-bit) data
D: Double word (32-bit) data
C <range>,<address> Compares the specified range with the range starting at the
specified address.
M <range>,<address> Moves the data in the specified range to the block starting at the
specified address.
7.2.9 Assemble Command
A[<address>]
Begins assembly at the specified address.
7.2.10 Radix Command
N {10|16}
Sets the input radix to decimal or hexadecimal.
7.2.11 Displaying Expressions
H <expression>
Displays the value of the expression in octal, decimal,
hexadecimal, ASCII, and real number formats.
H <expression 1>, <expression 2>
Displays the sum and difference of the two expressions.
PF/PRINTF <format>[,<parameter>]
Displays the specified parameters using C's printf() function.
7.2.12 Reading/Writing Files
RD <file name>,<address>
Reads the specified file into memory starting at the specified
address.
WR <file name>,<range>
Writes the contents of the specified memory range to the specified
file.
7.2.13 System Commands
EXIT/Q [<exit code>]
Exits C Source Code Debugger/Win and returns to MS-DOS.
!!
Displays the command history.
!<text>
Selects the last command beginning with the specified text from
the command history.
HELP
Displays the on-line help.
7.2 Commands Grouped by Function
144
7.2.14 Displaying/Modifying Symbols
X [<symbol name>]
Displays the definition for the specified symbol (or all symbol
definitions if there is no parameter).
[.]<symbol name>
Defines or resets the specified symbol to the specified value.
7.2.15 Displaying Code
V[.][<file name>:][<line>]
Displays the specified line in the specified file in a [Code] window.
V <symbol name>
Displays the source file containing the specified symbol in a
[Code] window.
U [<address>]
Displays disassembler output starting from the specified address in
a [Code] window.
UPUSH [<address>] Pushes the current display address onto the address stack and
displays disassembler output starting from the specified address.
UPOP
Pops an address off the address stack and displays disassembler
output starting from that specified address.
UEND
Displays disassembler output starting from the last address pushed
onto the address stack.
UX [<address>]
Displays disassembler output starting from the specified address in
the [Command] window.
K
Backtraces the function call history.
7.2.16 Displaying/Modifying C Data
INS <C expression>[,<function name>]
Evaluates the specified C expression and displays the result in the
[Inspect] window.
W? <C expression>
Adds the C expression to the [Watch] window.
W[<type>] <address>[,<count>][,<radix>]
Adds the specified address to the [Watch] window.
<type>
B: Byte (8-bit) data
W: Word (16-bit) data
D: Double word (32-bit) data
A: ASCII data
?: C expression display
<radix>
/H: Hexadecimal display
/D: Decimal display
/O: Octal display
Y <list>
WM <list>
Deletes the specified watch line(s).
Displays the specified watch line(s) in the [RAM Monitor]
window.
7.2 Commands Grouped by Function
Chapter 7. Dialog Command Reference 145
VAL/? <C expression>[,<function name>]
Evaluates the specified C expression and displays the result.
7.2.17 Setting Options
OPTION <reg> [,<code>[,<case>]]
Sets options. (Shift+F10)
<reg>
{ON|OFF}: Switches the [Register] window display on and off.
<code>
{SRC|ASM}: Switches the [Code] window display between
source code and disassembler output.
<case>
{ON|OFF}: Switches case significance for symbol names on and
off.
7.2.18 Memo Commands
MEM<number>[,<text>]
Writes the specified text to the specified memo number.
MEM
Displays the contents of the current memo.
MEM *
Deletes all current memos.
7.2.19 Logging/Running Batch Commands
> {file name}
Logs [Command] window displays and input to the specified file,
overwriting the file.
>> {file name}
Logs [Command] window displays and input to the end of the
specified file.
>
Suspends logging and closes the log file.
< {file name}
Takes [Command] window input from the specified file. Use the
ESC key to interrupt such batch processing.
7.2.20 Screen Control/Miscellaneous Commands
*
Adds a comment line.
BEL
Sounds the buzzer.
CLS
Clears the [Command] window.
HOME
Moves the [Command] window cursor to the home position.
LALL
Enables display output during macro execution.
SALL
Disables display output during macro execution.
LIST
Enables [Command] window display output.
NLIST
Disables [Command] window display output.
PRMPT <character> Changes the prompt to the specified character.
TIME
Displays the current time in hh:mm:ss format.
WAIT
Pause.
7.2 Commands Grouped by Function
146
7.2.21 Predefined Symbols
_ _ERR_ _
The debugger sets this to 1 when the previously executed
command resulted in an error and to 0 otherwise.
_ _RUN_ _
The debugger sets this to 1 when the user program is running and
to 0 during a break.
_ _DEBINF_ _
Undefines all symbols.
7.2.22 Macro Commands
{<macro name>
Defines a macro with the specified name.
DO{}WHILE <expression> Adds C-like do..while control statement to macro.
FOR{}
Adds C-like for control statement to macro.
WHILE{<expression>
Adds C-like while control statement to macro.
REPEAT{<parameter>
Adds repeat loop to macro.
BREAK
Breaks out of macro.
KILL <macro name>
Deletes the specified macro.
MLIST [<macro name>]
Lists macro(s).
MLIST >{file name}
Writes all currently defined macros to the specified file.
<{file name}
Loads macros from specified macro file.
IF{<expression>
Adds C-like if..elseif..else control statement to macro.
7.2 Commands Grouped by Function
Chapter 8. Appendices
8.1 In-Circuit Emulator Specifications
8.2 Configuring Interface Board
8.3 Error Messages
148
8.1 In-Circuit Emulator Specifications
8.1.1 Functional Specifications
Item
Specifications
Target device
MN101Cxx series
Memory
Emulation memory
224 kilobytes
ROM breakpoint
Maximum of 4 events. Conditions: Area
capacity
Breakpoint
functions
specification, pass count specification
RAM breakpoint
Maximum of 4 events. Conditions: Area
specification, pass count specification, bit
mask,
read/write/access
match/mismatch
specification,
specification,
AND
condition specification. Two levels.
Sequential breakpoint
Two levels.
Trace breakpoint
RAM access violation
One bit
breakpoint
External breakpoint
Trace
Trace memory size
511 steps
functions
Trace get data
ROM address, RAM address, RAM data,
R/W
Trace mode
Normal mode, ROM/RAM area mode,
delayed trigger mode
Timer
Measurement modes
Execution
functions
Time
maximum
measurement
resolution
time
measurement
execution
time
mode
100 ns
Trigger output
Trigger output
One output
RAM monitor
Sample memory
32 bytes
function
Display modes
Dump list mode, bit map mode
Performance
Profiler
Displays execution shares (%)
functions
evaluation
8.1 In-Circuit Emulator Specifications
mode,
measurement
Chapter 8. Appendices 149
functions
Clock
OSC1, XI
Emulator side, target side (separately excited
oscillation only)
8.1.2 Electrical Specifications
Item
Rating
Emulator and probe power supply voltage
0.5 to 0.6 V
EXT. BREAK. input voltage
-0.3 to 5.5 V
Trigger output voltage
-0.3 to 5.5 V
Trigger output current
<plus_minus>10 mA
8.1.3 Environment Specifications
Item
Temperature
Humidity
Rating
Operation
10°C to 30°C
Storage
0°C to 45°C
Operation
20% t o 80%
Storage
90% max
8.1.4 External Dimensions
Item
Rating
Length x width x height
130 x 100 x 40 mm
8.1 In-Circuit Emulator Specifications
150
8.2 Configuring Interface Board
The interface between the host computer and the in-circuit emulator uses one byte in the
host computer's I/O space. Only the lowest eight bits of the I/O address are decoded. The
board uses the upper eight bits. Set the switches on the interface board to match the system
used.
The I/O address may be any unused address, but normally use an address from the tables
below.
The interface boards include a no-fuse circuit breaker to prevent overcurrents from the 5volt power supply from damaging the board. If, for any reason, there is an overcurrent, the
white button pops out to shut off the current. Before resetting the no-fuse circuit breaker by
pressing in the button, always investigate the cause first. Be careful not to press too firmly
on the button. When the button has popped out, it protrudes approximately 1 or 2 mm from
the top of the no-fuse circuit breaker.
8.2 Configuring Interface Board
Chapter 8. Appendices 151
Interface Board for PC/AT
Rotary switch
DSW7
DIP switch
DSW6
DSW5
DSW4
DSW3
DSW2
DSW1
DIP switch (DSW5, 7) settings
DSW5
DSW7
1
OFF
OFF
2
OFF
ON
3
OFF
ON
4
ON
ON
Rotary switch (DSW1, 2, 3, 4, 6) settings
I/O address
0300H
0301H
:
030FH
0310H
0311H
:
03FFH
DSW3
3
3
:
3
3
3
:
3
DSW2
0
0
:
0
1
1
:
F
DSW1
0
1
:
F
0
1
:
F
DSW4
:
:
-
DSW6
:
:
-
Note: Dashes indicate that the setting does not matter.
Set the I/O address to an unused address between x300H and x3FFH.
8.2 Configuring Interface Board
152
8.3 Error Messages
C Source Code Debugger/Win displays an error message when it detects an error in a
user command. The following lists possible error messages and their meanings.
Address error
This message appears when the address input field contains an improper address
specification, when the starting and end addresses are reversed, and when the input uses an
undefined symbol.
Illegal instruction breakpoint
The device executed an illegal instruction. Use the real-time trace function to determine
the address of the problem instruction.
Cannot add watch variable. (max: 16)
There are too many watch variables. The limit is 16.
Illegal operand
An assembler instruction entered with the A command has an error in operand syntax.
Invalid environment
A problem with the environment settings prevents loading the user program.
Invalid function format
The function is in a format not supported by C Source Code Debugger/Win.
Invalid function name
Either the specified function is not in the symbol table or a local symbol (automatic
variable) was not declared at the beginning of the function.
Command error
C Source Code Debugger/Win does not recognize the specified command as an internal
command or macro.
8.3 Error Messages
Chapter 8. Appendices 153
Invalid command format
There is a mistake in input format, parameter specifications, or number of parameters
for the command.
Sampling data not available.
This message appears when you attempt to display profiler statistics before running the
profiler.
No such setting.
There is an error in the breakpoint number specification.
Cannot find specified file.
The debugger cannot find the file specified on the command line.
Cannot open specified file.
The debugger cannot open the specified file. Check whether the file actually exists.
This message also appears when you have too many files open.
Error evaluating C expression.
The ? and VAL commands display this error when there is an error in the C expression.
Cannot find C variable.
The ? and VAL commands display this error when they cannot find the specified C
variable.
Cannot start in STOP or HALT mode.
The CPU is in STOP or HALT mode. Before user program execution can resume, you
must modify the contents of the CPU mode register.
Source line buffer full.
The debugger has run out of space for source line information. Restart C Source Code
Debugger/Win using the -B command line option to specify a larger buffer.
8.3 Error Messages
154
Target reset on. Monitor program inoperative.
Check probe and installation.
Make sure that the model number specified with the Pset101C command matches that
on the evaluation chip.
Disk full.
There is not enough free space on the specified disk.
Data specification error
This message indicates an illegal data value in the input or a value that is out of range.
Debugging information missing.
The debugger found no debugging information in the executable file (Matsushita .ex
format) loaded with the L command.
Invalid debugging information format
The debugging information in the user program is not in the proper format.
Debugging information buffer full.
The debugger has run out of space for debugging information. Restart C Source Code
Debugger/Win using the -B command line option to specify a larger buffer.
PICE internal error
This message indicates a problem within C Source Code Debugger/Win. It should not
normally appear. If it appears in a reproducible fashion, contact your nearest Matsushita
representative.
Cannot create file.
Either the disk is full or there are too many files open. Try closing unnecessary files.
Operators with side effects not allowed.
The ? command does not allow the use of operators with side effects (=, +=, -=, etc.). If
you are willing to accept side effects, use the VAL command instead.
8.3 Error Messages
Chapter 8. Appendices 155
Cannot set breakpoint. (max: 16)
There are too many software breakpoints either alone or in combination with hardware
breakpoints. The limit is 16.
Verify error.
A write to memory failed. This message indicates an attempt to write to memory that is
not physically present.
Cannot find HELP file.
PT101C.HLP file cannot be found. Load PT101C.HLP file in the current directory or
the directory specified with environment variable HELP.
Microcomputer out of control.
The user program has run out of control while executing. Check stack usage, interrupt
service routines, etc.
Other possible causes include problems with the power supply, oscillator, and cable
connections. Try resetting the device.
Macro nesting limit exceeded. (max: 15)
C Source Code Debugger/Win only supports macro nesting up to 15 levels deep.
Missing } in macro definition.
The braces ({}) in a macro definition do not match.
Cannot delete macro inside macro.
Delete the macro definition at the C Source Code Debugger/Win command level.
Macros cannot delete other macros.
Cannot define macro inside macro.
Define the macro definition at the C Source Code Debugger/Win command level.
Macros cannot define other macros.
8.3 Error Messages
156
Macro buffer full
Either the buffer for macro definitions is full or there are too many macros defined.
Restart C Source Code Debugger/Win using the -B command line option to specify a
larger buffer.
Macro name same as internal command.
The macro definition uses a name that matches a C Source Code Debugger/Win internal
command. Use a different name.
Out of memory.
There is not enough memory available. Restart C Source Code Debugger/Win using the
-B command line option to specify smaller buffers.
Cannot find monitor program (MON101C.EX).
The debugger needs the monitor program (MON101C.EX) to start, but cannot load the
file. Copy the MON101C.EX file in the current directory or the directory specified with
PAHT.
Check power supply, interface board, and addresses.
Make sure that the power supply to the in-circuit emulator is on. Make sure that the
probe and pod switch settings match. Make sure that the I/O address of the interface board
matches that specified with the Pset101C command. Check the interface board address for
conflicts with other boards, EMS memory, RAM disks, and the like.
Cannot define local symbol.
This message appears when you attempt to define a global symbol with the same name
as an existing local symbol.
Local symbol buffer full.
The buffer for local symbols (automatic variables) is full. Restart C Source Code
Debugger/Win using the -B command line option to specify a larger buffer.
Cannot find local variable.
You have used a symbol name that has not been defined as a local symbol.
8.3 Error Messages
Chapter 8. Appendices 157
Failure to get chip bus. (Evaluation chip serial error)
Check the power supply, oscillator, and cable connections.
Failure to release chip bus. (Evaluation chip serial error)
Check power supply, oscillator, and cable connections.
There was an error while the microcomputer (pod and probe) was
communicating with the device.
Check the power supply, oscillator, and cable connections. If such errors persist, contact
your nearest Matsushita representative.
Failure to stop program at single step
Run RESET command.
There is no RTS instruction matching a JSR instruction.
Failure to get mail.
There has been a serial error. Check the cable connections between the in-circuit
emulator and the POD.
mailflg is not zero.
If this message persists even though the cable connections are solid, contact your
nearest Matsushita representative.
8.3 Error Messages
158
8.3 Error Messages
159
INDEX
INDEX
160
Symbols
Auto-execute file ............................................................... 44
B
! command .................................................................... 149
!! command ................................................................... 149
Back up floppy disk .......................................................... 26
* command .................................................................... 151
[BackTrace]window.......................................................... 96
. command..................................................................... 150
Local menu ............................................................ 70, 97
? command ................................................................ 82, 151
Mouse Operations ........................................................ 97
{<macro name> command.......................................... 152
Shortcut Keys............................................................... 96
< command ................................................................... 151
Basic Operating Procedure................................................ 20
<{file name}command.................................................. 152
BC command .................................................................. 145
>{file name} command................................................. 151
BD command ................................................................ 146
>> command ................................................................. 151
BE command ................................................................ 146
A
BEL command .............................................................. 151
[Bit]command ................................................................. 111
A command ................................................................... 149
[About...]command ........................................................... 73
[Add]command ......................................................... 99, 101
[Additional Options]dialog box ...................................... 129
[Address]command ............................................. 83, 97, 111
[Address Set]command ..................................................... 89
[Addresses]command ........................................................ 93
[Addressing]dialog box ........................................... 123, 124
[Add to AND condition]command.................................. 101
[All Clear]command.......................................................... 99
Appendices...................................................................... 153
AREA command ........................................................... 146
[Area breakpoint]command............................................. 101
[Bottom]command .................................................... 83, 104
BP command....................................................... 81, 84, 145
BPA command.............................................................. 145
BPS command.............................................................. 145
BREAK command ........................................................ 152
Breakpoint Commands.................................................... 145
Breakpoints ....................................................................... 18
[Break]window................................................................ 100
Local menu .......................................................... 70, 101
Mouse Operations ...................................................... 102
Shortcut Keys............................................................. 100
Button ..................................................................... 113, 115
[Byte]command......................................................... 89, 111
[Area Breakpoint]dialog box........................................... 129
C
Area event commands ..................................................... 146
[Area events]command ................................................... 101
C command................................................................... 149
[Area Events]dialog box.................................................. 128
C Expressions.................................................................. 138
AREAC command ........................................................ 146
C Variables...................................................................... 139
AREAD command ........................................................ 146
[Cascade]command........................................................... 72
AREAE command ........................................................ 146
[Change]command.................................................... 91, 106
Arithmetic expressions .................................................... 136
[Char(ASCII)]command.................................................... 89
[Arrange]command ........................................................... 72
[Clear]command ....................................................... 99, 101
Assemble........................................................................... 55
[Clear All]command.................................................. 65, 109
Assemble command ........................................................ 149
CLS command .............................................................. 151
INDEX
161
[Code]window................................................................... 80
Debugger features ............................................................. 14
Local menu............................................................. 68, 83
Debugger overview ................................................... 13, 168
Mouse Operations ........................................................ 84
[Decimal]command............................................. 89, 91, 111
Shortcut Keys............................................................... 81
[Decrement]command....................................................... 91
[Color]dialog box ............................................................ 120
[Delete]command...................................................... 65, 109
[Come]command......................................................... 67, 83
Dialog Boxes................................................................... 117
Command Description Conventions ............................... 144
[Directory]window............................................................ 30
[Command History]dialog box........................................ 123
[Disable/Enable]command.............................................. 101
Command History file....................................................... 45
[Disassemble]command .................................................... 83
[Command History]window.............................................. 45
[Disassemble/Dump]command ....................................... 104
Command line................................................................... 48
[Disk]menu ....................................................................... 30
Command reference ........................................................ 143
Displaying Code.............................................................. 150
Commands grouped by function ..................................... 145
Displaying Expressions ................................................... 149
[Command]window........................................................... 85
Displaying/Modifying Registers ..................................... 148
Local menu............................................................. 68, 87
Displaying/Modifying C Data ......................................... 150
Shortcut Keys............................................................... 85
Displaying/Modifying Memory....................................... 148
Compile............................................................................. 55
Displaying/Modifying Symbols ...................................... 150
Configuring Interface Board............................................ 156
DO{}WHILE command................................................. 152
Connect in-circuit emulator............................................... 26
[Double word]command ................................................... 89
Constants......................................................................... 140
E
Convert to ROM................................................................ 55
[Copy]command........................................................ 65, 109
[Copy Page]command ....................................................... 65
Copying files ..................................................................... 33
Create a shortcut................................................................ 37
Create a New Environment .......................................... 40
Modifing an Existing Environment.............................. 43
Upgrading from MS-DOS<R>Version ........................ 42
Create environment settings file.................................. 37, 46
Create a New Environment .......................................... 39
Modify an Existing Environment................................. 43
[Custm ToolBar]command................................................ 73
[Cut]command .......................................................... 65, 109
E command ................................................................... 148
[Edit]command ................................................................. 89
[Edit]menu ........................................................................ 65
Electrical Specifications.................................................. 155
[Element]command..................................................... 95, 99
ENV101C.TXT ..................................................... 39, 45, 46
[Environment Settings]dialog box..................................... 46
Environment settings file .......................... 37, 39, 41, 44, 46
Environment Specifications ............................................ 155
Error messages .......................................................... 52, 158
[Event]command............................................................. 104
[Event]dialog box............................................................ 126
EX command................................................................. 148
D
EXE command.............................................................. 148
D command ................................................................... 148
EXI command ............................................................... 147
Data Expressions............................................................. 131
[Exit]command ................................................................. 64
Data Expressions Using C Syntax................................... 138
EXIT/Q command......................................................... 149
Debugger Does Not Load .................................................. 52
[Exp. Sym]command ........................................................ 87
INDEX
162
[Expand Symbol]dialog box............................................ 124
[Help on help]command.................................................... 73
Expressions with Side Effects ......................................... 142
[Help]menu ....................................................................... 73
[External breakpoint]command....................................... 101
[Hexadecimal]command ........................................... 89, 111
External dimensions ........................................................ 155
[History]command ............................................................ 87
F
HOME command .......................................................... 151
I
F command ................................................................... 148
[File Focus]command........................................................ 84
IF{ command................................................................. 152
[File Open]dialog box ..................................................... 117
Important Notes................................................................. 16
Files Saved at Exit............................................................. 45
In-Circuit Emulator Specifications.................................. 154
[File]menu......................................................................... 64
[Increment]command ........................................................ 91
Files Necessary for Loading .............................................. 44
INI file............................................................................... 44
[Find]command................................................................. 66
INIT.MCR......................................................................... 44
[Find String]dialog box ................................................... 120
INS command ..................................................... 81, 84, 150
[Flags]dialog box ............................................................ 126
[Inspect]command................................... 83, 95, 97, 99, 106
[Flip]command.................................................................. 84
[Inspect]window.............................................................. 105
[Flyover Hints]command .................................................. 66
Local menu .......................................................... 71, 106
[Font]dialog box.............................................................. 118
Mouse Operations ...................................................... 106
[Font Select]command ...................................................... 73
Shortcut Keys............................................................. 105
FOR{} command........................................................... 152
Installation........................................................... 20, 25, 169
[Forcible Break]command................................................. 67
[Installation Directories]dialog box................................... 33
[Function Focus]command................................................ 84
Instruction set help file...................................................... 45
[Function step]command................................................... 67
Interface Board for PC/AT Series.................................... 157
Functional Specifications ................................................ 154
Interface board-installation.................................. 26, 46, 156
G
Interrupting Installation..................................................... 35
J
G command ............................................................... 81, 145
Global Symblos ............................................................... 131
[Jump]command ............................................................. 104
[Go]command ................................................................... 67
[Jump Frame no.]dialog box ........................................... 128
H
K
H command ................................................................... 149
K command ................................................................... 150
Hardware........................................................................... 16
[Keyword Search]command.............................................. 73
[Hardware breakpoins]command .................................... 101
KILL command.............................................................. 152
[Hardware Breakpoint]dialog box................................... 127
L
Hardware-Related Commands......................................... 147
HELP command ........................................................... 149
[Help contents]command .................................................. 73
help file ............................................................................. 45
INDEX
L command.................................................................... 145
LALL command............................................................. 151
Left button drag................................................................. 78
163
[Line no]command ............................................................ 83
MEM command............................................................. 151
Line Numbers.................................................................. 134
Memo Commands ........................................................... 151
Linking.............................................................................. 56
MEMO.PT ................................................................ 45, 107
LIST command ............................................................. 151
[Memory]command........................................................... 91
[Load]command .......................................................... 64, 87
[Memory]window.............................................................. 88
[Load Setting]command.................................................. 101
Local menu ............................................................ 69, 89
Load the Debugger ............................................................ 51
Mouse Operations ........................................................ 89
Loading User Program Commands ................................. 145
Shortcut Keys............................................................... 88
Local menu........................................................................ 68
[Memo]window............................................................... 107
Local menu
Local menu .......................................................... 70, 109
[BackTrace]window............................................... 70, 97
Shortcut Keys............................................................. 107
[Break]window .................................................... 70, 101
Menus ............................................................................... 64
[Code]window........................................................ 68, 83
Message file ...................................................................... 44
[Command]window ............................................... 68, 87
Miscellaneous.................................................................... 19
[Inspect]window................................................... 71, 106
MLIST command .......................................................... 152
[Local]window....................................................... 69, 95
MLIST> command........................................................ 152
[Memory]window .................................................. 69, 89
Model-specific definition file.......................... 39, 45, 46, 52
[Memo]window.................................................... 70, 109
[Module]command...................................................... 64, 83
[RAM Monitor]window....................................... 71, 111
[Module]dialog box......................................................... 122
[Register]window................................................... 69, 91
MON101C.EX ............................................................ 44, 48
[Stack]window....................................................... 69, 92
Monitor program ............................................................... 44
[Trace]window..................................................... 71, 104
Mouse Operations ....................................................... 77, 78
[Watch]window...................................................... 70, 99
[BackTrace]window..................................................... 97
Local Symbols................................................................. 132
[Break]window .......................................................... 102
[Local]window .................................................................. 94
[Code]window ............................................................. 84
Local menu............................................................. 69, 95
[Inspect]window ........................................................ 106
Mouse Operations ........................................................ 95
[Local]window............................................................. 95
Shortcut Keys............................................................... 94
[Memory]window ........................................................ 89
Logging/Running Batch Commands ............................... 151
[Register]window......................................................... 91
[Long Floats]command ..................................................... 89
[Watch]window ........................................................... 99
LP command ................................................................. 145
N
M
N command................................................................... 149
M command................................................................... 149
Necessary Hardware.......................................................... 11
Macro Commands ........................................................... 152
Necessary Software ........................................................... 12
Macros .............................................................................. 15
NEM101C.HLP................................................................. 45
[Main]window................................................................... 61
[Next]command ................................................................ 66
[Make sequential breakpoint condition 1]command ....... 101
NLIST command........................................................... 151
[Make sequential breakpoint condition 2]command ....... 101
Numerical Values............................................................ 133
INDEX
164
O
[Register]dialog box........................................................ 125
[Register]window.............................................................. 90
[Offset]command .............................................................. 95
Local menu ............................................................ 69, 91
On-the-Fly Support ..................................................... 15, 19
Mouse Operations ........................................................ 91
Operators......................................................................... 141
Shortcut Keys............................................................... 90
[Option]dialog box............................................................ 47
OPTION command....................................................... 151
[Reload]command....................................................... 64, 87
REPEAT{ command..................................................... 152
[Option Set]command ....................................................... 73
[Reset]command ......................................................... 64, 87
[Options]menu .................................................................. 73
RESET command......................................................... 145
Other Files......................................................................... 45
[Resize]command.............................................................. 73
P
Right button click.............................................................. 77
P command................................................................ 84, 145
ROM and RAM................................................................. 17
Package Contents ................................................................ 9
Run Installation Program .................................................. 27
[Paste]command.................................................. 65, 87, 109
[Run]menu ........................................................................ 67
[PC Location]command .................................................... 83
Running User Program Commands................................. 145
Performance Evaluation Functions.................................... 15
S
PF/PRINTF command ................................................. 149
S command ................................................................... 149
PICE101C.ENV ................................................................ 44
SALL command ............................................................ 151
PICE101C.ENV .................................. 39, 41, 45, 46, 48, 52
[Save Setting]command .................................................. 101
Powerful Data Display/Editing Functions ......................... 14
Save setup ......................................................................... 37
Predefined Symbols......................................................... 152
Create a New Environment .......................................... 40
Preface................................................................................. 8
Modifying an Existing Environment............................ 43
Preparing for installation................................................... 26
PRMPT command ........................................................ 151
PROF command........................................................... 147
Upgrading from MS-DOS<R>Version ........................ 42
Saving[Command History]window contents..................... 45
Saving[Memo]window contents........................................ 45
PT101C.DAT .................................................................... 45
Scope of C Variables....................................................... 140
R
Screen Control/Miscellaneous Commands...................... 151
R command ................................................................... 148
Screen Display .................................................................. 62
[Radix]command............................................................. 106
Screen Layout.................................................................... 60
Radix Command ............................................................. 149
[Search]menu .................................................................... 66
[RAM Monitor]window .................................................. 110
[Select Color]command..................................................... 73
Local menu........................................................... 71, 111
Select working directory.................................................... 37
Shortcut Keys............................................................. 110
Creating a New Environment....................................... 39
[Range]command ............................................................ 106
Upgrading from MS-DOS Version .............................. 41
RD command ................................................................ 149
[Set Data]dialog box ....................................................... 125
Reading/Writing Files ..................................................... 149
[Set Inspect data]dialog box............................................ 121
README.WRI ................................................................. 27
[Set line no.]dialog box ................................................... 122
Real-Time Tracing Commands ....................................... 146
[Set Software Break point]command ................................ 67
INDEX
165
[Set Software Breakpoint]dialog box .............................. 127
[Status Bar]command........................................................ 66
Set Up Environment.......................................................... 37
Status Bar........................................................................ 116
Creating a New Environment....................................... 39
Strings ............................................................................. 135
Modifying an Existing Environment............................ 43
Structural Elements ........................................................... 60
Upgrading from MS-DOS Version .............................. 41
[Symbol]command............................................................ 91
[Set Watch data]dialog box............................................. 121
[Symbols]command .......................................................... 92
Setting Options................................................................ 151
Symbols........................................................................... 131
[Short Floats]command ..................................................... 89
System Commands.......................................................... 149
Shortcut Keys .................................................................... 74
T
[BackTrace]window..................................................... 96
[Break]window .......................................................... 100
[Code]window.............................................................. 81
[Command]window ..................................................... 85
[Inspect]window......................................................... 105
[Local]window............................................................. 94
[Memory]window ........................................................ 88
[Memo]window.......................................................... 107
[RAM Monitor]window............................................. 110
[Register]window......................................................... 90
[Stack]window............................................................. 92
[Trace]window........................................................... 103
[Watch]window............................................................ 98
[Single step]command....................................................... 67
SM command................................................................ 147
Software ............................................................................ 17
[Source]command ....................................................... 83, 97
Specify starting options
Create a New Environment .......................................... 40
Modify an Existing Environment................................. 43
Upgrading from MS-DOS<R>Version ........................ 42
[Stack]window .................................................................. 92
Local menu............................................................. 69, 92
T command ............................................................... 84, 145
TD command ................................................................ 146
TDW command............................................................. 146
TG command ................................................................ 147
TI command .................................................................. 147
[Tile]command.................................................................. 72
TIME command ............................................................ 151
TM command ................................................................ 147
[Tool Bar]command .......................................................... 66
[Tool Bar]dialog box....................................................... 118
Tool Bar .......................................................................... 112
Tool Bar Configuration ................................................... 112
[Top]command.......................................................... 83, 104
Trace Functions................................................................. 15
[Trace Go/Trace Stop]command ..................................... 104
[Trace]window ................................................................ 103
Local menu .......................................................... 71, 104
Shortcut Keys............................................................. 103
Tracing .............................................................................. 18
TRIG command ............................................................ 147
TS command................................................................. 147
U
Shortcut Keys............................................................... 92
U command......................................................... 81, 82, 150
[Start]menu ....................................................................... 31
UEND command........................................................... 150
Starting Options ................................................................ 47
[Undo]command ....................................................... 65, 109
Specifying Starting Options via Command Line.......... 48
[Until Return]command .................................................... 67
Specifying Starting Options via Dialog Box ................ 47
UPOP command........................................................... 150
Starting options file........................................................... 44
UPUSH command ........................................................ 150
INDEX
166
User Customization........................................................... 14
WICE101C.INI............................................................ 44, 48
[User Save]command ........................................................ 72
Window
[User1]command............................................................... 72
Specific Mouse Operations .......................................... 78
[User2]command............................................................... 72
Specific Shortcut Keys................................................. 76
[User3]command............................................................... 72
[Window Bar]command.................................................... 66
Using Debugger for First Time.......................................... 36
Window Bar .................................................................... 115
UX command ................................................................ 150
Window Commands.......................................................... 59
V
[Window]menu ................................................................. 72
Windows 95 Installation.................................................... 31
V command......................................................... 81, 82, 150
VAL command.......................................................... 82, 151
[View]command.............................................................. 106
[View]menu ...................................................................... 66
W
Windows initialization file ................................................ 44
Windows V3.1 Installation................................................ 28
WM command............................................................... 150
[Word]command ............................................................... 89
Working directory ............................................................. 37
WR command ............................................................... 149
W command .............................................................. 81, 150
W? command................................................................ 150
WAIT command............................................................ 151
X
X command ................................................................... 150
[Watch]command.......................................... 83, 95, 99, 106
Y
[Watch]window................................................................. 98
Local menu............................................................. 70, 99
Mouse Operations ........................................................ 99
Y command ................................................................... 150
Z
Shortcut Keys............................................................... 98
WHILE{ command........................................................ 152
WICE101C.HLP ............................................................... 45
INDEX
[Zero]command................................................................. 91
[Zoom in/out]command .................................................. 111
MN101C00 Series
C Source Code Debugger for Windows®
User’s Manual
October, 1999 1st Edition 2nd Printing
Issued by Matsushita Electric Industrial Co., Ltd.
© Matsushita Electric Industrial Co., Ltd.
Semiconductor Company Matsushita Electronics Corporation
Nagaokakyo, Kyoto, 617-8520 Japan
Tel: (075) 951-8151
http://www.mec.panasonic.co.jp
SALES OFFICES
■ HONG KONG SALES OFFICE
■ U.S.A. SALES OFFICE
Panasonic Industrial Company
[PIC]
● New Jersey Office:
2 Panasonic Way, Secaucus, New Jersey 07094
Tel: 201-392-6173
Fax: 201-392-4652
● Milpitas Office:
1600 McCandless Drive, Milpitas, California 95035
Tel: 408-945-5630
Fax: 408-946-9063
● Chicago Office:
1707 N. Randall Road, Elgin, Illinois 60123-7847
Tel: 847-468-5829
Fax: 847-468-5725
● Atlanta Office:
1225 Northbrook Parkway, Suite 1-151,
Suwanee, Georgia 30174
Tel: 770-338-6940
Fax: 770-338-6849
● San Diego Office:
9444 Balboa Avenue, Suite 185
San Diego, California 92123
Tel: 619-503-2940
Fax: 619-715-5545
■ CANADA SALES OFFICE
Panasonic Canada Inc.
[PCI]
5700 Ambler Drive Mississauga, Ontario, L4W 2T3
Tel: 905-624-5010
Fax: 905-624-9880
■ GERMANY SALES OFFICE
Panasonic Industrial Europe G.m.b.H.
● Munich Office:
Hans-Pinsel-Strasse 2 85540 Haar
Tel: 89-46159-156
Fax: 89-46159-195
[PIEG]
■ U.K. SALES OFFICE
Panasonic Industrial Europe Ltd.
[PIEL]
● Electric component Group:
Willoughby Road, Bracknell, Berkshire RG12 8FP
Tel: 1344-85-3773
Fax: 1344-85-3853
■ FRANCE SALES OFFICE
Panasonic Industrial Europe G.m.b.H.
● Paris Office:
270, Avenue de President Wilson
93218 La Plaine Saint-Denis Cedex
Tel: 14946-4413
Fax: 14946-0007
[PIEG]
■ ITALY SALES OFFICE
Panasonic Industrial Europe G.m.b.H.
● Milano Office:
Via Lucini N19, 20125 Milano
Tel: 2678-8266
Fax: 2668-8207
[PIEG]
Panasonic Shun Hing Industrial Sales (Hong Kong)
Co., Ltd.
[PSI(HK)]
11/F, Great Eagle Centre, 23 Harbour Road,
Wanchai, Hong Kong.
Tel: 2529-7322
Fax: 2865-3697
■ TAIWAN SALES OFFICE
Panasonic Industrial Sales Taiwan Co.,Ltd.
[PIST]
● Head Office:
6th Floor, Tai Ping & First Building No.550. Sec.4,
Chung Hsiao E. Rd. Taipei 10516
Tel: 2-2757-1900
Fax: 2-2757-1906
● Kaohsiung Office:
6th Floor, Hsien 1st Road Kaohsiung
Tel: 7-223-5815
Fax: 7-224-8362
■ SINGAPORE SALES OFFICE
Panasonic Semiconductor of South Asia
300 Beach Road # 16-01
The Concourse Singapore 199555
Tel: 390-3688
Fax: 390-3689
[PSSA]
■ MALAYSIA SALES OFFICE
Panasonic Industrial Company (Malaysia) Sdn. Bhd.
● Head Office:
[PICM]
Tingkat 16B Menara PKNS PJ No.17,Jalan Yong
Shook Lin 46050 Petaling Jaya Selangor Darul Ehsan
Malaysia
Tel: 03-7516606
Fax: 03-7516666
● Penang Office:
Suite 20-17,MWE PLAZA No.8,Lebuh Farquhar,10200
Penang Malaysia
Tel: 04-2625550
Fax: 04-2619989
● Johore Sales Office:
39-01 Jaran Sri Perkasa 2/1,Taman Tampoi
Utama,Tampoi 81200 Johor Bahru,Johor Malaysia
Tel: 07-241-3822
Fax: 07-241-3996
■ CHINA SALES OFFICE
Panasonic SH Industrial Sales (Shenzhen)
Co., Ltd.
[PSI(SZ)]
7A-107, International Business & Exhibition Centre,
Futian Free Trade Zone, Shenzhen 518048
Tel: 755-359-8500
Fax: 755-359-8516
Panasonic Industrial (Shanghai) Co., Ltd.
[PICS]
1F, Block A, Development Mansion, 51 Ri Jing Street,
Wai Gao Qiao Free Trade Zone, Shanghai 200137
Tel: 21-5866-6114
Fax: 21-5866-8000
■ THAILAND SALES OFFICE
Panasonic Industrial (Thailand) Ltd.
[PICT]
252/133 Muang Thai-Phatra Complex Building,31st
Fl.Rachadaphisek Rd.,Huaykwang,Bangkok 10320
Tel: 02-6933407
Fax: 02-6933423
080499