1
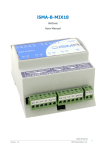
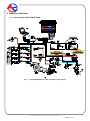
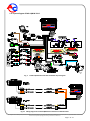
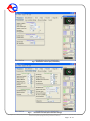
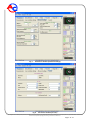
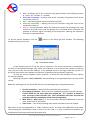
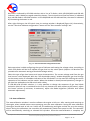
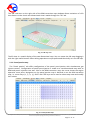
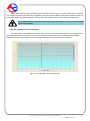
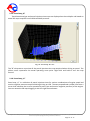
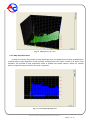
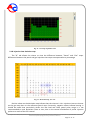
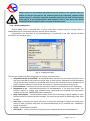
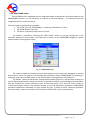
Controller User Manual (information contained in this manual is also available in the diagnostics software help system and at the www.ac.com.pl Website) Version 1.4 2014-02-24 Manufacturer: AC Spółka Akcyjna. 15-181 Białystok, ul. 42 Pułku Piechoty 50, Poland phone +48 85 7438117, fax +48 85 653 8649 www.ac.com.pl, e-mail: [email protected] AC S.A. all rights reserved. Under penalty of law and/or liability claims it is forbidden to copy, publish, distribute, make available and/or use in any way all or any part of information contained within this document, in particular photographs, drawings, illustrations, trademarks, etc Page 1 of 42 Table of contents 1. Controller installation ..................................................................................................................... 3 1.1. Layout diagram STAG-4 QBOX BASIC ............................................................................ 3 1.2. Layout diagram STAG-4 QBOX PLUS .............................................................................. 4 1.3. Semi-sequential control ....................................................................................................... 5 1.4. Full-group control ................................................................................................................ 5 1.5. Mounting the controller STAG-4 QBOX ............................................................................ 5 1.6. Selection of pressure regulator ............................................................................................ 5 1.7. Selection of injector nozzles ................................................................................................ 6 2. The AC STAG diagnostic program ................................................................................................ 6 2.1. Controller-computer connection .......................................................................................... 6 2.2. AC STAG version................................................................................................................ 9 2.3. Main menu ........................................................................................................................... 9 2.4. Controller Parameters ........................................................................................................ 11 2.5. Signals, ingectors, LED switchboard................................................................................. 15 2.6. Auto-calibration ................................................................................................................. 17 2.7. Oscilloscope ....................................................................................................................... 18 2.8. Errors ................................................................................................................................. 19 2.8.1. Errors of the gas controller ......................................................................................... 20 2.8.2. Gas controller message ............................................................................................... 21 2.8.3. Errors of the ECU ....................................................................................................... 22 2.9. Multiplier map ................................................................................................................... 23 2.9.1. Multiplier adjustment.................................................................................................. 25 2.10. RPM correction map ........................................................................................................ 26 2.11. Petrol portion map ........................................................................................................... 27 2.12. Gas temperature correction map ...................................................................................... 28 2.13. Reducer temperature correction map ............................................................................... 29 2.14. Gas pressure correction map ............................................................................................ 29 2.15. Petrol map „B” ................................................................................................................. 30 2.16. Petrol map „G” ................................................................................................................ 30 2.17. Map acquistion state ........................................................................................................ 31 2.18. Injection time deviation map ........................................................................................... 32 2.19. ISA2 autoadaptation ........................................................................................................ 33 2.19.1. ISA2 correction map ............................................................................................... 34 2.20. OBDII/EOBD reader ....................................................................................................... 35 2.21. Controller update ............................................................................................................. 36 3. STAG-4 QBOX controller programming ..................................................................................... 37 3.1. Auto-calibration ................................................................................................................. 37 3.2. Collection of the petrol injection map with petrol (petrol map) ........................................ 37 3.3. Collection of the petrol injection map with LPG (LPG map) ........................................... 37 3.4. Checking if maps match, verification of deviations .......................................................... 38 3.5. Controller manual setting .................................................................................................. 38 3.6. LPG temperature correction .............................................................................................. 38 4. LED switchboard operation and acoustic signals (User Manual) ............................................... 39 4.1. LED-300 switchboard ........................................................................................................ 39 4.2. LED-300/401B and LED-401 switchboard ....................................................................... 40 4.3. Automatic calibration of LPG level indicator ................................................................... 41 4.4. Acoustic signals ................................................................................................................. 41 4.5. Emergency start on gas ...................................................................................................... 41 5. Technical specifications................................................................................................................ 41 6. Warranty, restrictions, exclusions................................................................................................. 42 AC S.A. all rights reserved. Under penalty of law and/or liability claims it is forbidden to copy, publish, distribute, make available and/or use in any way all or any part of information contained within this document, in particular photographs, drawings, illustrations, trademarks, etc Page 2 of 42 1. Controller installation 1.1. Layout diagram STAG-4 QBOX BASIC Fig. 1 STAG-4 QBOX BASIC controller installation layout diagram AC S.A. all rights reserved. Under penalty of law and/or liability claims it is forbidden to copy, publish, distribute, make available and/or use in any way all or any part of information contained within this document, in particular photographs, drawings, illustrations, trademarks, etc Page 3 of 42 1.2. Layout diagram STAG-4 QBOX PLUS Fig. 2 STAG-4 QBOX PLUS controller installation layout diagram Fig. 2a Wiring diagram for STAG-4 QBOX PLUS connection to OBD interface. AC S.A. all rights reserved. Under penalty of law and/or liability claims it is forbidden to copy, publish, distribute, make available and/or use in any way all or any part of information contained within this document, in particular photographs, drawings, illustrations, trademarks, etc Page 4 of 42 1.3. Semi-sequential control Fig. 3 Semi-sequential control layout diagram 1.4. Full-group control Fig. 4 Full-group control layout diagram 1.5. Mounting the controller STAG-4 QBOX STAG-4 QBOX controller must not be installed in a place exposed to high temperatures and/or damp. 1.6. Selection of pressure regulator Install the controller according to the layout show in Fig. 1 or Fig. 2. In a sequential injection system, pay attention to select a pressure regulator properly matched to the given car engine power and injector nozzles. A pressure regulator that is poorly matched to the car engine power will not be able to provide sufficient supply of gas at large demand (fully open throttle) and to maintain nominal gas pressure within the system. Should gas pressure drop below some preset low threshold, the controller will automatically switch to petrol. AC S.A. all rights reserved. Under penalty of law and/or liability claims it is forbidden to copy, publish, distribute, make available and/or use in any way all or any part of information contained within this document, in particular photographs, drawings, illustrations, trademarks, etc Page 5 of 42 1.7. Selection of injector nozzles Injector nozzles diameter must also be matched to the given car engine power, see the table below. Power per cylinder is engine power divided by number of cylinders in the engine. Nozzle diameter [mm] reducer pressure 1 [bar] 1,7 … 1,8 1,9 … 2,2 2,3 … 2,5 2,6 … 2,8 2,9 … 3,0 3,1 … 3,2 Power per cylinder range [KM] 11 … 16 17 … 28 29 … 34 35 … 40 41 … 48 49 … 55 The above rough values may in some cases not correspond to actual values. 2. The AC STAG diagnostic program 2.1. Controller-computer connection Using a RS, USB or Bluetooth+ link connect the vehicle-installed STAG-4 QBOX BASIC controller with a PC computer on which the Ac Stag diagnostic program is to be run. Turn the vehicle ignition switch ON to supply the controller with power before launching the program. This step is required since no communication with the controller is possible while it is in sleep mode into which it is automatically turned about 10 minutes after its power is disconnected. As soon as the program is started, the controller links with it (provided the correct COM serial port is selected). Successful communication is confirmed by the „Status: No ignition switch”, „Status: Waiting for gas”, „Status: Petrol” or „Status: Gas” message displayed at the bottom left corner of the program screen. Parameters window and tabs are presented on figures 5 ÷ 8. If you get the “Controller Error” message and “No connection” appears in the lower left corner of the screen, select a different COM port from the Port menu at the top of the screen. AC S.A. all rights reserved. Under penalty of law and/or liability claims it is forbidden to copy, publish, distribute, make available and/or use in any way all or any part of information contained within this document, in particular photographs, drawings, illustrations, trademarks, etc Page 6 of 42 Fig. 5 Parameters window (Car parameters) Fig. 6 Parameters window (Gas controller settings) AC S.A. all rights reserved. Under penalty of law and/or liability claims it is forbidden to copy, publish, distribute, make available and/or use in any way all or any part of information contained within this document, in particular photographs, drawings, illustrations, trademarks, etc Page 7 of 42 Fig. 7 Parameters window (Advanced settings) Fig. 8 Parameters window (Car info) AC S.A. all rights reserved. Under penalty of law and/or liability claims it is forbidden to copy, publish, distribute, make available and/or use in any way all or any part of information contained within this document, in particular photographs, drawings, illustrations, trademarks, etc Page 8 of 42 2.2. AC STAG version After the diagnostic application startup, the version info is presented on its top bar; the examples (figure 5-8) present version 0.14.7. 2.3. Main menu The main menu consists of the following options: Port – options may be used to select a COM port, set-up the communication link, terminate communication with the controller. Window – options may be used to open program screens (such as: oscilloscope, monitor parameters, monitor ISA2, reader OBD) if they have been closed. Language – options may be used to select user interface language version. Tools –option may be used to update hardware devices, setup program settings, load stored settings , store modified settings , restore default (factory) settings . Help –options may be used to display info on the program/the controller and documentation (including this manual). To bring up the About gas ECU window, select “Gas controller info” in the Help menu. Fig. 9 Gas controller info window The Gas controller info window Błąd! Nie można odnaleźć źródła odwołania.(Fig. 9) shows the following parameters: ECU working time: AC S.A. all rights reserved. Under penalty of law and/or liability claims it is forbidden to copy, publish, distribute, make available and/or use in any way all or any part of information contained within this document, in particular photographs, drawings, illustrations, trademarks, etc Page 9 of 42 Fuel – working time of the controller using petrol listed in the following format: H – hours, M – minutes, S – seconds. Since last connection – working time of the controller using petrol since its last connection with a PC. Gas – total working time of the controller using LPG. Since last connection – working time of the controller using LPG since its last connection with a PC. Service – Service Schedule. When the controller reaches the working time using LPG set in this field, every time the ignition key is switched-off the controller will produce an acoustic signal reminding of the inspection. Clearing the Inspection Schedule is explained below. To set the Service Schedule, click the window will pop up (Fig. 10): button in the About gas ECU window. The following Fig. 10 Service set window. In that window you can set up the time to inspection. The time to inspection is computed on the basis of the selected mileage, after which the inspection is to be carried out. Default conversion rate is 1h per 50 km, but you can modify it. In the example shown in the figure 1000 km and the 1 h per 50 km conversion rate translate into 20 hours of operation to the nearest inspection. To clear the service schedule, select “Inactive”, in which case the controller will not monitor the service schedule. Selecting the option "LPG / CNG lock" prevent driving on the gas beyond the set time of the review. Below the working times, the Controller Info lists the following types of registered events: First PC connection – date of the first controller-PC connection. First change of settings – date of the first modufication of the controller settings. If these fields do not show dates but instead the „???” symbols, it means an error occurred in the Controller Info. Time information has been lost and the controller will start counting the times from the beginning. Mod. date 1 ÷ Mod. date 5 – a list of controller settings modifications. From the most recent ones till the oldest. Clear errors – Time stamp showing when some controller error was cleared. Each event is also accompanied by a “code” linked to the PC on which the modification was made. Thus knowing the modification date as well as the PC code, it is easy to determine whether any modifications have been performed by anyone else. AC S.A. all rights reserved. Under penalty of law and/or liability claims it is forbidden to copy, publish, distribute, make available and/or use in any way all or any part of information contained within this document, in particular photographs, drawings, illustrations, trademarks, etc Page 10 of 42 The bottom of this window shows additional information: ECU S/N – the serial number of the controller. Your PC code – The code of the PC on which the AcStag software is currently used. 2.4. Controller Parameters The controller firmware version is shown at the bottom of the screen (Fig.5); Text presented on the exemplary figure means he following: STAG-4 QBOX PLUS – controller model 2.0.1 - controller firmware version number 33.1.0 –controller version number The Parameters window lists a number of parameters which need to be set individually for each vehicle. The Car parameters group contains: Number of cylinders – number of engine cylinders. Engine type – engine type, Standard – normally aspirated engine with no supercharger, Turbo – supercharged engine, Valvetronic. Source of RPM signal – engine speed signal source: Ignition Coil: ignition coil (standard option). Set the number of cylinders per one coil for correct data presentation. Camshaft: timing belt sensor. This option is very useful in vehicles, in which cylinders are switched off in the cut-off state and lack of ignition coil pulses might be interpreted by the controller as zero engine speed. CAUTION Use that option only with a digital sensor of the timing belt. Define number of pulses per one engine revolution. Option active while a timing belt digital sensor feeds engine speed pulses to the controller: specifies the number of pulses per one engine revolution. Parameter value must be adjusted for correct engine speed readings in the controller. Petrol injection pulses - In older cars the engine speed brown wires need not to be connected since the controller can calculate current speed from injection pulses. When RPM readings are disrupted (RPM changes significantly, but the engine operation is stable), specify the minimum injection pulse time to ensure filtering the extra-injection pulses and stabilize the RPM readings. RPM signal – RPM signal source RPM detection threshold in Volts. Set the detection threshold to a value ensuring proper revolutions reading from the controller. E.g. for impulses originating in a petrol engine usually equal app. 5 [V], set the detection threshold to app. 2,5 [V]. For impulses originating from the ignition coil, set the threshold to app. 7 [V]. Nissan Micra is an exception. Its computer ignition impulses equal app. 1,4 [V], in which case the detection threshold needs to be set at app. 1,0 [V]. For some Renault Megan models, the detection setting needs to be set at app. 10 [V] AC S.A. all rights reserved. Under penalty of law and/or liability claims it is forbidden to copy, publish, distribute, make available and/or use in any way all or any part of information contained within this document, in particular photographs, drawings, illustrations, trademarks, etc Page 11 of 42 RPM signal filter – Switching on (YES) and switching off (NO) of RPM signal filtration. In case of cars from the U.S.A., correct reading of RPM value can be difficult, so this option should be switched on. In other cases, it should be switched off. Lambda sensor 1 – Available options: - Voltage – standard voltage probe, - UEGO – UEGO wide-band current probe, - Sensor is not connected – no probe, - Reverse voltage – reverse action voltage probe. Lambda sensor 2 – Available options: - Voltage – standard voltage probe - Sensor is not connected – no probe, - Reverse voltage – reverse action voltage probe. Injection type – type of injection used in the car, - Standard – standard indirect injection, petrol injectors with no current limit. - Renix – indirect injection system, petrol injectors with “Renix” current limit. Inj. Control type - type of petrol injectors control: - Standard – standardowe sterowanie sekwencyjne - Doubling – petrol injectors are controlled in pairs, i.e. 2 injectors are controlled from a single channel in the petrol controller. The Gas controller settings window lists the following groups of parameters: Switch-over to gas – parameters related to switching from petrol to LPG. Fuel type – type of fuel in the LPG system (LPG or CNG). Switch-over threshold – engine rpm required for the controller to switch to LPG. For rpm set to <700, the controller switches to LPG at idle run. Switch-over time – time after starting the engine when the controller can switch to LPG. Reducer filling time - delay between opening solenoid valve and gas injectors. The function used to pre-fill the system with gas. Switch-over temp. – time after starting the engine when the controller can switch to LPG. Cylinder switch-over – time elapsing between the switching of subsequent cylinders. E.g. with the setting at 200[ms] for a 4-cylinder engine, the switching from petrol to LPG or LPG to petrol will take 4*200[ms]. This works regardless of whether the petrol injection system is the so-called full sequence or not. Setting the switching time to 0 will result in the switching from petrol to LPG or vice versa and turning on and off of the solenoid valves without any delay. Hot start – if checked, warm engine may be started directly from LPG. Check that option also in vehicles equipped with the Start/Stop function, e.g. Fiats. Switching to gas sound – checking the option will result in a beep upon switching to gas fueling. Petrol switch-over - parameters related to switching from petrol to LPG. Min gas RPM – min rpm; when lower, the controller will switch over to petrol. Max gas RPM – engine rpm; when higher, the controller will switch to petrol. Pressure error delay – amount of time with the LPG pressure lower than minimal before the controller switches to petrol and reports: “LPG pressure too low”. AC S.A. all rights reserved. Under penalty of law and/or liability claims it is forbidden to copy, publish, distribute, make available and/or use in any way all or any part of information contained within this document, in particular photographs, drawings, illustrations, trademarks, etc Page 12 of 42 Intelligent press. drop service – the function allows to utilize gas residues in the LPG tank. Min. gas temp. – min. LPG temperature; when lower, the controller will switch over to petrol. Max load on gas – the maximum load value in the LPG mode, above which the controller switches to petrol. This option is very useful for the engines in the case of which petrol injectors can be fully opened. In such a situation, the LPG controller can only open LPG injectors permanently as well. However, corrections, e.g. resulting from changes in the LPG pressure, will be no longer possible. The moment when petrol injectors are fully open corresponds to the load value of 100 [%]. If petrol injectors become fully open, the “Max. load on gas” parameter should be set to approximately 95 [%]. This will result in the controller switching to petrol before full opening of LPG injectors. Calibration parameters – parameters related to controller calibration. Operational pressure – LPG pressure at which the controller was calibrated. This setting can be altered manually. However, each change of the operational LPG pressure requires multiplier map calibration!!! Minimum pressure – when the pressure is lower than minimum, the controller will switch to petrol if the duration of min. pressure exceeds the Pressure error delay. Gas temp. – gas temperature at which the controller was calibrated. It is impossible to manually change this parameter. Remaining parameters in the LPG Controller Settings group: Gas injector type – type of the LPG injector. Changing the injector type requires re-autocalibration or multiplier map calibration!!! Clicking the Gas Injectors Settings button in which the LPG injectors can be calibrated: Fig. 11 will open up the following window Gas injectors settings window Gas injectors corrections - Per cent correction of gas-air mixture injected by gas injectors to each engine cylinder. Injector opening correction – the window allows configuration of very precise, absolute correction of gas injector. Unlike the percentage correction, it is constant and not dependent on time. It is ideal for compensating differences in performance of injection rails resulting from their mechanical properties. AC S.A. all rights reserved. Under penalty of law and/or liability claims it is forbidden to copy, publish, distribute, make available and/or use in any way all or any part of information contained within this document, in particular photographs, drawings, illustrations, trademarks, etc Page 13 of 42 The procedure: having auto-calibrated the controller, check petrol injection times in individual engine cylinders. Turn one gas injector at a time to check cylinders, in which the times differ after switching from petrol to LPG. If necessary, adjust per cent correction factors so that the times do not change after switching to LPG. WARNING!!! Use this option as a last resort, i.e. when sure that the installation was performed properly, all mechanical issues have been eliminated and injection times variations for given injectors are still present when using LPG. Do not ever use injection strip-collector pipes of different lengths and then the injectors’ calibration to accommodate this difference!!! Also never use this option when the system is not in a perfect working condition or when some of its elements have worn out. Using this option in a manner not consistent with the above instructions may result in damage to the car!!! Injection sequence – Here you can freely configure the injection sequence (which petrol injector is to control respective gas injector). Reducer temperature sensor – pressure regulator temperature sensor type selection. Gas temp. sensor – gas temperature sensor type selection. Extra-injection off threshold – petrol injection pulses shorter than the set value will be ignored by the controller (gas injection pulses will not be generated for them). Intelligent extra-injection handling – checking the option will result in leaning of the post-injection pulses. It should be used for extra-injection pulses that are too long to omit them with the option of “Extra-injection switch-off threshold”. For the option to perform correctly, the injection pulses must not be the source of RPM signal. In some Mazda cars, injection strategy varies from time to time to resemble semisequential injection, which may cause the effect of “jerking”. It is recommended to activate the “Intelligent extra-injection handling” for such cars. Parameters in the OBD group – settings of the connection between the controller with the onboard diagnostic interface (available in STAG-4 QBOX PLUS controller): Configuration – selecting the “OBD reader” option results in an attempt to connect to the onboard diagnostic interface after each key switching, if the controller operates in Auto mode. The Advanced settings group offers the following options: Emergency starts – check to restrict the number of permitted emergency start-ups on LPG and enter that limit into the “Allowed” textbox. The number of the start-ups already done in the past is displayed in the “Performed” field. You can reset that counter using the “Clear” button. Once the pre-set limit is exceeded you will not be able to start the engine on LPG (in emergency mode). Injectors heating – check to enable warming up gas injectors when vehicle was parked a longer time at freezing temperatures. Active procedure is marked with a red line displayed on the oscilloscope screen and with blinking gas injector icon in the parameters monitor window. AC S.A. all rights reserved. Under penalty of law and/or liability claims it is forbidden to copy, publish, distribute, make available and/or use in any way all or any part of information contained within this document, in particular photographs, drawings, illustrations, trademarks, etc Page 14 of 42 Petrol portion – a set of options to allow automatic modification of petrol share map so that: for rpm higher than the value set in the “minimum rpm” field and injection pulses longer than the value set in the "minimum petrol injection time" field, gas injection will be supported with petrol injection pulse equal to the value of the “petrol adding time” field. Pressure release – in the course of driving, when gas injectors are not controlled (e.g. in the cut-off status), gas pressure in the gas controller may rise. If this option is on, when pressure exceeds the set value (Switch-over threshold), the controller will start a procedure to bring it down. The procedure is switched off when the pressure drops down to 1.5 bar. Pulse frequency parameter controls the frequency of the injectors opening. Leaning on cold engine – the cold leaning option allows eliminating the effect of jerking as a result of gas overflowing to the cold engine. The problem occurs in certain vehicle models. If necessary, set the parameters as follows: Max. engine temperature threshold should be close to the engine temperature, at which jerking stops. NOTE: Engine temperature threshold influences the time of function operation. Always note if the ratio represents a rich fuel mixture for the warmed engine under high load. Failure to follow this note may result in engine damage! Max. rpm threshold should be set by experience so that there is no power drop under maximum acceleration at higher rpm and there is a rich air-to-fuel mixture in open loop conditions. Max. gas injection time is set when driving on cold engine so that sudden pressing of the acceleration pedal does not cause jerking, while keeping the maximum dynamic performance of the vehicle, Pre-filling system – if the option is activated, turning the key switch will open the solenoid shortly to prefill the system with gas. The Car info window lists the following groups of parameters: Gas installation fitter – contact details of the installation of a gas fitter. Car info – car data, which was mounted the gas installation. Gas installation – general information about the components of the gas installation. 2.5. Signals, ingectors, LED switchboard On the right side of the window (Fig.5) there are the “Monitor” windows. The “Monitor” window shows the following signals measured by the controller: Gas pressure [bar] – LPG/CNG pressure value (the difference in the pressure regulator pressure and the suction collector pressure) MAP pressure [bar] – pressure inside the suction collector (absolute pressure value) Injection time [ms] – petrol injection time - Petrol 1 – Petrol injection time for Injector 1 - Petrol 2 – Petrol injection time for Injector 2 - Petrol 3 – Petrol injection time for Injector 3 - Petrol 4 – Petrol injection time for Injector 4 AC S.A. all rights reserved. Under penalty of law and/or liability claims it is forbidden to copy, publish, distribute, make available and/or use in any way all or any part of information contained within this document, in particular photographs, drawings, illustrations, trademarks, etc Page 15 of 42 Gas injection dose [ms] – Gas injection time - Gas 1 – Gas injection time for Injector 1 - Gas 2 – Gas injection time for Injector 2 - Gas 3 – Gas injection time for Injector 3 - Gas 4 – Gas injection time for Injector 4 Gas temperature[°C] – LPG temperature at the pressure regulator output Reducer temperature [°C] – liquid temperature at the reducer Internal temperature [°C] – internal temperature in controller Lambda 1 voltage [V] – voltage at the lambda probe 1 Current type oxygen sensor 1 [mA] – current in the wide-band probe Lambda 2 voltage [V] – voltage at the lambda probe 2 Battery [V] – voltage at the controller’s power supply RPM [rpm] – engine revolutions Engine load – current engine load value expressed in per cent. All the above described signals are also visible on the oscilloscope. To turn off a given signal on the oscilloscope, click on it. By clicking on the name of a given signal you can change its colour on the oscilloscope. Respective icons are displayed next to gas injectors. You can click any of the icons to disable/enable gas injector represented by the icon (together with corresponding petrol injector). That way you can easily diagnose mechanical failures of the injectors. The setting is temporary and deactivated automatically after disconnection of the diagnostic application and cutting off the voltage with the key. Top of the Monitor pane is occupied by LED switchboard. Depending on the type of controller and selected switch, in can be presented in two versions presented on figures 12-13. Fig. 12 Switchboard LED-300 Fig. 13 Switchboard LED-300/401B, LED-401 There is a button on the LED switchboard for changing the fuel type. The operating condition is signaled in case of LED-300 switches with the diode located next to the button. LED-300/401B and LED-401 switches use button illumination instead. Basic indications: Off – petrol On – LPG/CNG Pulsing – auto mode The chapter 4.1 contain a detailed description of operating mode of the controller. AC S.A. all rights reserved. Under penalty of law and/or liability claims it is forbidden to copy, publish, distribute, make available and/or use in any way all or any part of information contained within this document, in particular photographs, drawings, illustrations, trademarks, etc Page 16 of 42 Gas level is indicated by LED-300 switches with a line of 5 diodes, while LED-300/401B and LED-401 indicate it with 4 diodes arranged around the button. The minimum level (low fuel alarm) is indicated by a red LED diode in LED-300 switches. In LED-300/401B and LED-401 switches, the status is indicated by illuminating the button in red. After right-clicking on the LED witch view, its settings window is displayed (Figure 14). Alternatively, use the “Gas level indicator configuration” button on the “Gas controller settings” tab. Fig. 14 Gas level indicator configuration window Basic operations include configuring the type of indicator and setting the voltage values, according to which LED diodes will be lit to indicate the gas level on the switch panel (chapter 4.3 describes the procedure for automatic setting of threshold voltage values). Select the type of gas level sensor and sensor characteristics. The current voltage read from the gas level sensor is also displayed. With the “LED thresholds setting” window displayed, gas level change on the sensor results in immediate indication of the LED diodes. It is also used for checking the correct operation of the indicator and the switch. When the window is closed (normal operation), changes in gas level are updated on the LED switch with a delay. In LED-400 and LED-401 switches, it is also possible to change the sequence of gas level diode activation (the left one is considered as the first one, bottom one with respect to the buzzer), adjust the buzzer volume (1-minimum, 4-maximum), adjust the diode brightness (LED-401 also allows automatic adjustment). 2.6. Auto-calibration The auto-calibration window is used to calibrate the engine at idle run. After starting and warming up the engine, when Lambda sensor starts operating, start the auto-calibration. During the auto-calibration the engine should work at idle run. Switch off air-conditioning and lights and do not turn the steering wheel. During the calibration, the controller will automatically switch from petrol to LPG. The controller will be automatically switching on selected LPG cylinders. Once the auto-calibration is complete, the AC S.A. all rights reserved. Under penalty of law and/or liability claims it is forbidden to copy, publish, distribute, make available and/or use in any way all or any part of information contained within this document, in particular photographs, drawings, illustrations, trademarks, etc Page 17 of 42 controller displays a message informing the auto-calibration has finished successfully. The following messages may appear during the calibration: No ignition switch – check the connection of the ignition switch High/low rpm – engine rpm is too low/high; check the rpm settings No injection pulses Intake manifold pressure too high Unstable engine operation – manifold pressure, engine rpm changes are excessive. Check system tightness and make sure air-conditioning is off. 2.7. Oscilloscope Fig. 15 Oscilloscope screen On each tab, except the parameters tab, there is the oscilloscope window attached to present the changing monitor parameters (described in section 2.5). In the bottom left part, there are control buttons with the following functions (from the left): Start the oscilloscope Stop the oscilloscope Save current oscilloscope display Load saved oscilloscope display (file) Decrease the number of displayed points (only for loaded graphs) Increase the number of displayed points (only for loaded graphs) Display oscilloscope file information (data logging start/stop, total number of stored samples, application version, controller version, controller serial number). Continuous green line is displayed at top of the oscilloscope screen while the controller operates in the LPG mode (red line indicates operation of the “injectors heating” function). AC S.A. all rights reserved. Under penalty of law and/or liability claims it is forbidden to copy, publish, distribute, make available and/or use in any way all or any part of information contained within this document, in particular photographs, drawings, illustrations, trademarks, etc Page 18 of 42 The oscilloscope is an excellent tool to analyze vehicle working conditions. Recorded parameters can be saved and reviewed. In order to make the analysis of records easier, the window includes navigation tools for effortless searching of the contents. The curve is moved with the cursor on the oscillator window bottom, cursor buttons and clocking on the left or right side of the window. 2.8. Errors The tab is split into areas (Figure 16) by the type of displayed information. Gas controller errors and messages o Actual o Registered Engine controller errors o Pending o Registered Fig. 16 The view of Errors tab. AC S.A. all rights reserved. Under penalty of law and/or liability claims it is forbidden to copy, publish, distribute, make available and/or use in any way all or any part of information contained within this document, in particular photographs, drawings, illustrations, trademarks, etc Page 19 of 42 2.8.1. Errors of the gas controller Detection of events that restrict or prevent correct operation of the autogas system is indicated by messages with descriptions in red. Section “Active errors” lists the codes of current faults detected by the controller. If the cause of the fault is eliminated, the entry is moved to the “Error records” section. In other words, this means that a defect had been detected, but it is not currently active. A “Delete” button for erasing recorded controller errors from the memory is located in the bottom part of the “Errors” tab, below the “Error records” section. The following errors may appear during operation: Description in AC STAG application Gas injector missing Meaning Open circuit or fault of the specified gas injector Low gas pressure Gas pressure dropped or kept below the allowed low limit within the specified time High gas pressure Gas pressure 2x higher than the operating pressure for 60 seconds (usually associated with reducer problems) Supply voltage too low Controller supply voltage decreased below 9 [V] (usually associated with a failing battery) Gas temperature sensor missing Disconnected or disrupted circuit of the gas temperature sensor Reducer temperature sensor missing Disconnected or disrupted circuit of the reducer temperature sensor Gas temperature sensor circuit shorted Gas temperature sensor shorted to vehicle grounding Reducer temperature sensor circuit shorted Reducer temperature sensor shorted to vehicle grounding Injector supply circuit failure Controller’s circuit for injectors supply failed Solenoid valve supply circuit failure Overloaded or defective circuit or solenoid supply Solenoid valve missing Disconnected or disrupted circuit of the solenoid supply Peripherals supply circuit failure Overloaded circuit of peripherals supply (PS-02 sensor, WPG-H gas level indicator) Connection with the switch failed LED 400/LED 401 switch not connected Communication with the switch lost Connection with LED 400/LED 401 switch interrupted AC S.A. all rights reserved. Under penalty of law and/or liability claims it is forbidden to copy, publish, distribute, make available and/or use in any way all or any part of information contained within this document, in particular photographs, drawings, illustrations, trademarks, etc Page 20 of 42 Upon error detection, the controller records its conditions, i.e. operating parameters of the gas system, including: pressure, gas temperature, reducer temperature, engine rpm, manifold negative pressure, petrol injection pulses and gas dose. Such data is normally called a frozen frame of the error and allows analyzing and detecting problems in gas system operation. Fig. 17 „Frozen” fame of injector error 2.8.2. Gas controller message Messages are prompts that are not necessarily related to detection of events limiting or preventing the operation of the autogas system, but signal the required verification of the configuration. Unlike the errors, message prompts are displayed in blue. The controller can generate the following messages: Description in AC STAG application Meaning Gas injectors fully open! Check the Lambda Looping of gas injection, i.e. one gas injection sensor at maximum load pulse is overlapped by another pulse. If the Lambda sensor during the message display works in a “rich” mode, the error can be ignored; otherwise, use larger injector nozzles to reduce the multiplier LPG / CNG locking: review The gas installation requires a service inspection. “Lock LPG/CNG” option checked. The controller will not operate in gas fueling mode until the service message is erased. New settings The controller indicates new settings. The message is usually displayed when new firmware is installed to remind about the new options. Low gas temperature Low gas temperature detected in gas fueling mode. Check the condition and method of reducer installation. AC S.A. all rights reserved. Under penalty of law and/or liability claims it is forbidden to copy, publish, distribute, make available and/or use in any way all or any part of information contained within this document, in particular photographs, drawings, illustrations, trademarks, etc Page 21 of 42 2.8.3. Errors of the ECU The controllers equipped with a OBD adapter (STAG-4 QBOX PLUS) are capable of continuous monitoring of recorded and pending faults with the use of the onboard OBD2/EOBD interface. The errors are displayed as codes according to OBD2/EOBD notation system with descriptions. If an error occurs, the “Delete” button can be used to erase OBD fault codes, which is equivalent to error acknowledgement (check engine lamp) via an external OBD scanner. Fig. 18 The view of Errors tab. OBD faults AC S.A. all rights reserved. Under penalty of law and/or liability claims it is forbidden to copy, publish, distribute, make available and/or use in any way all or any part of information contained within this document, in particular photographs, drawings, illustrations, trademarks, etc Page 22 of 42 2.9. Multiplier map The Maps tab displays various charts that visually present gas controller operational characteristics. Fig. 19 Multiplier map Fig. 19 schows 3 maps: Multiplier map Petrol injection time map (with petrol) Petrol injection time map (with LPG) - orange - blue - green The multiplier map is displayed in orange. The left axis of the co-ordinate system (Multiplier) and the lower axis (Injection time [ms]) relate to the multiplier map. The multiplier map is used to set the multiplier for a given petrol injection time. The yellow points visible at the map are used to set the multiplier. To move a given point, select it by clicking on it. The value of a selected point is displayed at the lower right corner of the map. To move the points on the map, use the following keys: ← - left arrow moves the point to the left (change of the injection time for a given point) → - right arrow moves the point to the right (change of the injection time for a given point) ↓ - down arrow decreases the multiplier for given injection times ↑ - up arrow increases the multiplier for given injection times „Insert” (when a point is active) or right mouse button– add a new point „Delete” – delete a selected point on the map „Page Up” – Rising a selected point by 10 units, or the entire map, if no points are selected „Page Down” – lowering a selected point by 10 units, or the entire map, if no points are selected „Ctrl” + ← , or „Ctrl” + → change the active point (move to the next one) When the „Shift” key is pressed in, the map movement speed is multiplied by 10 (fast movement). When no point is selected, the ↑ ↓ arrows move the entire map. Apart from the multiplier map, there are two other maps in the window. The blue map represents the petrol injection times (with petrol). The right axis Collector pressure [Bar] and the lower axis Injection Time [ms] relate to this map. The map consists of blue points. After collecting the data, the controller turns these points into a AC S.A. all rights reserved. Under penalty of law and/or liability claims it is forbidden to copy, publish, distribute, make available and/or use in any way all or any part of information contained within this document, in particular photographs, drawings, illustrations, trademarks, etc Page 23 of 42 continuous line. The same applies to the so-called LPG map, i.e. the map of petrol injection times (with LPG) which is green. After the controller collects both maps, i.e. the petrol and LPG maps, the Deflection tab becomes active where a red line shows the difference between petrol and LPG. The map window in Fig.19 shows also cursor, which position changes vertically depending on the manifold negative pressure and horizontally depending on petrol injection times It is very useful during map collection as it shows the load and injection times of the engine. If “Auto selection” option is checked, the multiplier points will be selected automatically so that the point next to the cursor becomes active. Maps can be deleted with buttons (petrol injection time map), (gas injection time map). During the drive, pressing the SPACE key select the point closest to the current cursor position. In order to make injection time map acquiring easier, on the left side of the multiplier window suggested engine load areas are presented as vertical lines. The lines represent the areas of injection time maps, which have not been recorded yet. The blue line represents the petrol injection time map and the green one represents the gas map. If a given area of the map is acquired, the line section associated with this sector disappears. Fig. 20 Multiplier map. Suggested area of petrol map acquisition. Fig. 21 Multiplier map. Suggested area of gas map acquisition. AC S.A. all rights reserved. Under penalty of law and/or liability claims it is forbidden to copy, publish, distribute, make available and/or use in any way all or any part of information contained within this document, in particular photographs, drawings, illustrations, trademarks, etc Page 24 of 42 2.9.1. Multiplier adjustment When 2/3 of the suggested area on gas and petrol map is acquired, button for multiplier adjustment function is activated. The operation modifies the multiplier based on a deviation between the recorded maps for petrol and gas injection. If map differences are minor, the multiplier is not modified. It is recommended to acquire injection time maps for the full suggested range of engine operation. Fig. 22 Multiplier map. Operation of the multiplier adjustment function. AC S.A. all rights reserved. Under penalty of law and/or liability claims it is forbidden to copy, publish, distribute, make available and/or use in any way all or any part of information contained within this document, in particular photographs, drawings, illustrations, trademarks, etc Page 25 of 42 2.10. RPM correction map In the “RPM correction" tab, an additional correction map is displayed to supplement the multiplier map. Fig. 23 The view on the RPM correction map The RPM correction map forms a plane. One axis of the plane represents the petrol injection time [ms], while the other represents engine revolutions [rpm]. The map makes it possible to calibrate the multiplier depending on engine revolutions. This is shown In Fig.12. It is possible to enrich/weaken the mixture for a defined petrol injection time and revolutions. In order to calibrate the multiplier, the area which is to be calibrated must be selected by moving the mouse with the left button pressed over this area. Another method is to press the SHIFT key and, while holding it, to select the appropriate area by pressing arrow keys: ← Left arrow ↑ Up arrow → Right arrow ↓ Down arrow Having marked the area which is to be calibrated, specified actions can be performed by using the combination of the CTRL key and one of the keys below: ↑ Arrow up (higher calibration/richer mixture) ↓ Arrow down (lower calibration/leaner mixture) Pressing the SHIFT key in the course of the multiplier calibration will multiply the required step by 10. AC S.A. all rights reserved. Under penalty of law and/or liability claims it is forbidden to copy, publish, distribute, make available and/or use in any way all or any part of information contained within this document, in particular photographs, drawings, illustrations, trademarks, etc Page 26 of 42 The “3D” tab seen on the right side of the RPM correction map windows allows activation of a 3D view. Return to the classic two-dimensional view is made through the “2D” tab. Fig. 24 3D map view The 3D view is a spatial display of the two-dimensional map. You can rotate the 3D map dragging it with the right mouse button. Other editing operations may be performed identically as in the 2D map. 2.11. Petrol portion map The “Petrol portion” tab offers configuration of the petrol post-injection with simultaneous gas injector control. Configuration of petrol post-injection is made on a two-dimensional map with an RPM and petrol injection time axes. Like on the RPM correction map, the cursor shows the engine operation curve point. Navigation on the petrol portion map is identical as on the RPM correction map, i.e. cursor keys (← ,↑,→, ↓), SHIFT and CTRL keys can be used to select map areas and modify their values. Fig. 25 Petrol portion map AC S.A. all rights reserved. Under penalty of law and/or liability claims it is forbidden to copy, publish, distribute, make available and/or use in any way all or any part of information contained within this document, in particular photographs, drawings, illustrations, trademarks, etc Page 27 of 42 Map values specify the percentage of petrol while running on gas in a given operating curve point. The actual petrol post-injection time is based on the map values related to the petrol injection time in a given operating curve point. Example: 20% for the 10ms column means 2ms petrol extra-injection. After modification of the petrol portion map, verify if the mixture is correct in areas allowing petrol extra-injection. 2.12. Gas temperature correction map The controller is provided with automatic gas injection time correction based on gas temperature. The “Gas temperature correction map” allows the user to enter manually an additional percentage correction based on gas temperature. Entering modifications is just like on the multiplier. Fig. 26 Gas temperature correction map view AC S.A. all rights reserved. Under penalty of law and/or liability claims it is forbidden to copy, publish, distribute, make available and/or use in any way all or any part of information contained within this document, in particular photographs, drawings, illustrations, trademarks, etc Page 28 of 42 2.13. Reducer temperature correction map You can also chart corrections factors vs. reducer temperature (see Fig. 15) and enter modifications just like on the multiplier chart shown in Fig. 11. This correction may be useful if strategy of dosing fuel by computer of the vehicle strongly depends on engine temperature. Fig. 27 Reducer temperature correction map view 2.14. Gas pressure correction map The controller is provided with automatic gas injection time correction based on gas pressure. The “Gas pressure correction map” allows the user to enter manually an additional percentage correction based on gas pressure. Entering modifications is just like on the multiplier. Fig. 28 Gas pressure correction map view AC S.A. all rights reserved. Under penalty of law and/or liability claims it is forbidden to copy, publish, distribute, make available and/or use in any way all or any part of information contained within this document, in particular photographs, drawings, illustrations, trademarks, etc Page 29 of 42 2.15. Petrol map „B” Two-dimensional gas and petrol injection time maps are displayed on the multiplier tab based on actual 3D maps acquired versus RPM and MAP pressure. Fig. 29 Petrol map “B” view The “B” tab presents a preview of the petrol injection time map acquired when driving on petrol. The yellow cursor represents the actual operating curve point. Right-click and hold to turn the map around. 2.16. Petrol map „G” Petrol map „G” is a collection of petrol injection times for various combinations of engine speed and suction negative pressures acquired during driving on LPG. The two perpendicular yellow lines form a cursor that indicates the current operational point (rpm and suction negative pressure) of the engine. You can rotate the 3D map dragging it with the right mouse button. AC S.A. all rights reserved. Under penalty of law and/or liability claims it is forbidden to copy, publish, distribute, make available and/or use in any way all or any part of information contained within this document, in particular photographs, drawings, illustrations, trademarks, etc Page 30 of 42 Fig. 30 Mapa gazowa „G” view 2.17. Map acquistion state In order to monitor the process of map data acquisition, the application has been provided with a special petrol map acquisition status preview activated with the “State” button in B and G map windows. The preview of map acquisition status is divided into square sectors, which are colored when a respective map section for this area is acquired. Fig. 31 Petrol map acquisition state AC S.A. all rights reserved. Under penalty of law and/or liability claims it is forbidden to copy, publish, distribute, make available and/or use in any way all or any part of information contained within this document, in particular photographs, drawings, illustrations, trademarks, etc Page 31 of 42 Fig. 32 Gas map acquisition state 2.18. Injection time deviation map The “D” tab allows the viewer to view the difference between ”Petrol” and “Gas” maps. Differences between the petrol and gas injection time maps are expressed as a percentage. Fig. 33 Deviation map „D” view Positive values on the deviation map indicate that the mixture is rich. Injection times are shorter on the gas map than on the reference petrol map. Conversely, negative values indicate leaning. It should be noted that particularly within the low load and short petrol pulse range it is not recommended to seek deviations close to zero, due to the natural distribution of petrol injection pulses as a result of the ECU control. AC S.A. all rights reserved. Under penalty of law and/or liability claims it is forbidden to copy, publish, distribute, make available and/or use in any way all or any part of information contained within this document, in particular photographs, drawings, illustrations, trademarks, etc Page 32 of 42 Positive values on the deviation map indicate that the mixture is rich. Injection times are shorter on the gas map than on the reference petrol map. Conversely, negative values indicate leaning. It should be noted that particularly within the low load and short petrol pulse range it is not recommended to seek deviations close to zero, due to the natural distribution of petrol injection pulses as a result of the ECU control. 2.19. ISA2 autoadaptation STAG-4 QBOX PLUS is provided with a system that when initiated corrects the gas dose as needed based on the acquired reference map for petrol injection. Configuration and activation of the autoadaptation is performed in the ISA2 monitor window activated in the Window menu. Fig. 34 Configuration ISA2 The monitor includes the following groups of settings and parameters: Adaptation switch on threshold – Accepted deviation between the actual petrol injection time and time recorded for the reference petrol map. In other words, adaptation will be attempted only if the deviation exceeds the threshold value. Due to the mentioned natural distribution of petrol injection pulses as a result of the ECU control, a minimum deviation setting is 4%. LTFT maximum – maximum limit of the correction value that autoadaptation can implement. Adaptation in OL – Activation/deactivation of autoadaptation in an open loop mode. The function requires a voltage type Lambda sensor connected and activated Fuel Loop Status reading option (see: OBDII/EOBD reader (Chapter 0). Map autocomplete – Activation/deactivation of the auto-switching to petrol option in areas without reference injection pulses recorded. The option works within an RPM range from 1500 to 6000. Auto stop – checking the option will result in automatic blocking of engine operating curve points on ISA2 correction map when the specified deviation limit is reached (see: “Adaptation enable threshold”) Active – autoadaptation On/Off. STFT bank 1 – current correction of injection time implemented by the autoadaptation. AC S.A. all rights reserved. Under penalty of law and/or liability claims it is forbidden to copy, publish, distribute, make available and/or use in any way all or any part of information contained within this document, in particular photographs, drawings, illustrations, trademarks, etc Page 33 of 42 Temp. dev. Bank 1 – Momentary percentage value of petrol injection time deviation when driving on gas with respect to the reference injection recorded when driving on petrol. A positive value means that the injection time on gas is longer than on the reference map. ISA2 OL mode – indication of autoadaptation working in an open loop mode. In order to improve the quality of ISA2, the reference petrol map should be acquired on a warmed engine. The required minimum engine temperature is higher when ISA2 is On. Therefore, when the adaptation is activated, certain points on the map may disappear (the controller remembers the temperature at the time of data acquisition for individual points). The actual engine temperature is estimated based on the controller’s integrated algorithm or read directly from the OBD, if reading is active (see: Parameter and fault reader OBDII/EOBD). If the vehicle is equipped with a diagnostic system compatible with OBDII / EOBD is recommended to connect and configure the OBD reader to retrieve information about the status of the control system fuel dose. This makes it possible to pinpoint the areas of engine operation in open loop mode and precise adaptation. 2.19.1. ISA2 correction map ISA2 auto-adaptation has a dedicated correction map spread on the axes of RPM and load (MAP negative pressure), so the implemented corrections are more natural and precise. The map preview is available on the “ISA2” tab. Fig. 35 ISA2 correction map AC S.A. all rights reserved. Under penalty of law and/or liability claims it is forbidden to copy, publish, distribute, make available and/or use in any way all or any part of information contained within this document, in particular photographs, drawings, illustrations, trademarks, etc Page 34 of 42 2.20. OBDII/EOBD reader STAG-4 QBOX PLUS is equipped with an integrated reader of parameters and faults based on the OBDII/EOBD interface. It is not necessary to connect an external adapter – all required circuits are integrated with the controller board. The tool supports the following standards: ISO 15765 (ext. std. 250/500Kbits) – commonly referred to as "CAN”; ISO 14230 (5Baud, Fast init); ISO 9141 – commonly referred to as “K-line”. The reader is initiated by selecting the “OBD reader” option on the gas settings tab. If the controller operates in auto mode, it will attempt to connect to the OBDII/EOBD diagnostic system upon activation of the ignition switch. Fig. 36 OBD2/EOBD reader The reader window can display maximum 6 parameters at the same time. Navigation is realized with buttons, which are used to scroll through the parameters read via OBDII/EOBD. For showing or hiding the parameters of OBD reader on the oscilloscope in the application use the button. The button opens the parameters configuration window (Figure 37), which allows creating any sets of displayed parameters thanks to which it is possible to display a set including only parameters that are required for system calibration (such as fuel loop status, STFT and LTFT trims, results of a wide-band oxygen sensor). The window displays a set of 96 parameters available in OBDII/EOBD standard. Parameters unavailable in a given vehicle are grey. In order to add or remove a parameter from the reader, select it or deselect it in the field on the left side, next to its description. AC S.A. all rights reserved. Under penalty of law and/or liability claims it is forbidden to copy, publish, distribute, make available and/or use in any way all or any part of information contained within this document, in particular photographs, drawings, illustrations, trademarks, etc Page 35 of 42 Fig. 37 OBD2/EOBD reader configuration If it is necessary to diagnose the vehicle with an external scanner, when STAG-4 QBOX and an active OBD interface is available, switch the system to petrol fueling, switch off and switch on the ignition. OBD connection will not be active in petrol fueling mode. 2.21. Controller update To update the controller, connect it to the diagnostic software and turn the engine off. Select “Tools” -“Devices update” from the main menu. All available devices are automatically found. The “Devices update” window will pop up. The “Devices Parameters” window shows the information on current controller firmware version. The “Available updates” window includes a list of updates available for the connected controller. Loading an update not included in the program directory requires clicking “Read update” and selecting the update file. Loaded update should be included in the list of available updates. Click “Update” once the update file has been selected from the list. When the progress bar reaches 100%, the controller will disconnect and then re-connect. The new version number should appear at the bottom of the screen and should reflect the version number of the update file. Should the update go wrong the update window will be opened automatically upon connecting with the controller. Perform the update procedure again. AC S.A. all rights reserved. Under penalty of law and/or liability claims it is forbidden to copy, publish, distribute, make available and/or use in any way all or any part of information contained within this document, in particular photographs, drawings, illustrations, trademarks, etc Page 36 of 42 3. STAG-4 QBOX controller programming The STAG-4 QBOX controller may be programmed using the acquired petrol map and the gas map. The procedure: Auto-calibrate the controller Acquire petrol map B Acquire petrol map G Check deviations between both maps. 3.1. Auto-calibration Prior to starting the auto-calibration, start the engine and wait until the lambda probe begins to work. During the auto-calibration the engine should work at idle run; do not increase rpm, switch off air-conditioning and lights and do not turn the steering wheel as this may cause errors during the auto-calibration. During the auto-calibration, watch carefully petrol and LPG injection times. If LPG injection times are shorter than petrol injection times, the injector nozzles may be too large and should be replaced with smaller diameter ones. When auto-calibration is completed, the multiplier map will be preset. The multiplier’s value for this point should be between 1.4 and 1.9; if the value is greater than 1.9, longer times of petrol injection i.e. greater load and high rpm, may cause overlapping of injection times i.e. one LPG injection will begin before the previous one ends (looped injections). In such a case, the controller will display the „Too long injection time” error message. In such case, make sure that the Lambda sensor indicates a rich fuel mixture. 3.2. Collection of the petrol injection map with petrol (petrol map) Having finished the auto-calibration, switch over to petrol and drive the vehicle for app. 4 km to collect the petrol map. During the collection of the map try to drive without changing gears e.g. at the 4th gear and in a way making the lambda probe to “work” i.e. changing its mode from weak to rich. Blue points should appear during the collection of the map. To collect the map quicker, adjust vehicle load in such a way causing new points to be collected in places which are still empty. Collection of maps is performed without participation of the diagnostic software, thus can be done with the PC disconnected. However, collecting the map while the PC is connected and the diagnostic software running is quicker and enables the operator to see what is actually happening to the vehicle. When the controller collects sufficient number of points, the map will be drawn with a continuous line and the petrol map collection is finished. 3.3. Collection of the petrol injection map with LPG (LPG map) Having collected the petrol map, switch to LPG and collect the LPG map in the same way the petrol map was collected. The LPG map should be collected in the same road conditions and with similar loads as the petrol map. The LPG map is drawn with green points. Having collected sufficient number of green points, the map will be drawn with a continuous green line. If the controller is set properly (the multiplier characteristics selected properly), the petrol and the LPG maps should match. If the maps do not match, the multiplier characteristic should be corrected at the points AC S.A. all rights reserved. Under penalty of law and/or liability claims it is forbidden to copy, publish, distribute, make available and/or use in any way all or any part of information contained within this document, in particular photographs, drawings, illustrations, trademarks, etc Page 37 of 42 where the maps do not match (the lower axis of co-ordinates for injection times). If the LPG map is collected with the PC connected and the diagnostic software running, it is possible to immediately correct the multiplier characteristics when the collected green points do not match with the petrol map. It is even strongly recommended to use the PC in this way as if the multiplier characteristics differ strongly from the required ones, the controller starts to switch over and – in the extreme case – can activate the “check” signal lamp. When correcting the multiplier characteristics, make the points on the LPG map match with the petrol map. Once both maps match, the characteristics are properly set. 3.4. Checking if maps match, verification of deviations Having collected the petrol and LPG maps (both maps drawn with continuous lines) check the deviation between them. In the Map window there is the “D” button located on the right. Press it to see the deviation graph drawn with a red line. If the deviation fits within ± 10%, the controller is programmed properly; otherwise, the multiplier characteristics should be corrected at points where maps do not match. 3.5. Controller manual setting The controller may also be set up manually, which – provided sufficient experience has been gained – may prove quicker than the above described procedure. Start with the auto-calibration in the same way as described above (this is necessary to ensure the controller works properly, see Błąd! Nie można odnaleźć źródła odwołania.). If the autocalibration finishes properly and the multiplier values are correct for the calibration point, switch the engine to petrol and take it for a ride. The multiplier characteristics need to be set in the following way: Drive the car with a constant load, i.e. the petrol injection times should be stable. Adjust the engine loads so that the injection times equal e.g. app. 5 [ms]. The blue marker will help determine the injection times as it is location on the horizontal axis is determined by the injection times. Next, switch the car to LPG and watch the blue marker for variations in injection times when compared with the earlier petrol injection times. If the injection times decreased (the marker moved to the left) it means that for the selected injection times the multiplier is too high (the mixture is too rich). In this case, lower the multiplier value for the 5 [ms] injection time (in our case). If upon switching to LPG the blue marker moves to the right, it means the mixture is not reach enough and the multiplier needs to be brought up for given injection times. The procedure described above should be performed for a few different injection times, starting at the calibration point all the way until heavy load injections. You can check the multiplier map e.g. every 2 [ms] starting at the calibration point. If necessary, add a point at the multiplier map to set it more precisely. Once the manual setting is complete, both maps – petrol and LPG – should match. 3.6. LPG temperature correction If the petrol injection time changes when the LPG temperature is changed in the LPG mode, the LPG temperature calibration must be corrected. The correction may be made by means of the “LPG temperature calibration map” (see 2.12). However, it must be remembered that this operation AC S.A. all rights reserved. Under penalty of law and/or liability claims it is forbidden to copy, publish, distribute, make available and/or use in any way all or any part of information contained within this document, in particular photographs, drawings, illustrations, trademarks, etc Page 38 of 42 may be performed if the auto-calibration and the multiplier setting while driving have been carried out correctly. In order to make the correction in a proper way, the car must be started with a cold engine. Then, beginning with the temperature of switching to LPG, the petrol injection time must be checked and after switching to LPG the petrol injection time should be compared. If the petrol injection time value is bigger after switching to LPG, the positive correction must be made for this LPG temperature value (the LPG temperature calibration map must be brought up). If the petrol injection time value is lower after switching to LPG, the calibration map for a given LPG temperature value must be brought down. The calibration map must be set in such a way as to ensure that the petrol injection time remains the same after switching from petrol to LPG. In order to set the LPG temperature calibration map correctly, the procedure described above must be repeated for the full range of LPG temperature values in 5 [°C] steps. 4. LED switchboard operation and acoustic signals (User Manual) 4.1. LED-300 switchboard Fig. 38 LED-300 switchboard The LED switchboard consists of: LED line indicating LPG level the LED indicating type of fuel button LED line– shows current LPG level in the tank. 4 green LEDs indicate a full tank; a red LED indicates “reserve”. The LED – shows current operating status: Off –the engine runs on petrol Slow blinking (once per second) – the engine is started on petrol and switches to autogas when the set parameters are achieved Normal blinking (twice per second) – the engine is started on petrol and switches to autogas when the set parameters are achieved. The system switches the engine to gas fueling. The state may continue for up to 10 seconds, depending on engine working parameters at the moment and controller settings. Fast blinking (4 times per second) – system error prevents gas fueling, e.g. empty gas tank, LPG installation fault; the engine runs on petrol. On – the engine runs on LPG Push button – for switching from one fuel type to another. The controller “remembers” the last fuel type setting before switching the ignition switch off. AC S.A. all rights reserved. Under penalty of law and/or liability claims it is forbidden to copy, publish, distribute, make available and/or use in any way all or any part of information contained within this document, in particular photographs, drawings, illustrations, trademarks, etc Page 39 of 42 4.2. LED-300/401B and LED-401 switchboard Fig. 39 LED-300/401B / LED-401 switchboard LED-300/401B and LED-401 LED switchboard consists of: Gas level indicator – four diodes in a circular arrangement showing the current gas level in the tank. Four green diodes indicate that the tank is full. Button (with AC logo) – used for fuel switching and indicate current operating conditions: Off (PETROL mode) – indication that the engine is fueled with petrol, Slow blinking (once per second – AUTO mode) – the engine is started on petrol and switches to autogas when the set parameters are achieved Normal blinking (twice per second, no acoustic signals –AUTO mode) – the engine is started on petrol and switches to autogas when the set parameters are achieved. The system switches the engine to gas fueling. The state may continue for up to 10 seconds, depending on engine working parameters at the moment and controller settings. Fast blinking (4 times per second, with acoustic signals –EMERGENCY mode) – system error prevents gas fueling, e.g. empty gas tank, LPG installation fault; the engine runs on petrol Continuous light in white (GAS mode) - the engine is supplied with autogas Continuous light in red – operation on gas, low fuel level If the controller is connected to the LED-401 switch, additional functions are available: The user can adjust LED brightness (4 brightness levels) – if automatic LED brightness is Off, The user can adjust the volume of buzzer installed inside the switch, The switch can be installed in any position to allow comfortable control of gas level indication and the reference position is the position of the buzzer, Automatic detection of the connected switch. If LED-401 is connected, the application also shows LED-401. AC S.A. all rights reserved. Under penalty of law and/or liability claims it is forbidden to copy, publish, distribute, make available and/or use in any way all or any part of information contained within this document, in particular photographs, drawings, illustrations, trademarks, etc Page 40 of 42 4.3. Automatic calibration of LPG level indicator The automatic calibration of LPG level indicator should be carried out when an empty tank is being filled with gas. The indicator type should already be set, but, if necessary, the procedure itself may change its type, e.g. from ascending to descending. The calibration procedure is as follows: Press and maintain the switchboard push button, Switch off the ignition switch (during to three seconds after pressing push button), Depress the button when the switch initiates level indicator calibration. Process of calibration is signalized on the LED in form of continuously increasing gas level. When the tank filling is over, switch on the ignition switch, thus terminating the calibration procedure. Successful calibration is signaled by smooth ascending, followed by smooth descending of the gas level indication on the LED line from fuel reserve to maximum fuel level and back (twice). In the case of calibration failure, the level indication on the LED line will change five times from reserve to maximum. 4.4. Acoustic signals The controller may emit the following acoustic signals: Three beeps if it had to switch over to petrol because of a too low level in LPG tank. Three short beeps and one long beep in case of a controller error. Two short beeps and one long beep each time the ignition switch has just been turned on is a warning that the system needs to be inspected. Three long beeps repeated every minute is a reminder that the engine is operating in emergency mode. 4.5. Emergency start on gas In order to start the engine on gas (emergency mode, e.g. when the fuel pump fails), position the key in ignition mode, then press and hold the button on the switch. The LED will be switched on in a continuous light mode and a buzzer sound will be generated. When RPM is detected, the controller opens the solenoids and the engine is started on gas fuel. It is not possible to switch to petrol in the emergency mode. The emergency mode is deactivated when the engine is turned off. Operation in the emergency mode is indicated with occasional buzzer sounds. 5. Technical specifications Power supply voltage Maximum power supply current for a 4-cylinder engine controller, 1 [Ω] gas injectors Current load in the sleep mode Operating temperature range Protection class 12[V] -20% +30% 12,5 [A] < 10 [mA] -40 - 110 [°C] IP54 AC S.A. all rights reserved. Under penalty of law and/or liability claims it is forbidden to copy, publish, distribute, make available and/or use in any way all or any part of information contained within this document, in particular photographs, drawings, illustrations, trademarks, etc Page 41 of 42 6. Warranty, restrictions, exclusions Warranty does not cover: 1. Damage resulting from installing the controller not in line with the recommended layout diagram, in particular from hooking signal cables up to other terminals than those specified in installation guidelines. 2. Damage resulting from installing the controller in places incompatible with installation guidelines or from exposition to water, high temperatures, vehicle battery vapours. 3. Devices tampered with / repaired without proper authorisation. 4. Mechanical damage through Customer’s fault, in particular damage of: connectors (including damage caused by use of inappropriate chemical cleaning agents) controller housing electronics PCB. 5. Electrical damage of circuitry brought about by hooking communication interfaces up not in line with installation guidelines. AC S.A. all rights reserved. Under penalty of law and/or liability claims it is forbidden to copy, publish, distribute, make available and/or use in any way all or any part of information contained within this document, in particular photographs, drawings, illustrations, trademarks, etc Page 42 of 42


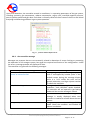

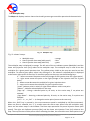
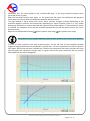
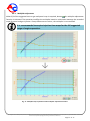


![CDNXL_60_RETAIL_SALES [MetaTexis] [Final version]](http://vs1.manualzilla.com/store/data/005704456_1-17a983fab827ed2fd4ed28ca910215ca-150x150.png)