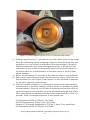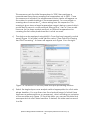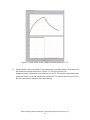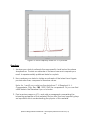
1
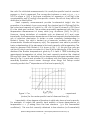
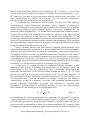
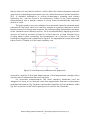
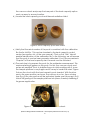
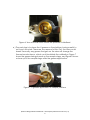
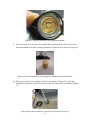
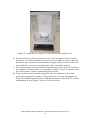
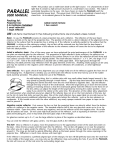
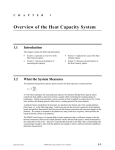
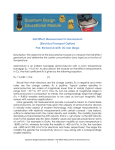
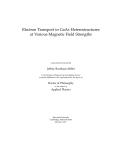
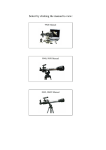
Heat Capacity Measurement of Vanadium Oxide Powder
(Heat Capacity Option)
Prof. Richard Averitt, UC San Diego
Description: The objective of this educational module is to measure the heat
capacity of vanadium dioxide (VO2), a material that exhibits a structural phase
transition at 340K that coincides with a transition from a low-temperature
monoclinic insulating phase to a high temperature rutile metallic phase [1]. VO2
is a well known correlated electron material that is being actively investigated to
elucidate the relative importance of structural changes versus electronic
correlations as the fundamental cause of the transition. The insulator-to-metal
transition in VO2 is first order resulting in a large latent heat, which can be
measured using the heat capacity option of the VersaLab.
In the following module, we will use VO2 powder (a precursor material for growing
thin films that is composed of micro-crystallites) for the heat capacity
measurements, highlighting the sensitivity of this measurement technique. The
procedures described in this module are generally applicable to other samples.
Before proceeding to the instructions for performing this measurement, we discuss
some the general background of heat capacity measurements from theoretical
and practical points of view.
The heat capacity [J/K] characterizes the increase in the internal energy of
a system for a given temperature increase. Considering the first law of
thermodynamics we have dU = dQ + dW, where dU is the change in energy when
either work (dW) is performed or heat (dQ) is added to the system. This expression
can also be written as dU = TdS – PdV where the notation follows standard
conventions. The heat capacity is defined as C = dQ/dT which, for constant
volume, is Cv = dU/dT = T(dS/dT) [2,3]. The heat capacity is extensive (i.e. it
depends on the quantity of material). It is more useful to express it as an intensive
quantity. Two common intensive descriptions are the mass heat capacity (often
called the mass specific heat) with units J/(kg K) and the molar heat capacity
(often called the molar specific heat) with units of J/(mol K). The same symbol cv
is typically used for either specific heat quantity, so care must be taken to specify
Quantum Design Educational Module – Heat Capacity Measurement of VO2 (v.1)
1
the units. For solid-state measurements, it is usually the specific heat at constant
pressure cp that is measured. The connection between cv and cp is cp – cv =
9α2VT/κ where α [1/K] is the linear coefficient of expansion, κ [ms2/kg] is the
compressibility, and V [m3/kg] is the specific volume. We will not worry about this
distinction in what follows.
Heat capacity measurements provide fundamental insight into the
properties of a material. As you may recall, the classical result of Dulong-Petit for
the molar heat capacity of a solid is c = 3R = 24.9 J/(mol K) where R = 8.31J/(mol
K) is the ideal gas constant. This provides reasonable agreement with the room
temperature measurement of many solids (e.g. Aluminum (24.2), Fe (25.1)).
However, strong deviations of materials such as diamond (6.1) and, more
importantly, the temperature dependence of the heat capacity necessitated the
use of quantum mechanics to obtain a more complete understanding. In
Einstein’s theory, the solid is treated as a harmonic oscillator with a single
characteristic vibrational frequency ω [4]. This approach was able to provide a
basic understanding of the decrease in the heat capacity with temperature. The
data for diamond with Einstein’s fit is shown in Fig. 1. In this plot the units are
cal/(mol K) which can be converted to J/(mol K) by multiplying by 4.184 J/cal. For
diamond, the Einstein temperature is given by TE = ħω/kb = 1320K indicating the
approximate temperature at which the heat capacity reaches the classical
Dulong-Petit value. The deviations at low temperature between experiment and
theory in Fig. 1 is real and a better fit is obtained with the Debye model which
essentially quantizes sound waves. Amongst other things, the Debye model
correctly predicts the T3 dependence of the heat capacity [3].
Figure 1: Comparison of Einstein model (dashed line) to experiment
(circles) for the molar specific heat of diamond from [4].
Importantly, other degrees of freedom in solids also have a heat capacity.
For example, in metals the specific heat exhibits a linear dependence on
temperature c = γT arising from the free electrons (γ is the Sommerfeld
coefficient). This was first correctly obtained in free electron (or Sommerfeld)
Quantum Design Educational Module – Heat Capacity Measurement of VO2 (v.1)
2
theory using Fermi-Dirac statistics for the electrons [3]. Of course, c = γT is just for
the electrons and the lattice must also be included. At low temperatures, c ≈ γT +
βT3 where the first term is for the electrons and the second term the lattice. At
high temperatures the lattice will dominate, but the electron contribution
becomes important in metals at low temperatures.
In contemporary condensed matter physics, the fact that heat capacity
measurements reveal interactions between various degrees of freedom is
extremely important. As one example, we consider heavy-Fermion (HF) materials.
As the name implies, in these materials (below a cross-over temperature), the
electrons (really quasiparticles – i.e. dressed electrons) become extremely heavy.
In some HF materials the quasiparticles exhibit an effective mass approaching
1000 times the mass of a free electron! This arises from interactions of the
conduction electrons with localized f-moments in these materials. Importantly, the
onset of HF phenomena appears in heat capacity measurements. This is because
the heat capacity is proportional to the density of states at the Fermi level, which
in turn is related to the effective mass [5,6].
Heavy Fermions are but one (fairly exotic) example. More generally, heat
capacity measurements are sensitive to phase transitions. This includes magnetic
ordering, structural transitions, ferroelectric polarization, and superconductivity.
This applies to both first order and second order phase transitions. In the case of
a first order transition, a discontinuity appears in the entropy which in turn leads to
a divergence in the specific heat since cv = T(dS/dT). This singularity is the latent
heat L [J/kg] and is the increase in the internal energy needed to drive the phase
transition [7]. In this module, the goal is to measure L for VO2 powder.
In the case of a second order (or continuous) phase transition, a kink
appears in the entropy S, leading to a discontinuity in the specific heat. The
importance of this can be understood from considering thermodynamic
potentials. For example, for the Helmholtz free energy we have F = U – TS. From
this we can see that the entropy is the driving “force” for a phase transition. At
low temperature (below the phase transition temperature Tc), the entropy is not
too important and F can be minimized by having U minimized. This leads to
ordering (e.g. of spins in a magnet). However, with increasing temperature the
entropy becomes increasingly important and minimizing F benefits from
increased S corresponding to increasing disorder. In fact, the total entropy
associated with the ordering can be determined from:
𝑇𝑇𝑇𝑇 1
S = ∫0
𝑐𝑐 (𝑇𝑇)𝑑𝑑𝑑𝑑
𝑇𝑇 𝑝𝑝
(Eqn. 1)
In determining the entropy associated with ordering, it is important to exclude
other contributions such as the lattice specific heat. An insightful description of
second order (and also first order) phase transitions is Landau’s mean field theory
which provides a description in terms of an order parameter [8]. However, while
providing considerable insight and a general framework for phase transitions, this
Quantum Design Educational Module – Heat Capacity Measurement of VO2 (v.1)
3
theory does not include fluctuations, which affect the thermodynamic response
and lead to interesting phenomena such as critical behavior in phase transitions
[8,9]. A detailed description of critical phenomena, ordering and broken
symmetry, etc., can be found in the references. Suffice to say, heat capacity
measurements are a primary means to study these fundamentally important
effects in solids.
The next question we must address is how are heat capacity measurements
performed? The basic idea is to heat the sample in a precise manner to add a
precise amount of energy and measure the corresponding temperature change.
In the VersaLab heat capacity option, this is accomplished by applying a known
amount of heat at constant power for a fixed amount of time followed by a
cooling period while measuring the temperature as a function of time. This
heating/cooling process is depicted in Figure 2. An appropriate model (discussed
below and in Chapter 4 of the heat capacity user
Figure 2: heat capacity measurement approach.
manual) is used the fit the time dependence of the temperature change which
can be used to determine the heat capacity.
For accurate measurements, the heat capacity hardware must be
designed to have a low thermal mass and appropriate thermal conductance
and thermal isolation. Fig. 3a gives a schematic depiction of the hardware, while
Fig. 3b is a picture of the heat capacity puck used for the VersaLab.
Quantum Design Educational Module – Heat Capacity Measurement of VO2 (v.1)
4
Figure 3: (a) Schematic of heat capacity hardware. (b) Heat capacity puck.
As shown in Fig. 3, a platform heater and platform thermometer are
attached to the bottom side of the sample platform. Small wires provide the
electrical connection to the platform heater and platform thermometer and also
provide the thermal connection and structural support for the platform. The
sample is mounted to the platform by using a thin layer of grease, which provides
the required thermal contact to the platform.
The integrated vacuum system in the cryostat provides a sufficient vacuum
so that the thermal conductance between the sample platform and the thermal
bath (puck) is dominated by the conductance of the wires. This gives a
reproducible heat link to the bath with a corresponding time constant large
enough to allow both the platform and sample to achieve sufficient thermal
equilibrium during the measurement.
The VersaLab measures heat capacity curves like that shown in Fig. 2 (i.e.
the change in temperature versus time) and the data is fitted in MultiVu using one
of several models. To give a feel for this, we describe the 1-tau model that fits the
data using a single time constant. The details of the 2-tau model (which
accurately takes into account the thermal conductance between the sample
and the platform) are described in section 4.3 of the heat capacity user manual.
The 1-tau model describes the flow of power into and out of the sample:
𝐶𝐶𝑡𝑡𝑡𝑡𝑡𝑡𝑡𝑡𝑡𝑡
𝑑𝑑𝑑𝑑(𝑡𝑡)
𝑑𝑑𝑑𝑑
= 𝑃𝑃(𝑡𝑡) − 𝐾𝐾𝑤𝑤 (𝑇𝑇(𝑡𝑡) − 𝑇𝑇𝑏𝑏 )
(Eqn. 2)
where Ctotal is the total heat capacity, P(t) is the applied power, Kw is the thermal
conductance of the wires, T(t) is the time-dependent temperature, and Tb is the
bath temperature. For P(t) (see Fig. 2) we have P(t) = P0 (0 ≤ t ≤ t0) and P(t) = 0 (t
> t0). With the initial conditions, Ton(0) = Tb and Ton(t0) = Toff(t0), Eqn. 2 can be
solved yielding:
Quantum Design Educational Module – Heat Capacity Measurement of VO2 (v.1)
5
𝑇𝑇(𝑡𝑡) =
⎧ 𝑃𝑃0 𝜏𝜏�1−𝑒𝑒
⎪ 𝐶𝐶
𝑡𝑡
−
𝜏𝜏 �
𝑡𝑡𝑡𝑡𝑡𝑡𝑡𝑡𝑡𝑡
𝑡𝑡
+ 𝑇𝑇𝑏𝑏
(0 ≤ 𝑡𝑡 ≤ 𝑡𝑡0 )
⎨𝑃𝑃0 𝜏𝜏�1−𝑒𝑒 −𝜏𝜏 �𝑒𝑒 −(𝑡𝑡−𝑡𝑡0 )/𝜏𝜏
⎪
+ 𝑇𝑇𝑏𝑏
⎩
𝐶𝐶𝑡𝑡𝑡𝑡𝑡𝑡𝑡𝑡𝑡𝑡
(Eqn. 3)
(0 > 𝑡𝑡0 )
where τ = Ctotal/Kw is the thermal time constant. MultiVu uses least squares to
obtain a best fit for the heat capacity. Performing these thermal time constant
measurements at a series of temperatures allows for the determination of the heat
capacity as a function of temperature.
It is important to note that Ctotal is the total heat capacity of the sample
platform, the grease, and the sample of interest. Thus, several measurements are
actually required to obtain Cp of the sample. First, the puck must be calibrated.
That is, a measurement must be performed without the grease or the sample. This
procedure needs to be performed for each new puck to determine the heat
capacity of the sample platform and Kw. The data for this calibration is saved in a
“.cal” file for reference with the subsequent measurements. For each new sample
to be measured, an addenda must first be obtained. This is essentially a
measurement of the heat capacity of the grease and the sample platform
without the sample. This is also saved in the calibration file. Finally, the
sample/grease/sample platform heat capacity is measured. From this series of
three measurements, it is possible to obtain Cp of the sample of interest.
While this approach for measuring the heat capacity enables
measurements over a wide temperature range, it could easily miss features in the
specific heat associated with first or second order phase transitions if, for example,
the selected number of temperatures is too sparse. This is because the heat
capacity associated with phase transitions can be quite narrow (this is particularly
true for first order transitions). Thus, an alternative approach to measure (or search
for) the phase transition must be utilized.
In our study of VO2, we will utilize the slope analysis method of relaxation
curves. If both sides of Eqn. 2 are divided by dT(t)/dt, one obtains:
𝐶𝐶𝑡𝑡𝑡𝑡𝑡𝑡𝑡𝑡𝑡𝑡 =
𝑃𝑃(𝑡𝑡)− 𝐾𝐾𝑤𝑤 (𝑇𝑇(𝑡𝑡)−𝑇𝑇𝑏𝑏 )
𝑑𝑑𝑑𝑑/𝑑𝑑𝑑𝑑
(Eqn. 4)
This provides an operational approach to obtain the heat capacity as a function
of temperature from a single curve such as that shown in Fig. 2. At each time the
slope is calculated, providing a means to obtain Ctotal at each temperature on
the curve! In the case of a first order phase transition, there should be a distinct
decrease in the slope at the transition temperature. This intuitively makes sense
since the latent heat requires the addition of energy to the sample without a
temperature increase. Further, since first order transitions exhibit hysteresis, the
warming and cooling curves will have different kinks in the slopes. Section 4.3 of
the heat capacity user manual presents additional details while section 4.6
Quantum Design Educational Module – Heat Capacity Measurement of VO2 (v.1)
6
provides examples of single slope analysis of a first order phase transition in Figures
4-6 and 4-7. It is strongly advised that chapter 1-4 of the heat capacity users
manual is read prior to performing these measurements.
Notes:
1. F. J. Morin, Phys. Rev. Lett. 3, 34 (1959); see also C. N. Berglund, H. J.
Guggenheim, Phys. Rev. 185, 1022 (1969); N. Mott, Metal-Insulator
Transitions, Taylor and Francis, London, 1977.
2. D. V. Schroeder, An Introduction to thermal physics, Addison Wesley, New
York, 2000.
3. Steven H. Simon, The Oxford Solid State Basics, Oxford University Press,
Oxford, 2013.
4. A. Einstein, Ann. Phys. 22, 180 (1907); see also any solid state physics book
such as Simon’s book in reference three.
5. http://en.wikipedia.org/wiki/Heavy_fermion
6. P. Coleman, Heavy Fermions: Electrons at the edge of magnetism,
http://arxiv.org/abs/cond-mat/0612006v3
7. David L. Sidebottom, Fundamentals of Condensed Matter and Crystalline
Physics, Cambridge University Press, Cambridge, 2012. Chapter 15.
8. D. I. Khomskii, Basics Aspects of the Quantum Theory of Solids, Order and
Elementary Excitations, Cambridge University Press, Cambridge 2010.
9. P. M. Chaikin and T. C. Lubensky, Principles of Condensed Matter Physics,
Cambridge University Press, Cambridge, (1995).
Instructions: In this section, we provide guidance on preparing and measuring the
heat capacity of VO2 powder. Our focus will be on observing the first order phase
transition occurring at ~340K. As such we will utilize the slope analysis of relaxation
curves to obtain the data.
Several items are needed for this experiment, which includes:
•
•
•
•
•
•
VO2 powder, available from Alfa Aesar at
http://www.alfa.com/en/catalog/22957
Apiezon H grease. Importantly, the specific heat of N grease is strongly
temperature dependent above 200K, so H grease is recommended to
minimize errors.
Grease applicator which can be the wooden end of a cotton swab
A microscope to facilitate the application of the grease and sample
A precision scale with 0.1 mg or better resolution.
Weigh boats or wax paper for handling the VO2 powder.
a.) Prior to preparing for the sample measurement, the heat capacity
module should be installed and activated. In addition, make certain that
Quantum Design Educational Module – Heat Capacity Measurement of VO2 (v.1)
7
the vacuum chuck and pump that are part of the heat capacity option
are in an easy to access location.
b.) Locate the heat capacity puck and thermal radiation shield.
Figure 4: Heat capacity puck and shield
c.) Verify that the serial number of the puck is consistent with the calibration
file that in MultiVu. This can be checked in the heat capacity control
center (see section 4.4. of the user manual). Click on the “files” tab will
enable identification of the calibration file. In the following, we will assume
that the puck in use has been properly calibrated. If not, the procedure in
Chapter 5 of the heat capacity user’s manual must be followed.
d.) The next step is to prepare the puck for the addenda measurement. This
requires placing H grease on the puck. For this, the vacuum chuck and
pump are needed. This is to stabilize the puck while working with it, since
the sample platform is very fragile and it is easy to break the wires! Figure
5 shows the chuck with the heat capacity puck inserted. With the silver
arm in the open position as shown, the vacuum is not on. Upon closing
(see Fig. 6) the vacuum line will be activated (make sure the pump is on!)
which will gently pull the sample platform into place, thereby stabilizing it
for grease application.
Figure 5: Heat capacity puck on vacuum chuck.
Quantum Design Educational Module – Heat Capacity Measurement of VO2 (v.1)
8
Figure 6: With the silver lever closed the platform is stabilized.
e.) The next step is to place the H grease on the platform, being careful to
not touch the wires. There are two reasons for this. First, the wires could
break. Secondly, any grease that gets on the wires will change the
thermal conductance, which could invalidate the calibration. Figure 7
shows the grease being placed on the sample stage, and Figure 8 shows
a close up of the sample stage after the grease application.
Figure 7: H grease application to sample platform
Quantum Design Educational Module – Heat Capacity Measurement of VO2 (v.1)
9
Figure 8: Sample platform with grease applied.
f.) The next step is to perform the addenda measurement. First, ensure the
thermal radiation shield is firmly fastened to the puck as shown in Figure 9.
Figure 9: Heat capacity puck ready for addenda measurement
g.) The puck can now be loaded into the VersaLab (Figure 10), and the
VersaLab chamber sealed using the cap with the vacuum bellows (Figure
11).
Quantum Design Educational Module – Heat Capacity Measurement of VO2 (v.1)
10
Figure 10: Loading the puck into the VersaLab.
Figure 11: Sealing the VersaLab for the addenda measurement
h.) In the heat capacity control center (again, see section 4.4 of the users
manual), the addenda measurement can easily performed. Under the
measurement tab, there is the option to create a new addenda table.
The temperature range can be selected. For these measurements, we are
interested in the temperature range from approximately 325K – 350K
which extends well below and above the transition temperature in VO2.
For the addenda measurement choose 310K – 370K to be certain that the
range of interest is covered. The addenda measurement will take some
time and will create an addition (hence the term addenda) to the
calibration file that will be used for the subsequent sample measurements.
i.) After the addenda measurement is completed and the sample puck is at
room temperature, it can be removed from the VersaLab in preparation
for placing the sample onto the heat capacity platform.
j.) The first step is to weigh out a portion of the powder. As only 1 – 2 mg are
required for the measurement, the best approach is to measure out an
amount in excess of this using an electronic balance as shown in Figure
12.
Quantum Design Educational Module – Heat Capacity Measurement of VO2 (v.1)
11
Figure 12: There are 45.1 mgs of VO2 powder in the weigh boat.
k.) The next step is to place a small amount of this powder on the wooden
portion of a cotton swap like a spoon (cut at an angle to have a tip). The
powder is very sensitive to electrostatic change and we found that it was
not possible to scoop up a small portion with a metallic spatula.
l.) The heat capacity puck should be placed back in the vacuum chuck for
the addition of the powder. You may find it useful to have the puck under
the microscope to assist in depositing the powder.
m.) The powder should be gently dropped onto the platform in the area
where the H grease is located. It is important to not touch the grease as
this will invalidate the previously obtained addenda. Note that this can be
challenging, but as Figure 13 shows, it can be done.
Quantum Design Educational Module – Heat Capacity Measurement of VO2 (v.1)
12
Figure 13: Heat capacity puck with VO2 powder deposited.
n.) If there is any left over VO2 powder on your stick, add it back to the weigh
boat. By subtracting off the remaining mass from the initial mass that was
measured, you can obtain an estimate of the mass added to the puck.
While this approach may have fairly large error bars, it will allow for the
calculation of the molar or mass specific heat from the heat capacity. It
will further allow for a determination of the latent heat of the first order
phase transition.
o.) Return the remaining VO2 powder to the vial from which it was obtained.
p.) Remove the heat capacity puck from the vacuum chuck, seal it with the
thermal shield (i.e. as in Figure 9) and place it in the VersaLab to prepare
for the heat capacity measurement.
q.) After the sample is loaded, you are ready to perform the heat capacity
measurement. In the heat capacity control center, it is possible to initiate
a measurement. However, we will write a simple sequence that will focus
on measuring the heat capacity over the temperature range from 325 to
350K, appropriate for measuring the first order phase transition in the VO2
powder. Here is a sample sequence to accomplish this:
Set Temperature 325K at 12K/min. Fast Settle
Wait For Temperature, Delay 0 secs, No Action
Sample HC at current temperature, 25 K rise, 3 times, 3 tau meas time
Set Temperature 300K at 12K/min. Fast Settle
Quantum Design Educational Module – Heat Capacity Measurement of VO2 (v.1)
13
This sequence sets the initial temperature to 325K, then performs a
measurement three times, ramping the temperature up to 350K. Once
the sequence is initiated, the measurement status viewer will appear on
the screen to enable tracking of the measurement. You may obtain a
warning about inaccurate Cp values arising from this sequence. This
warning is given since a large temperature range is being covered which
would lead to errors in a conventional fitting with a 1-tau or 2-tau model.
However for the slope analysis method, a sufficient temperature rise
covering the first order phase transition is what we want.
r.)
The data can be analyzed using MultiVu. From the heat capacity control
panel (Figure 14, left side) under tab files, select “Raw Data File Viewing
and Post Processing.” A screen will appear as in Figure 14 on the right.
Figure 14: Screenshot of control panel and post processing window
s.) Select the single slope curve analysis method appropriate for a first order
phase transition. You can then view the checked traces (of which there
are three as performed from our sequence), which will bring up a window
of the raw data as in Figure 15. From this data, you can see the kinks that
are expected at a first order transition. If desired, this data can be saved
to a file.
Quantum Design Educational Module – Heat Capacity Measurement of VO2 (v.1)
14
Figure 15: Raw data of first order phase transition in VO2
t.) Alternatively, one can select to analyze the checked traces. The data will
be analyzed and plotted as in Figure 16. The plot shows the
experimentally obtained heat capacity in µJ/K. The latent heat peaks are
clearly evident, as is the expected hysteresis. This data can be saved to a
file for subsequent analysis and processing.
Quantum Design Educational Module – Heat Capacity Measurement of VO2 (v.1)
15
Figure 16: Heat capacity data for VO2 powder.
Questions:
1. Analyze your data to estimate the mass specific heat below the phase
temperature. Provide an estimate of the error bars and compare your
result to experimentally published data for crystals.
2. Now analyze your data to obtain an estimate of the latent heat. Again,
provide error bars, compare to literature values.
Note: for 1 and 2 you could use the data from C. N. Berglund, H. J.
Guggenheim, Phys. Rev. 185, 1022 (1969) for comparison. Or you can find
other data in the literature if you so choose.
3. Find a review paper on VO2, and write a paragraph summarizing the
interesting properties of this material. Discuss how the heat capacity plays
an important role in understanding the physics of this material.
Quantum Design Educational Module – Heat Capacity Measurement of VO2 (v.1)
16