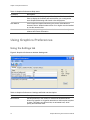
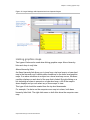
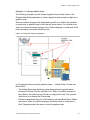
1
Graphics Monitoring and Control User Manual Security Products by GE are now part of the UTC Fire & Security family P/N 460650001C • ISS 11OCT10 Copyright © 2010 UTC Fire & Security. All rights reserved. This document may not be copied in whole or in part or otherwise reproduced without prior written consent from UTC Fire & Security, except where specifically permitted under US and international copyright law. Disclaimer The information in this document is subject to change without notice. UTC Fire & Security assumes no responsibility for inaccuracies or omissions and specifically disclaims any liabilities, losses, or risks, personal or otherwise, incurred as a consequence, directly or indirectly, of the use or application of any of the contents of this document. For the latest documentation, contact your local supplier or visit us online at utcfireandsecurity.com. This publication may contain examples of screen captures and reports used in daily operations. Examples may include fictitious names of individuals and companies. Any similarity to names and addresses of actual businesses or persons is entirely coincidental. Trademarks and patents GE and the GE monogram are trademarks of the General Electric Company and are under license to UTC Fire & Security. The Graphics Monitoring and Control name and logo are trademarks of UTC Fire & Security. Other trade names used in this document may be trademarks or registered trademarks of the manufacturers or vendors of the respective products. Intended use Use this product only for the purpose it was designed for; refer to the data sheet and user documentation for details. For the latest product information, contact your local supplier or visit us online at utcfireandsecurity.com. Manufacturer UTC Fire & Security HQ and regulatory responsibility: UTC Fire & Security, 9 Farm Springs Road, Farmington, CT 06034-4065, USA Contact information For contact information see our Web site: utcfireandsecurity.com Content Chapter 1 About this document 1 About this document 1 Safety terms and symbols 2 Related documentation 2 Contacting technical support 2 Chapter 2 Getting started 5 Overview 5 Quick start steps 6 Chapter 3 Graphics Preferences 7 Introduction 7 About Graphics Preferences 8 Using Graphics Preferences 10 Chapter 4 Creating symbols 15 Introduction 15 Overview 16 About the Graphics Symbol Editor 17 Using the Graphics Symbol Editor 21 Managing Graphics Symbol Editor files 30 Chapter 5 Creating graphics maps 33 Introduction 34 Overview 35 About the Graphics Map Editor 36 Using the Graphics Map Editor 43 Managing graphics map files 72 Chapter 6 Monitoring graphics maps 77 Introduction 77 Overview 78 About the Graphics Console 78 Using the Graphics Console 81 Printing graphics maps 90 Glossary 93 Index 95 Graphics Monitoring and Control User Manual i ii Graphics Monitoring and Control User Manual Chapter 1 About this document Summary This chapter provides general information about the contents of this document and how to use it. Content About this document 1 Safety terms and symbols 2 Related documentation 2 Contacting technical support 2 About this document This manual provides instructions for the installation, configuration, and operation of the Graphics Monitoring and Control (GMC) software. There is also information describing how to contact technical support if you have questions or concerns. To use this document effectively, you should have: • A basic knowledge of your access control system • A basic knowledge of general concepts associated with graphical editors Read these instructions and all ancillary documentation entirely before installing or operating this product. The most current versions of this and related documentation may be found on our website. Note: A qualified service person, complying with all applicable codes, should perform all required hardware installation. Graphics Monitoring and Control User Manual 1 Chapter 1: About this document Safety terms and symbols The following notices may appear in this manual: Caution: Cautions identify conditions or practices that may result in damage to the equipment or other property. WARNING: Warnings identify conditions or practices that could result in equipment damage or serious personal injury. Related documentation If you want to investigate related topics, these other Facility Commander Wnx 7.6 documents may prove helpful: • Facility Commander Wnx 7.6 User Manual • Facility Commander Wnx Help system • Facility Commander Wnx 7.6 Installation Manual Contacting technical support For assistance installing, operating, maintaining, and troubleshooting this product, refer to this document and any other documentation provided. If you still have questions, you may contact presales and technical support. Note: Be ready at the equipment before calling for technical support. You can reach technical support by phone 8 a.m. to 7 pm. EST, Monday through Friday. North America: 888-437-3287 Asia T 852-2907-8108 F 852-2142-5063 Australia T 61-3-9239-1200 F 61-3-9239-1299 2 Graphics Monitoring and Control User Manual Chapter 1: About this document Canada T 800-267-6317 F 613-737-5517 Europe T 32-2-725-11-20 F 32-2-721-40-47 Latin America T 561-998-6100 F 561-994-6572 utcfireandsecurity.com © 2010 UTC Fire & Security. All Rights Reserved. GE and the GE monogram are trademarks of the General Electric Company and are under license to UTC Fire & Security, 9 Farm Springs Road, Farmington, CT 06034-4065 Graphics Monitoring and Control User Manual 3 Chapter 2 Getting started Summary This chapter provides an overview of the Graphics Monitoring and Control system. Content Overview 5 Quick start steps 6 Overview Graphics Monitoring and Control allows you to create a map of your site that includes symbols which represent objects such as readers, controllers, or digital inputs. The symbols are assigned properties based on the type of object being represented. When the condition of a device property changes, one or more of the symbols changes its appearance based on the condition, if configured to do so. Commands can be sent to the associated devices from the site maps. Certain terms are used throughout this manual and are defined in the Glossary on page 93. Graphics Monitoring and Control consists of four applications that allow you to edit, link, and monitor graphics maps. These applications are: • Graphics Preferences allows you to control operations of the graphics software. You can define the number of layers that can be used to separate object types, the rate at which links blink to identify a graphics map in alarm, the way in which a new window displays, and the maximum number of devices that can be included in a control point. Graphics Monitoring and Control User Manual 5 Chapter 2: Getting started Refer to Chapter 3 “Graphics Preferences” on page 7 for more information. • Graphics Symbol Editor allows you to associate object types, such as readers, digital inputs, or controllers with icons representing properties and conditions. Use the Graphics Symbol Editor to create, delete, save, upload, and download symbol schemes. Refer to Chapter 4 “Creating symbols” on page 15 for more information. • Graphics Map Editor allows you to place symbols representing devices such as readers, digital inputs, or controllers on graphics maps. For example, start with a floor plan and place symbols on the map to indicate their location, and then associate these symbols to a physical device. In addition, you can add text to create labels. The Graphics Map Editor also allows you to import .gif, .jpg, .png, or AutoCAD .dxf files to be used in creating your graphics maps. Refer to Chapter 5 “Creating graphics maps” on page 33 for more information. • Graphics Console provides a graphical view of the premises and allows an operator to locate alarms or events as they occur, such as a communications failure alarm. The Graphics Console allows you to print maps and issue commands, such as locking and unlocking readers and arming or disarming intrusion zones and areas. Refer to Chapter 6 “Monitoring graphics maps” on page 77 for more information. Quick start steps 1. Define system wide settings for maps Chapter 3 “Graphics Preferences” on page 7 2. Create symbol schemes Chapter 4 “Creating symbols” on page 15 3. Import images or drawings for map background Chapter 5 “Creating graphics maps” on page 33 4. Place symbol schemes on maps and associate to devices Chapter 5 “Creating graphics maps” on page 33 5. Respond to alarms and issue commands Chapter 6 “Monitoring graphics maps” on page 77 6 Graphics Monitoring and Control User Manual Chapter 3 Graphics Preferences Summary This chapter describes how to set parameters that affect the behavior of the Graphics Monitoring and Control software and its capabilities. Content Introduction 7 About Graphics Preferences 8 Using Graphics Preferences 10 Using the Settings tab 10 Using the Property Condition Priorities tab 12 Using the Operator Settings tab 13 Uploading settings 14 Closing Graphics Preferences 14 Introduction The Graphics Preferences feature allows you to set parameters, such as the number of layers that can be used to separate device types, or the blink interval of a link in alarm. You can also change priorities of object type properties/conditions which affect how information is displayed in control points. Table 1 on page 8 describes the features of the Graphics Preferences form and where you can find steps to complete these tasks. Graphics Monitoring and Control User Manual 7 Chapter 3: Graphics Preferences Table 1: Task overview Change the settings. Refer to “Using the Settings tab” on page 10 for more information. Change the priority of condition values for properties to control how symbol icons are displayed on graphics maps. Icons assigned to property or condition values are displayed based on their priority, with higher priority icons placed on top of lower priority icons. This is especially important when using control points or the overlay technique for defining symbols. Refer to “Using the Property Condition Priorities tab” on page 12 for more information. Assign a default map to an operator. Refer to “Using the Operator Settings tab” on page 13 for more information. Save button: Once a setting is changed, use the Save button to save it for the remainder of the session. Upload button: Use the Upload button to permanently save the setting and make it available to other users. These settings are used with the Graphics Map Editor when creating graphics maps and the Graphics Console when viewing graphics maps. Refer to Chapter 5 “Creating graphics maps” on page 33 for more information. About Graphics Preferences Graphics preferences are set using the Graphics Preferences window, as shown in Figure 1 below. To open the window: In the Application Group, under Graphics, click Graphics Preferences. Figure 1: Graphics Preferences window 8 Graphics Monitoring and Control User Manual Chapter 3: Graphics Preferences Table 2: Graphics Preferences window Element Description Title bar Displays the name of the application: Graphics Preferences. Menu bar Provides access to the following menus: File, Window, and Help. For more information, see Table 3 below and Table 5 on page 10. Save Saves a setting to the local computer for this session. To publish the setting to the database for use in future sessions and to make it available to other users, the setting must be uploaded to the database. Note: Operator settings are automatically uploaded to the database when you click Save. Upload Uploads a modified setting to the database. If no change has been made or if the setting is the same as the one that existed at the time of the last upload, this button is disabled. Undo Reverts the setting back to the last uploaded or saved state. Table 3: Graphics Preferences File menu Command Description Save Saves a setting to the local computer for this session. To publish the setting to the database for use in future sessions and to make it available to other users, the setting must be uploaded to the database. Note: Operator settings are automatically uploaded to the database when you click Save. Upload Uploads a modified setting to the database. If no change has been made or if the setting is the same as the one that existed at the time of the last upload, this button is disabled. Undo Reverts the setting back to that which was last uploaded or saved. Exit Click to exit the Graphics Preferences window. Table 4: Graphics Preferences Window menu Command Description Always on Top Use if you want a window to always display in front of all other windows on the desktop. Save Position Use if you want the window to open in a specific position on the desktop. Graphics Monitoring and Control User Manual 9 Chapter 3: Graphics Preferences Table 5: Graphics Preferences Help menu Command Description Online Help Launches the online help page specific to Graphics Preferences. Click Show to display the Contents pane which allows you to navigate the entire Graphics Monitoring and Control online help system. User Manual Click to open the Graphics Monitoring and Control User Manual in electronic format. Adobe Acrobat version 5.x or higher must be installed to view the manual online. About... Click to display a dialog box that contains the current version of your software and contact information. Using Graphics Preferences Using the Settings tab Figure 2: Graphics Preferences window: Settings tab Table 6: Graphics Preferences: Settings tab fields and description Field name Description Blink Interval Set this parameter to the number of milliseconds allowed between blinks on a hyperlink or a hyperlink area when a child map has a symbol in alarm. This setting only affects links, not animated icons, which specify their own blink rates. 10 Graphics Monitoring and Control User Manual Chapter 3: Graphics Preferences Maximum Number of Layers The number of layers that may be used when creating a map. Layers allow you to separate the types of devices on the map; for instance, you can have a background layer as well as a layer for controllers, another for readers, and another for cameras. Set this parameter to the number of layers that can be used to separate device types. Auto-Launch Displays in New Window Set to Yes to launch a new Graphics Console window when an alarm that has an associated map is selected on the Alarm Monitor. Otherwise an existing window is used. By default this parameter is set to No. Maximum Devices In Control Point Control points are used to group related devices for centralized monitoring and control. Set this parameter to the maximum number of devices allowed in a control point. By default the maximum is set at 16, however this value can be increased up to 32. Tooltip Display Time The number of seconds a tooltip will be displayed. A tooltip displays the configuration information for a particular symbol. The tooltip is displayed when you position your cursor over a symbol. Min The minimum number that can be assigned to the selected field. This value is automatically populated when a field is selected; if no field is selected, this value is blank. Max The maximum number that can be assigned to the selected field. This value is automatically populated when a field is selected; if no field is selected, this value is blank. Type The type of entry you can make in the Value field, either Integer ( a numeric value) or Boolean (True or False). This value is automatically populated when a field is selected; if no field is selected, this value is blank. Default The default number used for the selected field. This value is automatically populated when a field is selected; if no field is selected, this value is blank. Reset Click to restore the value used for the selected field to its default value. Click Save to save this setting and upload it to the database. To change a setting: 1. In the Application Group, under Graphics, click Graphics Preferences. 2. If necessary, click the Settings tab. 3. Highlight the name of the setting and double click on the value that you want to change. 4. Enter the new value you want to apply in the Value field. Note: If the number entered is outside the range defined by the Min/Max values, it appears in red. This indicates an invalid value, and the Save and Upload buttons are disabled. 5. Click Save when you are finished. 6. Click Upload to upload to the database. Graphics Monitoring and Control User Manual 11 Chapter 3: Graphics Preferences Using the Property Condition Priorities tab This Property Condition Priorities tab allows you to control how symbol icons will appear on a map. Symbols with higher level priorities will be placed on top of symbols in your graphics maps that have a lower priority. The highest priority property/condition of all alarms for all devices in a control point, determines which device alarm is shown for the control point. As a general rule, the most critical alarms should be highest in the list. Figure 3: Graphics Preferences window: Property Condition Priorities tab Table 7: Graphics Preferences: Property Condition Priorities tab fields and description Field name Description Property This column lists all of the defined characteristics for the selected object type, in order of their priority. Condition This column lists the possible values associated to a property, such as set or reset. 12 Graphics Monitoring and Control User Manual Chapter 3: Graphics Preferences Move up/Move down Highlight a property/condition and click one of these arrows to change the priority order. To reorder a property/condition priority: 1. In the Application Group, under Graphics, click Graphics Preferences. 2. Click the Property Condition Priorities tab. 3. Highlight the name of the Property/Condition. The Move up/Move down arrows on the right are enabled. 4. Click the Move up/Move down arrow to change the position of the selected property. 5. Continue to reorder as necessary the Property/Condition combinations to reflect the priority in which you want them to display, placing the highest priority first. This procedure only needs to be performed once. 6. Click Save when you are finished. 7. Click Upload to upload to the database. Using the Operator Settings tab Figure 4: Graphics Preferences window: Operator Settings tab Table 8: Graphics Preferences: Operator Settings fields and description Field name Description Operator This column lists the operators as defined by their Login ID. Default Map A default map can be selected to display when an operator opens the first graphics viewer window. Graphics Monitoring and Control User Manual 13 Chapter 3: Graphics Preferences To change an operator setting: 1. In the Application Group, under Graphics, click Graphics Preferences. 2. Click the Operator Settings tab. 3. Highlight the name of the operator and double click in the default map column. A drop down list of available maps displays. 4. Select the map you want to use as the default display for this operator. 5. Click Save when you are finished. This setting is automatically uploaded to the database. Uploading settings Settings are stored on the local system, until they are uploaded to the database for centralized storage and backup. To upload a setting , click the Upload button on the toolbar. Note: Operator settings are automatically uploaded to the database when you click Save. Closing Graphics Preferences When you change a setting and then close the setting window, the following dialog is displayed: Figure 5: Close Graphics Preferences Yes: Saves locally, uploads the changes, and then closes Graphics Preferences. No: Discards any changes and then closes Graphics Preferences. Cancel: Keeps Graphics Preferences open. 14 Graphics Monitoring and Control User Manual Chapter 4 Creating symbols Summary This chapter describes how to create a symbol scheme with icons representing devices such as readers, digital inputs, and controllers. Content Introduction 15 Overview 16 About the Graphics Symbol Editor 17 Using the Graphics Symbol Editor 21 Associating object types 21 Using icons 25 Creating symbol schemes 26 Managing Graphics Symbol Editor files 30 Uploading a symbol scheme 31 Downloading a symbol scheme 31 Deleting a symbol scheme from the hard drive 31 Deleting a symbol scheme from the database 32 Introduction The Graphics Symbol Editor allows you to create symbol schemes that represent the various conditions of your devices by associating icons for each condition of each device property. Table 9 on page 16 describes the features of the Graphics Symbol Editor and where you can find steps to complete these tasks. Graphics Monitoring and Control User Manual 15 Chapter 4: Creating symbols Table 9: Task overview Associate icons to each condition for each property of each object type. Refer to “Using the Graphics Symbol Editor” on page 21 for more information. Upload the symbol scheme to the database. Refer to “Uploading a symbol scheme” on page 31 for instructions on how to upload the symbol scheme to the database. Place the symbols on your graphics maps and associate them to the devices they represent. Refer to “Configuring Symbols” on page 47 for instructions on how to associate a symbol to a specific device. Overview Use the Graphics Symbol Editor shown in Figure 6 on page 18 to associate icons with conditions of properties of device types, such as readers, digital inputs, and controllers. The icons represent the condition, such as set and reset, for each object type property. This collection of icons and specific attributes represents a symbol scheme or symbol. Before you define a symbol scheme, decide the way you want the status of an object type to display on a graphics map. You may select any of the following techniques: • • • Overlay Decoration Drawn area Details of each are given below. Overlay: Technique by which only one property condition is visible at a time, governed by the Property Condition Priorities. This results in a less cluttered display but is limited in the level of detail included. The system provides default sets of icons in multiple colors. For example, you may choose to have a gray reader icon represent a device in the initial state and have it replaced with a red reader icon when a forced open condition occurs. 16 Graphics Monitoring and Control User Manual Chapter 4: Creating symbols Decoration: Technique by which multiple property conditions are visible simultaneously. This approach incorporates more detail in the display but requires more recognition on the part of the operator and requires more space on a graphics map. The system provides two sizes of default icons: • 24x24 for the smaller base icons and 16x16 for the corresponding smaller decoration icons that are placed around the base icon. • 32x32 for the smaller base icons and 24x24 for the corresponding smaller decoration icons that are placed around the base icon. See “Using default icons” on page 25 for more information on how to use the default icons. Drawn Area: Technique by which a drawn area displays defined attributes through the use of colors, shading, and/or bitmap fill instead of icons. These techniques can be applied on a per-device basis. For example, you can choose to display controller properties and conditions by priority but display all reader properties and conditions. The way you create your symbol scheme depends on the way in which you choose to display this information. See “Using the Graphics Symbol Editor” on page 21 for more information. Once a symbol scheme is created, use the Upload button to copy it to the database. Once the symbol scheme is copied to the database, it is ready to use with the Graphics Map Editor to create display maps and is also available to other users. Refer to Chapter 5 “Creating graphics maps” on page 33 for more information. About the Graphics Symbol Editor You can add, change, or delete symbols using the Graphics Symbol Editor window, as shown in Figure 6 on page 18. To open the Graphics Symbol Editor window: In the Application Group, under Graphics, click Graphics Symbol Editor. Graphics Monitoring and Control User Manual 17 Chapter 4: Creating symbols Figure 6: Graphics Symbol Editor window Table 10: Graphics Symbol Editor fields and description Field name Description Title bar Displays the name of the window: “Graphics Symbol Editor” Menu bar The Graphics Symbol Editor menu bar provides access to the following menus: File, Generic Type, Window, and Help For more information, see Table 11 on page 19, Table 12 on page 20, and Table 14 on page 20.) New Use to create a new symbol scheme. Refer to “Using the Graphics Symbol Editor” on page 21 for more information. Save Use to save a symbol scheme to the hard drive. To publish the symbol scheme for use with the Graphics Map Editor, it must be uploaded to the database. See the description of the “Upload and Download” buttons later in this table for more information. Delete Use to delete a symbol scheme from the hard drive. To delete a symbol scheme from the database, refer to “Deleting a symbol scheme from the hard drive” on page 31. 18 Graphics Monitoring and Control User Manual Chapter 4: Creating symbols Field name Description Upload and Download Use to upload new or modified symbol schemes to the database. Use to download a symbol scheme from the database to the local computer to make changes. After the symbol scheme has been modified and you are ready to publish the changes, click Upload. Refer to “Uploading a symbol scheme” on page 31 and “Downloading a symbol scheme” on page 31 for more information. Existing Symbols Displays a list of previously defined symbol schemes in alphabetical order. Symbol Name Use this field to enter a name identifying a new symbol scheme. Use up to 128 characters. Symbol names cannot contain any of the following characters: \/:*?“<>| Base Icon Displays the icon representing the device in its initial condition. This icon displays in the Graphics Map Editor Show Symbols window. See the “Show Symbols” button in Table 17 on page 36 for more information. Browse Click Browse to locate the folder with the base icon you want to use. Object Type Use this list to select an object type, such as Digital Input, Controller, Reader, Area, or Intrusion Zone. Initially Transparent Select this check box to make the symbol for the base icon transparent until an alarm occurs. Property Displays the characteristics of the object type selected. For example, if a video device is selected, the properties include Video Equipment Disk Full and Video Equipment Comm Failure. Refer to Table 15 on page 21 for a complete list. Condition Displays the appropriate condition for the property. Refer to Table 15 on page 21 for a complete list. Icon Displays the image icon associated with the condition. Use the Active check box to enable the icon. Active Click the Active check box and the Attach window displays. Select the graphic image you want to represent the condition. Click Attach. A check mark displays to indicate this property is now enabled in the symbol. When the Active check box is selected, the graphic image can be used when creating graphics maps. If you clear the check box to remove the symbol, it no longer appears on the graphics maps when the condition changes. Table 11: Graphics Symbol Editor File menu Command Description New Use to create a new symbol. Graphics Monitoring and Control User Manual 19 Chapter 4: Creating symbols Command Description Save Use to save a symbol to the hard drive. To publish the symbol for use with the Graphics Map Editor, the symbol must be uploaded to the database. Delete Use to delete a symbol from the hard drive. Upload... Use to upload new or modified symbol schemes to the database. Download... Use to download a symbol scheme from the database to the local computer to make changes. After the symbol scheme has been modified and you are ready to publish the changes, click Upload. Delete from Database... Click to display a list of symbol schemes found in the database. Select from the list and click Remove to delete the file from the database. Exit Click to close the Graphics Symbol Editor window. Table 12: Graphics Symbol Editor Generic Type menu Command Description Add or Remove... Click to display a list of available and selected custom devices used to populate the Object Type list. Select a device and click Add/Remove to add/delete it to/from the list. Object types represent generic devices in your system, such as an air conditioner. Each individual generic device is an object type; for example if you wanted to add two air conditioners, you would add two object types. Any alarms associated with a generic object type have the two conditions: Set and Reset. Table 13: Graphics Symbol Editor Window menu Command Description Always On Top Use if you want a window to always display in front of all other windows on the desktop. Save Position Use if you want the window to open in a specific position on the desktop. The size of the window is also saved. Table 14: Graphics Symbol Editor Help menu Command Description Online Help Click to launch the online help page specific to Graphics Symbol Editor. Click Show to display the Contents pane which allows you to navigate the entire Graphics Monitoring and Control online help system. User Manual Click to open the Graphics Monitoring and Control User Manual in electronic format. Adobe Acrobat version 5.x or higher must be installed to view the manual online. About ... Click to display a dialog box that contains the current version of your software and contact information. 20 Graphics Monitoring and Control User Manual Chapter 4: Creating symbols Using the Graphics Symbol Editor Use the Graphics Symbol Editor to create symbol schemes. A symbol scheme is a collection of graphic images or icons representing each condition of each device property. You select an object type and assign an icon to each condition of each property. Associating object types The following table lists the available object types and their associated properties and conditions. Table 15: Associating Object types, Properties, and Conditions Object type Display Type Properties Conditions API Alarm Icon API Alarm Alarm, Reset Area (Drawn) Drawn Area Area Status Armed, Disarmed Area (Icons) Icon Area Status Armed, Disarmed Camera [3] Icon Camera Alarm, Reset Video Motion Alarm, Reset Video Loss Alarm, Reset Camera Analytics Alarm Alarm, Reset Camera Trouble Alarm, Reset Client Icon Database/Region Failover Alarm, Reset File Server Failover Alarm, Reset Client/Device Failover Alarm, Reset Controller Icon Cabinet Tamper (ACU only) Alarm, Reset AC Power Failure Alarm, Reset Controller Comm Failure Alarm, Reset Comm Encryption Alarm, Reset Low Battery (ACU and DirecDoor only) Alarm, Reset Fire (DirecDoor only) Alarm, Reset Module 4 Port 1 Offline (ACU only) Alarm, Reset Module 5 Port 1 Offline (ACU only) Alarm, Reset Module 6 Port 1 Offline (ACU only) Alarm, Reset Graphics Monitoring and Control User Manual 21 Chapter 4: Creating symbols Object type Display Type Properties Conditions Module 7 Port 1 Offline (ACU only) Alarm, Reset Module 4 Port 2 Offline (ACU only) Alarm, Reset Module 5 Port 2 Offline (ACU only) Alarm, Reset Module 6 Port 2 Offline (ACU only) Alarm, Reset Module 7 Port 2 Offline (ACU only) Alarm, Reset Module 4 Port 1 Tamper (ACU only) Alarm, Reset Module 5 Port 1 Tamper (ACU only) Alarm, Reset Module 6 Port 1 Tamper (ACU only) Alarm, Reset Module 7 Port 1 Tamper (ACU only) Alarm, Reset Module 4 Port 2 Tamper (ACU only) Alarm, Reset Module 5 Port 2 Tamper (ACU only) Alarm, Reset Module 6 Port 2 Tamper (ACU only) Alarm, Reset Module 7 Port 2 Tamper (ACU only) Alarm, Reset Digital Input [1] Icon Input State Alarm, Reset, Trouble (Cut), Trouble (Short) Input Condition Micro and ACU: Active, Inactive, Cut, Short ACU only: Active (Masked), Inactive (Masked), Line Fault, Ground Digital Output [2] Icon Output Condition Active, Inactive Event Trigger Icon Combined Trigger Status Active, Inactive Physical Trigger Status Active, Inactive Manual Trigger Status Active, Inactive Generic Type Icon User defined Set, Reset Intrusion Zone Drawn Area Intrusion Zone Status Armed, Disarmed Intrusion Zone Icon Intrusion Zone Status Armed, Disarmed 22 Graphics Monitoring and Control User Manual Chapter 4: Creating symbols Object type Display Type Properties Conditions OH Receiver Controller Icon Controller Alarm Alarm, Reset OH Receiver Zone Icon Zone Alarm Alarm, Reset Reader Icon Forced Open Alarm, Reset, Trouble (Cut), Trouble (Short) Held Open Micro and ACU: Alarm, Reset ACU only: Trouble (Cut), Trouble (Short) Invalid Credential Occurred Lost Credential Occurred Duress Occurred Supervised Reader (Micro only) Alarm, Reset Supervised Exit On, Off, Trouble (Cut), Trouble (Short) Reader Condition (ACU only) Locked, Unlocked Maximum Invalid PIN (ACU only) Occurred Lock Monitoring (ACU only) Alarm, Reset Reader Offline (ACU only) Alarm, Reset Reader Tamper (ACU only) Alarm, Reset Video Equipment Icon Disk Full Alarm, Reset Comm Failure Alarm, Reset Health Failure Alarm, Reset Health Trouble Alarm, Reset [1] In order for the state of a Request-to-Exit (REX), configured for 4-state supervision, to display on a graphics map, it needs to be configured as a reader, not as an individual digital input (DI). [2] In order for the state of a digital output to display on a graphics map, the Send Real Time Digital Output Status check box must be selected on the Controller Definition tab of the Controller form for the associated controller. [3] The Camera device type supports the custom configuration property of Preset. When creating a symbol of this device type, the graphics software supports the selection of a camera preset for the assigned camera. Graphics Monitoring and Control User Manual 23 Chapter 4: Creating symbols Adding a generic object type If you have external interfaces in your system, such as air conditioners, you can display and control them using the Graphics Monitoring and Control application suite. To add a generic object type: 1. In the Application Group, under Graphics, click Graphics Symbol Editor. The Graphics Symbol Editor shown in Figure 6 on page 18 displays. 2. On the Generic Type menu, click Add or Remove. The Add or Remove Generic Types dialog displays a list of available generic types in the Generic Types to Choose pane and a list of generic types that have already been selected in the Chosen Generic Types pane. 3. In the Generic Types to Choose pane, select a generic type. Click the right arrow button to move the selected item to the Chosen Generic Types pane. 4. Click OK to accept and close the dialog box. The generic type now appears in the Object Type list on the Graphics Symbol Editor page. Removing a generic object type Note: A generic object type cannot be removed if a symbol has been created for it. You must delete the symbol first. To remove a generic object type: 1. In the Application Group, under Graphics, click Graphics Symbol Editor. The Graphics Symbol Editor shown in Figure 6 on page 18 displays. 2. On the Generic Type menu, click Add or Remove. The Add or Remove Generic Types dialog displays a list of available generic types in the Generic Types to Choose pane and a list of generic types that have already been selected in the Chosen Generic Types pane. 3. In the Chosen Generic Types pane, select the generic type you want to remove. Click the left arrow button to move the selected item to the Generic Types to Choose pane. 4. Click OK to accept and close the dialog box. The generic type no longer appears in the Object Type list on the Graphics Symbol Editor page. 24 Graphics Monitoring and Control User Manual Chapter 4: Creating symbols Using icons When creating a symbol scheme, you can select from the default icons provided, or you can create customized icons. Before you create a symbol scheme, you need to understand how to use these icons. Using default icons For base icons or those used as overlay icons, select from the default icons located in the directories shown below. For smaller icons: c:\Program Files\GE\FCWnx\ Graphics Cache\Samples\icons\Base24x24 For larger icons: c:\Program Files\GE\FCWnx\ Graphics Cache\Samples\icons\Base32x32 For the decoration images (those placed on or around a base icon to indicate a property/condition), select from the default icons located in the directories listed below. For smaller decorations: c:\Program Files\GE\FCWnx\ Graphics Cache\Samples\icons\Decorations16x16 For larger decorations: c:\Program Files\GE\FCWnx\ Graphics Cache\Samples\icons\Decorations24x24 Using customized icons Several graphics formats are supported, including .gif, jpg, and .png. The maximum size for symbol icons is 32 x 32 pixels. Caution: If you create animated .gif files for use on symbols or maps, there must not be any frame with a “zero” delay time, as this results in 100% CPU usage on the client. Should this occur, you need to log off and close all browsers in order to recover. Certain image formats, such as .gif, support the concept of transparency. When a transparent image is placed on top of the base image, the base image can show through. This technique allows you to use AutoCAD drawings or other backgrounds more effectively and is recommended when developing customized icons. Graphics Monitoring and Control User Manual 25 Chapter 4: Creating symbols In transparent images, all background pixels not contributing to the actual image should be transparent. For example, if the transparent image is a rectangle, all pixels not on the line forming the rectangle should be transparent. Decoration images (those placed on or around a base icon to indicate a property/condition) should always be transparent. Figure 7: Transparent image overlay In nontransparent images, the background pixels on the interior of the image are not transparent; if desired, you can make pixels on the outer edge transparent in order to “size” the image. Base icon images or those that you want to place over the base icon, hiding it, should always be nontransparent. Figure 8: Nontransparent image overlay Creating symbol schemes Create symbol schemes based on how you want to display the status of your devices on graphics maps, either by displaying only the highest priority property/condition (Overlay technique), by displaying multiple properties/conditions of a device (Decoration technique), or by a drawing that displays different colors and shadings based on the property/condition of an area or intrusion zone (Drawn Area technique). Display using the Overlay technique This technique displays only the highest priority property/condition symbol of a device. This results in a less cluttered display but is limited in the level of detail shown at one time. 26 Graphics Monitoring and Control User Manual Chapter 4: Creating symbols To use overlays: 1. In the Application Group, under Graphics, click Graphics Symbol Editor. The Graphics Symbol Editor shown in Figure 6 on page 18 displays. 2. Enter the name of the symbol scheme in the Symbol Name field. 3. Select the type in the Object Type list. The appropriate properties and conditions for that object type are displayed. 4. Click Browse to select the file you want to use as an icon to represent the base icon. For example, for a controller, use a gray controller image. 5. Click Attach. The icon displays in the Base Icon window. The Graphics Map Editor uses this image to represent the symbol scheme. 6. Select the Active check box to display the Attach window. Select the image you want to display for each condition of each property. The image should be the same size as the base icon image and it should not be transparent. For example, for a Cabinet Tamper, use a red controller image. 7. Place the new icon (the red controller image) over the base icon (the gray controller image). Note: To adjust the location of the new icon a pixel at a time, use the arrow keys on your keyboard. 8. Click Attach. This image displays on the map when an associated device property has that condition value. The Active check box displays a check mark indicating this image has been associated with the condition. 9. Click Save when you are finished. If you want to create another symbol scheme, click New to clear the information and continue making new selections. 10. Use the Upload button to permanently save the symbol scheme to the database and make it available to other users. To create multiple symbol schemes using the same device types, select the symbol scheme you want to use, change the name, and click Save. 11. On the Windows menu, click Exit to close the Graphics Symbol Editor window. Graphics Monitoring and Control User Manual 27 Chapter 4: Creating symbols Display using the Decoration technique This technique displays all alarm state symbols of a device. This approach incorporates more detail in the display but requires more recognition on the part of the operator and could take up more space on the map. To use decorations: 1. In the Application Group, under Graphics, click Graphics Symbol Editor. The Graphics Symbol Editor shown in Figure 6 on page 18 displays. 2. Enter the name of the symbol scheme in the Symbol Name field. 3. Select the type in the Object Type list. 4. The associated properties and conditions for that object type display. 5. Click Browse to select the file you want to use as an icon to represent the base icon. For example, for a Controller, use a gray controller image. This image should not be transparent. 6. Click Attach. The icon displays in the Base Icon window. The Graphics Map Editor uses this image to represent the symbol scheme. 7. Select the Active check box to display the Attach window. Select the image you want to display for each condition of each property. For example, for a Cabinet Tamper, use a red X. The image can be any size but it should have a transparent background. You may place this image anywhere relative to the base icon, or on top of the base icon. Note: To adjust the location of the new icon a pixel at a time, use the arrow keys on your keyboard. 8. Click Attach. This image displays on the map when an associated device property has that condition value. The Active check box displays a check mark indicating this image has been associated with the condition. 9. Click Save when you are finished. If you want to create another symbol scheme, click New to clear the information and continue making new selections. 28 Graphics Monitoring and Control User Manual Chapter 4: Creating symbols 10. Use the Upload button to permanently save the symbol scheme to the database and make it available to other users. To create multiple symbol schemes using the same object type, select the symbol scheme you want to use, change the name, and click Save. 11. On the Windows menu, click Exit to close the Graphics Symbol Editor window. Display using the Drawn Area technique This technique displays different attributes on a drawn area based on the property/condition of an area or intrusion zone. To use drawn areas: 1. In the Application Group, under Graphics, click Graphics Symbol Editor. The Graphics Symbol Editor shown in Figure 6 on page 18 displays. 2. Enter the name of the symbol scheme in the Symbol Name field. 3. Select the type in the Object Type list, either Area or Intrusion Zone. The appropriate properties and conditions for that object type display: Armed or Disarmed. 4. Click Browse to select the drawn area attributes for the background fill, color, texture, borders, or bitmap fill. 5. Select the Blinking check box if you want the pattern to blink when an alarm is generated. 6. Click Apply All. The area attributes display in the Base Icon window. The Graphics Map Editor uses these attributes to represent the symbol scheme. 7. Select the Active check box to display the Drawing Attributes window. Select the attributes you want to display for each condition of each property. For example, for an Armed condition, use a red background. 8. Click Apply All. These attributes display on the map when an associated area or intrusion zone has that condition value. The Active check box displays a check mark indicating these attributes have been associated with the condition. 9. Click Save when you are finished. If you want to create another symbol scheme, click New to clear the information and continue making new selections. Graphics Monitoring and Control User Manual 29 Chapter 4: Creating symbols 10. Use the Upload button to permanently save the symbol scheme to the database and make it available to other users. To create multiple symbol schemes using the same object type, select the symbol scheme you want to use, change the name, and click Save. 11. On the Windows menu, click Exit to close the Graphics Symbol Editor window. Managing Graphics Symbol Editor files Symbol schemes are stored on the local system until they are uploaded to the database for centralized storage and backup. Once the files are uploaded, they are available to use with the Graphics Map Editor to create maps. The system performs a check when you choose to edit an existing symbol scheme and if the version on your hard drive is not the most current version, the following dialog displays: Figure 9: Confirmation dialog Yes: Download and edit the latest file. No: Continue editing the older file. Cancel: Cancel the operation. Refer to the following sections for more information: • “Uploading a symbol scheme” on page 31 • “Downloading a symbol scheme” on page 31 • “Deleting a symbol scheme from the hard drive” on page 31 30 Graphics Monitoring and Control User Manual Chapter 4: Creating symbols Uploading a symbol scheme To upload a symbol scheme to the database: 1. In the Existing Symbols column, select the symbol name you want to upload to the database. 2. On the File menu, click Upload, or click the Upload toolbar button. A window with this message displays: Are you sure you want to upload current symbol? If the symbol scheme has already been uploaded to the database, this message displays: Are you sure you want to overwrite the database symbol file name? 3. Click Yes to upload the symbol scheme to the database for distribution. Once a symbol scheme has been defined, it can be used on graphics maps to reflect the state of the device types and to issue commands to devices. Refer to Chapter 5 “Creating graphics maps” on page 33 for instructions. Downloading a symbol scheme To download a symbol scheme: 1. On the File menu, click Download or click the Download toolbar button. 2. Select which symbol scheme you want to download from the database. 3. Click OK to copy the file from the database to your local system. Deleting a symbol scheme from the hard drive To delete a symbol scheme from the hard drive: 1. Select the symbol scheme you want to delete in the Existing Symbols list. The information for this record displays. 2. On the File menu click Delete, or click the Delete toolbar button. A window displays a message asking: Are you sure you want to remove this symbol? Click Yes to remove the symbol scheme. This removes the symbol scheme from the local system only. If it has been uploaded to the database and you want to delete it, the file must be removed as described in “Deleting a symbol scheme from the database” on page 32. 3. On the File menu, click Exit to close the Graphics Symbol Editor window. Graphics Monitoring and Control User Manual 31 Chapter 4: Creating symbols Deleting a symbol scheme from the database To delete a symbol scheme from the database: 1. Select the symbol scheme you want to delete in the Existing Symbols list. The information for this record displays. 2. On the File menu, click Delete from Database. The Deleting window displays a list of Resources Found. 3. Highlight the symbol scheme you want to delete and click Remove. A window displays a message asking: Are you sure you want to remove this symbol? 4. Click OK to remove the symbol scheme from the database and exit the window. This removes the symbol scheme from the database. 5. On the File menu, click Exit to close the Graphics Symbol Editor window. 32 Graphics Monitoring and Control User Manual Chapter 5 Creating graphics maps Summary This chapter describes how to create graphics maps by importing images or AutoCAD drawings and associating symbols created with the Graphics Symbol Editor to devices such as digital inputs, readers, and controllers. Readers should be familiar with using other graphic drawing programs. Content Introduction 34 Overview 35 About the Graphics Map Editor 36 Using the Graphics Map Editor 43 Using the Drawing tools 43 Changing Graphic attributes 44 Creating a graphics map 45 Configuring Symbols 47 Custom Device Configuration and Configuration Properties 48 Adding text labels to the graphics map 49 Saving the graphics map 50 Importing images 51 Importing AutoCAD .dxf drawings 51 Linking graphics maps 57 Creating Alarm hierarchy links 58 Creating Jump to only links 63 Configuring Command Groups 64 Configuring Control points 65 Configuring an Area or Intrusion Zones 68 Working with layers 69 Managing graphics map files 72 Uploading graphics maps 72 Graphics Monitoring and Control User Manual 33 Chapter 5: Creating graphics maps Downloading graphics maps 74 Deleting unused files 74 Introduction This feature allows you to design graphics maps of your site and associate symbols to devices in your system. When a condition changes, one or more of the icons change appearance based on the condition, if configured to do so. Table 16 below lists the steps needed to complete a graphics map and references where you can find detailed instructions to complete these tasks. Table 16: Task Overview Create symbol schemes and upload to the database. Refer to Chapter 4 “Creating symbols” on page 15 for more information. Import an AutoCAD drawing or graphic image, which becomes the background layer in the Graphics Map Editor. Refer to “Importing images” on page 51 for the procedure to import existing image files or drawings. You can also use the drawing tools to create a graphics map. Refer to “Using the Drawing tools” on page 43 for more information. Place symbols representing devices such as readers, controllers, or digital inputs and associate them to a specific database device record. Symbols can be grouped on different layers to improve visibility when viewing the completed graphics maps. Add text labels, if needed. Refer to the following sections: “Creating a graphics map” on page 45. “Configuring Symbols” on page 47. Save file and upload completed graphics map to the database. Refer to “Managing graphics map files” on page 72 for more information. Build and link maps using the Create Links toolbar button. An icon/image represents the hyperlink. Refer to “Linking graphics maps” on page 57 for more information. Build and link maps using the Create Hyperlink Area toolbar button. A user-defined shape represents the hyperlink. Refer to “Linking graphics maps” on page 57. Configure multiple symbols in one location on a map using Control Points. Refer to “Configuring Control points” on page 65. Configure a set of devices of the same type to be controlled as a unit, using the Create Command Group toolbar button. Refer to “Configuring Command Groups” on page 64. 34 Graphics Monitoring and Control User Manual Chapter 5: Creating graphics maps Overview The Graphics Map Editor allows you to associate symbols to devices in your system. A symbol scheme identifies icons that represent controllers, or other device types in various conditions. These icons are associated with a device property and condition and when that condition occurs, the appropriate icon displays on the graphics map. For example, a symbol scheme with icons representing a controller in an alarm state may include the following symbols: • Gray controller to represent the base condition • Red controller to represent a Cabinet Tamper alarm set condition • Green controller to represent a Cabinet Tamper alarm reset condition When an alarm is generated at the specific controller, the appropriate icon for the condition displays on the map. Refer to “Using the Graphics Symbol Editor” on page 21 for more information. If you create graphics maps and link them in a chain using alarm links, the hyperlink icons on each level show the alarm state of the maps in the chain. Refer to “Linking graphics maps” on page 57. There are three ways to create a graphics map: • Create a map with the drawing tools provided by the Graphics Map Editor. Using the drawing tools, such as circles, lines, polylines, rectangles, and text entries, you can create a site map, or a graphical representation of your facilities. Refer to “Using the Drawing tools” on page 43 for more information. • Use an existing .gif, .jpg, or .png graphics file. Most professional drawing applications usually have the capability to save a drawing in a .gif, .jpg, or .png format. Refer to “Importing .gif, .jpg, or .png images” on page 51 for more information. • Import .dxf drawings created with AutoCAD. Site maps and drawings with a .dxf extension can be imported if they are saved in AutoCAD DXF R12, R13, R14, 2000 or 2000i format. Refer to “Importing AutoCAD .dxf drawings” on page 51 for instructions. To achieve the best results in your site map, draw the map as close to the size of the window in which it will be displayed. If you are importing a .gif, .jpg, or .png graphic image file, size the image to fit the window in which it will be displayed. Whenever possible, be consistent and keep all of your displays the same size. Graphics Monitoring and Control User Manual 35 Chapter 5: Creating graphics maps Note: Please note that icon and image files are referenced by name, and therefore should be unique. It is not possible to have two files with the same name, and any attempt to do so will cause the new file to overwrite the original. About the Graphics Map Editor You create and edit a site map in the Graphics Map Editor window, shown in Figure 10 below. The features and controls in the window are described in Table 17 below. To open the window: In the Application Group, under Graphics, click Graphics Map Editor. Figure 10: Graphics Map Editor window Table 17: Graphics Map Editor elements and description Element Description Title bar Displays the program name, Graphics Map Editor, as well as the window number. 36 Graphics Monitoring and Control User Manual Chapter 5: Creating graphics maps Element Description Menu bar The menu bar contains the following menus: File, Edit, Placement, Transform, Utilities, Zoom, Layer, Window, and Help For more information, see Table 18 on page 38 through Table 26 on page 42. Font toolbar Use the lists to select a font type and font size. The available fonts are determined by the workstation where the Graphics Map Editor is being used to create drawings. If fonts used in the drawing are unavailable on the workstation where the drawing is displayed, substitute fonts are used. Click toolbar buttons to make the font bold or italic. Drawing tools Refer to “Using the Drawing tools” on page 43 for instructions on how to use these drawing tools. Import Image Displays the Open window, which allows you to select a .gif, .jpg, or .png file to use as the background layer. Refer to “Importing .gif, .jpg, or .png images” on page 51 for more information. Import AutoCAD Drawing Displays the Import AutoCAD Drawing window, which allows you to select a .dxf file to use as the background layer. Refer to “Importing AutoCAD .dxf drawings” on page 51 for more information. Create Hyperlink Links two graphics maps together, either to link alarms or simply as a navigational jump. The hyperlink icon displays on the graphics map when it is viewed with the Graphics Console. Click it to display the associated map. Refer to “Linking graphics maps” on page 57 for instructions on how to link maps. Create Hyperlink Area Use the Create Hyperlink Area toolbar button to draw a border around an irregular shape, creating a custom hyperlink path on a graphics map. Refer to “Linking graphics maps” on page 57 for instructions on how to link maps. Create Control Points Click the Create Control Points toolbar button to configure a related set of devices of different types to be monitored and controlled by a single icon. For example, you could configure all devices in a particular area of a building, such as a Lobby, as a single control point. The control point always displays the alarm and state information for the device with the highest alarm priority. After the control point has been configured, right-click to display the Context menu. Click Show Details to display an exploded view of the control point. Graphics Monitoring and Control User Manual 37 Chapter 5: Creating graphics maps Element Description Create Command Group Configures a group of devices of the same type to be commanded through a single icon. For example, you could configure all doors in a building so they can all be opened in an emergency through a single operator action. Refer to “Configuring Command Groups” on page 64 for more information. Show Symbols Displays the Symbols window. The Symbols window displays the base icons for each symbol created using the Graphics Symbol Editor. Tabs are used to group the symbols with their associated devices such as Digital Input, Controller, Reader, Area, or Intrusion Zone. Use the tooltips to identify the symbol name. Status Bar Displays the layer number or name currently active (or visible). To change layers, click Layer Settings on the Layer menu. Refer to “Working with layers” on page 69. Table 18: Graphics Map Editor File menu Command Description New Opens a blank workspace in which you can create a new graphics map. Open... Opens an existing graphics map file on the hard drive. A check is made for the latest version that has been uploaded and if the map on your hard drive is not the latest version, the following message displays: Click Yes to download and edit the latest file. Click No to continue editing the older file. Click Cancel to cancel the operation. Save Saves the file to the hard drive. Graphics maps are stored on the local system until they are uploaded to the database for centralized storage and backup. Save As... Saves the file to the hard drive under a new name. Import Image Displays the Open window, which allows you to select a .gif, .jpg, or .png file to use as the background layer or as an adornment on the map. Import AutoCAD drawing... Displays the Import AutoCAD Drawing window, which allows you to select a .dxf file to really use as the background layer. 38 Graphics Monitoring and Control User Manual Chapter 5: Creating graphics maps Command Description Upload... Uploads the file to the database. Graphics maps are stored on the local system, until they are uploaded to the database for centralized storage and backup. Download... Downloads a graphics map from the database. Graphics maps should be downloaded from the database before they are edited to ensure you have the latest file. Delete From Database... Displays the list of graphics maps and images found in the database. Select from the list and click Remove to delete the graphics map or image from the database. Print Displays the Print view window. You can adjust the paper size, format the way the map appears on the page, select the number of copies, and preview the page before printing. For more information, see “Printing graphics maps” on page 90. Exit Click to exit the Graphics Map Editor window. Table 19: Graphics Map Editor Edit menu Command Description Copy Copies a selected object to the clipboard. Cut Removes a selected object from your map and place it on the clipboard. Paste Pastes an object that has been placed on the clipboard to your map. Delete Deletes any selected objects or text on your graphics map. Note: The keyboard Delete key may also be used, however if the symbol palette is open, this key does not function. Select All Selects all objects and text on your graphics map. Create Hyperlink Inserts an icon to link two graphics maps together. You can then rightclick the icon to display the Configure Hyperlink option which allows you to associate the link and apply various settings. Create Hyperlink Area Displays a crossbar with which you can draw a border around an irregular shape, creating a custom hyperlink path on a graphics map. Create Control Points Click to insert an icon to represent a related set of devices of different types to be monitored and controlled by a single icon. For example, you could configure all devices in a particular area of a building, such as Lobby, as a single control point. The control point always displays the alarm and state information for the device with the highest alarm priority. After the control point has been configured, right-click to display the Context menu. Click Show Details to display an exploded view of the control point. See “Configuring Control points” on page 65 for more information on this feature. Graphics Monitoring and Control User Manual 39 Chapter 5: Creating graphics maps Command Description Create Command Group Click to insert an icon to represent a group of devices of the same type that can be configured as a single object for the purpose of commanding those devices. For example, you can configure all doors in a building to be easily opened in an emergency. There are three grouping options available. See “Configuring Command Groups” on page 64 for more information on this feature. Show Symbols... Opens the Symbols window. This window displays the base icons for each symbol created using the Graphics Symbol Editor. Table 20: Graphics Map Editor Placement menu Command Description Magnetic Grid... Displays a grid which is used to assist in aligning and arranging objects symmetrically. When the grid is activated, objects are "snapped" into place when dragged and released. As you draw, rotate, resize, or drag objects, they snap to the grid whether it is displayed or not. Lock/Unlock This toggle function allows you to lock or unlock one or more selected objects in place so they cannot be inadvertently dragged around the drawing space. Hide/Show This toggle function allows you to hide or show one or more selected objects. You may want to alter your graphic map so that some elements are not visible in a particular version based on who is using it. The graphic map can always be modified later to restore the view of the hidden object. To locate hidden objects in a drawing, click Edit, Select All, then Placement, Show. You cannot restore a hidden object to view unless it is selected. Raise When overlapping objects comprise a drawing, select an object and click Raise to move the selected object to the top of the overlapping objects. Step Up When overlapping objects comprise a drawing, select an object and click Step Up to move the selected object up one level in the group of the overlapping objects. Step Down When overlapping objects comprise a drawing, select an object and click Step Down to move the selected object down one level in the group of the overlapping objects. Lower When overlapping objects comprise a drawing, select an object and click Lower to move the selected object to the bottom of the overlapping objects. 40 Graphics Monitoring and Control User Manual Chapter 5: Creating graphics maps Table 21: Graphics Map Editor Transform menu Command Description Horizontal Flip/Vertical Flip The Horizontal and Vertical Flip options reverse an image or selection's orientation along the vertical and horizontal axes: Horizontal Flip reverses the image or selection horizontally, so that what was the left side becomes the right side, and vice-versa. Vertical Flip reverses the image or selection vertically, so that what was the top becomes the bottom, and vice-versa. Group/Ungroup You can combine several objects into a group so that the objects are treated as a single unit. You can then move or transform a number of objects without affecting their individual positions or attributes. Select the objects to be grouped or ungrouped. Selecting part of an object and grouping it, groups the entire object. Table 22: Graphics Map Editor Utilities menu Command Description Minimize Styles Optimizes the use of patterns in a selected portion of a map by using style sharing. The styles or patterns, such as lines, arrows, and textures that are used in the selected objects are reduced to the minimum number of styles. Minimize All Styles Optimizes the use of patterns in a map by using style sharing. All styles or patterns, such as lines, arrows, and textures that are used in a map are reduced to the minimum number of styles. Minimize and Propagate Styles Optimizes the use of patterns in a selected portion of a map by using style sharing. The styles or patterns, such as lines, arrows, and textures that are used in the selected objects are reduced to the minimum number of styles. These styles are then shared with all the elements in the map that have equivalent styles. Antialiasing Makes the edges of lines appear smoother. Table 23: Graphics Map Editor Zoom menu Command Description Zoom In/Zoom Out Click Zoom In to magnify the display area, or select specific view size on the Zoom menu. Click Zoom Out to reduce the display area, or select a specific view size on the Zoom menu. The default view size is 100%. Graphics Monitoring and Control User Manual 41 Chapter 5: Creating graphics maps Table 24: Graphics Map Editor Layer menu Command Description Create New Layer... When the Graphics Map Editor opens, the drawing area that displays represents layer zero, or the background layer. Use this layer to display the building structure or site map. Create additional layers to display different objects, such as controllers, or inputs. Some site maps may not require multiple layers. When you click Create new layer, a window displays the layer number, such as Layer 1 in the New Layer Name field. You can change the layer name to something more meaningful, such as Controllers. Layer Settings... Select one or all of the layers to display. When you are working with multiple layers, you need to make a layer active before you can make changes to the layer. The layer setting feature also allows you to rearrange the layers by moving them up or down Rename Layer... Change the name of a layer. Before you rename a layer, you must first select it. Remove Layer... Remove extra layers. The last layer cannot be removed. When you choose this command, the Select Layer window displays. Use the list to select the layer you want to remove from the drawing. Move Selected Objects... Rearrange objects by moving them to another layer. When you choose this command, the Select Layer window displays. Use the list to select the correct destination layer. This is the location where the objects will be moved. Table 25: Graphics Map Editor Window menu Command Description Always On Top Use if you want a window to always display in front of all other windows on the desktop. Save Position Use if you want the window to open in a specific position on the desktop. Table 26: Graphics Map Editor Help menu Command Description Online Help Launches the online help page specific to Graphics Map Editor. Click Show to display the Contents pane which allows you to navigate the entire Graphics Monitoring and Control online help system. User Manual Opens the Graphics Monitoring and Control User Manual in electronic format. Note: Adobe Acrobat version 5.x or higher must be installed to view the manual online. About... 42 Click to display a dialog box that contains the current version of your software and contact information. Graphics Monitoring and Control User Manual Chapter 5: Creating graphics maps Using the Graphics Map Editor Using the Drawing tools The Graphics Map Editor provides drawing tools to create site maps or other graphics maps. To use the drawing tools: 1. Click the appropriate tool button. You must select a tool each time before moving to the drawing area. 2. Position the mouse where you want to begin drawing. Follow the instructions listed in Table 27 below to use the tools. Table 27: Drawing tools description Tool Description Rectangle Use to draw a rectangle or a square. Circle Line • To create a rectangle, use the mouse to click and drag to reach the correct size. • To create a square, click and hold the Shift key while dragging the mouse. Use to draw a circle or an ellipse. • To draw a circle, click and hold the Shift key while dragging the mouse. • To draw an ellipse, click and drag the mouse to reach the correct size. Use to draw a horizontal, vertical, or diagonal line. • Polyline New Path Click to begin the line and drag the mouse to the correct location to end the line. Use to create a free-form shape. • Click in the drawing area and begin to move mouse to create the shape. • When one side is complete, left-click to change direction. • When finished, right-click to complete the shape. Use to create a set of straight, cubic, or quadratic segments. The Path Tools window displays with four segment types: straight line, isometric, two-dimensional, and three-dimensional. • Left-click to create each point. Right-click to complete the shape. Graphics Monitoring and Control User Manual 43 Chapter 5: Creating graphics maps Text Entry Array Use to add text to the drawing. • Click in the drawing area and the Text Input window displays. Enter the text you want to add to the drawing and click OK. • Resize the text by stretching or shrinking the text in the drawing area. • The Font Size Toolbar can also be used to set the size of the text. To change the font size, highlight the text using the mouse and select a new font size. You can also change the font size before clicking the Text Entry tool button. Use to draw a grid with four columns and four rows. This can be a square or rectangle shape. • Click in the drawing area where you want the grid to display and move the mouse until the grid is the size you want. • Resize by stretching or shrinking the grid in the drawing area. Link Use to draw a connection between objects. Click on a sizing handle of one object and then click on a sizing handle of the object to which you wish to link. As you move one of the objects the link remains connected to the other object. Orthogonal Link Use to draw a connection with two or more calibration points between objects. Click on a sizing handle of one object, click the first calibration point, continue to click any remaining calibration points, and finally click on a sizing handle of the object to which you are connecting. As you move one of the objects the link remains connected to the other object. Changing Graphic attributes When you use any of the drawing tools or the Create Hyperlink Area toolbar button to create a drawing, you can change the appearance of the drawing using the Graphics attributes window, shown in Figure 11 below. Figure 11: Graphic attributes window 44 Graphics Monitoring and Control User Manual Chapter 5: Creating graphics maps To use the Graphic Attributes window: 1. Double-click the drawing to display the Graphic Attributes window. If you want to select more than one drawing, click and drag in the drawing area to include other drawings. 2. Select the attributes that you want to apply, such as color, pattern, line, and brightness. Refer to Table 28 below for instructions. 3. Click Apply All to apply the selected attributes. 4. Click Close when you have finished. Table 28: Graphic attributes elements and description Element Description Line Color Click Line Color to display the Edit Line Color palette. Select a line color and click OK. Fill Color Click Fill Color to display the Fill Line Color palette. Select a fill color and click OK. Pattern Transparency Click to display the fill color in the drawn image or a shape drawn with the Create Hyperlink Area tool. Click to remove the fill color. When you remove the fill color, only the pattern displays with a white background. Fill Styles Click to apply a pattern to the image. Use Fill Color to select a color for the pattern. Use Bitmap Fill to create a background of images. Line Thickness Select the line thickness, from 0 to 6. Line Styles Select the line style such as, solid, dotted, or dashed. Arrow Style Select the type of arrow pattern to apply to the line. Transparency Factor Use the slider to indicate the brightness of the line and fill color. 100 is the brightest. Creating a graphics map A graphics map is composed of a basic site map and symbols representing devices and their associated properties and conditions. To create a graphics map: 1. In the Application Group, under Graphics, click Graphics Map Editor. 2. Using the Graphics Map Editor drawing tools, create the background layer of the graphics map. Graphics Monitoring and Control User Manual 45 Chapter 5: Creating graphics maps If you have an existing map in a .gif, .jpg or .png format, use the Import Image toolbar button to import the map file. See the “Import Image” button in Table 17 on page 36 for more information on how to do this. If you have an existing map in a .dxf format, refer to “Importing AutoCAD .dxf drawings” on page 51 for more information. 3. Click the Show Symbols toolbar button to display the Symbols window as shown in Figure 12 below. Note: Symbol schemes must be created before this step to identify the icons used with the display. If the symbols are not displayed, use the Graphics Symbol Editor to upload them to the database. 4. Select the appropriate tab to display the symbols. Select the appropriate symbol; using tooltips to display the symbol name. 5. Drag the symbol to the appropriate location on the map, or double-click to drop the symbol in the upper left hand corner of the map. Then drag it to the appropriate location. Note: To adjust the location a pixel at a time, use the arrow keys on your keyboard. You may select multiple symbols by left-clicking and dragging the mouse over the selection area. These symbols may then be moved as a group. 6. Continue to “Configuring Symbols” on page 47. Figure 12: Symbols window 46 Graphics Monitoring and Control User Manual Chapter 5: Creating graphics maps Configuring Symbols Use this option to associate a symbol icon to a specific device record in the host database. Note: In order for the state of a Request-to-Exit (REX), configured for 4-state supervision, to display on a graphics map, it needs to be configured as a reader, not as an individual digital input (DI). To associate a symbol icon to a specific device: 1. Right-click the symbol to display the menu as shown below. 2. Click Configure Symbol to open the Configure Symbol window. 3. Use the list to select the device that you want to associate with this symbol. If desired, enter search criteria in the Filter: field and click Find to filter the list. 4. The FCWnx alarm monitor supports a feature, Quick Launch that allows you to launch associated video and graphics maps for an alarm. Select Default Graphics Monitoring and Control User Manual 47 Chapter 5: Creating graphics maps For Quick Launch if this map is to be launched when the alarm monitor receives an alarm message for this device. Refer to “Opening a graphics map from the Alarm Monitor” on page 82 or to your FCWnx User Manual or online help for more information on this feature. Note: By default, the first time an area or intrusion zone is placed on a graphics map, this option is checked and that map displays when the host system alarm monitor receives an alarm message for the area/zone. If this same area/zone is placed on another map the option to . If you select the new map as the default is available select this option, this new map displays when the host system alarm monitor receives an alarm message for this area/zone. 5. Click Save. 6. Click the Upload button if you want to save the symbol scheme to the database and make it available to other users. 7. Continue to “Custom Device Configuration and Configuration Properties” below. Custom Device Configuration and Configuration Properties The graphics software provides support for setting custom properties on device symbols if the device definition metadata defines custom properties for a device type. The Camera device type has the Preset custom configuration property. Note: If you change a preset number for a previously defined and assigned camera preset, it will be necessary to update the preset association in the symbol to reflect the new preset number. If a device type has custom configuration properties, after a physical device has been assigned to the symbol, right-click on the context menu of the symbol to display the custom configuration properties that can be set. Click on the menu entry for a custom configuration property to bring up a configuration screen to set that property. The screen for selecting a camera preset is shown below. Note: In the Graphics Editor and Graphics Viewer, if a device type has custom configuration properties, the tooltip shown when the mouse hovers over the symbol will show the current values of the custom configuration properties for that symbol if a physical device was assigned to the symbol. 48 Graphics Monitoring and Control User Manual Chapter 5: Creating graphics maps Figure 13: Manage Preset dialog Adding text labels to the graphics map This feature allows you to add a text label to identify a building name, identify a link to another graphics map, or identify a particular symbol icon on the graphics map. You enter the text through a Text Input box, as shown in Figure 14 below. Figure 14: Graphics Map Editor with Text Input dialog Graphics Monitoring and Control User Manual 49 Chapter 5: Creating graphics maps To add a text label follow these steps: 1. Click the Text Tool toolbar button on the Graphics Map Editor toolbar. The mouse pointer changes to a crosshair shape. 2. Click in the drawing area where you want to place the text label. The Text Input window as shown in Figure 14 on page 49 displays. 3. Enter the text to use as the label or description of the symbol, and then click OK. The text displays on the drawing area with an active border surrounding the text. 4. Select the text and move it to the correct position. 5. Use the Font toolbar to change the text attributes. Use the Font list to select the font. Use the Size list to select the font size. Click the Bold toolbar button to change the font to bold. Click the Italic toolbar button to change the font to italics. 6. Continue to the next section to save the graphics map. Saving the graphics map To save the file: 1. On the File menu, click Save. — or — If you are saving the map for the first time, the Save As window displays. 1. Enter the file name, and then click Save. 50 Graphics Monitoring and Control User Manual Chapter 5: Creating graphics maps Importing images Importing .gif, .jpg, or .png images Graphics Monitoring and Control allows you to import .gif, .jpg, or .png files to use as background images for your maps. Caution: If you create animated .gif files for use on symbols or maps, there must not be any frame with a “zero” delay time, as this results in 100% CPU usage. Should this occur, you need to log off and close all browsers in order to recover. Note: Icon and image files are referenced by name, and therefore should be unique. It is not possible to have two files with the same name, and any attempt to do so will cause the new file to overwrite the original. To import an image: 1. On the Graphics Map Editor toolbar, click the Import Image toolbar button. The Open window displays. 2. Navigate to the folder and select the drawing name you want to import (the name displays in the File Name field), and then click Open. The image appears on the map. 3. Move and resize the image as desired. 4. Using the Layer menu, create a new layer to isolate the imported image as the background layer. See Table 24 on page 42 for more information. Importing AutoCAD .dxf drawings Graphics Monitoring and Control allows you to import site maps or drawings created with AutoCAD. Only two-dimensional drawings are supported; model Graphics Monitoring and Control User Manual 51 Chapter 5: Creating graphics maps information in drawings is not used. When you import an AutoCAD drawing, the drawing must be saved as a DXF format file of AutoCAD version R12, R13, R14, 2000 or 2000i. If you want to maintain the ability to update your site map from your AutoCAD drawing, simply import the file as shown below; no further steps are required. The drawing displays as a single object in the Graphics Map Editor and any subsequent edits to the drawing made in AutoCAD can be imported to your map again. However, if you want to convert the drawing so that it can be edited inside the Graphics Map Editor, use the Edit Objects feature after the drawing is imported. This method is not recommended unless you are certain that you will not require updates from the original AutoCAD drawing. Refer to “Converting AutoCAD drawings” on page 56 for more information. Tips on importing AutoCAD .dxf drawings 1. AutoCAD drawing import is performed by first exporting the AutoCAD drawing from within the AutoCAD product to a DXF file. The graphics software accepts DXF files formatted to AutoCAD version R12, R13, R14, 2000 or 2000i. 2. Architectural drawings are not well suited for use as background images on graphics maps. There may be extraneous details in the drawing that are not necessary for the background image, but can have a significant negative impact on the success of the import. You should create a copy of the original drawing and remove any unnecessary objects from the copy, as they can affect the performance of the application. Here are some things to look for: • There should not be any objects in the z-axis. Graphics maps are twodimensional, and attempts to represent data in the third dimension often produce distorted images. Remove all objects in the z-axis direction. • If the original drawing uses a z-axis or 3-D view perspective, change the view to 2-D before exporting the drawing to a .dxf file format. • Locate and remove all outlying objects that are not part of the main drawing. Some of these objects may be hidden in different layers and might be difficult to locate. These outliers force the drawing scale to be unnecessarily large, which has the effect of reducing the size of the drawing in the attempt to fit all of the data within the map viewing area. This is the most frequently occurring problem affecting import results. • Remove all occurrences of cross-hatching or object fills. Although AutoCAD represents these objects compactly within the original drawing file, when the drawing is exported in DXF format, the output produced by AutoCAD contains many individual lines that AutoCAD draws to achieve this effect on the screen. Unnecessary data significantly increases import time (from seconds 52 Graphics Monitoring and Control User Manual Chapter 5: Creating graphics maps to minutes) and imposes excessive memory requirements for loading the map in the application. 3. The graphics software imports the drawing data into its window at the fixed size specified in the DXF file. Therefore, it is extremely important to adjust the scaling of the AutoCAD drawing to a suitable size. It may be necessary to adjust the scaling in the original drawing, try the import, re-adjust the scaling and try the import again until a satisfactory result is achieved. Also note that before performing import operations, you should adjust the size of the Graphics Editor window to about the same size as you intend to use for the Graphics Viewer window. This will allow you to determine a good scaling for the drawing. 4. The proper use of AutoCAD drawings is based on a producing a series of drawings at increasing levels of detail. Because full site plans are so large in scale, a single drawing is not suited for monitoring purposes when showing device symbols within rooms. Our recommended approach for using AutoCAD drawings is as follows: • Use your site level drawing as the background for the top-level graphics map. Follow the guidelines in step 2 above to achieve a reasonable representation of your site. Place links on this graphics map (but not symbols), where these links are connected to your more detailed maps. Table 29: Troubleshooting AutoCAD import problems Problem description Associated tip Solution (see above) Import takes a very long 2 time. This is an indication that the DXF file is too large and contains unnecessary objects resulting from crosshatching and object fills. If your DXF file size is more than 5 MB (mega-bytes), it is too large and most likely contains these types of objects. They should be removed. The drawing appears 2 compressed and occupies only a small porting of the graphics editor map window after the import completes. This is an indication that there are outlying objects far removed from the relevant data area of the drawing. These outliers should be removed. Graphics Monitoring and Control User Manual 53 Chapter 5: Creating graphics maps The imported drawing is 3 and 4 too small for placing symbols, which obscure important details. Decrease the scaling of the drawing, re-export another DXF file and re-do the import. You may have to repeat this operation until a desirable result is obtained. If your site is complex or has many buildings or other locations to be monitored, you should create additional drawings from the original, where these new drawings cover only specific areas of the site but at a lower level of scaling. The proper approach to using AutoCAD drawings is to produce a series of drawings, each showing a greater level of detail and then to link them in a manner that allows you to drill down to the lower level of maps using the link objects provided by the graphics software. To import an AutoCAD drawing: 1. On the File menu, click Import AutoCAD Drawing or click the Import AutoCAD Drawing icon on the toolbar. The Import AutoCAD Drawings window displays. 2. Navigate to the directory where the .dxf file is stored, select the drawing you want to import, and then click Import. The Drawing Limits window shown below displays. 54 Graphics Monitoring and Control User Manual Chapter 5: Creating graphics maps a. Use the Extents/Limit tab to change the original coordinate system, which is taken from the imported .dxf file. b. Use the Ratio/Origin tab to indicate if the aspect ratio of the original drawing should be maintained. c. Use the View dimensions tab to convert the .dxf file coordinates to coordinates used by the Graphic Editor. d. Use the Other options tab to select the Invert black and white check box. Select this check box to change the color attributes. If the text map is not visible, such as a drawing with white ruling lines, select the check box to invert the black and white attributes of the drawing. 3. Click OK. The Select Layers to Import window shown below displays. The Select Layers to Import window lists each of the multiple layers in the drawings. To import all the layers, click Import. To import some of the layers, clear the check boxes of the layers you do not want to import. Only layers with check marks are imported. The display area reflects the changes in layers as you select or clear the check boxes. When the imported drawing is displayed, you can import the drawing again, selecting the same or different layers, if necessary. Any changes that have been made to those layers in the original AutoCAD drawing are now reflected on your Graphics Map. Right-click on a border or a path in the drawing. The shortcut menu shown below displays. (This menu is not accessible if you have previously selected the Edit Objects option.) Graphics Monitoring and Control User Manual 55 Chapter 5: Creating graphics maps 4. Click Import to complete the import operation or Cancel to cancel it. 5. Move and resize the imported drawing as desired. 6. Using the Layer menu, create a new layer to isolate the imported AutoCAD drawing as the background layer. See Table 24 on page 42 for more information. Converting AutoCAD drawings Use the Edit Objects feature to convert the AutoCAD drawing to a format which can be edited directly in the Graphics Map Editor. Caution: Once you have converted the AutoCAD drawing, using the Edit Objects feature, you can no longer update the map from AutoCAD. To edit the drawing using the Graphics Map Editor: 1. After you have imported the AutoCAD drawing, right-click on a border or path in the drawing. The shortcut menu shown below displays. (Once the AutoCAD drawing has been converted using the Edit Objects option, you have to import the original drawing again to access this menu.) 2. Click Edit Objects. When this option is selected, Graphics Monitoring and Control identifies each layer of the imported drawing and converts it to a format, which can then be edited using the Graphics Map Editor. The map is no longer associated with the original drawing and you cannot update the drawing by importing layers from AutoCAD. 3. On the Layer menu, click Layer Settings. The Layer Settings window shown in Figure 15 on page 57 displays. To display a layer, select the appropriate Visible check box and the Graphics Map Editor displays the selected layer. To modify a layer, select the appropriate Active check box and the Graphics Map Editor displays the active layer. The remaining layers are visible while you make changes to the selected layer. To view all the items on the active layer, on the Edit menu click Select All. All the items on this layer are highlighted. 56 Graphics Monitoring and Control User Manual Chapter 5: Creating graphics maps Figure 15: Layer Settings with imported and non-imported layers Linking graphics maps Two types of links can be used when linking graphics maps: Alarm hierarchy links and Jump to only links. Alarm hierarchy links An Alarm hierarchy link allows you to jump from a top level map to a lower level map in the hierarchy and it reflects alarm conditions on the lower level graphics maps. If an alarm condition at an object on a lower level map occurs, the alarm condition displays on each level of the map that is linked. By right-clicking on a link indicating an alarm is present on a lower level map, a list of the maps in alarm displays and you can select any of those maps to view. This type of link should be created from the top level downwards. For example, if a device on the computer room map is in alarm, both alarm hierarchy links blink. The right-click menu on both links show the computer room map. Graphics Monitoring and Control User Manual 57 Chapter 5: Creating graphics maps Figure 16: Alarm hierarchy linking Building A Alarm hierarchy link Floor 1 Alarm hierarchy link Computer Room Jump to only links A Jump to only link is used strictly to navigate between maps and does not reflect associated alarm conditions. This type of link can be created in any direction. For example, you can set up your display to jump to/from Building A map to each floor map and also between floor maps. Figure 17: Jump to only linking Building A Floor 1 Floor 2 Floor 3 Creating Alarm hierarchy links You can create Alarm hierarchy links using the Create Hyperlink toolbar button or the Create Hyperlink Area toolbar button. There is no difference in the behavior but the Create Hyperlink Area button differs in that it allows you to draw the link around an irregular shape rather than a point. 58 Graphics Monitoring and Control User Manual Chapter 5: Creating graphics maps Example 1: Linking multiple maps The following example uses the Create Hyperlink Area toolbar button in the Graphics Map Editor application to draw a hyperlink path around an object on a graphics map. When a condition changes, the designated hyperlink icon reflects the condition on each level or graphics map in the chain as shown below. If a condition at an object on a lower-level map changes, the condition displays on each level of the map, according to the alarm hierarchy links. Figure 18: Hierarchical map arrangement In this example, there are three graphics maps — United States, Florida, and Boca Raton. • The United States map has three states designated as hyperlink areas, including California, Florida, and New York. When a condition changes in Boca Raton, the outline around Florida is configured to blink. The operator clicks the icon to display the Florida map. • Florida is represented by a list of the facilities, including Boca Raton, Miami, and others. When a condition changes, the facility name is configured to blink. Operators select the name to view the graphics map. Graphics Monitoring and Control User Manual 59 Chapter 5: Creating graphics maps • The Boca Raton graphics map represents the actual facility with associated devices. The reader where the change of condition occurred is configured to change to a red reader icon. To create Alarm hierarchy links using the Create Hyperlink Area button: 1. In the Application Group, under Graphics, click Graphics Map Editor 2. On the File menu, click Open. 3. The Open window displays. 4. Select the top-level map you want to use. The file has a .jlx extension. 5. Click the Create Hyperlink Area toolbar button. Move the mouse cursor to the drawing area (the cursor changes to a crosshair shape). Click on the drawing area to create the first point on the graphics map. 6. Trace the object using horizontal, vertical, or diagonal lines created by clicking to create an anchor point and moving the cursor to the next anchor point. Use the Zoom menu to increase the size and make it easier to trace an irregular shaped border. When you have finished, right-click to end the path and apply the default graphic attributes. 7. Double-click in the area to display the Graphics Attributes window. Use the Graphics Attributes window to adjust border lines and change the default attributes, such as color, pattern, line, brightness. Refer to “Changing Graphic attributes” on page 44 for instructions. 8. Right-click to display the Configure Hyperlink button. Click again to display the Hyperlink Area Settings window as shown below. 60 Graphics Monitoring and Control User Manual Chapter 5: Creating graphics maps 9. Use the Link to Graphics Map list to select the graphics map you want to display when the hyperlink image is selected on the Graphics Console. 10. Select the Initially Transparent check box if you want the hyperlink border to be transparent when there is no alarm condition. Clear the check box to display the hyperlink border. 11. Select how you want the alarm indication to display. The options are: Blinking: Causes the hyperlink area to blink when an alarm occurs. The blink interval setting can be configured in Graphics Preferences. Custom Alarm Indication Color: Allows you to select a color. The hyperlink border around the image changes to this color when an alarm occurs. Click the Browse button to display the Choose Alarm Color window. Select a color and click OK. 12. Click Save. Example 2: Linking two maps To create Alarm hierarchy links using the Create Hyperlink toolbar button: 1. In the Application Group, under Graphics, click Graphics Map Editor. 2. Click File and then Open. 3. Select the map file you want to use. The file has a .jlx extension. 4. Click the Create Hyperlink toolbar button. The hyperlink icon displays in the upper-left hand corner of the drawing area. 5. Drag the icon to the appropriate location on the graphics map. Graphics Monitoring and Control User Manual 61 Chapter 5: Creating graphics maps 6. Right-click the Hyperlink toolbar button to display the Configure Hyperlink button as shown below. 7. Click Configure Hyperlink to display the Link Settings window below. 8. Use the Link to Graphics Map list to select the graphics map you want to display when the Hyperlink toolbar button is selected on the Graphics Console. 9. Click the Alarm hierarchy radio button to indicate that this symbol is to be used for linking alarms. 10. Select the appropriate option to indicate how the hyperlink image changes when an alarm condition occurs. The options are: Blinking: Causes the hyperlink image to blink when an alarm condition occurs. The blink interval setting can be configured in Graphics Preferences. Click Custom Alarm Indication Image: To select a different icon to display when an alarm condition occurs. Use the Browse button to navigate to the folder with the graphic image you want to display on the graphics map to represent the alarm condition. 11. Click Save. 62 Graphics Monitoring and Control User Manual Chapter 5: Creating graphics maps 12. In the Graphics Map Editor window, use the text tool to add a label to identify the link. 13. Save your work and upload the new graphics map to the database. Creating Jump to only links You can create Jump to only links using the Create Hyperlink toolbar button. To create Jump to only links: 1. In the Application Group, under Graphics, click Graphics Map Editor 2. Click File and then Open. 3. Select the map file you want to use. The file has a .jlx extension. 4. Click the Create Hyperlink toolbar button. The hyperlink icon displays in the upper-left hand corner of the drawing area. 5. Drag the icon to the appropriate location on the graphics map. 6. Right-click the Hyperlink toolbar button to display the Configure Hyperlink button as shown below. 7. Click Configure Hyperlink to display the Link Settings window shown below. 8. Use the Link To Graphics Map list to select the graphics map you want to display when the Hyperlink toolbar button is selected on the Graphics Console. Graphics Monitoring and Control User Manual 63 Chapter 5: Creating graphics maps 9. If you want to use a custom image for your links instead of the default hyperlink icon, use the Browse button to navigate to the folder with the graphic image you want to display on the graphics map to represent the link. There are icons provided in the Custom icons directory that can be used as default Jump to icons. 10. Click the Jump to only radio button to indicate that this symbol is to be used for navigation only. The Alarm Indication fields are disabled. 11. In the Graphics Map Editor window, use the text tool to add a label to identify the link. 12. Click Save to save your work and upload the new graphics map to the database. Configuring Command Groups A command group is a group of devices of the same type that can be configured as a single object for the purpose of commanding those devices. For example, you can configure all doors in a building to be easily opened in an emergency. There are three grouping options available: • All devices of a type in one or more specified facilities, for example all readers in Facility X. Even if readers are added later, you do not need to reconfigure the command group. • All devices of a type on a map, for example all readers on the graphics map representing a specific building. • Custom selection of devices of a type, for example the reader for the Main Lobby door on each floor of a building. To configure a command group: 1. In the Application Group, under Graphics, click Graphics Map Editor 2. Click the Command Groups toolbar button to place a command group icon in the upper left-hand corner of the map. 3. Move the icon to the desired location. 4. Right-click the icon and click Configure Command Group. The Command Group window displays, as shown below. 64 Graphics Monitoring and Control User Manual Chapter 5: Creating graphics maps 5. In the Description field, specify a text description for the command group. This description is displayed as a tooltip for the command group icon. 6. If you want to change the default icon, click Custom Command Group Image... to specify an icon to represent the command group. Click Reset to restore the default icon. 7. In the Object Type list, select the object type. 8. In the Device Selection list, choose the method you wish to use to select the devices for the command group. • By Facilities • Custom Selection • All On This Map 9. Click Save. Configuring Control points A control point allows you to create a single object on a map containing multiple symbols so that they share the same physical location on the map, thus conserving space on a map. For example, all of the readers, turnstiles, and cameras in a particular area, such as a Lobby, can be represented by a single control point. A control point always displays the alarm and state information for the device with the highest alarm priority. See “Using the Property Condition Priorities tab” on page 12 for details on how to manage alarm priorities. Graphics Monitoring and Control User Manual 65 Chapter 5: Creating graphics maps Figure 19: Configure Control Point window To configure a control point: 1. In the Application Group, under Graphics, click Graphics Map Editor 2. Click the Control Points toolbar button, or on the Edit menu select Create Control Points, to place a control point icon in the upper left-hand corner of the map. 3. Then move the icon to the desired location. 4. Right-click the icon and click Configure Control Point. The Configure Control Point window displays. 5. In the Description field, specify a text description for the control point. This description is displayed as a tooltip for the control point icon. 6. If you want to change the default icon, click Custom Control Point Image... to specify an icon to represent the control point. Click Reset to restore the default icon. 7. On the Add Devices By Symbol tabs, choose the devices to include in the control point. For example, to add controllers, click the Controller tab. 8. Double-click the icon or drag and drop it to the Current Devices pane. The Configure Symbols window displays from which you can select one or more devices. 66 Graphics Monitoring and Control User Manual Chapter 5: Creating graphics maps 9. Select one or more devices by highlighting them. Use the keyboard shift key to select a range of items in the list. Use the keyboard control key to add a specific item to the already selected items. The FCWnx alarm monitor supports a feature, Quick Launch that allows you to launch associated video and graphics maps for an alarm. Select Default For Quick Launch if this map is to be launched when the alarm monitor receives an alarm message for this device. Refer to “Opening a graphics map from the Alarm Monitor” on page 82 or to your FCWnx User Manual or online help for more information on this feature. Note: By default, the first time a device is placed on a graphics map, this option is checked and that map displays when the host system alarm monitor receives an alarm message for this device. If this same device is placed on another map the option to select the new map as the default is available. If you select this option, this new map displays when the host system alarm monitor receives an alarm message for this device. 10. Click Save to add the device to the Device list in the Current Devices pane. By default, the maximum number of devices in a control point is set to 16, however you can increase the maximum up to 32 in the Graphics Preferences screen. 11. To change the Quick Launch setting for any of the devices in the Current Devices pane, right-click on the device to display the context menu, and then click on the Configure Symbol menu entry to display the Configure Symbol window, as in Figure 32, and select or deselect Default For Quick Launch. Graphics Monitoring and Control User Manual 67 Chapter 5: Creating graphics maps 12. After you have added devices to the control point, for any device type that supports custom configuration, right-click on the device in the Current Devices list and in the context menu select the custom configuration property you wish to set. 13. Click Save. Configuring an Area or Intrusion Zones An area or an intrusion zone consists of the various readers, alarms, inputs, and outputs for an individual controller. They can be configured to display on a map where you can arm or disarm the area/zone. To configure an area/intrusion zone: 1. In the Application Group, under Graphics, click Graphics Map Editor. 2. Click the Show Symbols toolbar button to display the defined symbols. Click the Area (Icons or Drawn) or Intrusion Zone (Icons or Drawn) tab. Click the desired symbol and move your cursor to the map to draw the desired shape. Right-click to close the drawing area. The drawn area displays with the drawing attributes defined for the symbol. 3. Right-click the icon and click Configure Symbol. The Configure Symbol window displays. 4. Select the Area or Intrusion Zone that this symbol should represent. This description displays as a tooltip for the drawn area. 5. The FCWnx alarm monitor supports a feature, Quick Launch that allows you to launch associated video and graphics maps for an alarm. Select Default For Quick Launch if this map is to be launched when the alarm monitor receives an alarm message for this area or intrusion zone. Refer to “Opening a graphics map from the Alarm Monitor” on page 82 or to your FCWnx User Manual or online help for more information on this feature. Note: By default, the first time an area or intrusion zone is placed on a graphics map, this option is checked and that map displays when the host system alarm monitor receives an alarm message for the area/zone. If this same area/zone is placed on another map the option to select the new map as the default is available. If you select this option, this new map displays when the host system alarm monitor receives an alarm message for this area/zone. 6. Click Save. 7. Upload the saved map to the server. 68 Graphics Monitoring and Control User Manual Chapter 5: Creating graphics maps Working with layers Layers are defined as single, transparent drawing surfaces that lay on top of one another, much like pages in a notebook. Layers give you the ability to see each layer through the others above it, or see each layer individually. Layers allow you to move or edit objects on any layer without disturbing the objects on other layers. A graphics map can be created with multiple layers to group devices such as readers, controllers, or digital inputs. When viewed using the Graphics Console, an operator can choose to view all the layers, or select a specific layer, such as only readers. This improves visibility by hiding unnecessary details at a critical time. Refer to the following topics for more information: • “Selecting a layer” below • “Renaming a layer” on page 71 • “Removing a layer” on page 71 • “Moving objects between layers” on page 72 Creating a new layer When the Graphics Map Editor opens, the drawing area that displays represents layer zero, or the background layer. Use this layer to display the building structure or site map. Create additional layers to display different devices, such as readers, controllers, or digital inputs. Some graphics maps may not require multiple layers. To create a new layer: 1. On the Layer menu, click Create New Layer. The Create New Layer box opens with the layer number created when you selected this option. 2. Change the layer name to something more meaningful than the layer number, and then click OK. Refer to “Removing a layer” on page 71 for instructions on how to delete layers. Selecting a layer Use the layer setting feature to select one or all of the layers to display. When you are working with multiple layers, you need to make a layer active before you can make changes to the layer. The layer setting feature also allows you to rearrange the layers by moving them up or down. Graphics Monitoring and Control User Manual 69 Chapter 5: Creating graphics maps You select and manipulate layers using the Layer Settings window, shown in Figure 20 below. Figure 20: Layer Settings window To select a layer: 1. On the Layer menu, click Layer Settings. The Layer Settings window opens. 2. Choose one of the following options: • To display a layer to view, select the appropriate Visible check boxes and the Graphics Map Editor displays the selected layers. To view all the layers, select all the check boxes. • To modify a layer, select the appropriate Active check box. The Graphics Map Editor displays the active layer. The remaining layers are visible while you make changes to the selected layer. • To view all the items on the active layer, on the Edit menu click Select All. All the items on this layer are highlighted. • To rearrange the layers, click Move Down or Move Up. 3. Click Close when you have finished making changes. 70 Graphics Monitoring and Control User Manual Chapter 5: Creating graphics maps Renaming a layer To rename a layer: 1. On the Layer menu, click Rename Layer to open the Rename Layer window. The New Layer Name box displays the current layer name. 2. Type the new name in the New Layer Name field. Each layer name should be unique and no longer than 64 characters. If the name is longer, the extra characters are truncated. The layer name is case sensitive. Note: Imported layers cannot be renamed. 3. Click OK. Removing a layer If you create too many layers or if you do not need all the layers in the graphics map, you can remove the extra layers. The last layer cannot be removed. To remove a layer from your display: 1. On the Layer menu, click Remove Layer to open the Select Layer window as shown below. 2. Use the list to select the layer you want to remove from the drawing. 3. Click OK. Caution: When you remove a layer, all of the objects on that layer are also removed. Graphics Monitoring and Control User Manual 71 Chapter 5: Creating graphics maps Moving objects between layers When you are working with multiple layers, you may want to rearrange the objects by moving them to another layer. To move an object to a different layer: 1. First, select the object you want to move. 2. On the Layer menu, click Move Selected Objects. The Select Layer window opens. 3. Use the list to select the correct destination layer. This is the location where the object will be moved. 4. Click OK. Managing graphics map files Graphics maps are stored on the local system until they are uploaded to the database for centralized storage and backup. Once the files are uploaded, they are available to use with the Graphics Console to view graphics maps and associated icons when a condition changes. When working with symbols, use Download to make sure you are working with the most current symbol files. Refer to the following sections for more information: • “Uploading graphics maps” below • “Downloading graphics maps” on page 74 • “Deleting unused files” on page 74 Uploading graphics maps The Graphics Map Editor automatically loads the most current symbols from the database every time it opens. 72 Graphics Monitoring and Control User Manual Chapter 5: Creating graphics maps Figure 21: Upload window To upload a graphics map to the database: 1. On the File menu, click Open, or click the Open toolbar button, to display the graphics map you want to upload to the database. 2. On the File menu, click Upload. The Upload window as shown in Figure 21 above displays. 3. Select from the list of Available Facilities and click the right arrow to assign the graphics map record to that facility. Note: The number of facilities available for assignment is determined by your host system. 4. Click Upload. A message similar to the following displays. 5. Click OK. Graphics Monitoring and Control User Manual 73 Chapter 5: Creating graphics maps Downloading graphics maps Graphics maps should be downloaded from the database before being edited to ensure you have the latest file. To download a graphics map to your local system: 1. On the File menu, click Download, or click the Download toolbar button. The Download window shown below displays. 2. Select the graphics map in the list and click OK. The selected map displays in the Graphics Map Editor drawing window. 3. When you are finished making changes to the graphics map, upload the current file to the database so that it is available to other users. Deleting unused files The process of creating symbols and graphics maps is an art, and during that process you may create some files that are not used in your final product. The Graphics Map Editor provides the capability to remove unused files, which includes: • Displays with .jlx file extensions. • Images with .gif, .jpg, or .png file extensions. To remove the files that are no longer needed: 1. On the File menu, click Delete from database. The Deleting window displays. 74 Graphics Monitoring and Control User Manual Chapter 5: Creating graphics maps 2. Select the Resource Type (Graphics Maps or Images) in the list. The graphics maps and images stored in the database display. 3. Highlight the entries you want to delete, and then click Remove. Click Refresh to display any entries that may have changed in the database since this window displayed. 4. When you have finished removing the files, click X to close the window. Graphics Monitoring and Control User Manual 75 Chapter 6 Monitoring graphics maps Summary This chapter describes how to use the Graphics Console to respond to alarms and issue commands, such as locking and unlocking doors. You should be familiar with using layers in the Graphics Map Editor application. Content Introduction 77 Overview 78 About the Graphics Console 78 Using the Graphics Console 81 Opening a graphics map from the Graphics Console 81 Opening a graphics map from the Alarm Monitor 82 Selecting layers 84 Using the zoom feature 85 Issuing commands 85 Printing graphics maps 90 Introduction This feature allows an operator to view graphics maps, monitor and respond to alarms, and issue commands. Table 30 on page 78 lists the steps needed to perform these functions and references where you can find detailed instructions to complete these tasks. Graphics Monitoring and Control User Manual 77 Chapter 6: Monitoring graphics maps Table 30: Task overview Open a graphics map. Refer to “Opening a graphics map from the Graphics Console” on page 81 for more information. Select the layer to view. Refer to “Selecting layers” on page 84 for instructions on displaying different layers. Issue commands to devices. Refer to “Issuing commands” on page 85. Print graphics maps. Refer to “Printing graphics maps” on page 90 for more information. Overview The Graphics Console allows an operator to view graphics maps, monitor and respond to alarms, and issue commands. The graphics maps contain symbols, which represent devices such as digital inputs, readers, or controllers. When a condition changes, the symbol placed on the graphics map changes to reflect the new condition. For example, when a controller cabinet has been tampered with it can be in one of two conditions: set or reset. Each condition of each property is represented on the graphics map by a different symbol, for example: • Base condition is represented by a gray controller icon • Set condition is represented by a red controller icon • Reset condition is represented by a green controller icon If you have multiple maps linked together, the link icons on each map reflect the alarm states of the devices on the maps to which they are linked. About the Graphics Console You monitor and control your site using the Graphics Console window, as shown in Figure 22 on page 79. To open the window: In the Monitors & Controls Application Group, click Graphics Console. 78 Graphics Monitoring and Control User Manual Chapter 6: Monitoring graphics maps Figure 22: Graphics Console window Table 31: Graphics Console window Element Description Title bar Displays the window title, Graphics Console, as well as the window number. Menu bar The Graphics Console menu bar provides access to the following menus: File, View, Window, and Help For more information, see Table 32 on page 80 through Table 35 on page 81. Graphics Monitoring and Control User Manual 79 Chapter 6: Monitoring graphics maps Element Description Navigation pane Graphics maps are organized according to their facility. The items that display in the navigation pane are determined by an operator’s permission levels and context. Initially the facilities are collapsed. To expand a facility, click on the plus sign (+) beside the facility. To collapse it again, click on the minus sign (-). To the left of each map name is an icon that shows the status of the map. If any graphics map is in alarm, the icons next to that map and next to the facility appear in red. Even if the facility containing that map is collapsed, the icon is red which indicates that a map in that facility is in alarm. Click on a map to open it. You can also open a map from the menu bar, by clicking File, Open. The corresponding facility in the navigation pane expands accordingly. Splitter bar and pointers The Graphics Console is divided by a split bar with split pointers, which can be used to change the size of the window. Panes can be resized by moving the location of the splitter bar displayed between the panes or using the split pointers. Click the split pointer to move the window left or right of its current position. Status A communication status indicator located in the lower right hand corner of the Graphics Console window. Green indicates successful communication between FCWnx and Graphics Monitoring and Control. Red indicates a communications failure. Table 32: Graphics Console File menu Command Description Open Click to open an existing graphics map file. Reload Click to download all of the latest information from the database. Reload refreshes all of the existing maps, adds any new maps that may have been created, and removes any maps that may have been deleted. Print... Click to display the Print view window. You can adjust the paper size, format the way the map appears on the page, select the number of copies, and preview the page before printing. For more information, see “Printing graphics maps” on page 90. Exit 80 Click to exit the Graphics Console. Graphics Monitoring and Control User Manual Chapter 6: Monitoring graphics maps Table 33: Graphics Console View menu Command Description View Click to display the Layers dialog which allows you to hide or show one or more selected layers. For example, you may want to monitor a specific object type, such as readers and you don’t need to see all the other object types on the map. Table 34: Graphics Console Window menu Command Description Always On Top Use if you want a window to always display in front of all other windows on the desktop. Save Position Use if you want the window to open in a specific position on the desktop. Table 35: Graphics Console Help menu Command Description Online Help Click to launch the online help page specific to Graphics Console. Click Show to display the Contents pane which allows you to navigate the entire Graphics Monitoring and Control online help system. User Manual Click to open the Graphics Monitoring and Control User Manual in electronic format. Note: Adobe Acrobat version 5.x or higher must be installed to view the manual online. About... Click to display a dialog box that contains the current version of your software and contact information. Using the Graphics Console You can open a graphics map from the Graphics Console or using the host system Alarm Monitor. Opening a graphics map from the Graphics Console You can open a graphics map from the Graphics Console or from the Alarm Monitor. To open a graphics map from the Graphics Console: 1. In the Monitors & Controls Application Group, click Graphics Console. Note: If an operator default map is assigned to your operator record, that map opens automatically. See “Using the Operator Settings tab” on page 13. Graphics Monitoring and Control User Manual 81 Chapter 6: Monitoring graphics maps 2. Select one of the following options for opening a map: Option 1: If you do not know in which facility the map is located, on the menu bar, click File and then Open. The Open window shown below displays. Use the list to select the graphics map you want to view, and then click OK. Option 2: If you know in which facility the map is located, you can open the map directly from the navigation pane by clicking on the facility to expand it and then clicking on the map description. The Graphics Console automatically downloads the latest copy of the graphics map that exists in the database. Opening a graphics map from the Alarm Monitor The FCWnx alarm monitor supports a feature, Quick Launch that allows you to launch associated video and graphics maps for an alarm. The graphics map is associated with the alarm when you configure a symbol or a control point. See “Configuring Symbols” on page 47, “Configuring Control points” on page 65, and “Configuring an Area or Intrusion Zones” on page 68. Figure 23: FCWnx Alarm Monitor 82 Graphics Monitoring and Control User Manual Chapter 6: Monitoring graphics maps To open a graphics map from the FCWnx Alarm Monitor: 1. In the Monitors & Controls application group, click Alarm Monitor, or click the Alarm Monitor toolbar button. 2. Right-click on a row to display the Actions menu, as shown below. 3. Click Graphics Console or Quick Launch. If the alarm has a graphics map associated with it, the map displays in a Graphics Viewer window. Graphics Monitoring and Control User Manual 83 Chapter 6: Monitoring graphics maps Selecting layers Graphics maps can be constructed of different layers with different items on each layer. Use this option to select the layers you want to view. One layer may contain only readers, while another layer may contain all the controllers. Hiding layers reduces the clutter when operators need to focus. Figure 24: Layers window To select a layer: 1. On the View menu, click Layers. The Layers window shown in Figure 24 above displays. 2. To display a layer to view, select the appropriate Visible check boxes and the Graphics Map Editor displays the selected layers. To view all the layers, select all the check boxes. 3. To modify a layer, select the appropriate Active check box. The Graphics Map Editor displays the active layer. The remaining layers are visible while you make changes to the selected layer. 4. To view all the items on the active layer, on the Edit menu click Select All. All the items on this layer are highlighted. 5. To rearrange the layers, click Move Down or Move Up. 6. Click Close when you are finished making changes. 84 Graphics Monitoring and Control User Manual Chapter 6: Monitoring graphics maps Using the zoom feature Right-click on a graphics map to display the following menu options: Zoom In, Zoom Out, and Fit To Window. Additionally, if you have a scroll mouse, you can zoom in by rotating the mouse wheel upwards, or zoom out by rotating the mouse wheel downwards. The zoom magnifications are: 1.0, 1.5, 2.0, 3.0, 4.0, 5.0, 6.0, 7.0, and 8.0 • Click Zoom In to magnify the map in the viewing area, making the data appear larger. The maximum zoom in factor is 8.0. • Click Zoom Out to pull the map in making the data appear smaller. The minimum zoom out factor is 1.0. • Click Fit To Window to have the entire map fit into the space allocated in the window. Issuing commands The Graphics Console allows operators to respond to alarms and issue commands. Different menus with different actions display depending on the type of device and its condition. An action may be dimmed if the operation is not allowed. An action may not be allowed if the operator does not have permission to perform the action or the action is not supported by the product. Some commands may require a confirmation by the operator before they can be issued to the hardware. If you chose an action to issue a command of this type, a confirmation dialog will be displayed for the confirmation. Figure 25: Confirmation dialog Select OK to allow the command action or Cancel to cancel the command action. In the case where a command action is specified for multiple devices, the same confirmation dialog is used to confirm the action. Either the command is Graphics Monitoring and Control User Manual 85 Chapter 6: Monitoring graphics maps confirmed and sent to all devices, or the command action is cancelled for all devices. Table 36: Summary of devices and actions Device Commands Area Arm Select to place all readers within the area online and allow access for normal access rights. If schedules are assigned, the reader follows the schedule. Disarm Select to place all readers within the area offline. Normal access rights do not gain access into the area. Force Arm Select to place all readers within the area online and allow access for normal access rights. This allows the area to be armed even if there are active alarms for the area. If schedules are assigned, the reader follows the schedule. Camera View Live Select to view live video from the selected camera. When launching live video from an object with multiple cameras (such as a command group or control point), a single video window is brought up to show all cameras in the view simultaneously. A maximum of 16 cameras is supported in a video window. Only the first 16 cameras in the object show their video if there are more than 16 cameras in the object. Notes: 1. If a camera preset was configured for the symbol, the View Live command will display live video for that camera and command the camera to move to the configured preset. This also applies to camera symbols within a control point. 2. If you configure the same camera multiple times with different presets in a control point and perform the View Live command, the live video stream for that camera will only appear once in the viewer and it will use the first preset for that camera defined in the control point. Digital Input DI Sub-Type 4 (DO Sub-Type) Enable-Indefinite Select to enable the selected DI so a state change is reported. Enable-Schedule Overrides Select to enable the state of the monitoring until a schedule overrides it. 86 Graphics Monitoring and Control User Manual Chapter 6: Monitoring graphics maps Device Commands Disable-Indefinite Select to deactivate the selected DI until you manually activate it. Disable-Schedule Overrides Select to deactivate the selected DI until a schedule overrides it. DI Sub-Types 1 (Alarm Sub-Type) and 7 (Reader DI Sub-Type) Monitor On-Indefinite Select to turn on monitoring for the selected DI so alarms can be reported. Monitor On-Schedule Overrides Select to turn on monitoring for the selected DI until a schedule overrides it. Monitor Off-Indefinite Select to turn off monitoring for the selected DI. Monitor Off-Schedule Overrides Select to turn off monitoring for the selected DI until a schedule overrides it. Note: The DI sub-type 1 and 7 commands apply to all alarms mapped to the DI (typically reader forced open and held open). Digital Output On-Duration Select to enable the selected DO so a state change is reported. On-Indefinite Select to enable the selected DO permanently On-Schedule Overrides Select to deactivate the selected DO until you manually activate it. Off Select to immediately discontinue monitoring the selected DO so its state change is not reported. Event Trigger Activate Select to force the event trigger to the active state. Deactivate Select to remove the forced override to the active state. Note: Although the forced override to the active state is removed, the event trigger will remain in the active state if there is an associated alarm that remains in the set state. The alarm must be reset in order for the event trigger to enter the inactive state. Intrusion Zone Arm Select to place all readers in the zone online (doors locked) and monitor alarm points. Note: In order to successfully arm an intrusion zone, all alarm points must be reset (not in an active state of alarm) and all doors must be closed. Disarm Graphics Monitoring and Control User Manual Select to turn monitoring off for all alarm points in the zone and place all readers in the zone offline for normal operation. 87 Chapter 6: Monitoring graphics maps Device Commands OH Receiver Controller Set OH Receiver Online Puts the OH Receiver device online Set OH Receiver Offline Puts the OH Receiver device offline Reader Unlock-Duration Unlocks the door the number of seconds specified. Unlock-Indefinite Unlocks the door permanently until changed by an operator. Unlock-Schedule Overrides Unlocks the door until changed by a scheduled event. Lock Locks the door until reset by an operator using the unlock command. Lock-No Access Locks the door and disables the reader from granting access to pass through the door until reset by an operator using the unlock command. Forced Monitor On - Indefinite Select to turn on monitoring of the forced open condition on the reader so that a forced open alarm can be reported. Forced Monitor Off - Indefinite Select to turn off monitoring of the forced open condition on the reader so that forced open alarms are no longer reported. All devices Held Monitor On - Indefinite Select to turn on monitoring of the held open condition on the reader so that a held open alarm can be reported. Held Monitor On - Schedule Overrides Select to turn on monitoring of the held open condition on the reader until changed by a schedule event. Held Monitor Off - Indefinite Select to turn off monitoring of the held open condition on the reader so that held open alarms are no longer reported. Held Monitor Off - Schedule Overrides Select to turn off monitoring of the held open condition on the reader until changed by a schedule event. Show alarm Opens the Alarm Monitor with a focus on the alarm. Note: The forced and held Monitor On/Off commands apply to the individual forced and held alarms assigned to the reader DI point. This is an alarm level control of monitoring that differs from the Digital Input level control commands. To display the available commands: 1. Select the appropriate graphics map. Refer to “Opening a graphics map from the Graphics Console” on page 81. 88 Graphics Monitoring and Control User Manual Chapter 6: Monitoring graphics maps 2. Locate the symbol representing the device, and then right-click the symbol to display the action menu, as shown in Figure 26. The window shows the device description and a list of actions available to the operator. Figure 26: Action menu Graphics Monitoring and Control User Manual 89 Chapter 6: Monitoring graphics maps Printing graphics maps Figure 27: Print view window To print a graphics map: 1. On the File menu, click Print. The Print view window shown in Figure 27 above displays. 2. On the Paper tab, use the Paper format list to select the correct paper size. The measurements and margins display for the selected paper format. The default setting is A4. a. Select the unit of measurement to display. Click the appropriate option button to select centimeters or inches. b. Select the paper orientation. Click the Portrait toolbar button or Landscape toolbar button to change the orientation. c. If you select a custom paper format, enter the paper width and height, and margins for the graphics map. Click Default to discard the changes and return to the default settings. 3. On the View selection tab, you can adjust the position of the graphics map on the page. Use the Start X and Start Y to change the position of the display. Click Apply when you are finished making adjustments. 90 Graphics Monitoring and Control User Manual Chapter 6: Monitoring graphics maps 4. On the Pages tab, you can adjust the position size, resolution, and indicate the number of pages to print the graphics map. 5. On the Preview tab, you can preview the page before printing. Make the necessary changes and click Print. Graphics Monitoring and Control User Manual 91 Chapter 6: Monitoring graphics maps 92 Graphics Monitoring and Control User Manual Glossary This section explains some terms as they apply to Graphics Monitoring and Control. Table 37: Graphics Monitoring and Control terms explained Term Definition Command Group A configured set of devices of the same type that are to be controlled as a unit. For example, all entry and exit doors in a building can be commanded to open in an emergency by a single operator action. Condition The possible values for a device property, such as Set or Reset • Set: Physical alarms that are in the active alarm state. • Reset: Physical alarms that are no longer in the active alarm state. • Occurred: Logical alarms that are not yet acknowledged. • Acknowledged: Logical alarms that have been acknowledged by an operator. Control Point A control point allows you to group multiple objects for centralized monitoring and control of a related set of devices through a single location on a map. Digital Input A physical sensing device used to monitor an electronic contact connected to a controller. Graphics Monitoring and Control User Manual 93 Glossary Error Messages All confirmation pop-up dialogs include an icon on the left hand side to indicate the severity of the message. These are as follows: • Indicates an error severity level message. This icon appears on all confirmation pop-up dialogs informing the user that an operation has failed. • Indicates a warning severity level message. This icon appears on all confirmation pop-up dialogs informing the user that an operation cannot be performed for the given reason or that the user must confirm to proceed with an operation that overwrites data. • Indicates an information severity level message. This icon appears on all confirmation pop-up dialogs providing a success message for the action performed by the operator. • Indicates a question severity level message. This icon appears on all confirmation pop-up dialogs that are asking the user for confirmation to proceed to perform an action specified by the operator. Graphics map A collection of images/drawings, symbols, text, links, and command groups that form a graphical representation of the physical or logical layout of a site. Icon A graphic that represents a condition value for a property of an object type. Image A graphic that represents a layout upon which symbols are placed. Layer Layers are used to separate the types of devices represented on a map. For example, you can have a background layer as well as a layer for controllers, another for readers, and another for digital inputs. Link A bridge or connection between two graphics maps. There are two types of links: • Jump to - provides a quick navigation between maps. Clicking on a jump link opens the new map in the same window. • Alarm hierarchy - Indicates the alarm status for all child (linked to) maps. Right-click to select which map (in alarm) to jump to. Object Type Devices specific to your system, such as controllers, readers, or digital inputs Property A characteristic of a device, such as a controller that has a communications failure. The properties that display are appropriate for the selected object type. Symbol scheme A collection of graphic icons representing each condition of each device property plus a base icon. The icon is placed on the map to graphically display information about a device of the type for which the symbol scheme was created. Symbol An instance or use of a symbol scheme on a graphics map. 94 Graphics Monitoring and Control User Manual Index A D Active, 19 Arrow Style, 45 AutoCAD, 34, 37 Converting AutoCAD drawings, 56 Decoration, 17 Decoration technique, 28 decorations, 28 Digital Input, 93 Download, 19 drawing tools, 43 Drawn Area, 17 dxf, 35 B Base Icon, 19 blink interval, 7 button Array, 44 Circle, 43 Create Hyperlink Area, 44 Create Hyperlink Area toolbar, 58 Import AutoCAD Drawing, 54 Import Image, 46 Import Image toolbar, 51 Line, 43 Link, 44 New Path, 43 Orthogonal Link, 44 Polyline, 43 Rectangle, 43 Text Entry, 44 Text Tool toolbar, 50 C Command group, 64 Command Group, 38 condition, 78 Condition, 19 Contacting technical support, 2 Control Points, 34, 37 Create Hyperlink, 37 Custom Alarm Indication Image, 62 customized icons, 25 E Edit Objects, 56 Error Messages, 94 Existing Symbols, 19 Extents/Limit tab, 55 F Fill Color, 45 Fill Styles, 45 Font toolbar, 37 G Graphic Attributes window, 45 Graphics Console, 6, 78 Graphics Console window, 79 Graphics map, 94 create a graphics map, 45 Graphics Map Editor, 6, 35 Graphics Preferences, 5, 8 Graphics Symbol Editor, 6 H Hyperlink Area, 37 I Icon, 19, 94 Graphics Monitoring and Control User Manual 95 Index Image, 94 Import Image, 37 Initially Transparent, 19 Invert black and white, 55 Issuing commands, 85 R L Layer, 94 Layer menu, 56 Line Color, 45 Line Styles, 45 Link, 94 Safety terms, 2 Show Symbols, 38 Symbol, 94 Symbol Name, 19 Symbol scheme, 94 symbol schemes, 26, 34 M T Menu bar, 37 text label, 49 To print a graphics map, 90 Transparency, 45 Transparent image overlay, 26 N Navigation pane, 80 Nontransparent image overlay, 26 Ratio/Origin tab, 55 Related documentation, 2 S U O Upload, 19 Uploading settings, 14 Object Type, 19, 94 Operator Settings tab, 13 Other options tab, 55 Overlay, 16 V P W Paper tab, 90 Pattern Transparency, 45 Print, 80, 90 Print view window, 90 Product overview, 5 Property, 19, 94 Property Condition Priorities tab, 12 window Drawing Limits, 54 Layer Settings, 56 Select Layers, 55 96 View dimensions tab, 55 Z zoom, 85 Graphics Monitoring and Control User Manual