1
PTReportCom
User Manual
Version 1.6
2009-08
Copyright© 2007-2009 LJZsoft Corporation
All rights reserved
Contents
CHAPTER 1 INTRODUCTION...........................................................................................................1
1.1 OVERVIEW ......................................................................................................................................1
1.2 FEATURES .......................................................................................................................................1
CHAPTER 2 INSTALLATION AND STARTUP ...............................................................................3
2.1 SOFTWARE REQUIREMENTS ............................................................................................................3
2.2 INSTALLING PTREPORTCOM ..........................................................................................................3
2.3 UNINSTALLING PTREPORTCOM .....................................................................................................3
2.4 PTREPORTCOM.DLL .......................................................................................................................4
2.5 PPTREPORT.EXE ............................................................................................................................5
2.6 RUN-TIME FILES .............................................................................................................................6
CHAPTER 3 QUICK START...............................................................................................................7
3.1 LEARNING HOW TO USE PTREPORTCOM.........................................................................................7
3.2 SAMPLE DATABASE ........................................................................................................................7
3.3 SAMPLES .........................................................................................................................................8
3.4 CREATING A REPORT PROGRAMMATICALLY...................................................................................9
3.5 CREATING A REPORT WITH PPTREPORT.EXE................................................................................10
CHAPTER 4 REPORT TEMPLATES ..............................................................................................12
4.1 ABOUT REPORTS ..........................................................................................................................12
4.2 ABOUT REPORT TEMPLATES.........................................................................................................12
4.3 POWERPOINT BASIC CONCEPTS ....................................................................................................12
4.3.1 Presentations........................................................................................................................12
4.3.2 Slides....................................................................................................................................13
4.3.3 Layout ..................................................................................................................................13
4.3.4 Headers and Footers............................................................................................................13
-I-
4.3.5 Formatting ...........................................................................................................................13
4.3.6 Shapes ..................................................................................................................................14
4.3.7 Pictures ................................................................................................................................14
4.3.8 Tables...................................................................................................................................15
4.3.9 Charts...................................................................................................................................15
4.3.10 Sound, Music, Video, and Voice.........................................................................................15
4.4 TABLE REPORTS ...........................................................................................................................16
4.4.1 About Table Reports.............................................................................................................16
4.4.2 Creating a Table for a Fixed Table Report..........................................................................17
4.4.3 Creating a Table for a Variable Table Report .....................................................................17
4.4.4 Formatting Cells ..................................................................................................................18
4.4.5 Irregular Tables ...................................................................................................................20
4.4.6 Referencing Cells .................................................................................................................21
4.4.7 Referencing Tables...............................................................................................................21
4.4.8 Formatting Cells for Pictures ..............................................................................................22
4.5 FORM REPORTS .............................................................................................................................23
4.5.1 About Form Reports.............................................................................................................23
4.5.2 Creating a Slide ...................................................................................................................23
4.5.3 Naming Objects....................................................................................................................24
4.5.4 Formatting text in an Object ................................................................................................26
4.5.5 Formatting Objects for Pictures ..........................................................................................27
4.6 CHARTS ........................................................................................................................................28
4.6.1 About Charts ........................................................................................................................28
4.6.2 Creating a Blank Chart using Microsoft Graph ..................................................................28
4.6.3 Creating a Blank Chart using Microsoft Excel ....................................................................29
4.6.4 Referencing Charts ..............................................................................................................30
CHAPTER 5 API REFERENCE ........................................................................................................ 32
5.1 OBJECTS .......................................................................................................................................32
- II -
5.1.1 PTReport Object ..................................................................................................................32
5.2 METHODS .....................................................................................................................................32
5.2.1 FixTableReport Method .......................................................................................................32
5.2.2 VarTableReport Method ......................................................................................................35
5.2.3 GroupTableReport Method ..................................................................................................39
5.2.4 FormReport Method.............................................................................................................44
5.2.5 MSGraphChart Method .......................................................................................................48
5.2.6 ExcelChart Method ..............................................................................................................51
5.2.7 PPTReport Method ..............................................................................................................54
5.2.8 GetSlideByIndex Method......................................................................................................55
5.2.9 GetTableInSlide Method ......................................................................................................56
5.2.10 GetChartInSlide Method ....................................................................................................56
5.3 EVENTS ........................................................................................................................................57
5.3.1 BeforeConnect Event............................................................................................................57
5.3.2 TemplateOpen Event ............................................................................................................58
5.3.3 ReportComplete Event .........................................................................................................59
5.3.4 FunctionBeforeExectue Event..............................................................................................60
5.3.5 FunctionAfterExectue Event.................................................................................................61
5.3.6 FunctionProgress Event.......................................................................................................62
5.4 ERROR MESSAGES ........................................................................................................................62
CHAPTER 6 PTR FILES ....................................................................................................................65
6.1 USING PTR FILES .........................................................................................................................65
6.1.1 About PTR files ....................................................................................................................65
6.1.2 Using a PTR file with PTReport Object ...............................................................................65
6.1.3 Using a PTR file in command line .......................................................................................66
6.1.4 Creating a PTR file ..............................................................................................................66
6.1.5 Using parameters.................................................................................................................67
6.1.6 Converting files ....................................................................................................................70
- III -
6.2 PTR FILE REFERENCE ..................................................................................................................73
6.2.1 PTR File Format ..................................................................................................................73
6.2.2 [Data Source] Section..........................................................................................................74
6.2.3 [FILE] Section .....................................................................................................................76
6.2.4 [PARAMETER] Section .......................................................................................................77
6.3 FUNCTION REFERENCE .................................................................................................................78
6.3.1 Fixed Table Report...............................................................................................................78
6.3.2 Variable Table Report..........................................................................................................81
6.3.3 Group Table Report .............................................................................................................84
6.3.4 Form Report.........................................................................................................................89
6.3.5 MSGraph Chart ...................................................................................................................92
6.3.6 ExcelChart ...........................................................................................................................94
6.3.7 ExecSQL...............................................................................................................................96
CHAPTER 7 ADVANCED REPORTS ..............................................................................................98
7.1 EXECUTING MULTIPLE SQL STATEMENTS ....................................................................................98
7.2 SORTING, GROUPING AND TOTALING ......................................................................................... 103
7.2.1 Sorting data........................................................................................................................ 103
7.2.2 Totaling .............................................................................................................................. 104
7.2.3 Grouping data and Subreports........................................................................................... 104
7.2.4 Subtotaling ......................................................................................................................... 105
7.3 PICTURES .................................................................................................................................... 106
7.3.1 Inserting pictures into a report template............................................................................ 106
7.3.2 Inserting pictures into a report .......................................................................................... 106
CHAPTER 8 HINTS AND TIPS....................................................................................................... 108
CHAPTER 9 FORMAT EXPRESSIONS ........................................................................................ 113
A.1 FORMATS FOR NUMERIC VALUES .............................................................................................. 113
A.2 FORMATS FOR STRING VALUES ................................................................................................. 117
- IV -
A.3 FORMATS FOR DATE/TIME VALUES ........................................................................................... 118
CHAPTER 10 LICENSE AND SUPPORT ...................................................................................... 122
10.1 LICENSE .................................................................................................................................... 122
10.2 TECHNICAL SUPPORT ................................................................................................................ 123
-V-
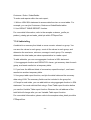
Chapter 1 Introduction
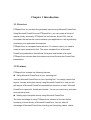
1.1 Overview
PTReportCom is a solution that generates reports using Microsoft PowerPoint.
Using Microsoft PowerPoint and PTReportCom, you can create all kinds of
reports quickly and easily. PTReportCom includes an ActiveX DLL and an
executable file that can be used to develop your applications. It will significantly
accelerate your application development.
PTReportCom is a template-based solution. To create a report, you need to
create a report template file first. The report template file is a Microsoft
PowerPoint presentation that defines the layouts and formats of a report.
PTReportCom retrieves data from data source and fills data into PowerPoint
presentation.
1.2 Features
PTReportCom includes the following features:
Using Microsoft PowerPoint as your reporting tool
Just use Microsoft PowerPoint as your reporting tool. You design reports like
layouts, formats and styles directly using Microsoft PowerPoint. And you will
get reports in Microsoft PowerPoint spreadsheet format as a result. Microsoft
PowerPoint is powerful, flexible and familiar. You do not need to buy and learn
extra reporting tools.
Making report template directly using Microsoft PowerPoint
The main advantage of using PTReportCom is based on the fact that all
formatting is done directly in Microsoft PowerPoint. You can take full
advantage of Microsoft PowerPoint including text formatting, tables, charts,
-1-
pictures and graphics, drawing, headers and footers, preview and printing,
VBA, macros, and more.
Accessing to databases using SQL
PTReportCom executes SQL statements to extract data from database.
Supports all type SQL: DML, DDL and DCL. Multiple SQL statements can be
executed in one report building process. You can perform queries on
databases, insert data into databases, and create database objects like tables.
The power of SQL can be harnessed for maximum efficiency in reporting.
Using ADO to access and manipulate data sources
Using ADO, PTReportCom can access and manipulate a wide variety of data
sources such as Oracle, DB2, Sybase, Informix, Microsoft SQL Server,
Teradata, MySQL, Microsoft Access, dBase.
Integrating Microsoft PowerPoint into your application
PTReportCom includes an ActiveX DLL for building application. Developers
can save time and meet their users’ needs by integrating the report processing
power of PTReportCom into their applications.
Command line program
PTReportCom includes a command line program PPTReport.exe. You can
use the program to create reports too. It does not require programming. It is
enough if you know how to use Microsoft PowerPoint and how to write SQL.
Various reporting capabilities
PTReportCom provides various reporting capabilities including sorting data,
grouping data, subreports, totaling and summarizing data, formatting, charting
and pictures. It is easy to create simple reports, and, you can create complex
reports.
-2-
Chapter 2 Installation and Startup
2.1 Software Requirements
Microsoft Windows 95, Windows 98, Windows NT, Windows 2000, Windows
XP, Windows 2003, Windows Vista or later.
Microsoft Office 97/98, Office 2000, Office XP, Office 2003 or later.
2.2 Installing PTReportCom
Run the installation program, and follow the instructions to complete
PTReportCom installation. For Windows Vista, the data folder should be
different from the application folder.
If you don’t have Microsoft Office installed, please install it first.
If your environment is Windows 95/98 and Office 97, and you don’t have VB6.0
run-time files installed, please install it. For Windows 2000, Windows XP,
Windows 2003 and Office 2000 or later, you do not need to install VB6.0
run-time files because they are included in OS and Office. To install VB6.0
run-time files, just run vbrun60sp5.exe, and follow the instructions.
If you don’t have ODBC Driver installed for the database you want to access,
please install it.
If your OS is Windows 95/98 and you don’t have Microsoft Data Access
Components 2.0 (MDAC_TYP) or later installed, please install it. For Windows
2000, Windows XP and Windows 2003, you do not need to install MDAC_TYP
because it is preinstalled in OS. To install MDAC_TYP, just run mdac_typ.exe,
and follow the instructions.
2.3 Uninstalling PTReportCom
1. Double-click the Add/Remove Programs icon in the Windows Control
-3-
Panel.
2. Do one of the following:
For Windows 2000, Windows XP and Windows 2003 Edition:
Click PTReportCom in the Currently installed programs box, and then click
the Change/Remove button.
For Windows 98 and Windows NT 4.0:
Click PTReportCom on the Install/Uninstall tab, and then click the
Add/Remove button.
3. Follow the instructions on the screen to complete uninstalling the program.
2.4 PTReportCom.dll
PTReportCom.dll is an ActiveX DLL that provides PTReport object. You can
write a program to work with the object. Before you can use the PTReport
object, you must create a reference to the object. And you should create
references to Microsoft PowerPoint and Microsoft Graph Object Library too.
To create a reference to the PTReport object
1. Do one of the following:
For Visual Basic 6.0
From the Project menu, choose References.
For Microsoft PowerPoint Visual Basic For Application
From the Tools menu, choose References.
2. In the References dialog box, select PTReportCom.
3. You can use the Browse button to search for PTReportCom.dll.
4. In the References dialog box, Select Microsoft PowerPoint and Microsoft
Graph Object Library to create their references.
5. Declare an object variable of the object's class.
Dim ptrpt As PTReport
6. Assign an object reference to the variable by using the New keyword in a
-4-
Set statement.
Set ptrpt = New PTReport
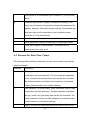
2.5 PPTReport.exe
PPTReport.exe is an executable program that developed using
PTReportCom.dll. It likes PTReportGen command line and can read a PTR file
to create a PowerPoint report. The syntax of command is:
pptreport <ptr file name> [-D] [-U1 user1] [-P1 pwd1] … [-U10 user10]
[-P10 pwd10] [pa1 pa2 … pa10]
ptr file name
Specifying a PTR (.ptr) file that tells PTReportCom how to get
data from data sources and how to put data into a report.
-D
Display the generated report with Microsoft PowerPoint.
-U1 user1 …
Specify the user names. user1 is the user name of the first
-U10 user10
data source. user2 is the user name of the second data
source……
-P1 pwd1 ...
Specify the passwords. pwd1 is the password of the first data
-P10 pwd10
source. pwd2 is the password of the second data source……
pa1 … pa10
The values of the parameters defined in the PTR file. You can
use parameters in SQL statements. PTReportCom will replace
the names of the parameters in a SQL statement with the
actual values before it executes the SQL statement. You can
use no more than 10 parameters in one report.
For example, you have defined two parameters in your PTR file. The first
parameter is the sales date, and the second is the category of the product. You
can run PPTReport.exe as follows:
pptreport c:\pptreport\myreport.ptr 1996-05-01 “Dairy Products”
-5-
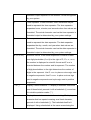
2.6 Run-Time Files
You can distribute royalty-free the run-time files of PTReportCom with your
applications. The run-time files are files your application must have in order to
work correctly after installation. The following are the run-time files you need to
distribute:
File
Description
ptreportcom.dll
The PTReportCom ActiveX DLL. It must be registered.
pconv.cfg
The file contains the information of the file format. If you
are using PPTReport method to convert files, you should
include it and copy it to the same directory as
ptreportcom.dll.
scrrun.dll
Microsoft script runtime. PTReportCom used some
functions in this file. It should be copied to Windows
System directory, and must be registered.
To register a DLL file, use regsvr32.exe. For example,
regsvr32.exe /s “C:\Program Files\LJZsoft\PTReportCom\PTReportCom.dll”
-6-
Chapter 3 Quick Start
3.1 Learning how to use PTReportCom
You can teach yourself how to use PTReportCom by choosing from the
methods available in this section:
You can study the samples included with PTReportCom.
You can use the detailed descriptions and instructions in this document.
3.2 Sample Database
PTReportCom comes with Sample.mdb, a sample database you can use when
learning the program. Sample.mdb is a Microsoft Access database. Virtually all
of the examples in this manual are based on Sample.mdb data.
The sample reports access the sample database through the ODBC data
source name “Report Sample”. When you install PTReportCom, you can
choose to add the ODBC data source name. And you also can add the ODBC
data source name manually.
To create the System DSN “Report Sample”, do as follows:
1. Click the Windows Start button, choose Settings, and then click Control
Panel.
2. On computers running Microsoft Windows 2000 or later, double-click
Administrative Tools, and then double-click Data Sources (ODBC). The
ODBC Data Source Administrator dialog box appears. On computers
running previous versions of Microsoft Windows, double-click 32-bit ODBC or
ODBC.
3. Select the System DSN tab, and then press Add button.
4. Choose Microsoft Access Driver (*.mdb), then press Finish button.
5. In the ODBC Microsoft Access Setup dialog box, type Report Sample in
-7-
the Data Source Name box.
6. Press the Select button, and browse to select Sample.mdb.
7. Press OK button to close the ODBC Microsoft Access Setup dialog box.
8. Press OK button to close the ODBC Data Source Administrator dialog
box.
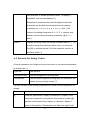
3.3 Samples
After PTReportCom is installed, some samples are installed too. Use these
samples to learn PTReportCom.
The samples include a sample database, VB sample programs, VBA sample
programs and sample reports. They are located in the Application Data\LJZsoft
under All Users or your profile folder. PTReportCom was tested with Microsoft
Office 2007. Please download the sample reports for Microsoft Office 2007
from our website.
Directory
Description
{data}\Common\SampleDatabase
Contains the sample database
“Sample.mdb”.
{data}\PTReportCom\Samples\PPTReport
Contains the report template files
(.ppt) and the PTR files (.ptr).
{data}\PTReportCom\Samples\VB
Contains the sample programs
for VB6.0.
{data}\PTReportCom\Samples\VBA
Contains the sample programs
for Microsoft PowerPoint VBA.
{data} is the path of the data folder. You can select the data folder when you
install PTReportCom. By default, the data folder is the Application
Data\LJZsoft folder under All Users. If you install PTReportCom without
administrative privileges, the data folder is the Application Data\LJZsoft folder
under the current user. The data folder is usually at:
Windows 95/98: C:\windows\All Users\Application Data\LJZsoft
-8-
Windows NT: C:\WinNT\Profiles\All Users\Application Data\LJZsoft
Windows 2000/XP: C:\Documents and Settings\All Users\Application
Data\LJZsoft
Windows Vista: C:\ProgramData\LJZsoft
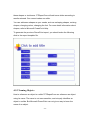
3.4 Creating a Report Programmatically
1. Create a template
In Microsoft PowerPoint, create a report template file named “custlist.ppt”.
Static values and any PowerPoint features included in the template will be
included in the generated report. The template file you have created as follows:
2. Write the code in your application.
Set con = New ADODB.Connection
Set rec = New ADODB.Recordset
con.ConnectionString = "Data Source=Report Sample"
con.Open
strSQL = "SELECT CompanyName, CityName, CountryName,
ContactName FROM Customers, Cities, Countries WHERE
Customers.CityCode = Cities.CityCode AND Customers.CountryCode =
Cities.CountryCode AND Customers.CountryCode = Countries.CountryCode
ORDER BY CompanyName, CityName, CountryName"
rec.Open strSQL, con
ptrpt.VarTableReport Recordset:=rec, Slide:=pptSlide, Table:=1,
-9-
CellList:="A2", Reserve:=2, PageBreak:="12"
rec.Close
3.5 Creating a Report with PPTReport.exe
1. Create a template
In Microsoft PowerPoint, create a report template file named “custlist.ppt”.
Static values and any PowerPoint features included in the template will be
included in the generated report. The template file you have created as follows:
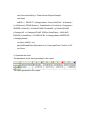
2. Create a PTR file
Create a PTR file named “custlist.ptr” using PTReportGen or a text editor. The
following is the content of the PTR file.
PPTReport Version 2.0
[Data Source]
Name1=Report Sample
[File]
ReportTemplateFileName=custlist.ppt
ReportFileName=Report\custlist.ppt
LogFileName=Log\custlist.log
[SQL]
- 10 -
@F1=Report(slide=1 cell=A2 pagebreak=12 reserve=2)
SELECT CompanyName
,CityName
,CountryName
,ContactName
FROM Customers, Cities, Countries
WHERE Customers.CityCode = Cities.CityCode
AND Customers.CountryCode = Cities.CountryCode
AND Customers.CountryCode = Countries.CountryCode
ORDER BY CompanyName,CityName,CountryName
3. Run PPTReport.exe
pptreport c:\report\custlist.ptr
- 11 -
Chapter 4 Report Templates
4.1 About Reports
The report generated by PTReportCom is a Microsoft PowerPoint presentation.
The layouts, formats and styles of the report are defined by a report template,
and the data of the report are got from databases such as Oracle, DB2.
4.2 About Report Templates
To make a report using PTReportCom, you should create a report template
first. The report template is a Microsoft PowerPoint presentation that defines
the layouts, formats and styles of the report. In the Microsoft PowerPoint report
template, you can input static content such as titles, descriptions, comments, a
cover, a company logo, format the static content, and define the format of the
data you will get from databases.
PTReportCom will generate the report based on the report template file. All
static contents and the layouts, formats and styles defined in the report
template file will be brought to the final report file.
4.3 PowerPoint Basic Concepts
If you have known these concepts of Microsoft PowerPoint, please skip this
section. For more detail information about Microsoft PowerPoint, refer to
Microsoft PowerPoint Help.
4.3.1 Presentations
A presentation is a Microsoft PowerPoint file with extension .ppt. You can open
- 12 -
and save it using Microsoft PowerPoint. The presentation is made up of a
series of slides.
4.3.2 Slides
A slide is a frame in a presentation. A presentation contains one or more slides.
Slide is the primary component that contains content.
4.3.3 Layout
Layout refers to the way things are arranged on a slide. A layout contains
placeholders, which in turn hold text such as titles and bulleted lists and slide
content such as tables, charts, pictures, shapes, and clip art. Each time you
add a new slide, you can choose a layout for it. You can also choose a blank
layout.
4.3.4 Headers and Footers
Headers and footers consist of the header and footer text, slide or page
number, and date you want at the top or bottom of your slides or notes and
handouts.
You can use headers and footers on single slides or all slides. For notes and
handouts, when you apply a header or footer, it applies to all notes and
handouts. Headers and footers that you create for handouts also apply to
printed outlines.
4.3.5 Formatting
You can use these formatting features of Microsoft PowerPoint to effectively
display your data.
Characters formatting
To make text stand out, you can format the text in selected characters. You
- 13 -
can change the font, color, size of text, bold and italic formats.
Paragraphs formatting
You can align, center or justify a paragraph, change indent and tab settings,
and change the line spacing of a paragraph.
Bulleted and numbered lists
Bulleted and numbered lists in Microsoft PowerPoint are easy to create. You
can quickly add bullets or numbers to existing lines of text, or Microsoft
PowerPoint can automatically create lists as you type.
Automatic formatting
Microsoft PowerPoint, by default, automatically formats certain types of text as
you type. Automatic paragraph formatting includes automatic bulleted and
numbered lists and resizing of text in text placeholders if the text doesn't fit at
its current font size.
4.3.6 Shapes
Shapes can be resized, rotated, flipped, colored, and combined to make more
complex shapes. Many have an adjustment handle that you can use to change
the most prominent feature of a shape — for example, you can change the size
of the point on an arrow. The AutoShapes include several categories of shapes:
lines, connectors, basic shapes, flowchart elements, stars and banners, and
callouts. You can add text to shapes (except lines, connectors, and freeforms).
The text you add becomes part of the shape.
Text boxes can be treated as shapes. They are formatted in many of the same
ways shapes are formatted, including adding colors, fills, and borders.
4.3.7 Pictures
There are two types of pictures: bitmaps or drawn pictures.
Bitmap pictures are made from a series of small dots, much like a piece of
- 14 -
graph paper with specific squares filled in to form an image. Bitmaps are
created with and edited in paint programs, such as Microsoft Paint. All scanned
graphics and photographs are bitmaps. Bitmap pictures are often saved with
a .bmp, .png, .jpg, or .gif extension.
Drawn pictures are created from lines, curves, rectangles, and other objects.
The individual lines can be edited, moved, and rearranged. When a drawn
picture is resized, the computer redraws the lines and shapes so that they
retain their original definition and perspective. AutoShapes are drawn pictures.
Drawn pictures are saved in the format of the application that created them.
For example, Microsoft Windows Metafiles are saved with a .wmf extension.
4.3.8 Tables
A table is made up of rows and columns of cells that you can fill with text and
graphics. Tables are often used to organize and present information. You can
create tables in PowerPoint, or you can add a table from another program.
When you use PowerPoint, you can create a simple table with little formatting,
or one with more complex formatting. You can include fills and border colors
from the presentation's color scheme.
4.3.9 Charts
Charts are visually appealing and make it easy for users to see comparisons,
patterns, and trends in data. You can create a chart in a slide using Microsoft
Graph or Microsoft Excel. When you create a new chart in PowerPoint,
Microsoft Graph or Microsoft Excel opens and a chart is displayed with its
associated data in a data sheet or worksheet.
4.3.10 Sound, Music, Video, and Voice
You can add music and sounds from files on your computer, a network, the
- 15 -
Internet, or Microsoft Clip Organizer. You can also record your own sounds to
add to a presentation, or use music from a CD.
You can add movies and animated GIFs to slides from files on your computer,
the Microsoft Clip Organizer, a network or intranet, or the Internet. "Movies"
are desktop video files with formats such as AVI, QuickTime, and MPEG, and
file extensions such as .avi, .mov, .qt, .mpg, and .mpeg. An animated GIF file
includes motion and has a .gif file extension. Though not technically movies,
animated GIFs contain multiple images which stream to create an animation
effect.
4.4 Table Reports
4.4.1 About Table Reports
A table is made up of rows and columns of cells that you can fill with text and
graphics. Tables are often used to make reports, and organize and present
information.
PTReportCom supports two types of table reports: fixed table report, variable
table report.
Fixed table report: The number of rows and columns in the table is fixed. When
PTReportCom executes a SQL statement, directly puts the result data into
cells in the table.
Variable table report: The number of rows or columns in the table is unfixed,
and it is variable as the number of result records. When PTReportCom
executes a SQL statement, it repeats the table rows or columns for each
record or group, and then puts data into cells of the table.
- 16 -
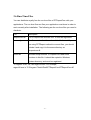
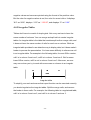
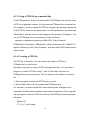
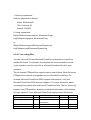
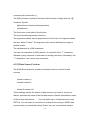
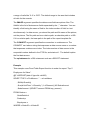
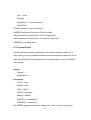
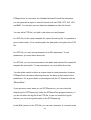
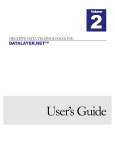
4.4.2 Creating a Table for a Fixed Table Report
For a fixed table report, you need to create a table in the report template file
according to the report. The format of the table is the same as the format in the
report, but cells that should be filled data into are blank. When PTReportCom
executes a SQL statement, the data values from data source will be filled into
these cells.
A
B
A
B
1
1
14
3.4
2
2
20
5.2
3
3
8
2.7
The fixed table defined
in the report template file
The fixed table filled data
by rows in the report file
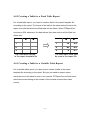
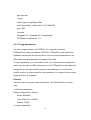
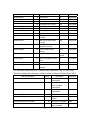
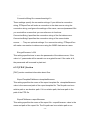
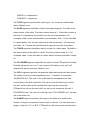
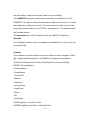
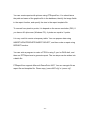
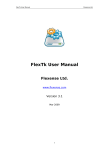
4.4.3 Creating a Table for a Variable Table Report
For a variable table report, you also need to create a table in the report
template file according to the report. But you just need to reserve some
rows/columns in the table for one or two records. PTReportCom will add some
rows/columns according to the number of the records returned from data
source.
- 17 -
Date
Item Id
Date
Sales
The variable-rows table defined
in the report template file
Item Id
Sales
1998-01-01
3
150
1998-01-02
3
200
1998-01-03
3
250
1998-01-05
3
350
1998-01-10
3
550
1998-01-21
3
150
1998-01-25
3
200
1998-01-31
3
100
The variable-rows table filled data
by rows in the report file
The format of the last row/column border can be different from the others. For
example, the outside borders used double lines, and the inside borders used
single lines. To do this, you should reserve the blank rows/columns for 2
records. When PTReportCom inserts some blank rows/columns, the new
rows/columns will inherit the format of the first row/column in the reserved
rows/columns.
One record from data source can be put into two or more rows/columns. To do
this, you need to reserve the blank rows/columns for all records that you want
to put them into one slide. For example, there are 91 records returned from a
database, and you want to put 5 records per slide and 3 rows per record. You
must prepare one slide that contain one table and reserve 15 blank rows in the
table. If 1 rows per record, you just need to reserve 1 or 2 blank rows in the
table. PTReportCom can insert rows, delete rows, copy slides with tables, but
can not copy rows in one slide.
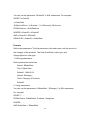
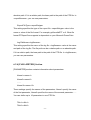
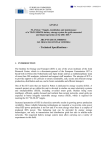
4.4.4 Formatting Cells
To format cells that contain static contents, use “Format” menu in Microsoft
- 18 -
PowerPoint. For more detail information, refer to Microsoft PowerPoint Help.
For cells in which data are got from database, you can set font, color,
alignment using Microsoft PowerPoint. But to display values in formatting
string, you should use other way.
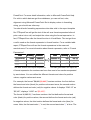
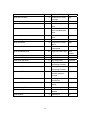
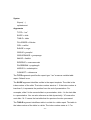
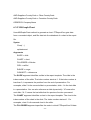
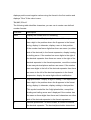
You should write formatting expressions into data cells in the report template
file. PTReportCom will get the text of the cell as a format expression before it
puts a value into a cell, and output the value using the format expression. In
fact, PTReportCom calls the format function in Visual Basic. The text got from
a cell is used as the format expression in format function. For a variable table
report, PTReportCom will use the format expressions in the reserved
rows/columns. For more information about format expression, refer to “Format
Expressions”.
Date
Quantity
Amount
Date
Quantity
Amount
yyyy-mm-dd
#,##0
#,##0.00
1999-02-18
560
827.79
yyyy-mm-dd
#,##0
#,##0.00
1999-06-14
890
1,113.05
yyyy-mm-dd
#,##0
#,##0.00
2000-01-21
1,240
1,552.25
The table defined in the report template file
The table generated in the report file
A format expression for numbers can have from one to four sections separated
by semicolons. You can define the different formats and colors for positive
values, negative values and zeros.
For example, the format "$#,##0;($#,##0)" has two sections: the first defines
the format and color (black) for positive values and zeros; the second section
defines the format and color (red) for negative values. It displays “2345.12” as
“$2,345”, displays “-5432” as “($5,432)”.
The format “#,##0.00;;” has three sections: the first defines the format and
color (black) for positive values, the second defines the format and color (red)
for negative values, the third section defines the format and color (blue) for
zeros. Note, the first semicolon “;” is red, the second semicolon “;” is blue. The
- 19 -
negative values and zeros are printed using the format of the positive value.
But the color for negative values is red, the color for zeros is blue. It displays
“8.9” as “8.90”, displays “-123” as “-123.00”, and displays “0” as “0.00”.
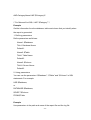
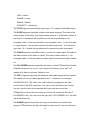
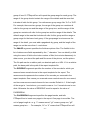
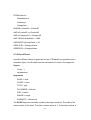
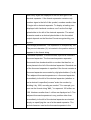
4.4.5 Irregular Tables
Tables don't have to consist of simple grids. Not every row has to have the
same number of columns. You can merge and split cells to create irregular
tables. An irregular table is the table that contains split cells or merge cells, and
it does not have the same number of cells for each row or column. While an
irregular table provides for an attractive way to display data, but it does make it
harder to process the presentation. You have some difficulty to reference a cell
in an irregular table. For example in the following table, for most Office version,
cell1 is in column 3 and row 2, cell2 is in column 3 and row 3. But for some
lower Office version, cell2 is not in column 3 and row 3. Moreover, an error
may occur when you try to work with some rows or columns in an irregular
table.
A
B
C
Cell1
Cell2
Irregular table
To simplify your work and ensure that report function can be executed correctly,
you should regularize the irregular tables. Split the merge cells, and remove
the border in these cells. For example, the following table is a regularized table,
cell1 is in column 3 and row 2, and cell2 is in column 3 and row 3.
- 20 -
A
B
C
Cell1
Cell2
Regularized table
4.4.6 Referencing Cells
You can reference table cells as A1, A2, B1, B2, and so on, with the letter
representing a column and the number representing a row. Cell references in
Microsoft PowerPoint are always absolute references and are not shown with
dollar signs. You can reference an entire row or column in a calculation in the
following ways:
Use a range that includes only the letter or number that represents it - for
example, 1:1 to reference the first row in the table. This designation allows
the calculation to automatically include all the cells in the row if you decide
to add other cells later.
Use a range that includes the specific cells - for example, a1:a3 to
reference a column with three rows. This designation allows the calculation
to include only those particular cells. If you add other cells later and you
want the calculation to include them, you need to edit the calculation.
4.4.7 Referencing Tables
If you want to reference a table, you should reference a slide first. You can
reference a slide by an index number. The index number represents the
position of the slide in a presentation. The index number starts at 1. If the index
number is less than 0, it represents the position from the end of presentation.
So slide 1 is the first slide in a presentation, slide 2 is the second slide in a
presentation, slide -1 is the last slide in a presentation. You can reference a
slide dynamically. “N” means the next slide.
- 21 -
You can reference a table in the slide by an index number. The index number
represents the position of the table in the slide. The index number starts at 1.
So table 1 is the first table in a slide, table 2 is the second table, and so on.
4.4.8 Formatting Cells for Pictures
To enhance the visual impact of your report, you can insert pictures into your
report. PTReportCom supports many popular graphics file formats: bitmap,
JPG, GIF, PNG, TIFF and so on. For the graphics file formats PTReportCom
supports, refer to Microsoft PowerPoint Help.
You should store the path and name of the graphics files in the database, and
identify the image fields in the report function. PTReportCom will read the
graphics files, and insert them into the cells in the report file.
To specify the size, you should write a formatting expression into the cell in the
report template file. PTReportCom will get the text of the cell, and insert a
picture into the cell according to the instruction in the format expression. The
format expression for pictures as follows:
[size]
The size specifies the size of a picture. Possible values are STRETCH, Wnnn
or / and Hnnn. "STRETCH" means that the picture is resized to fit within the
cell. “W100” means that the width of the picture is set to 100 points. “H50”
means that the height of the picture is set to 50 points. The default means the
original size. If you just specify the width or height of the picture, not both,
PTReportCom will retain the original proportions of the picture when
PTReportCom resize it.
Example
w120 h90
Remarks
PTReportCom will insert a picture, and set the width of the picture to 120
- 22 -
points, the height to 90 points.
4.5 Form Reports
4.5.1 About Form Reports
Beside table reports, PTReportCom supports form reports too. For a form
report, you can get data from data sources, and put data into shapes or text
boxes. So you can make a form report as follows:
4.5.2 Creating a Slide
For a form report, you must create a slide including some shapes or text boxes
in the report template file according to the report. When PTReportCom
executes a SQL statement, the data values from data source will be put into
- 23 -
these shapes or text boxes. PTReportCom will add some slides according to
results returned. One record makes one slide.
You can add some shapes as your needs, such as reshaping shapes, resizing
shapes, changing colors, changing the font. For more detail information about
shapes, refer to Microsoft PowerPoint Help.
To generate the previous PowerPoint report, you should make the following
slide in the report template file.
4.5.3 Naming Objects
How to reference an object in a slide? PTReportCom can reference an object
using its name. The name is not case-sensitive, and uniquely identifies an
object in a slide. But Microsoft PowerPoint can not give a way to know the
name of an object.
- 24 -
We developed a PowerPoint add-in “name.ppa” that can name an object in a
slide. The add-in file is located in the PTReportCom's working directory. To
load the add-in:
1. Launch Microsoft PowerPoint.
2. Click Add-Ins under Tools menu. The Add-Ins dialog box appears.
3. Press Add New button, and browse to “name.ppa” file, and Press OK
button.
4. If prompted to enable macros, press Enable Macros button. The add-in will
be listed in the Add-Ins dialog box. Press Close button to close the dialog box.
If however you do not find the add-in listed in the Add-Ins dialog box, then
check the macro settings. If this is not set to at least Medium, the add-in won't
load. To resolve this:
1. Click Macros under Tools menu, and click Security. The Security dialog
box appears.
2. Click the Security Level tab, and click Medium.
3. Press OK button.
4. Now load the add-in.
5. Once the add-in has been loaded you can set the security level back to
High.
When you open Microsoft PowerPoint after “name.ppa” have been loaded, a
Name menu item will appear under Tools menu. You can show the name of
an object, and rename the object. To name an object:
1. Select an object in a slide.
2. On the Tools menu, click Name. The Object Name dialog box appears.
3. You will see the name of the object you have selected.
4. If you want to rename the object, input a new name in the New Name box,
and press Rename button. If you get an error message “Permission denied”, it
probably means that the name already exists.
- 25 -
5. Press Close button to close the Object Name dialog box.
Remember to save all your works. To ensure to save your change to object
names, you should save a complete file.
1. On the Tools menu, click Options, and then click the Save tab.
2. Clear the Allow fast saves check box when you finish working on the file,
and then save it one last time. A full save occurs when this check box is clear.
4.5.4 Formatting text in an Object
You can use Microsoft PowerPoint to change an object and the attached text.
You can change the font, color, fill, shadow and so on. For more detail
information, refer to Microsoft PowerPoint Help. But to display values in
formatting string, you should use the way similar to cell formatting.
You should write formatting expressions into a shape or text box in the report
template file. PTReportCom will get the text as a format expression before it
puts a value into the object, and output the value using the format expression.
In fact, PTReportCom calls the format function in Visual Basic. The text got
from an object is used as the format expression in format function. For more
information about format expression, refer to “Format Expressions”.
For example, you add a text box with a text “YYYY-MM-DD” in the report
template file. In the report file, you will get a formatted date string. For example,
“1996-04-01”.
A format expression for numbers can have from one to four sections separated
by semicolons. You can define the different formats and colors for positive
values, negative values and zeros.
For example, the format "$#,##0;($#,##0)" has two sections: the first defines
the format and color (black) for positive values and zeros; the second section
defines the format and color (red) for negative values. It displays “2345.12” as
“$2,345”, displays “-5432” as “($5,432)”.
- 26 -
The format “#,##0.00;;” has three sections: the first defines the format and
color (black) for positive values, the second defines the format and color (red)
for negative values, the third section defines the format and color (blue) for
zeros. Note, the first semicolon “;” is red, the second semicolon “;” is blue. The
negative values and zeros are printed using the format of the positive value.
But the color for negative values is red, the color for zeros is blue. It displays
“8.9” as “8.90”, displays “-123” as “-123.00”, and displays “0” as “0.00”.
4.5.5 Formatting Objects for Pictures
As same as the table report, you can insert pictures into your form report too.
You should store the path and name of the graphics files in the database, and
identify the image fields in the report function. PTReportCom will read the
graphics files, and put them at the position of the objects in the report file.
To specify the size, you should write a formatting expression into the shape or
text box in the report template file. The format expression for pictures in form
report is the same as the format expression in table report.
[size]
The size specifies the size of a picture. Possible values are STRETCH, Wnnn
or / and Hnnn. "STRETCH" means that the picture is resized to fit within the
object. “W100” means that the width of the picture is set to 100 points. “H50”
means that the height of the picture is set to 50 points. The default means the
original size. If you just specify the width or height of the picture, not both,
PTReportCom will retain the original proportions of the picture when
PTReportCom resize it.
- 27 -
4.6 Charts
4.6.1 About Charts
You can create many different types of charts in Microsoft PowerPoint. The
chart software may be Microsoft Graph or Microsoft Excel. It is depended on
the version of your Microsoft PowerPoint. For Microsoft PowerPoint 2003 or
earlier, the default chart software is Microsoft Graph. For Microsoft PowerPoint
2007 or later, the default chart software is Microsoft Excel.
PTReportCom supports two kinds of charts created by Microsoft Graph or
Excel. It executes a SQL statement, and puts the result data into the datasheet
or worksheet of the chart. To work with charts created in Graph or Excel, you
must have Graph or Excel installed.
4.6.2 Creating a Blank Chart using Microsoft Graph
To create a Graph chart in the report using PTReportCom, you need to add a
Graph chart in the report template file first. The chart will be brought into the
report file with the same chart type, display option, data format, label format
and other chart item
If your Microsoft Office is earlier than Office 2007, or Microsoft Excel 2007 is
not installed, when you create a new chart in Microsoft PowerPoint, Microsoft
Graph opens.
To add a Graph chart in the template file:
1. Open the report template file using Microsoft PowerePoint.
2. On the Insert menu, click Chart.
3. Change the sample data on the datasheet as you need.
4. Modify the chart. For example, you want to change the chart type, make the
text larger, or change colors, patterns, lines, fills, and borders in charts.
- 28 -
5. After you have finished the modification, delete data from the chart. You
should keep a blank chart in the report template file. PTReportCom will put
data into the datasheet of the chart.
For more detail information, refer to Microsoft PowerPoint Help and Microsoft
Graph Help.
4.6.3 Creating a Blank Chart using Microsoft Excel
To create an Excel chart in the report using PTReportCom, you need to add an
Excel chart in the report template file first. The chart will be brought into the
report file with the same chart type, display option, data format, label format
and other chart item.
To add an Excel chart in the template file:
1. Open the report template file using Microsoft PowerPoint.
2. Insert a chart with a chart sheet and a worksheet. For more information to
insert an Excel chart object in Microsoft PowerPoint, please refer to the
following part.
3. Change the sample data on the worksheet as you need.
4. Modify the chart. For example, you want to change the chart type, make the
text larger, or change colors, patterns, lines, fills, and borders in charts.
If the report type is fix, the data range of the chart should be all
rows/columns for the returned records.
If the report type is var, the data range of the chart should be 2
rows/columns.
5. After you have finished the modification, delete data from the chart. You
should keep a blank chart in the report template file, and make the chart sheet
active. PTReportCom will put data into the worksheet of the chart.
By default, Microsoft PowerPoint 2007 uses Microsoft Excel to create charts,
but doesn't expose the chart as a normal Excel object. To insert an Excel chart
- 29 -
object, you can insert an Excel worksheet first, and then create a chart in the
Excel worksheet object. Another way is to copy an Excel chart object from
earlier PowerPoint presentation.
For Microsoft PowerPoint 2007 or later, to insert an Excel chart object:
1. In Microsoft PowerPoint, on the Insert tab, in the Tables group, click Table,
and then click Excel Spreadsheet. You will see an Excel worksheet object.
2. Right-click the object, point to Worksheet Object on the shortcut menu, and
choose Open from the submenu. Microsoft Excel will appear.
3. Create a chart in Microsoft Excel, and move the chart to a new worksheet.
4. When you've finished, choose Close & Return from the File menu.
For Microsoft PowerPoint 2003 or earlier, to insert an Excel chart object:
1. In Microsoft PowerPoint, click Object on the Insert menu, and then select
the Microsoft Excel Chart.
2. You can work the Excel chart object by right-clicking the object, and pointing
to Chart Object on the shortcut menu, and choosing Open from the submenu.
3. When you've finished, choose Close & Return from the File menu.
For more detail information, refer to Microsoft PowerPoint Help and Microsoft
Excel Help.
4.6.4 Referencing Charts
If you want to reference a chart, you should reference a slide first. You can
reference a slide by an index number. The index number represents the
position of the slide in a presentation. The index number starts at 1. If the index
number is less than 0, it represents the position from the end of presentation.
So slide 1 is the first slide in a presentation, slide 2 is the second slide in a
presentation, slide -1 is the last slide in a presentation. You can reference a
slide dynamically. “N” means the next slide.
You can reference a chart in the slide by an index number. The index number
- 30 -
represents the position of the chart in the slide. The index number starts at 1.
So chart 1 is the first chart in a slide, chart 2 is the second chart, and so on.
- 31 -
Chapter 5 API Reference
5.1 Objects
5.1.1 PTReport Object
Represents the PTReportCom. PTReport is the main class for report
generation using PTReportCom.
Using the PTReport Object
The following example creates a PTReport object in another application and
then generates a report using a PTR file.
Dim ptrpt As PTReport
Set ptrpt = New PTReport
ptrpt.PPTReport pptApp, “customer_list.ptr"
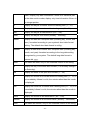
5.2 Methods
5.2.1 FixTableReport Method
Generates a fixed table report based on a template. In a fixed table report, the
number of rows and columns is fixed. PTReportCom gets data from a
recordset object, and directly fills data into the cells of a table.
Syntax
object.FixTableReport(Recordset, Slide, Table, CellList, Range, FillOrder,
ImageList)
- 32 -
object Required. The object is the PTReport object.
Recordset Required. An object variable that represents the
ADODB.Recordset object to provides data. Before calling this method, please
keep the current record position to the first record.
Slide
Required. An object variable that represents the PowerPoint.Slide
object to be filled data. Returns the last slide processed.
Table Required. An integer that represents the index number of the table.
The index number starts at 1.
CellList
Required. A string that represents the list of cells separated by the
“,” character. For example, “A2,B2,B3,D2,D3”. The cells in the CellList should
correspond to the data source fields in the recordset. The value of the first field
is put into the first cell, and the value of the second field is put into the second
cell ……
Range Optional. A string that indicates the range in the table to be used for
the records. PTReportCom will skip the range for each record. A range is
composed of some rows or columns. You can reference a range of cells like
“2:4” or “B:D”. The default range is the area that includes all cells for the
records.
FillOrder
Optional. An integer that indicates the order in which
PTReportCom fills data. If the value is zero, fills data by rows. Otherwise fills
data by columns. Default is 0.
ImageList Optional. A string that indicates which data source fields are the
picture files. The ImageList is the list of data source fields separated by the “,”
character. You can identify a field using the name of field or the index number
of field, but not simultaneously. In data source, you stored the path and file
name of the picture, not the picture. The file path can be a relative path, an
absolute path or a URL. If it is a relative path, the base path is the path of the
presentation.
- 33 -
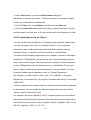
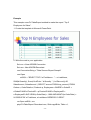
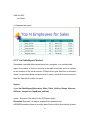
Example
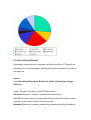
This example uses FixTableReport method to make the report “Top 5
Employees for Sales”.
1. Create the template in Microsoft PowerPoint.
2. Write the code in your application.
Set con = New ADODB.Connection
Set rec = New ADODB.Recordset
con.ConnectionString = "Data Source=Report Sample"
con.Open
strSQL = "SELECT TOP 5 e.FirstName + ' ' + e.LastName,
SUM(d.Quantity), Sum(d.UnitPrice * d.Quantity * (1-d.Discount)) AS
SalesAmount, SalesAmount / (SELECT amount FROM tmp_amount) FROM
Orders o, OrderDetails d, Products p, Employees e WHERE o.OrderID =
d.OrderID AND d.ProductID = p.ProductID AND o.EmployeeID =
e.EmployeeID AND YEAR(o.OrderDate) = 1996 AND MONTH(o.OrderDate) =
04 GROUP BY e.FirstName, e.LastName ORDER BY 3 DESC"
rec.Open strSQL, con
ptrpt.FixTableReport Recordset:=rec, Slide:=pptSlide, Table:=1,
- 34 -
CellList:="B2"
rec.Close
3. Generate the report.
5.2.2 VarTableReport Method
Generates a variable table report based on a template. In a variable table
report, the number of rows or columns in the table is unfixed, and it is variable
as the number of the result records. PTReportCom gets data from a recordset
object, inserts some blank rows/columns or insert new slide for some records,
then fills data into the cells of a table.
Syntax
object.VarTableReport(Recordset, Slide, Table, CellList, Range, Reserve,
FillOrder, ImageList, PageBreak, NoData)
object Required. The object is the PTReport object.
Recordset Required. An object variable that represents the
ADODB.Recordset object to provides data. Before calling this method, please
- 35 -
keep the current record position to the first record.
Slide
Required. An object variable that represents the PowerPoint.Slide
object to be filled data. Returns the last slide processed.
Table Required. An integer that represents the index number of the table.
The index number starts at 1.
CellList
Required. A string that represents the list of cells separated by the
“,” character. For example, “A2,B2,B3,D2,D3”. The cells in the CellList should
correspond to the data source fields in the recordset. The value of the first field
is put into the first cell, and the value of the second field is put into the second
cell ……
Range Optional. A string that indicates the range in the table to be used for
the records. A range is composed of some rows or columns. You can
reference a range of cells like “2:4” or “B:D”. PTReportCom will insert some
rows/columns for each record, or copy slides for some records. If the length of
the range is 1 row/column, you need to reserve 1 or 2 rows/columns in one
slide. Otherwise you must reserve all blank rows/columns for records in one
slide. The default range is the area that includes all cells for the records.
Reserve
Optional. An integer that indicates the number of records for which
you reserved some rows/columns in the report template for the report. One
means you reserve some rows/columns for one record, and two means some
rows/columns for two records. Default is 1. If the length of the range is 1
row/column, you need to reserve 1 or 2 rows/columns in one slide. Otherwise
Reserve must be equal to the PageBreak.
FillOrder
Optional. An integer that indicates the order in which
PTReportCom fills data. If the value is zero, fills data by rows. Otherwise fills
data by columns. Default is 0.
ImageList Optional. A string that indicates which data source fields are the
picture files. The ImageList is the list of data source fields separated by the “,”
- 36 -
character. You can identify a field using the name of field or the index number
of field, but not simultaneously. In data source, you stored the path and file
name of the picture, not the picture. The file path can be a relative path, an
absolute path or a URL. If it is a relative path, the base path is the path of the
presentation.
PageBreak Optional. A string that indicates the page breaks, and tells
PTReportCom to insert new pages in the report. One page is one slide. The
unit of page length is r that means record. For example, “6r” or “6” means that
PTReportCom will put 6 records per slide. Default is “” that means no page
break. If the length of the range is more than 1, PageBreak must be equal to
the Reserve.
NoData
Optional. An integer that represents an option when no data are
returned from data source. If the value is 1, PTReportCom will delete the range
when no data are returned. If the value is 2, it will delete the table. If the value
is 3, it will delete the slide. Default is 0. It means to do nothing.
Example
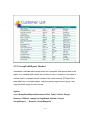
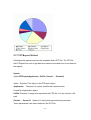
This example uses VarTableReport method to make the report “Customer
List”.
1. Create the template in Microsoft PowerPoint.
2. Write the code in your application.
- 37 -
Set con = New ADODB.Connection
Set rec = New ADODB.Recordset
con.ConnectionString = "Data Source=Report Sample"
con.Open
strSQL = "SELECT CompanyName, CityName, CountryName,
ContactName FROM Customers, Cities, Countries WHERE
Customers.CityCode = Cities.CityCode AND Customers.CountryCode =
Cities.CountryCode AND Customers.CountryCode = Countries.CountryCode
ORDER BY CompanyName, CityName, CountryName"
rec.Open strSQL, con
ptrpt.VarTableReport Recordset:=rec, Slide:=pptSlide, Table:=1,
CellList:="A2", Reserve:=2, PageBreak:=”19”
rec.Close
3. Generate the report.
- 38 -
5.2.3 GroupTableReport Method
Generates a variable table report based on a template, and groups data in the
report. In a variable table report, the number of rows or columns in the table is
unfixed, and it is variable as the number of the result records. PTReportCom
gets data from a recordset object, copy the group range for each group, and
copy the detail range for each record.
Syntax
object.GroupTableReport(Recordset, Slide, Table, CellList, Range,
Reserve, FillOrder, ImageList, PageBreak, NoData, Group1,
GroupRange1, … Group10, GroupRange10)
- 39 -
object Required. The object is the PTReport object.
Recordset Required. An object variable that represents the
ADODB.Recordset object to provides data. Before calling this method, please
keep the current record position to the first record.
Slide
Required. An object variable that represents the PowerPoint.Slide
object to be filled data. Returns the last slide processed.
Table Required. An integer that represents the index number of the table.
The index number starts at 1.
CellList
Required. A string that represents the list of cells separated by the
“,” character. For example, “A2,B2,B3,D2,D3”. The cells in the CellList should
correspond to the data source fields in the recordset. The value of the first field
is put into the first cell, and the value of the second field is put into the second
cell ……
Range Optional. A string that indicates the range in the table to be used for
the records. A range is composed of some rows or columns. You can
reference a range of cells like “2:4” or “B:D”. PTReportCom will insert some
rows/columns for each record, or copy slides for some records. If the length of
the range is 1 row/column, you need to reserve 1 or 2 rows/columns in one
slide. Otherwise you must reserve all blank rows/columns for records in one
slide. The default range is the area that includes all cells for the records.
Reserve
Optional. An integer that indicates the number of records for which
you reserved some rows/columns in the report template for the report. One
means you reserve some rows/columns for one record, and two means some
rows/columns for two records. Default is 1. When the grouprange is same as
the range of the detail, you can use Reserve to make report. If the length of the
range is 1 row/column, you need to reserve 1 or 2 rows/columns in one slide.
Otherwise Reserve must be equal to the PageBreak.
FillOrder
Optional. An integer that indicates the order in which
- 40 -
PTReportCom fills data. If the value is zero, fills data by rows. Otherwise fills
data by columns. Default is 0.
ImageList Optional. A string that indicates which data source fields are the
picture files. The ImageList is the list of data source fields separated by the “,”
character. You can identify a field using the name of field or the index number
of field, but not simultaneously. In data source, you stored the path and file
name of the picture, not the picture. The file path can be a relative path, an
absolute path or a URL. If it is a relative path, the base path is the path of the
presentation.
PageBreak Optional. A string that indicates the page breaks, and tells
PTReportCom to insert new pages in the report. One page is one slide. The
unit of page length is r or g. "r" means record, "g1" means group one, "g2"
means group two...... For example, “6r” or “6” means that PTReportCom will
put 6 records per slide, “1g” means one group per slide, and “1g,6r” means one
group or 6 records per slide. Default PTReportCom will not show the group
name in the new page. You can add “s” to show them. For example, “1gs,6rs”.
If the length of the range is more than 1, PageBreak must be equal to the
Reserve. If the grouprange is not same as the range of the detail, you must
add a pagebreak by group, and the length of the range can not be more then 1
row/column.
NoData
Optional. An integer that represents an option when no data are
returned from data source. If the value is 1, PTReportCom will delete the range
when no data are returned. If the value is 2, it will delete the table. If the value
is 3, it will delete the slide. Default is 0. It means to do nothing.
Group1…Group10 Optional. A string that indicates the group that is the list of
data source fields separated by the “,” character. You can identify a field using
the name of field or the index number of field, but not simultaneously. In one
report, there may be up to 10 groups. Notes: the order of groups should be in
- 41 -
accordance with the order of ORDER BY clause in the SQL statement.
GroupRange1…GroupRange10 Optional. A string that indicates the range
of the group in the table. PTReportCom will repeat the range for each group.
The range of the group should contain the range of the details and the area
that includes all cells for this group. You reference a group range like “2:4” or
“B:D”. For example, there are two groups, the range of the group one contains
all cells for the group one and the range of the group two, and the range of the
group two contains all cells for the group two and the range of the details. The
default range is the area that includes all cells for this group and the range or
the group range for the lower level group. If the grouprange is not same as the
range of the detail, you must add a pagebreak by group, and the length of the
range can not be more then 1 row/column.
Example
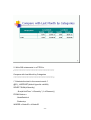
This example uses GroupTableReport method to make the report “Customer
Profile”.
1. Create the template in Microsoft PowerPoint.
- 42 -
2. Write the code in your application.
Set con = New ADODB.Connection
Set rec = New ADODB.Recordset
con.ConnectionString = "Data Source=Report Sample"
con.Open
strSQL = "SELECT LEFT(CompanyName,1), CompanyName,
ContactName, 'Phone: ' & Phone, 'Fax: ' & Fax, Address, CityName & ', ' &
CountryName, PostalCode FROM Customers, Cities, Countries WHERE
Customers.CityCode = Cities.CityCode AND Customers.CountryCode =
Cities.CountryCode AND Customers.CountryCode = Countries.CountryCode
ORDER BY CompanyName"
rec.Open strSQL, con
- 43 -
ptrpt.GroupTableReport Recordset:=rec, Slide:=pptSlide, Table:=1,
CellList:="A2,B3,C3,D3,D4,E3,E4,E5", Range:="2:5", Group1:="1",
Reserve:=5, PageBreak:="5r"
rec.Close
3. Generate the report.
5.2.4 FormReport Method
Generates a form report based on a template, and groups data in the report.
For a form report, you can put data from data source into shapes or text boxes
in the report file. PTReportCom gets data from a recordset object, copy the
slide for each record.
- 44 -
Syntax
object.FormReport(Recordset, Slide, CellList, ImageList, NoData,
Group1, … Group10)
object Required. The object is the PTReport object.
Recordset Required. An object variable that represents the
ADODB.Recordset object to provides data. Before calling this method, please
keep the current record position to the first record.
Slide
Required. An object variable that represents the PowerPoint.Slide
object to be filled data. If the slide is deleted, returns nothing. Otherwise
returns the last slide processed.
CellList
Required. A string that represents the list of shapes or text boxes
in a slide separated by the “,” character. For example, “ProductName,
ProductID, QuantityPerUnit, UnitPrice”. The shapes or text boxes in the celllist
should correspond to the data source fields in the SQL statement. The value of
the first data source field is put into the first object as a text, and the value of
the second data source field is put into the second object……You can get the
name of the shape or text box using the add-in “name.ppa”.
ImageList Optional. A string that indicates which data source fields are the
picture files. The ImageList is the list of data source fields separated by the “,”
character. You can identify a field using the name of field or the index number
of field, but not simultaneously. In data source, you stored the path and file
name of the picture, not the picture. The file path can be a relative path, an
absolute path or a URL. If it is a relative path, the base path is the path of the
table.
NoData
Optional. An integer that represents an option when no data are
returned from data source. If the value is 1 or 3, PTReportCom will delete the
- 45 -
range when no data are returned. Default is 0. It means to do nothing.
Group1…Group10 Optional. A string that indicates the group that is the list of
data source fields separated by the “,” character. You can identify a field using
the name of field or the index number of field, but not simultaneously. In one
report, there may be up to 10 groups. Notes: the order of groups should be in
accordance with the order of ORDER BY clause in the SQL statement.
Remarks
In FormReport method, there is no Range and PageBreak. It will put only one
record per slide.
Example
This example uses FormReport method to make the report “Supplier Profile”.
1. Create the template in Microsoft PowerPoint.
2. Write the code in your application.
- 46 -
Set con = New ADODB.Connection
Set rec = New ADODB.Recordset
con.ConnectionString = "Data Source=Report Sample"
con.Open
strSQL = "SELECT
CompanyName,CompanyName,ContactName,ContactTitle,Address"
strSQL = strSQL & vbCrLf &
",CityName,CountryName,PostalCode,Phone,Fax,HomePage"
strSQL = strSQL & vbCrLf & "FROM Suppliers, Countries, Cities"
strSQL = strSQL & vbCrLf & "WHERE Suppliers.CityCode =
Cities.CityCode"
strSQL = strSQL & vbCrLf & "AND Suppliers.CountryCode =
Cities.CountryCode"
strSQL = strSQL & vbCrLf & "AND Suppliers.CountryCode =
Countries.CountryCode"
strSQL = strSQL & vbCrLf & "ORDER BY CompanyName"
rec.Open strSQL, con
ptrpt.FormReport Recordset:=rec, Slide:=pptSlide, CellList:=" SlideTitle,
Company, ContactName, ContactTitle, Address, City, Country, PostCode,
Phone, Fax, HomePage "
rec.Close
3. Generate the report.
- 47 -
5.2.5 MSGraphChart Method
Generates a chart based on a template using Microsoft Graph. PTReportCom
gets data from a recordset object, and fills data into the datasheet of a chart in
the report file.
Syntax
object.MSGraphChart(Recordset, Chart, CellList, Range, FillOrder)
object Required. The object is the PTReport object.
Recordset Required. An object variable that represents the
ADODB.Recordset object to provides data. Before calling this method, please
keep the current record position to the first record.
Chart Required. An object variable that represents the Graph.Chart object.
- 48 -
CellList
Required. A string that represents the list of cells separated by the
“,” character. For example, “A2,B2,B3,D2,D3”. The cells in the CellList should
correspond to the data source fields in the recordset. The value of the first field
is put into the first cell, and the value of the second field is put into the second
cell ……Note: On the datasheet, the leftmost column and the top row, which
are commonly used for legend text or axis labels, are referred to as column 0
(zero) and row 0 (zero).
Range Optional. A string that indicates the range in the datasheet to be used
for the records. PTReportCom will skip the rows/columns of the range for each
record. A range is composed of some rows or columns. You can reference a
range of cells like “2:4” or “B:D”. The default range is the area that includes all
cells for the records.
FillOrder
Optional. An integer that indicates the order in which
PTReportCom fills data. If the value is zero, fills data by rows. Otherwise fills
data by columns. Default is 1.
Example
This example uses MSGraphChart method to make the report “Sales by
Categories”.
1. Create the template in Microsoft PowerPoint.
The datasheet of the chart defined in the report template:
2. Write the code in your application.
Set con = New ADODB.Connection
Set rec = New ADODB.Recordset
- 49 -
con.ConnectionString = "Data Source=Report Sample"
con.Open
strSQL = " SELECT c.CategoryName, Sum(d.UnitPrice * d.Quantity *
(1-d.Discount)) FROM Orders o, OrderDetails d, Products p, Categories c
WHERE o.OrderID = d.OrderID AND d.ProductID = p.ProductID AND
p.CategoryID = c.CategoryID AND YEAR(o.OrderDate) = 1996 AND
MONTH(o.OrderDate) = 04 GROUP BY c.CategoryName ORDER BY
c.CategoryName"
rec.Open strSQL, con
ptrpt.MSGraphChart Recordset:=rec, Chart:=pptChart, CellList:="A0"
rec.Close
3. Generate the chart.
The datasheet of the chart generated in the report:
The chart generated in the report:
- 50 -
5.2.6 ExcelChart Method
Generates a chart based on a template using Microsoft Excel. PTReportCom
gets data from a recordset object, and fills data into the worksheet of a chart in
the report file.
Syntax
object.ExcelChart(Recordset, Workbook, CellList, ReportType, Range,
FillOrder)
object Required. The object is the PTReport object.
Recordset Required. An object variable that represents the
ADODB.Recordset object to provides data. Before calling this method, please
keep the current record position to the first record.
Workbook Required. An object variable that represents the Excel.Workbook
- 51 -
object.
CellList
Required. A string that represents the list of cells separated by the
“,” character. For example, “A2,B2,B3,D2,D3”. The cells in the CellList should
correspond to the data source fields in the recordset. The value of the first field
is put into the first cell, and the value of the second field is put into the second
cell ……
ReportType
Optional. An integer that indicates the report type. If the value
is zero, PTReportCom will add some blank rows/columns before filling data
values into the worksheet of the chart. If the value is one, PTReportCom will
directly fill data vales into the worksheet of the chart. Default is 0. When it is a
variable table report, you should reserve two rows/columns in the worksheet in
the report template, and set the data range of the chart to 2 rows/columns.
Range Optional. A string that indicates the range in the worksheet to be used
for the records. PTReportCom will skip the rows/columns of the range for each
record. A range is composed of some rows or columns. You can reference a
range of cells like “2:4” or “B:D”. The default range is the area that includes all
cells for the records.
FillOrder
Optional. An integer that indicates the order in which
PTReportCom fills data. If the value is zero, fills data by rows. Otherwise fills
data by columns. Default is 0.
Example
This example uses ExcelChart method to make the report “Sales by
Categories”.
1. Create the template in Microsoft PowerPoint.
The workheet of the chart defined in the report template:
- 52 -
2. Write the code in your application.
Set con = New ADODB.Connection
Set rec = New ADODB.Recordset
con.ConnectionString = "Data Source=Report Sample"
con.Open
strSQL = " SELECT c.CategoryName, Sum(d.UnitPrice * d.Quantity *
(1-d.Discount)) FROM Orders o, OrderDetails d, Products p, Categories c
WHERE o.OrderID = d.OrderID AND d.ProductID = p.ProductID AND
p.CategoryID = c.CategoryID AND YEAR(o.OrderDate) = 1996 AND
MONTH(o.OrderDate) = 04 GROUP BY c.CategoryName ORDER BY
c.CategoryName"
rec.Open strSQL, con
ptrpt.ExcelChart Recordset:=rec, Workbook:=xlWorkbook, CellList:="A2"
rec.Close
3. Generate the chart.
The worksheet of the chart generated in the report:
The chart generated in the report:
- 53 -
5.2.7 PPTReport Method
Generates the reports based on the templates and a PTR file. The PTR file
tells PTReportCom how to get data from data sources and how to put data into
the reports.
Syntax
object.PPTReport(Application, PtrFile, Param1 … Param10)
object Required. The object is the PTReport object.
Application
Required. An object variable that represents the
PowerPoint.Application object.
PtrFile Required. A string that represents the PTR file. You can include a full
path.
Param1 … Param10
Optional. A string that represents the paramters.
These parameters have been defined in the PTR file.
- 54 -
Example
This example uses PPTReport method to make the report “Customer List”.
1. Create the template customer_list.ppt using Microsoft PowerPoint.
2. Create the PTR file customer_list.ptr using a text editor.
3. Write the code in your application.
Set pptApp = New PowerPoint.Application
Set ptrpt = New PTReport
Call ptrpt.PPTReport(pptApp, “customer_list.ptr”)
5.2.8 GetSlideByIndex Method
Returns a PowerPoint.Slide object by using the slide index.
Syntax
object.GetSlideByIndex(Presentaion, Index)
object Required. The object is the PTReport object.
Presentaion
Required. An object variable that represents the
PowerPoint.Presentaion object.
Index Required. An integer that represents the index of the slide. The index
number starts at 1. If the index number is less than 0, it represents the position
from the end of presentation. For examples, slide 2 is the second slide in a
presentation, slide -1 is the last slide in a presentation.
Example
This example uses GetSlideByIndex method to get the second slide in the
presentation.
Dim pptPres As PowerPoint.Presentaion
Dim pptSlide As PowerPoint.Slide
- 55 -
……
Set pptSlide = mptrpt.GetSlideByIndex(pptPres, 2)
5.2.9 GetTableInSlide Method
Returns a PowerPoint.Table object by using the table index.
Syntax
object.GetTableInSlide(Slide, Index)
object Required. The object is the PTReport object.
Slide
Required. An object variable that represents the PowerPoint.Slide
object.
Index Required. An integer that represents the index of the table. The index
number starts at 1. For examples, table 2 is the second table in the slide.
Example
This example uses GetTableInSlide method to get the first table in the slide.
Dim pptSlide As PowerPoint.Slide
Dim pptTable As PowerPoint.Table
……
Set pptTable = mptrpt.GetTableInSlide(pptSlide, 1)
5.2.10 GetChartInSlide Method
Returns a PowerPoint.OLEFormat object that represents the Microsoft Graph
chart or Microsoft Excel chart OLE object.
Syntax
object.GetChartInSlide(Slide, Index)
- 56 -
object Required. The object is the PTReport object.
Slide
Required. An object variable that represents the PowerPoint.Slide
object.
Index Required. A string that represents the index of the chart. The index
number starts at 1. For examples, chart 2 is the second chart in the slide.
Example
This example uses GetChartInSlide method to get the first chart in the
presentation.
Dim pptSlide As PowerPoint.Slide
Dim pptChartOLE As PowerPoint.OLEFormat
Dim graChart As Graph.Chart
Dim xlWorkbook As Excel.Workbook
……
Set pptChartOLE = mptrpt.GetChartInSlide(pptSlide, 1)
If Left(wdChartOLE.ProgId, 11) = "Excel.Chart" Then
Set xlWorkbook = pptChartOLE.object
Else
Set graChart = pptChartOLE.object
End If
5.3 Events
5.3.1 BeforeConnect Event
Occurs before a connection starts.
Syntax
- 57 -
Private Sub object_BeforeConnect(UserID As String, Password As String,
DataSource As String, Connection As ADODB.Connection)
object The object is the PTReport object.
UserID A string that represents a user name for the connection.
Password A string that represents a password for the connection.
DataSource
A string that represents a data source name for the
connection.
Connection The ADODB.Connection object.
Example
Private Sub mptrpt_BeforeConnect(UserID As String, Password As String,
DataSource As String, Connection As ADODB.Connection)
Connection.ConnectionTimeout = 15
Connection.CursorLocation = adUseClient
End Sub
5.3.2 TemplateOpen Event
Occurs when a template presentation is opened.
Syntax
Private Sub object_TemplateOpen(ByVal Presentaion As
PowerPoint.Presentaion)
object The object is the PTReport object.
Presentaion
An object variable that represents the PowerPoint.Presentaion
object to be opened.
- 58 -
Example
Private Sub mptrpt_TemplateOpen(ByVal Presentaion As
PowerPoint.Presentaion)
gstrFileName = Presentaion.FullName
End Sub
5.3.3 ReportComplete Event
Occurs when all report generating process is completed.
Syntax
Private Sub object_ReportComplete(ByVal Presentaion As
PowerPoint.Presentaion)
object The object is the PTReport object.
Presentaion
An object variable that represents the PowerPoint.Presentaion
object.
Example
Private Sub mptrpt_ReportComplete(ByVal Presentaion As
PowerPoint.Presentaion)
With Presentation
' Close the presentation and do not display the report when get errors
If mintErrCount > 0 Then
.Close
' Show the presentation if no error
Else
.Application.Visible = True
.NewWindow
- 59 -
End If
End With
End Sub
5.3.4 FunctionBeforeExectue Event
Occurs before a function is executed.
Syntax
Private Sub object_FunctionBeforeExectue(ByVal FunctionNo As String,
ByVal FunctionType As Integer, ByVal SQLNo As Long, ByVal SQLText As
String)
object The object is the PTReport object.
FunctionNo A string that represents the label of the function.
FunctionTyp
An integer that represents the type of the function. 0 means
ExecSQL function. 2 means Report function. 3 means Chart function.
SQLNo
A long that represents the number of SQL statements.
SQLText
A string that contains the SQL statement.
Example
Private Sub mptrpt_FunctionBeforeExectue(ByVal FunctionNo As String,
ByVal FunctionType As Integer, ByVal SQLNo As Long, ByVal SQLText As
String)
frmWait.lblFunctionNo = FunctionNo
frmWait.lblSQLCount = SQLNo
End Sub
- 60 -
5.3.5 FunctionAfterExectue Event
Occurs after a function is executed.
Syntax
Private Sub object_FunctionAfterExectue(ByVal FunctionNo As String,
ByVal FunctionType As Integer, ByVal SQLNo As Long, ByVal ErrObj As
ErrObject)
object The object is the PTReport object.
FunctionNo A string that represents the label of the function.
FunctionTyp
An integer that represents the type of the function. 0 means
ExecSQL function. 2 means Report function. 3 means Chart function.
SQLNo
A long that represents the number of SQL statements.
ErrObj The Err object.
Example
Private Sub mptrpt_FunctionAfterExectue(ByVal FunctionNo As String, ByVal
FunctionType As Integer, ByVal SQLNo As Long, ByVal ErrObj As ErrObject)
If ErrObj.Number <> 0 Then
If FunctionType <> 0 Then
'Ignore errors of EXECSQL
MsgBox ErrObj.Description, vbExclamation, App.ProductName
mintErrCount = mintErrCount + 1
End If
End If
End Sub
- 61 -
5.3.6 FunctionProgress Event
Occurs periodically during a function processing.
Syntax
Private Sub object_FunctionProgress(ByVal Progress As Long, ByVal
RecordCount As Long)
object The object is the PTReport object.
Progress
A long that indicates the number of records that have currently
been processed.
RecordCount
A long that indicates the total number of records.
Example
Private Sub mptrpt_FunctionProgress(ByVal Progress As Long, ByVal
RecordCount As Long)
frmWait.lblRecordCnt.Caption = Format(Progress, "#,##0") & " / " &
Format(RecordCount, "#,##0")
End Sub
5.4 Error Messages
The following table lists the trappable errors for the PTReport Object.
Value
Description
-2147221493
-2147221492
-2147221491
-2147221490
-2147221489
-2147221488
-2147221487
The file PtrFileName does not exist.
The file PtrFileName is not a PPTReport file.
Error in reading the file PtrFileName.
Report template file TemplateFileName does not exist.
The report file is not named correctly.
Failed to create the report file ReportFileName.
Failed to open the template file TemplateFileName.
- 62 -
-2147221486
-2147221485
-2147221473
-2147221453
-2147221452
-2147221451
-2147221450
-2147221449
-2147221448
-2147221447
-2147221446
-2147221445
-2147221393
-2147221392
-2147221391
-2147221390
-2147221389
-2147221388
-2147221387
-2147221383
-2147221382
-2147221381
-2147221380
-2147221379
-2147221378
-2147221377
-2147221373
-2147221372
-2147221363
-2147221362
-2147221361
-2147221360
Failed to save the report file.
Failed to save the report file. Not support the file format: FileFormat.
The ADODB.Recordset object is closed.
Syntax error. The table M in slide N does not exist.
Syntax error. The chart M in slide N does not exist.
Syntax error. The silde N does not exist.
The PowerPoint.Slide object is not set.
The Graph.Chart object is not set.
The Excel.Workbook object is not set.
Unable to find the PowerPoint presentation.
Unable to find the Excel chart.
Unable to find the source data worksheet.
Syntax error. There is a lack of the parameter "CELL".
Syntax error. It is not a valid cell "" for the parameter "CELL".
Syntax error. Failed to parse cell list.
Syntax error. Failed to parse cell Cell.
Can not find the shape Shape in the slide N.
Syntax error. Failed to parse cell Cell. The cell Cell is out of the
range of the table.
Can not add text in the shape Shape.
The range should be Range.
Syntax error. Failed to parse range Range.
You should add parameter PAGEBREAK or change the value for
RESERVE when the length of the range is more then 1 row/column.
The value Reserve for parameter RESERVE must be equal to the
value PageBreak for PAGEBREAK when the length of the range is
more then 1 row/column.
You should add a pagebreak by record or change the value for
RESERVE when the length of the range is more then 1 row/column.
You should add a pagebreak by record when the length of the range
is more then 1 row/column.
The value Reserve for parameter RESERVE must be equal to the
value PageBreak for PAGEBREAK when the length of the range is
more then 1 row/column.
Syntax error. Failed to parse image. Can not find field ImageField in
the image list.
Syntax error. Failed to parse image.
Syntax error. Failed to parse group N. Can not find field Field.
Syntax error. Failed to parse group.
The grouprange of group N should be Range.
Syntax error. Failed to parse grouprange.
- 63 -
The length of the range can not be more then 1 row/column when
the grouprange is not same as the range of the detail.
You should add a pagebreak by group when the grouprange is not
-2147221358
same as the range of the detail.
-2147221359
- 64 -
Chapter 6 PTR Files
6.1 Using PTR files
6.1.1 About PTR files
Like PTReportGen, PTReportCom can also read a PTR file to generate a
report. The PTR file is a text file with a .ptr extension. It contains information
such as the name of the report template file, the name of the report file, the
name of the log file, data sources, parameters and functions. The PTR file tells
PTReportCom how to get data from data sources and how to put data into a
report. Using the PTR file, it will simplify your development.
6.1.2 Using a PTR file with PTReport Object
PTReport object provides the PPTReport method to generate a report based
on a PTR file. For example, you have created the PTR file “myreport.ptr” and
the template file. In the PTR file, there are two parameters. The first parameter
is the sales date “$SalesDate”, and the second is the category of the products
“$Category”. You can call PPTReport method to generate the report.
Set pptApp = New PowerPoint.Application
Set ptrpt = New PTReport
Call ptrpt.PPTReport(pptApp, “c:\pptreport\myreport.ptr”, “1996-05-01”,
“Dairy Products”)
PTReportCom will replace “$SalesDate” in SQL statements with “1996-05-01”,
replace “$Category” with “Dairy Products”, and then submit SQL statements to
data sources.
- 65 -
6.1.3 Using a PTR file in command line
In the PTReportCom, there is an executable file PPTReport.exe that can read
a PTR file to generate a report. It is the same as PTReportGen command line.
For example, you have created the PTR file “myreport.ptr” and the template file.
In the PTR file, there are two parameters. The first parameter is the sales date
“$SalesDate”, and the second is the category of the products “$Category”. You
can run PPTReport.exe in command line mode as follows:
pptreport c:\pptreport\myreport.ptr 1996-05-01 “Dairy Products”
PTReportCom will replace “$SalesDate” in SQL statements with “1996-05-01”,
replace “$Category” with “Dairy Products”, and then submit SQL statements to
data sources.
6.1.4 Creating a PTR file
The PTR file is a text file. You can create and modify a PTR file in
PTReportGen or a text editor.
Sometimes you want to make a PTR file programmatically. You can write a
program to create a PTR file using C, perl or DOS shell, and then run
PTReportCom to generate report. The two steps can be written into a batch
file.
1. Write a program to make the PTR file as you need.
2. Write a batch file to call the program and PPTReport.exe.
For example, you write a batch file runrpt.bat as follows. changeptr is an
executable file that reads template.txt and output template.ptr. First runrpt.bat
call changeptr to make the PTR file, and then call PPTReport.exe to generate
the report.
@echo off
if "%1"=="" goto usage
- 66 -
goto process
:usage
echo Usage: runrpt ReportDate
echo ReportDate Date format 'YYYY-MM-DD'
goto :EOF
:process
changeptr %1 <"template.txt" >"template.ptr"
PPTReport "template.ptr" %1
6.1.5 Using parameters
You can use parameters in the PTR file. You can pass values to
PTReportCom when it processes a PTR file. PTReportCom will replace the
parameter names with the actual values. You can use the parameters in the
SQL statements and the paths and names of the files.
To use a parameter, you must define it first. If you have defined a parameter
name, you can use it in SQL statements. In fact, PTReportCom will replace all
strings that are the same as the names of the parameters. You should be
careful to define a unique name for each parameter. It is a good choice a name
begins with the “$” character.
Example
Input an order id to get the order information. The field OrderID is numeric
type.
1. Defining a parameter
Define a parameter as follows:
Name: $OrderID
Title: Order ID (>=10248)
Default: 10360
2. Using a parameter
- 67 -
You can use the parameter “$OrderID” in SQL statements. For example:
SELECT o.OrderID
,o.OrderDate
,SUM(d.UnitPrice * d.Quantity * (1-d.Discount)) AS Amount
FROM Orders o, OrderDetails d
WHERE o.OrderID = d.OrderID
AND o.OrderID = $OrderID
GROUP BY o.OrderID, o.OrderDate
;
Example
Define two parameters. The first parameter is the sales date, and the second is
the category of the products. The field OrderDate is date type, and
CategoryName is char type.
1. Defining parameters
Define parameters as follows:
Name1: $SalesDate
Title1: Sales Date
Default1: 1996-05-01
Name2: $Category
Title2: Category of Products
Default2:
2. Using parameters
You can use the parameters “$SalesDate”, “$Category” in SQL statements.
For example:
SELECT ……
FROM Orders, OrderDetails, Products, Categories
WHERE ……
AND OrderDate = ‘$SalesDate’
- 68 -
AND CategoryName LIKE '$Category%'
;
/* For Microsoft Jet SQL, LIKE '$Category*' */
Example
Get the information from the database, table and column that you identify when
the report is generated.
1. Defining parameters
Define parameters as follows:
Name1: $Database
Title1: Database Name
Default1:
Name2: $Table
Title2: Table Name
Default2:
Name3: $Column
Title3: Column Name
Default3:
2. Using parameters
You can use the parameters “$Database”, “$Table” and “$Column” in SQL
statements. For example:
USE $Database;
or
DATABASE $Database;
SELECT $Column
FROM $Table
;
Example
Use parameters in the path and name of the report file and the log file.
- 69 -
1. Defining a parameter
Define a parameter as follows:
Name: $CustomerID
Title: Customer ID
Default: C000001
2. Using a parameter
ReportFileName=report\report_$CustomerID.ppt
LogFileName=log\report_$CustomerID.log
or
ReportFileName=report\$CustomerID\report.ppt
LogFileName=log\$CustomerID\report.log
6.1.6 Converting files
You can convert a file from Microsoft PowerPoint presentation to and from
another file format. For example, the template file is a presentation file with
a .ppt extension, and the report file is a PowerPoint show file with a .pps
extension.
The file formats PTReportCom supports can be one of these. What file format
PTReportCom supports is dependent on your Microsoft PowerPoint. For
example, Microsoft PowerPoint 2003 supports Web archive (.mht), but
Microsoft PowerPoint 2000 does not support it. For more information about
converting files, please refer to Microsoft PowerPoint Help. The file “pconv.cfg”
located in the PTReportCom directory contains the information of file formats.
You can expand it if your Microsoft PowerPoint supports more file formats.
File Format Name
Value
ppSaveAsPresentation
1
ppSaveAsPowerPoint7
Description
Extension
Converter
Presentation
ppt
Office2000
2
PowerPoint 95
Presentation
ppt
Office2000
ppSaveAsPowerPoint4
3
PowerPoint 4 Presentation
ppt
Office2000
ppSaveAsPowerPoint3
4
PowerPoint 3 Presentation
- 70 -
ppt
Office2000
ppSaveAsTemplate
5
Design Template
pot
Office2000
ppSaveAsRTF
6
Outline/RTF
rtf
Office2000
ppSaveAsShow
7
PowerPoint Show
pps
Office2000
ppSaveAsAddIn
8
PowerPoint Add-In
ppa
Office2000
ppSaveAsPowerPoint4FarEast
10
PowerPoint 4 Far East
ppt
Office2000
ppSaveAsHTML
12
Web Page
htm html
Office2000
ppSaveAsHTMLv3
13
Web Page v3
htm html
Office2000
ppSaveAsHTMLDual
14
Web Page Dual
htm html
Office2000
ppSaveAsMetaFile
15
Windows Metafile
wmf
Office2000
ppSaveAsGIF
16
GIF (Graphics Interchange
Format)
gif
Office2000
ppSaveAsJPG
17
JPEG (File Interchange
Format)
jpg
Office2000
ppSaveAsPNG
18
PNG (Portable Network
Graphics Format)
png
Office2000
ppSaveAsBMP
19
Device Independent
Bitmap
bmp
Office2000
ppSaveAsWebArchive
20
Single File Web Page
mht
mhtml
Office2002
ppSaveAsTIF
21
TIFF (Tag Image Format
File)
tif
Office2002
ppSaveAsPresForReview
22
Presentation for Review
ppt
Office2003
ppSaveAsEMF
23
Enhanced Windows
Metafile
emf
Office2003
For Microsoft PowerPoint 2007, please copy “pconv2007.cfg” to “pconv.cfg”.
This file contains the information of file formats for Microsoft PowerPoint 2007.
File Format Name
Value
Description
Extension
ppSaveAsOpenXMLPresentation
24
PowerPoint
Presentation
pptx
ppSaveAsOpenXMLPresentationMacroEnabled
25
PowerPoint
Macro-enabled
Presentation
pptm
PowerPoint 97-2003
Presentation
ppt
ppSaveAsPresentation
1
ppSaveAsPDF
32
PDF
pdf
ppSaveAsXPS
33
XPS Document
Format
xps
ppSaveAsOpenXMLTemplate
26
PowerPoint Template
potx
ppSaveAsOpenXMLTemplateMacroEnabled
27
PowerPoint
Macro-enabled
potm
- 71 -
Presentation Template
ppSaveAsTemplate
5
PowerPoint 97-2003
Template
pot
ppSaveAsOpenXMLTheme
31
Office Theme
thmx
ppSaveAsOpenXMLShow
28
PowerPoint Slide
Show
ppsx
ppSaveAsOpenXMLShowMacroEnabled
29
PowerPoint
Macro-enabled Slide
Show
ppsx
7
PowerPoint 97-2003
Show
pps
PowerPoint Add-in
ppam
PowerPoint 97-2003
Add-In
ppa
ppSaveAsShow
ppSaveAsOpenXMLAddin
30
ppSaveAsAddIn
8
ppSaveAsXMLPresentation
34
PowerPoint XML
Presentation
xml
ppSaveAsWebArchive
20
Single File Web Page
mht
mhtml
ppSaveAsHTML
12
Web Page
htm html
ppSaveAsHTMLv3
13
Web Page v3
htm html
ppSaveAsHTMLDual
14
Web Page Dual
htm html
ppSaveAsGIF
16
GIF (Graphics
Interchange Format)
gif
ppSaveAsJPG
17
JPEG (File
Interchange Format)
jpg
ppSaveAsPNG
18
PNG (Portable
Network Graphics
Format)
png
ppSaveAsTIF
21
TIFF (Tag Image
Format File)
tif
ppSaveAsBMP
19
Device Independent
Bitmap
bmp
ppSaveAsMetaFile
15
Windows Metafile
wmf
ppSaveAsEMF
23
Enhanced Windows
Metafile
emf
ppSaveAsRTF
6
Outline/RTF
rtf
- 72 -
6.2 PTR File Reference
6.2.1 PTR File Format
The layout of a PTR file is as the following:
PPTReport Version 1.0
[Data Source]
……
[File]
……
[Parameter]
……
[SQL]
……
“PPTReport” is the flag of the PTR file. “Version 2.0” is the version of the PTR
file.
A PTR file contains several sections. The sections of [Data Source], [File], and
[Parameter] consist of a group of related settings. The sections and settings
are listed in the PTR file in the following format:
[section name]
keyname=value
In this example, [section name] is the name of a section. The enclosing
brackets ([]) are required, and the left bracket must be in the leftmost column
on the screen.
The keyname=value statement defines the value of each setting. A keyname is
the name of a setting. It can consist of any combination of letters and digits,
and must be followed immediately by an equal sign (=). The value can be an
integer, a string, or a quoted string, depending on the setting.
You can include comments in these sections. You must begin each line of a
- 73 -
comment with a semicolon (;).
The [SQL] section consists of functions. Each function is begin with the “@”
character. Syntax:
@functionno=functionname(arguments)
sqlstatement
The functionno is the label of the function.
The functionname represents a function.
The arguments define various properties for the function. An argument takes
the form Name="Value". The argument value can be delimited by single or
double quotes.
The sqlstatement is a SQL statement.
You can use comments in [SQL] section. A comment is the “/*” characters,
followed by any sequence of characters (including new lines), followed by the
“*/” characters. You cannot nest comments.
6.2.2 [Data Source] Section
The [Data Source] section contains information how to connect to data
sources.
Name1=<name1>
Name2=<name2>
……
Name10=<name10>
These settings specify the names of data sources you want to connect to.
Name1 specifies the name of the first data source. Name2 specifies the name
of the second data source…… You can define up to 10 data sources in one
PRT file. You can make a connection to a data source using an ODBC data
source name or a connection string. Even if you use a connection string to
- 74 -
make a connection, you should define a name that you can reference in
functions.
User1=<username1>
User2=<username2>
……
User10=<username10>
These settings specify the user names. If you use an ODBC data source name
to make a connection, you should define user name and password. If you use
a connection string to make a connection, PTReportCom will ignore the setting.
User1 specifies the user name of the first data source. User2 specifies the user
name of the second data source…… They are optional settings. If defined
default user and password in ODBC data source, you may not define them.
Password1=<password1>
Password2=<password2>
……
Password10=<password10>
These settings specify the user passwords. If you use an ODBC data source
name to make a connection, you should define user name and password. If
you use a connection string to make a connection, PTReportCom will ignore
the setting. Password1 specifies the password of the first data source.
Password2 specifies the password of the second data source…… They are
optional settings. If defined default user and password in ODBC data source,
you may not define them.
ConnectionString1=<connectionstring1>
ConnectionString2=<connectionstring2>
- 75 -
……
ConnectionString10=<connectionstring10>
These settings specify the connection strings. If you defined a connection
string, PTReportCom will make a connection to the data source using the
connection string, and ignore the settings of the name, user and password. But
you must define a name that you can reference in functions.
ConnectionString1 specifies the connection string of the first data source.
ConnectionString2 specifies the connection string of the second data
source…… They are optional settings. If no connection string, PTReportCom
will make a connection to data source using the ODBC data source name.
EncryptPassword =Y/N
This setting specifies how to save the passwords of the data sources. If the
value is Y, passwords will be saved in an encrypted format. If the value is N,
the passwords will be saved in plain text.
6.2.3 [FILE] Section
[FILE] section contains information about files.
ReportTemplateFileName=<templatefilename>
This setting specifies the name of the report template file. <templatefilename>
value is the name and path of the report template file. The file path can be a
relative path or an absolute path. If it is a relative path, the base path is the
path of the PTR file.
ReportFileName=<reportfilename>
This setting specifies the name of the report file. <reportfilename> value is the
name and path of the report file. The file path can be a relative path or an
- 76 -
absolute path. If it is a relative path, the base path is the path of the PTR file. In
<reportfilename>, you can use parameters.
ReportFileType=<reportfiletype>
This setting specifies the type of the report file. <reportfiletype> value is the
name or value of the file format. For example, ppSaveAsRTF or 6. What file
format PTReportCom supports is dependent on your Microsoft PowerPoint.
LogFileName=<logfilename>
This setting specifies the name of the log file. <logfilename> value is the name
and path of the log file. The file path can be a relative path or an absolute path.
If it is a relative path, the base path is the path of the PTR file. In <logfilename>,
you can use parameters.
6.2.4 [PARAMETER] Section
[PARAMETER] section contains information about parameters.
Name1=<name1>
Name2=<name2>
……
Name10=<name10>
These settings specify the names of the parameters. Name1 specify the name
of the first parameter, Name2 specifies the name of the second parameter.…..
You can define up to 10 parameters in one PTR file.
Title1=<title1>
Title2=<title2>
- 77 -
……
Title10=<title10>
These settings specify the titles of the parameters. Title1 specifies the title of
the first parameter. Title2 specifies the title of the second parameter……
Default1=<default1>
Default2=<default2>
……
Default10=<default10>
These settings specify the default values of the parameters. Default1 specifies
the default value of the first parameter. Default2 specifies the default value of
the second parameter.…..
6.3 Function Reference
6.3.1 Fixed Table Report
Uses FixTableReport method to generate a fixed table report. In a fixed table
report, the number of rows and columns is fixed. PTReportCom executes a
SQL statement to get data from data source, and directly fills data into the cells
of a table.
Syntax
Report(…)
sqlstatement
Arguments
TYPE = “fix”
SLIDE = slide
TABLE = table
FILLORDER = fillorder
- 78 -
CELL= celllist
RANGE = range
IMAGE = fieldlist
CONNECT = datasource
The TYPE argument specifies the report type. "fix" means a fixed table report.
The SLIDE argument identifies a slide in the report template. The slide is the
index number of the slide. The index number starts at 1. If the index number is
less than 0, it represents the position from the end of presentation. For
examples, slide 2 is the second slide in a presentation, slide -1 is the last slide
in a presentation. You can also reference a slide dynamically. “N” means the
next slide. “N-1” means the last slide that the previous function processed.
The TABLE argument identifies a table in a slide for a table report. The table is
the index number of the table in a slide. The index number starts at 1. For
examples, table 1 is the first table in a slide, table 2 is the second table. Default
is 1.
The FILLORDER argument specifies the order in which PTReportCom fill data.
Possible values are row or col. "row" means to fill data by rows, and "col"
means to fill data by columns. Default is row.
The CELL argument specifies the positions where data values will be inserted.
The celllist is the list of cells separated by the “,” character. For example,
“A2,B2,B3,D2,D3”. The cells in the celllist should correspond to the data
source fields in the SQL statement. The value of the first field is put into the
first cell, and the value of the second field is put into the second cell ……
PTReportCom will use the next cell if you omit a cell except the first cell. If
FILLORDER=“row”, the next cell is the right cell. If FILLORDER=“col”, the next
cell is the below cell.
The RANGE argument specifies the range in the table to be used for the
records. PTReportCom will skip the range for each record. You can reference
- 79 -
a range of cells like “2:4” or “B:D”. The default range is the area that includes
all cells for the records.
The IMAGE argument specifies the data source fields are picture files. The
fieldlist is the list of data source fields separated by the “,” character. You can
identify a field using the name of field or the index number of field, but not
simultaneously. In data source, you stored the path and file name of the picture,
not the picture. The file path can be a relative path, an absolute path or a URL.
If it is a relative path, the base path is the path of the report template file.
The CONNECT argument specifies the connection to a data source. The
CONNECT can takes a string that expresses a data source name or a number
that expresses a data source index. The index number of data source is the
sequential number defined in the PTR file, and starts at 1. The default implies
the first data source.
The sqlstatement is a SQL statement such as a SELECT statement.
Example
This example uses Fixed Table Report function to make the report “Top 5
Employees for Sales”.
@F1=REPORT(slide=5 type=fix cell=B2)
SELECT TOP 5 e.FirstName + ' ' + e.LastName
, SUM(d.Quantity)
, Sum(d.UnitPrice * d.Quantity * (1-d.Discount)) AS SalesAmount
, SalesAmount / (SELECT amount FROM tmp_amount)
FROM Orders o
,OrderDetails d
,Products p
,Employees e
WHERE o.OrderID = d.OrderID
- 80 -
AND d.ProductID = p.ProductID
AND o.EmployeeID = e.EmployeeID
AND YEAR(o.OrderDate) = 1996
AND MONTH(o.OrderDate) = 04
GROUP BY e.FirstName, e.LastName
ORDER BY 3 DESC
6.3.2 Variable Table Report
Uses VarTableReport method to generate a variable table report. In a variable
table report, the number of rows or columns in the table is unfixed, and it is
variable as the number of the result records. PTReportCom executes a SQL
statement to get data from data source, inserts some blank rows/columns or
insert new slide for some records, then fills data into the cells of a table.
Syntax
Report(…)
sqlstatement
Arguments
TYPE = “var”
SLIDE = slide
TABLE = table
FILLORDER = fillorder
CELL= celllist
RANGE = range
IMAGE = fieldlist
RESERVE = reserverecords
PAGEBREAK = pagelength
- 81 -
NODATA = nodataoption
CONNECT = datasource
The TYPE argument specifies the report type. "var" means a variable table
report. Default is var.
The SLIDE argument identifies a slide in the report template. The slide is the
index number of the slide. The index number starts at 1. If the index number is
less than 0, it represents the position from the end of presentation. For
examples, slide 2 is the second slide in a presentation, slide -1 is the last slide
in a presentation. You can also reference a slide dynamically. “N” means the
next slide. “N-1” means the last slide that the previous function processed.
The TABLE argument identifies a table in a slide for a table report. The table is
the index number of the table in a slide. The index number starts at 1. For
examples, table 1 is the first table in a slide, table 2 is the second table. Default
is 1.
The FILLORDER argument specifies the order in which PTReportCom fill data.
Possible values are row or col. "row" means to fill data by rows, and "col"
means to fill data by columns. Default is row.
The CELL argument specifies the positions where data values will be inserted.
The celllist is the list of cells separated by the “,” character. For example,
“A2,B2,B3,D2,D3”. The cells in the celllist should correspond to the data
source fields in the SQL statement. The value of the first field is put into the
first cell, and the value of the second field is put into the second cell ……
PTReportCom will use the next cell if you omit a cell except the first cell. If
FILLORDER=“row”, the next cell is the right cell. If FILLORDER=“col”, the next
cell is the below cell.
The RANGE argument specifies the range in the table to be used for the
records. A range is composed of some rows or columns. You can reference a
range of cells like “2:4” or “B:D”. PTReportCom will insert some rows/columns
- 82 -
for each record, or copy slides for some records. If the length of the range is 1
row/column, you need to reserve 1 or 2 rows/columns in one slide. Otherwise
you must reserve all blank rows/columns for records in one slide. The default
range is the area that includes all cells for the records.
The IMAGE argument specifies the fields are picture files. The fieldlist is the
list of data source fields separated by the “,” character. You can identify a field
using the name of field or the index number of field, but not simultaneously. In
data source, you stored the path and file name of the picture, not the picture.
The file path can be a relative path, an absolute path or a URL. If it is a relative
path, the base path is the path of the report template file.
The RESERVE argument specifies the number of the records for which you
reserved some rows/columns in the report template for the report. The
reserverecords represents the number of the records you reserved in the
report template. One means you reserved some rows/columns for one record,
and two means some rows/columns for two records. Default is 1. If the length
of the range is 1 row/column, you need to reserve 1 or 2 rows/columns in one
slide. Otherwise the value of RESERVE must be equal to the value of
PAGEBREAK.
The PAGEBREAK argument specifies the page breaks, and tells
PTReportCom to insert new pages in the report. One page is one slide. The
unit of page length is r that means record. For example, “6r” or “6” means that
PTReportCom will put 6 records per slide. Default is no page break. If the
length of the range is more than 1, the value of PAGEBREAK must be equal to
the value of RESERVE.
The NODATA argument specifies an option when no data are returned from
data source. If the value is "delrange", PTReportCom will delete the range
when no data are returned. "deltable" means to delete the table. "delslide"
means to delete the slide. Default is to do nothing.
- 83 -
The CONNECT argument specifies the connection to a data source. The
CONNECT can takes a string that expresses a data source name or a number
that expresses a data source index. The index number of data source is the
sequential number defined in the PTR file, and starts at 1. The default implies
the first data source.
The sqlstatement is a SQL statement such as a SELECT statement.
Example
This example uses Variable Table Report function to make the report
“Customer List”.
@F1=Report(slide=2 type=var cell=A2 pagebreak=19 reserve=2)
SELECT CompanyName
,CityName
,CountryName
,ContactName
FROM Customers, Cities, Countries
WHERE Customers.CityCode = Cities.CityCode
AND Customers.CountryCode = Cities.CountryCode
AND Customers.CountryCode = Countries.CountryCode
ORDER BY CompanyName,CityName,CountryName
6.3.3 Group Table Report
Uses GroupTableReport method to generate a variable table report and group
data. In a variable table report, the number of rows or columns in the table is
unfixed, and it is variable as the number of the result records. PTReportCom
executes a SQL statement to get data from data source, copy the group range
for each group, copy the detail range for each record, then fills data into the
table.
- 84 -
Syntax
Report(…)
sqlstatement
Arguments
TYPE = “var”
SLIDE = slide
TABLE = table
FILLORDER = fillorder
CELL= celllist
RANGE = range
GROUP= grouplist
GROUPRANGE = grouprange
IMAGE = fieldlist
RESERVE = reserverecords
PAGEBREAK = pagelength
NODATA = nodataoption
CONNECT = datasource
The TYPE argument specifies the report type. "var" means a variable table
report. Default is var.
The SLIDE argument identifies a slide in the report template. The slide is the
index number of the slide. The index number starts at 1. If the index number is
less than 0, it represents the position from the end of presentation. For
examples, slide 2 is the second slide in a presentation, slide -1 is the last slide
in a presentation. You can also reference a slide dynamically. “N” means the
next slide. “N-1” means the last slide that the previous function processed.
The TABLE argument identifies a table in a slide for a table report. The table is
the index number of the table in a slide. The index number starts at 1. For
- 85 -
examples, table 1 is the first table in a slide, table 2 is the second table. Default
is 1.
The FILLORDER argument specifies the order in which PTReportCom fill data.
Possible values are row or col. "row" means to fill data by rows, and "col"
means to fill data by columns. Default is row.
The CELL argument specifies the positions where data values will be inserted.
The celllist is the list of cells separated by the “,” character. For example,
“A2,B2,B3,D2,D3”. The cells in the celllist should correspond to the data
source fields in the SQL statement. The value of the first field is put into the
first cell, and the value of the second field is put into the second cell ……
PTReportCom will use the next cell if you omit a cell except the first cell. If
FILLORDER=“row”, the next cell is the right cell. If FILLORDER=“col”, the next
cell is the below cell.
The RANGE argument specifies the range in the table to be used for the
details. A range is composed of some rows or columns. You can reference a
range of cells like “2:4” or “B:D”. PTReportCom will insert some rows/columns
for each record, or copy slides for some records. If the length of the range is 1
row/column, you need to reserve 1 or 2 rows/columns in one slide. Otherwise
you must reserve all blank rows/columns for records in one slide. The default
range is the area that includes all cells for the records.
The GROUP argument specifies the group of the report. The grouplist is the
list of data source fields separated by the “,” character. You can identify a field
using the name or index number of the field, but not simultaneously. In one
report, there may be up to 10 groups. Notes: the order of the groups should be
in accordance with the order of the ORDER BY clause in the SQL statement.
The GROUPRANGE argument follows the GROUP argument, and specifies
the range of the group in the table. For example, the grouprange of level 1
must follow the group of level 1, and the grouprange of level 2 must follow the
- 86 -
group of level 2. PTReportCom will repeat the group range for each group. The
range of the group should contain the range of the details and the area that
includes all cells for this group. You reference a group range like “2:4” or “B:D”.
For example, there are two groups, the range of the group one contains all
cells for the group one and the range of the group two, and the range of the
group two contains all cells for the group two and the range of the details. The
default range is the area that includes all cells for this group and the range or
group range for the lower level group. If the grouprange is not same as the
range of the detail, you must add a pagebreak by group, and the length of the
range can not be more then 1 row/column.
The IMAGE argument specifies the fields are picture files. The fieldlist is the
list of data source fields separated by the “,” character. You can identify a field
using the name of field or the index number of field, but not simultaneously. In
data source, you stored the path and file name of the picture, not the picture.
The file path can be a relative path, an absolute path or a URL. If it is a relative
path, the base path is the path of the report template file.
The RESERVE argument specifies the number of the records for which you
reserved some rows/columns in the report template for the report. The
reserverecords represents the number of the records you reserved in the
report template. One means you reserved some rows/columns for one record,
and two means some rows/columns for two records. Default is 1. If the length
of the range is 1 row/column, you need to reserve 1 or 2 rows/columns in one
slide. Otherwise the value of RESERVE must be equal to the value of
PAGEBREAK.
The PAGEBREAK argument specifies the page breaks, and tells
PTReportCom to insert new pages in the report. One page is one slide. The
unit of page length is r or g. "r" means record, "g1" means group one, "g2"
means group two...... For example, “6r” or “6” means that PTReportCom will
- 87 -
put 6 records per slide, “1g” means one group per slide, and “1g,6r” means one
group or 6 records per slide. Default PTReportCom will not show the group
name in the new page. You can add “s” to show them. For example, “1gs,6rs”.
If the grouprange is not same as the range of the detail, you must add a
pagebreak by group, and the length of the range can not be more then 1
row/column. If the grouprange is same as the range of the detail, and the
length of the range is more than 1, you should add a pagebreak by record, and
the value of PAGEBREAK must be equal to the value of RESERVE.
The NODATA argument specifies an option when no data are returned from
data source. If the value is "delrange", PTReportCom will delete the range
when no data are returned. "deltable" means to delete the table. "delslide"
means to delete the slide. Default is to do nothing.
The CONNECT argument specifies the connection to a data source. The
CONNECT can takes a string that expresses a data source name or a number
that expresses a data source index. The index number of data source is the
sequential number defined in the PTR file, and starts at 1. The default implies
the first data source.
The sqlstatement is a SQL statement such as a SELECT statement.
Example
This example uses Group Table Report function to make the report “Customer
Profile”.
@F1=Report(slide=2 cell=A2,B3,C3,D3,D4,E3,E4,E5
range=2:5 group=1 pagebreak=5 reserve=5)
SELECT LEFT(CompanyName,1)
,CompanyName
,ContactName
,'Phone: ' & Phone
- 88 -
,'Fax: ' & Fax
,Address
,CityName & ', ' & CountryName
,PostalCode
FROM Customers, Cities, Countries
WHERE Customers.CityCode = Cities.CityCode
AND Customers.CountryCode = Cities.CountryCode
AND Customers.CountryCode = Countries.CountryCode
ORDER BY CompanyName
6.3.4 Form Report
Uses FormReport method to generate a form report and group data. For a
form report, you can put data from data source into shapes or text boxes in the
report file. PTReportCom gets data from a recordset object, copy the slide for
each record.
Syntax
Report(…)
sqlstatement
Arguments
TYPE = “form”
SLIDE = slide
CELL= celllist
GROUP= grouplist
IMAGE = fieldlist
NODATA = nodataoption
CONNECT = datasource
The TYPE argument specifies the report type. "form" means a form report.
- 89 -
The SLIDE argument identifies a slide in the report template. The slide is the
index number of the slide. The index number starts at 1. If the index number is
less than 0, it represents the position from the end of presentation. For
examples, slide 2 is the second slide in a presentation, slide -1 is the last slide
in a presentation. You can also reference a slide dynamically. “N” means the
next slide. “N-1” means the last slide that the previous function processed.
The CELL argument specifies the positions where data values will be inserted.
The celllist is the list of shapes or text boxes separated by the “,” character. For
example, “ProductName,ProductID,QuantityPerUnit,UnitPrice”. The shapes or
text boxes in the celllist should correspond to the data source fields in the SQL
statement. The value of the first data source field is put into the first object as a
text, and the value of the second data source field is put into the second
object……You can get the name of the shape or text box using the add-in
“name.ppa”.
The GROUP argument specifies the group of the report. The grouplist is the
list of data source fields separated by the “,” character. You can identify a field
using the name of field or the index number of field, but not simultaneously. In
one report, there may be up to 10 groups. The first GROUP is group one, the
second is group two...... Notes: the order of groups should be in accordance
with the order of ORDER BY clause in the SQL statement.
The IMAGE argument specifies the fields are picture files. The fieldlist is the
list of data source fields separated by the “,” character. You can identify a field
using the name of field or the index number of field, but not simultaneously. In
data source, you stored the path and file name of the picture, not the picture.
The file path can be a relative path, an absolute path or a URL. If it is a relative
path, the base path is the path of the report template file.
The NODATA argument specifies an option when no data are returned from
data source. If the value is "delrange" or “delslide”, PTReportCom will delete
- 90 -
the slide when no data are returned. Default is to do nothing.
The CONNECT argument specifies the connection to a data source. The
CONNECT can takes a string that expresses a data source name or a number
that expresses a data source index. The index number of data source is the
sequential number defined in the PTR file, and starts at 1. The default implies
the first data source.
The sqlstatement is a SQL statement such as a SELECT statement.
Remarks
In FormReport method, there is no Range and PageBreak. It will put only one
record per slide.
Example
This example uses Form Report function to make the report “Supplier Profile”.
@F1=Report(slide=2 type=form cell=SlideTitle,Company,ContactName
,ContactTitle,Address,City,Country,PostCode,Phone,Fax,HomePage)
SELECT CompanyName
,CompanyName
,ContactName
,ContactTitle
,Address
,CityName
,CountryName
,PostalCode
,Phone
,Fax
,HomePage
FROM Suppliers, Countries, Cities
WHERE Suppliers.CityCode = Cities.CityCode
- 91 -
AND Suppliers.CountryCode = Cities.CountryCode
AND Suppliers.CountryCode = Countries.CountryCode
ORDER BY CompanyName
6.3.5 MSGraph Chart
Uses MSGraphChart method to generate a chart. PTReportCom gets data
from a recordset object, and fills data into the datasheet of a chart in the report
file.
Syntax
Chart(…)
sqlstatement
Arguments
SLIDE = slide
CHART = chart
FILLORDER = fillorder
CELL= celllist
RANGE = range
CONNECT = datasource
The SLIDE argument identifies a slide in the report template. The slide is the
index number of the slide. The index number starts at 1. If the index number is
less than 0, it represents the position from the end of presentation. For
examples, slide 2 is the second slide in a presentation, slide -1 is the last slide
in a presentation. You can also reference a slide dynamically. “N” means the
next slide. “N-1” means the last slide that the previous function processed.
The CHART argument identifies a chart in the report template. The chart is the
index number of the chart in the slide. The index number starts at 1. For
examples, chart 2 is the second chart in the slide.
The FILLORDER argument specifies the order in which PTReportCom fill data.
- 92 -
Possible values are row or col. "row" means to fill data by rows, and "col"
means to fill data by columns. Default is col.
The CELL argument specifies the positions where data values will be inserted.
The celllist is the list of cells separated by the “,” character. For example,
“A2,B2,B3,D2,D3”. The cells in the celllist should correspond to the data
source fields in the SQL statement. The value of the first field is put into the
first cell, and the value of the second field is put into the second cell ……
PTReportCom will use the next cell if you omit a cell except the first cell. If
FILLORDER=“row”, the next cell is the right cell. If FILLORDER=“col”, the next
cell is the below cell. Note: On the datasheet, the leftmost column and the top
row, which are commonly used for legend text or axis labels, are referred to as
column 0 (zero) and row 0 (zero).
The RANGE argument specifies the range in the datasheet of the chart to be
used for the records. PTReportCom will skip the rows/columns of the range for
each record. A range is composed of some rows or columns. You can
reference a range of cells like “2:4” or “B:D”. The default range is the area that
includes all cells for the records.
The CONNECT argument specifies the connection to a data source. The
CONNECT can takes a string that expresses a data source name or a number
that expresses a data source index. The index number of data source is the
sequential number defined in the PTR file, and starts at 1. The default implies
the first data source.
The sqlstatement is a SQL statement such as a SELECT statement.
Example
This example uses Chart function to make the chart “Sales by Categories”.
@F3_3=CHART(slide=3 cell=A0)
SELECT c.CategoryName
, Sum(d.UnitPrice * d.Quantity * (1-d.Discount))
- 93 -
FROM Orders o
,OrderDetails d
,Products p
,Categories c
WHERE o.OrderID = d.OrderID
AND d.ProductID = p.ProductID
AND p.CategoryID = c.CategoryID
AND YEAR(o.OrderDate) = 1996
AND MONTH(o.OrderDate) = 04
GROUP BY c.CategoryName
ORDER BY c.CategoryName
6.3.6 ExcelChart
Uses ExcelChart method to generate a chart. PTReportCom gets data from a
recordset object, and fills data into the worksheet of a chart in the report file.
Syntax
Chart(…)
sqlstatement
Arguments
SLIDE = slide
CHART = chart
TYPE = type
FILLORDER = fillorder
CELL= celllist
RANGE = range
CONNECT = datasource
The SLIDE argument identifies a slide in the report template. The slide is the
index number of the slide. The index number starts at 1. If the index number is
- 94 -
less than 0, it represents the position from the end of presentation. For
examples, slide 2 is the second slide in a presentation, slide -1 is the last slide
in a presentation. You can also reference a slide dynamically. “N” means the
next slide. “N-1” means the last slide that the previous function processed.
The CHART argument identifies a chart in the report template. The chart is the
index number of the chart in the slide. The index number starts at 1. For
examples, chart 2 is the second chart in the slide.
The TYPE argument specifies the report type. Possible values are fix or var.
"fix" means that PTReportCom will directly fill data vales into the worksheet of
the chart. "var" means that PTReportCom will add some blank rows/columns
before filling data values into the worksheet of the chart. Default is var. When
the report type is “var”, you should reserve two rows/columns in the worksheet
in the report template, and set the data range of the chart to 2 rows/columns.
The RESERVE must be 2.
The FILLORDER argument specifies the order in which PTReportCom fill data.
Possible values are row or col. "row" means to fill data by rows, and "col"
means to fill data by columns. Default is row.
The CELL argument specifies the positions where data values will be inserted.
The celllist is the list of cells separated by the “,” character. For example,
“A2,B2,B3,D2,D3”. The cells in the celllist should correspond to the data
source fields in the SQL statement. The value of the first field is put into the
first cell, and the value of the second field is put into the second cell ……
PTReportCom will use the next cell if you omit a cell except the first cell. If
FILLORDER=“row”, the next cell is the right cell. If FILLORDER=“col”, the next
cell is the below cell.
The RANGE argument specifies the range in the datasheet of the chart to be
used for the records. PTReportCom will skip the rows/columns of the range for
each record. A range is composed of some rows or columns. You can
- 95 -
reference a range of cells like “2:4” or “B:D”. The default range is the area that
includes all cells for the records.
The CONNECT argument specifies the connection to a data source. The
CONNECT can takes a string that expresses a data source name or a number
that expresses a data source index. The index number of data source is the
sequential number defined in the PTR file, and starts at 1. The default implies
the first data source.
The sqlstatement is a SQL statement such as a SELECT statement.
Example
This example uses Chart function to make the chart “Sales by Categories”.
@F3_3=CHART(slide=3 cell=A2)
SELECT c.CategoryName
, Sum(d.UnitPrice * d.Quantity * (1-d.Discount))
FROM Orders o
,OrderDetails d
,Products p
,Categories c
WHERE o.OrderID = d.OrderID
AND d.ProductID = p.ProductID
AND p.CategoryID = c.CategoryID
AND YEAR(o.OrderDate) = 1996
AND MONTH(o.OrderDate) = 04
GROUP BY c.CategoryName
ORDER BY c.CategoryName
6.3.7 ExecSQL
Executes a SQL statement, but no data is returned to the report.
Syntax
- 96 -
ExecSQL(…)
sqlstatement
Arguments
CONNECT= datasource
The CONNECT argument specifies the connection to a data source. The
CONNECT can takes a string that expresses a data source name or a number
that expresses a data source index. The index number of data source is the
sequential number defined in the PTR file, and starts at 1. The default implies
the first data source.
The sqlstatement is a SQL statement that can be DDL (Data Definition
Language), DML (Data Manipulation Language) and even DCL (Data Control
Language).
Using EXECSQL function, you can open a database, create a temporary table,
insert data into a temporary table, update data, execute a stored procedure,
and drop a table. It is very useful to create a temporary table, and prepare data
for REPORT function.
Example
This example uses ExecSQL functions to create a table tmp0, and add some
records into the table. No result is returned to the report.
@F1=EXECSQL()
CREATE TABLE tmp0 (
min_date DATE,
max_date DATE)
;
@F2=EXECSQL()
INSERT INTO tmp0
SELECT …
- 97 -
Chapter 7 Advanced Reports
7.1 Executing multiple SQL statements
In one report building process, PTReportCom can execute multiple SQL
statements. This enables you to
1. Create a report like building block. You may divide one report into several
parts, and respectively use the different SQL statements to make each part of
the report. You can use the different queries to get the data located in the
different tables or databases.
2. Create a complex report using the temporary table. First, you create a
temporary table. Second, use several SQL statements to prepare data in the
temporary table. You can execute INSERT, UPDATE, DELETE, INSERT
SELECT statements. And then put the prepared data from the temporary table
into your report.
3. Create one report file with several reports. For example, you may create one
presentation with several tables.
Example
This example executes multiple SQL statements to create a report.
1. Create the template in Microsoft PowerPoint.
- 98 -
2. Write SQL statements in a PTR file.
/*********************************************************
Compare with Last Month by Categories
*********************************************************/
/* Calculate the total in the current month */
@F8_1=REPORT(slide=8 type=fix cell=B4)
SELECT SUM(d.Quantity)
, Sum(d.UnitPrice * d.Quantity * (1-d.Discount))
FROM Orders o
,OrderDetails d
,Products p
WHERE o.OrderID = d.OrderID
- 99 -
AND d.ProductID = p.ProductID
AND YEAR(o.OrderDate) = YEAR('1996-04-01')
AND MONTH(o.OrderDate) = MONTH('1996-04-01')
/* Calculate the total in the last month */
@F8_2=REPORT(slide=8 type=fix cell=D4)
SELECT SUM(d.Quantity)
, Sum(d.UnitPrice * d.Quantity * (1-d.Discount))
FROM Orders o
,OrderDetails d
,Products p
WHERE o.OrderID = d.OrderID
AND d.ProductID = p.ProductID
AND o.OrderDate >= DateAdd('m',-1,#1996-04-01#)
AND o.OrderDate < #1996-04-01#
/* Drop table tmp_category_sales */
@F8_3=EXECSQL()
DROP TABLE tmp_category_sales
/* Create table tmp_category_sales */
@F8_4=EXECSQL()
CREATE TABLE tmp_category_sales (
CategoryID INTEGER,
Quantity INTEGER,
Amount MONEY
)
- 100 -
/* Get the sales amount by categories in the current month */
@F8_5=EXECSQL()
INSERT INTO tmp_category_sales (CategoryID, Quantity, Amount)
SELECT p.CategoryID
, SUM(d.Quantity)
, Sum(d.UnitPrice * d.Quantity * (1-d.Discount))
FROM Orders o
,OrderDetails d
,Products p
WHERE o.OrderID = d.OrderID
AND d.ProductID = p.ProductID
AND YEAR(o.OrderDate) = YEAR('1996-04-01')
AND MONTH(o.OrderDate) = MONTH('1996-04-01')
GROUP BY p.CategoryID
/* Show the sales amount by categories in the current month */
@F8_6=REPORT(slide=8 type=var cell=A3)
SELECT c.CategoryName
, IIF(IsNull(t.Quantity),0,t.Quantity)
, IIF(IsNull(t.Amount),0,t.Amount)
FROM Categories c LEFT JOIN tmp_category_sales t
ON c.CategoryID = t.CategoryID
ORDER BY c.CategoryName
/* Delete from table tmp_category_sales */
@F8_7=EXECSQL()
DELETE FROM tmp_category_sales
- 101 -
/* Get the sales amount by categories in the last month */
@F8_8=EXECSQL()
INSERT INTO tmp_category_sales (CategoryID, Quantity, Amount)
SELECT p.CategoryID
, SUM(d.Quantity)
, Sum(d.UnitPrice * d.Quantity * (1-d.Discount))
FROM Orders o
,OrderDetails d
,Products p
WHERE o.OrderID = d.OrderID
AND d.ProductID = p.ProductID
AND o.OrderDate >= DateAdd('m',-1,#1996-04-01#)
AND o.OrderDate < #1996-04-01#
GROUP BY p.CategoryID
/* Show the sales amount by categories in the last month */
@F8_9=REPORT(slide=8 type=fix cell=D3)
SELECT IIF(IsNull(t.Quantity),0,t.Quantity)
, IIF(IsNull(t.Amount),0,t.Amount)
FROM Categories c LEFT JOIN tmp_category_sales t
ON c.CategoryID = t.CategoryID
ORDER BY c.CategoryName
3. Generate the report.
- 102 -
7.2 Sorting, Grouping and Totaling
7.2.1 Sorting data
Sorting means placing data in some kind of order to help you find and evaluate
it. For example, you may want to have a customer list sorted alphabetically by
name or by country.
To sort your data, you may use SQL. Use the ORDER BY clause to have your
results displayed in a sorted order.
SELECT EmployeeID
,LastName
,FirstName
,HireDate
- 103 -
FROM Employees
ORDER BY HireDate; /* ascending sort */
In the example above, results will come back in ascending order by hire date.
To explicitly specify ascending or descending order, add ASC or DESC, to the
end of your ORDER BY clause. The following is an example of a descending
order sort.
ORDER BY HireDate DESC;
/* descending sort */
7.2.2 Totaling
You can sum the values, count all the values or only those values that are
distinct from one another, and determine the maximum, minimum, average. To
add totals, you can use aggregate functions in SQL statement, such as
COUNT, SUM, AVG, MAX, MIN.
1. In the fixed table report, you can add a total directly using a separate SQL.
2. In the variable table report, you must add the total first using a Fixed Table
report function before you use the Variable Table report function. Because the
cell address of the total field will change after you use Variable Table report
function.
7.2.3 Grouping data and Subreports
Grouped data is data that is sorted and broken up into meaningful groups. In a
customer list, for example, a group might consist of all those customers living
in the same Region.
To group data in a report, you should use GROUP TABLE REPORT function.
For more detail information, refer to “GroupTableReport Method” and “Group
Table Report” in this document.
Using the feature of grouping data, you can make subreports within a report. A
subreport would typically be used to perform one-to-many lookups such as
- 104 -
Customer / Order / OrderDetails.
To make sub reports within the main report,
1. Write a JOIN SQL statement to access data from two or more tables. For
example, you can join Customers, Orders and OrderDetails tables.
2. Use GROUP TABLE REPORT function.
For more detail information, refer to the samples customer_profile.ptr,
product_catalog.ptr and sales_detail.ptr within PTReportCom.
7.2.4 Subtotaling
A subtotal is a summary that totals or sums numeric values in a group. You
can sum the values in each group, count all the values in each group, and
determine the maximum, minimum, average in each group. For example,
determine the total sales per sales representative in a sales report.
To add subtotals, you can use aggregate functions in SQL statement.
1. Use aggregate function and GROUP BY clause, get summary data for each
group, and insert results into a temporary table.
2. If you have the different kinds of summaries, repeat the step 1, and insert
results into another temporary table.
3. Use group table report function, and join the detail data and the summary
data using JOIN. The summary fields must be included in the group list.
4. Except for sub-totals, you can add total too using aggregate function in SQL
statement. You must add total first using a Fixed Table report function before
you use the Variable Table report function. Because the cell address of the
total field will change after you use Variable Table report function.
For more detail information, please refer to the samples sales_detail.ptr within
PTReportCom.
- 105 -
7.3 Pictures
7.3.1 Inserting pictures into a report template
To make eye-catching reports, you can add pictures to your reports. You can
directly insert pictures into the report template in Microsoft PowerPoint. For
example, you want to display a logo in your report. You can insert the logo
graphics file into the report template. For more information about adding
pictures to a presentation, refer to Microsoft PowerPoint Help.
7.3.2 Inserting pictures into a report
Except for inserting the static pictures during report design, you may insert
pictures during report building process. PTReportCom can put the graphics
files into the report, and support all graphics file format that Microsoft
PowerPoint support.
To insert pictures into a report using PTReportCom, you should do as follows:
1. Store the paths and names of the graphics files in the database
You store the paths and names of the picture files in database, do not store the
pictures. The file path can be a relative path, an absolute path or a URL. For
example, you store "images\emp1.jpg" in Photo field.
2. Specify the size in the report template
To specify the size, you should write a formatting expression in the report
template file. For a table report, you write a formatting expression in the cell.
For a form report, you write a formatting expression in the shape or text box.
PTReportCom will get the formatting expression, and insert a picture into the
report according to the instruction in the format expression.
3. Write the report function in a PTR file, and identify the image fields using the
IMAGE argument. For example,
- 106 -
@F1=Report(slide=1 ... image=photo)
4. Use PTReportCom to generate report with pictures
PTReportCom will submit the SQL statement and get the data from database,
read the graphics files according to the paths and names, and insert them into
the report. If the path and file name of the picture is “”, PTReportCom will
return “”. PTReportCom will return “#Error” if it does not find the file of the
picture.
For more detail information about pictures, refer to the samples
employee_profile.ptr, product_catalog.ptr within PTReportCom.
- 107 -
Chapter 8 Hints and Tips
You can run PPTReport.exe in command line. The format is:
pptreport <ptr file name> [-d] [-u1 user1] [-p1 pwd1] … [pa1 pa2 …]
For example:
pptreport c:\pptreport\monthlysales.ptr 199605
PPTReport.exe can be scheduled with Windows Scheduled Tasks or other
tools. The process of generating reports can be fully automated, periodically or
on events.
PTReportCom comes with a sample database, VB sample programs, VBA
sample programs and sample reports. You can use them when learning the
program. To use the samples, you must add a data source named “Report
Sample” to specify the sample database.
To make a report template, you can use some sample data. It is very useful
especially for formatting. After you have made the report template, you delete
the sample data.
For a table report, you can format the value from data sources with a format
expression. You should write a format expression into a data cell in the report
template file first. PTReportCom will get the text of the cell as a format
expression before it puts a value into a cell, and output the value using the
format expression.
For a form report, you can format the value from data sources with a format
expression. You should write a format expression into the shape or text box in
- 108 -
the report template file first. PTReportCom will get the format expression
before it puts a value into a shape or text box, and output the value using the
format expression.
You can define the different formats and colors for positive values, negative
values and zeros.
An irregular table does not have the same number of cells for each row or
column. It does make it harder to process the presentation. In an irregular table,
you have some difficulty to reference a cell, and an error may occur when you
try to work with some rows or columns.
For a form report, you can reference a shape or text box by its name. You can
find a PowerPoint add-in “name.ppa” under the PTReportCom's working
directory that can name an object in a slide.
To create a chart in the report template file, you can use some sample data.
Using sample data, you can set the various chart options. After you have made
the report template, you delete the sample data.
For MSGraph chart, on the datasheet, the leftmost column and the top row,
which are commonly used for legend text or axis labels, are referred to as
column 0 (zero) and row 0 (zero).
By default, Microsoft PowerPoint 2007 uses Microsoft Excel to create charts,
but doesn't expose the chart as a normal Excel object. PTReportCom can not
access the charts. You must insert an Excel chart object that PTReportCom
can access.
- 109 -
PTReportCom is a converter too. Besides Microsoft PowerPoint document,
you can generate a report in other file format such as HTML, RTF, GIF, JPG
and BMP. You can also convert data from database to other file format.
You can edit a PTR file (.ptr) with a text editor such as Notepad.
In a PTR file, for the report template file, report file and log file, it is possible to
give a relative path. If it is a relative path, the base path is the path of the PTR
file.
In a PTR file, you can use parameters in the SQL statements. To use
parameters, you must define them first.
In a PTR file, you can use parameters in the paths and names of the report file,
template file and log file. To use parameters, you must define them first.
You should be careful to define a unique name for each parameter, because
PTReportCom will replace all strings that are the same as the names of the
parameters. It is a good choice a name begins with the “$” character such as
“$ReportDate”.
If you get some errors when you run PPTReport.exe, you can check the
default log file “PPTReport.log” under the PTReportCom program directory. If
you do not define the log file in the PTR file, or can not create the log file
defined, you can find log information in the PPTReport.log.
In the [SQL] section in the PTR file, you can use comments. A comment is the
- 110 -
“/*” characters, followed by any sequence of characters (including new lines),
followed by the “*/” characters. You cannot nest comments.
You can reference a slide dynamically. “N” means the next slide. “N-1” means
the last slide that the previous function processed.
To add totals or subtotals, you can use the aggregate functions in SQL
statement.
To group data in a report, you should use GroupTableReport method, and
Group Table Report function.
In Group Table Report function or Form Report function in the PTR file, the
order of groups should be in accordance with the order of ORDER BY clause
in the SQL statement.
For a variable table report, if the length of the range is 1 row/column, you need
to reserve 1 or 2 rows/columns. PTReportCom will insert some rows/columns
for each record. If the length of the range is more than 1 row/column, you
should add PAGEBREAK argument, and the value of PAGEBREAK must be
equal to the value of RESERVE. PTReportCom will copy some slides.
If the grouprange is not same as the range of the detail, you must add a
pagebreak by group, and the length of the range can not be more then 1
row/column. If the grouprange is same as the range of the detail, and the
length of the range is more than 1, you should add a pagebreak by record, and
the value of PAGEBREAK must be equal to the value of RESERVE.
- 111 -
You can create reports with pictures using PTReportCom. You should store
the path and name of the graphics file in the database, identify the image fields
in the report function, and specify the size in the report template file.
To convert from pixels to points, it is depend on the screen resolution (DPI). If
you have a 96 dpi screen (Windows PC), 4 pixels are equal to 3 points.
It is very useful to create a temporary table. You can prepare data using
INSERT/UPDATE/DELETE/INSERT SELECT, and then make a report using
REPORT function.
You can write a program to make a PTR file using C, perl or DOS shell, and
then run PPTReport.exe to generate report. The two steps can be written into
a batch file.
PTReportCom supports Microsoft PowerPoint 2007. You can use pptx file as
report file and template file. Please copy “pconv2007.cfg” to “pconv.cfg”.
- 112 -
Chapter 9 Format Expressions
For a cell, shape or text box in which data are got from data source, you can
set the format using a format expression. PTReportCom gets the text from the
cell, shape or text, and outputs the result using it as the format expression. In
fact, PTReportCom calls the format function in Visual Basic. For more
information about format, refer to Format Function in Visual Basic for
Applications Reference.
A.1 Formats for Numeric Values
A user-defined format expression for numbers can have from one to four
sections separated by semicolons. If the format argument contains one of the
named numeric formats, only one section is allowed.
If you use
The result is
One section only
The format expression applies to all values.
Two sections
The first section applies to positive values and zeros, the
second to negative values.
Three sections
The first section applies to positive values, the second to
negative values, and the third to zeros.
Four sections
The first section applies to positive values, the second to
negative values, the third to zeros, and the fourth to Null
values.
The following example has two sections: the first defines the format for positive
values and zeros; the second section defines the format for negative values.
"$#,##0;($#,##0)"
If you include semicolons with nothing between them, the missing section is
printed using the format of the positive value. For example, the following format
- 113 -
displays positive and negative values using the format in the first section and
displays "Zero" if the value is zero.
"$#,##0;;\Z\e\r\o"
The following table identifies characters you can use to create user-defined
number formats:
Character
Description
None
Display the number with no formatting.
(0)
Digit placeholder. Display a digit or a zero. If the expression
has a digit in the position where the 0 appears in the format
string, display it; otherwise, display a zero in that position.
If the number has fewer digits than there are zeros (on either
side of the decimal) in the format expression, display leading
or trailing zeros. If the number has more digits to the right of
the decimal separator than there are zeros to the right of the
decimal separator in the format expression, round the number
to as many decimal places as there are zeros. If the number
has more digits to the left of the decimal separator than there
are zeros to the left of the decimal separator in the format
expression, display the extra digits without modification.
(#)
Digit placeholder. Display a digit or nothing. If the expression
has a digit in the position where the # appears in the format
string, display it; otherwise, display nothing in that position.
This symbol works like the 0 digit placeholder, except that
leading and trailing zeros aren't displayed if the number has
the same or fewer digits than there are # characters on either
side of the decimal separator in the format expression.
(.)
Decimal placeholder. In some locales, a comma is used as
the decimal separator. The decimal placeholder determines
- 114 -
how many digits are displayed to the left and right of the
decimal separator. If the format expression contains only
number signs to the left of this symbol, numbers smaller than
1 begin with a decimal separator. To display a leading zero
displayed with fractional numbers, use 0 as the first digit
placeholder to the left of the decimal separator. The actual
character used as a decimal placeholder in the formatted
output depends on the Number Format recognized by your
system.
(%)
Percentage placeholder. The expression is multiplied by 100.
The percent character (%) is inserted in the position where it
appears in the format string.
(,)
Thousand separator. In some locales, a period is used as a
thousand separator. The thousand separator separates
thousands from hundreds within a number that has four or
more places to the left of the decimal separator. Standard use
of the thousand separator is specified if the format contains a
thousand separator surrounded by digit placeholders (0 or #).
Two adjacent thousand separators or a thousand separator
immediately to the left of the decimal separator (whether or
not a decimal is specified) means "scale the number by
dividing it by 1000, rounding as needed." For example, you
can use the format string "##0,," to represent 100 million as
100. Numbers smaller than 1 million are displayed as 0. Two
adjacent thousand separators in any position other than
immediately to the left of the decimal separator are treated
simply as specifying the use of a thousand separator. The
actual character used as the thousand separator in the
- 115 -
formatted output depends on the Number Format recognized
by your system.
(:)
Time separator. In some locales, other characters may be
used to represent the time separator. The time separator
separates hours, minutes, and seconds when time values are
formatted. The actual character used as the time separator in
formatted output is determined by your system settings.
(/)
Date separator. In some locales, other characters may be
used to represent the date separator. The date separator
separates the day, month, and year when date values are
formatted. The actual character used as the date separator in
formatted output is determined by your system settings.
(E- E+ e- e+)
Scientific format. If the format expression contains at least
one digit placeholder (0 or #) to the right of E-, E+, e-, or e+,
the number is displayed in scientific format and E or e is
inserted between the number and its exponent. The number
of digit placeholders to the right determines the number of
digits in the exponent. Use E- or e- to place a minus sign next
to negative exponents. Use E+ or e+ to place a minus sign
next to negative exponents and a plus sign next to positive
exponents.
-+$()
Display a literal character. To display a character other than
one of those listed, precede it with a backslash (\) or enclose
it in double quotation marks (" ").
(\)
Display the next character in the format string. To display a
character that has special meaning as a literal character,
precede it with a backslash (\). The backslash itself isn't
displayed. Using a backslash is the same as enclosing the
- 116 -
next character in double quotation marks. To display a
backslash, use two backslashes (\\).
Examples of characters that can't be displayed as literal
characters are the date-formatting and time-formatting
characters (a, c, d, h, m, n, p, q, s, t, w, y, / and :), the
numeric-formatting characters (#, 0, %, E, e, comma, and
period), and the string-formatting characters (@, &, <, >,
and !).
("ABC")
Display the string inside the double quotation marks (" "). To
include a string in format from within code, you must use
Chr(34) to enclose the text (34 is the character code for a
quotation mark (")).
A.2 Formats for String Values
A format expression for strings can have one section or two sections separated
by a semicolon (;).
If you use
The result is
One section only
The format applies to all string data.
Two sections
The first section applies to string data, the second to Null
values and zero-length strings ("").
You can use any of the following characters to create a format expression for
strings:
Character
Description
@
Character placeholder. Display a character or a space. If the
string has a character in the position where the at symbol (@)
appears in the format string, display it; otherwise, display a
space in that position. Placeholders are filled from right to left
- 117 -
unless there is an exclamation point character (!) in the format
string.
&
Character placeholder. Display a character or nothing. If the
string has a character in the position where the ampersand (&)
appears, display it; otherwise, display nothing. Placeholders are
filled from right to left unless there is an exclamation point
character (!) in the format string.
<
Force lowercase. Display all characters in lowercase format.
>
Force uppercase. Display all characters in uppercase format.
!
Force left to right fill of placeholders. The default is to fill
placeholders from right to left.
A.3 Formats for Date/Time Values
The following table identifies characters you can use to create user-defined
date/time formats:
Character
Description
(:)
Time separator. In some locales, other characters may be used
to represent the time separator. The time separator separates
hours, minutes, and seconds when time values are formatted.
The actual character used as the time separator in formatted
output is determined by your system settings.
(/)
Date separator. In some locales, other characters may be used
to represent the date separator. The date separator separates
the day, month, and year when date values are formatted. The
actual character used as the date separator in formatted output
is determined by your system settings.
c
Display the date as ddddd and display the time as ttttt, in that
- 118 -
order. Display only date information if there is no fractional part
to the date serial number; display only time information if there is
no integer portion.
d
Display the day as a number without a leading zero (1 – 31).
dd
Display the day as a number with a leading zero (01 – 31).
ddd
Display the day as an abbreviation (Sun – Sat).
dddd
Display the day as a full name (Sunday – Saturday).
ddddd
Display the date as a complete date (including day, month, and
year), formatted according to your system's short date format
setting. The default short date format is m/d/yy.
dddddd
Display a date serial number as a complete date (including day,
month, and year) formatted according to the long date setting
recognized by your system. The default long date format is
mmmm dd, yyyy.
aaaa
The same as dddd, only it's the localized version of the string.
w
Display the day of the week as a number (1 for Sunday through 7
for Saturday).
ww
Display the week of the year as a number (1 – 54).
m
Display the month as a number without a leading zero (1 – 12). If
m immediately follows h or hh, the minute rather than the month
is displayed.
mm
Display the month as a number with a leading zero (01 – 12). If m
immediately follows h or hh, the minute rather than the month is
displayed.
mmm
Display the month as an abbreviation (Jan – Dec).
mmmm
Display the month as a full month name (January – December).
oooo
The same as mmmm, only it's the localized version of the string.
- 119 -
q
Display the quarter of the year as a number (1 – 4).
y
Display the day of the year as a number (1 – 366).
yy
Display the year as a 2-digit number (00 – 99).
yyyy
Display the year as a 4-digit number (100 – 9999).
h
Display the hour as a number without leading zeros (0 – 23).
Hh
Display the hour as a number with leading zeros (00 – 23).
N
Display the minute as a number without leading zeros (0 – 59).
Nn
Display the minute as a number with leading zeros (00 – 59).
S
Display the second as a number without leading zeros (0 – 59).
Ss
Display the second as a number with leading zeros (00 – 59).
ttttt
Display a time as a complete time (including hour, minute, and
second), formatted using the time separator defined by the time
format recognized by your system. A leading zero is displayed if
the leading zero option is selected and the time is before 10:00
A.M. or P.M. The default time format is h:mm:ss.
AM/PM
Use the 12-hour clock and display an uppercase AM with any
hour before noon; display an uppercase PM with any hour
between noon and 11:59 P.M.
am/pm
Use the 12-hour clock and display a lowercase AM with any hour
before noon; display a lowercase PM with any hour between
noon and 11:59 P.M.
A/P
Use the 12-hour clock and display an uppercase A with any hour
before noon; display an uppercase P with any hour between
noon and 11:59 P.M.
a/p
Use the 12-hour clock and display a lowercase A with any hour
before noon; display a lowercase P with any hour between noon
and 11:59 P.M.
- 120 -
AMPM
Use the 12-hour clock and display the AM string literal as defined
by your system with any hour before noon; display the PM string
literal as defined by your system with any hour between noon
and 11:59 P.M. AMPM can be either uppercase or lowercase,
but the case of the string displayed matches the string as defined
by your system settings. The default format is AM/PM.
- 121 -
Chapter 10 License and Support
10.1 License
Your Agreement to This License
You should carefully read the following terms and conditions before using,
installing, copying, or distributing this software. Your use, installation, copying,
or distribution of PTReportCom indicates your acceptance of this agreement
("License").
NO WARRANTY
PTReportCom IS DISTRIBUTED "AS IS". NO WARRANTY OF ANY KIND IS
EXPRESSED OR IMPLIED. THE AUTHOR WILL NOT BE LIABLE FOR DATA
LOSS, DAMAGES, LOSS OF PROFITS OR ANY OTHER KIND OF LOSS
WHILE USING OR MISUSING THIS SOFTWARE.
Evaluation License
PTReportCom is not free software. You may use this software for evaluation
purposes without charge for a period of 30 days. If you use this software after
the 30 day evaluation period, you must purchase it.
You may copy the evaluation version of this software and documentation as
you wish, and give exact copies of the original evaluation version to anyone,
and distribute the evaluation version of the software and documentation in its
unmodified form via electronic means. You are specifically prohibited from
charging, or requesting donations without permission from the author.
- 122 -
Developer License
The software is licensed per developer. This means that each developer using
the software needs one license. The developer may use the software on one
or more computers. You may develop your application that bundles or makes
use of the software directly/indirectly. You can not use the software to build
competitive products of any kind, like PTReportGen.
You may not resell, rent, lease, sub-license or distribute the software alone.
The software must be distributed as a component of an application and
bundled with an application or with the application's installation files. You may
distribute royalty-free the run-time files of the software with your applications.
You need to duly inform your customers that they are not allowed to use the
software independently from your application.
10.2 Technical Support
If you encounter any problems in usage of PTReportCom, and need the
technical support:
Go to our support web site at:
http://www.ljzsoft.com/support.htm
Send email to [email protected]
- 123 -