1
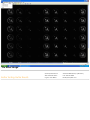
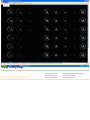
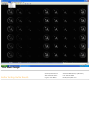
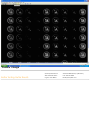
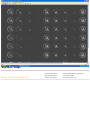
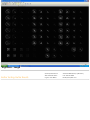
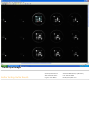
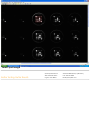
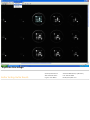
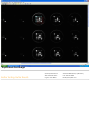
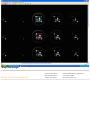
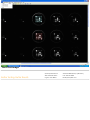
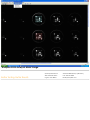
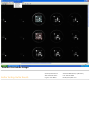
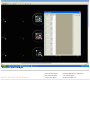
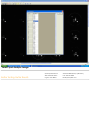
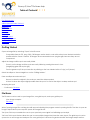
Quansy Q-View™ Software Help
Table of Contents
Get Started Now. . .
Abbreviated Software Protocol
Analyze Spots
Brightness
Create a Grid
File Menu
Filters Menu
Gamma
Getting Started
Image Scaling Menu
Multiplex ELISA Menu
Tools Menu
Getting Started
Open an image file by selecting "Open" in the file menu.
Compatible formats: Tiff, Jpeg, CR2. CR2 images are the best to work with as they have the best resolution
possible with the Canon Camera. Tiff images are recommended over Jpeg images, because they are not
compressed.
Adjust the image until the spots are easily visible
Zoom in on the image until the spots are easily visible by pressing the zoom in icon
(magnifying glass with a plus sign).
Turn the gamma up if the spots are dim by clicking on the icon labeled with a G+(up) or G-(down).
Select the ellipse or the rectangle icon on the "Editing toolbar."
Draw an ellipse around each spot
Be sure to draw the objects in the order you want the data exported.
It is best to draw the object slightly smaller then the spots. Do not let the object overlap another spot.
Analyzing the spots
. . . Continue to File Menu
File Menu
The File Menu can be used to open image files, save grid layouts, and open grid layouts.
View image example:
File Menu
When Opening Image Files a dialog box will appear indicating the progress made in opening the file. The time to open an
image is dependent upon computer speed and image file size.
The Open Grid Layout enables the user to open previously saved grids for facilitating spot analysis.
The Save Grid Layout feature allows the user to scan multiple images that share the same layout. The grids layout can be
opened on a new image and analyzed. The save grid layout is discussed in greater detail in the image analysis section.
. . . Continue to Image Scaling Menu
Image Scaling Menu
The Image Scaling menu is used to scale the image to any size once the image has been loaded. It can be used to view
one enlarged section of the imge or to scale the ientire image down so it can be viewed entirely on one canvas.
View image example:
Image Scaling
Zoom Page adjusts the image to fit into one page.
The Zoom In command increased the image size on the monitor while
the Zoom Out command decreases the image size on the monitor.
. . . Continue to Filters Menu
Filters Menu
The Filters Menu contains features that enhance the users's ability to enhance the image to make viewing responses easier.
While these tools visibly alter what is observed on the monitor the data output is independent of Gamma or Brightness
settings and will be unaltered.
View image example:
Filters Menu
Gamma+
GammaBrightness+
Brightness. . . Continue to Tools Menu
Gamma
Gamma+. Gamma Increase. Increasing the gamma allows you to make the image brighter. In the case of microarray
images it lets you look at the wells and spots which are dull and not visible when the image is first loaded.
View image example:
Gamma +
Gamma-. Gamma Decrease. This acts as the opposit of the gamma plus and decreases the gamma of the image by a
certain pre-fixed amount. Since its the exact opposite of Gamma+ one application of the gamma plus filter can be offset
by one application of the Gamma- filter and vice versa.
View image example:
Gamma -
Brightness
Brightness+. Increase Brightness. Increasing the brightness of the image increases the values of all pixels in the image by the
same uniform scaling factor. This makes darker images easier to view.
View image example:
Brightness +
Brightness-. Brightness Decrease. This makes the images darker by reducing all the pixels in the iamge by the same uniform
scaling amount. Since this is the exact opposit of the Brightness+ feature, one application of the Brightness+ can be
cancelled out by one application of the Brightness- and vice versa.
View image example:
Brightness -
Tools Menu
The Tools Menu contains options used for assay analysis.
The Ellipse Tool enables the user to select spots for analysis. The size of this ellipse can be altered by using the increase or
decrease spot size commands.
After clicking the ellipse command in the tools menu the cursor should change from an arrow to an ellipse.
Place the cursor over the spots desired for analysis and click the left mouse button. The spot is selected for
subsequent analysis.
View image example:
Selected Spot
The Rectangle Tool is provided for the analysis of Western immunoblots.
. . . Continue to Create a Grid.
Create a Grid
After clicking the Ellipse Command in the tools menu the cursor should change from an arrow to an ellipse. Place the
cursor over the spots desired for analysis and click the left mouse button. The spot is selected for subsequent analysis.
View image example:
Create Spot
After selecting the desired number of spots in a well click on the Select Tool Icon in the toolbar and highlight the selected
spots. The selected spots will turn red once highlighted.
View image example:
Select Spots
These spots can be copied by pressing the letter "P" on the keyboard or the Duplicate Grids command in the Multiplex ELISA
Analysis menu.
View image example:
Duplicate Grid
The new grids will be pasted onto the image and will be pasted ready for manipulation in red.
View image example:
Duplicate Grid
Press and hold the shift key which commands the software to highlight all selected ellipses. Drag the Grid onto a new well.
View image example:
Drag Grid
By clicking on the Save Grid Layout in the file menu the series of ellipses can be saved for use on other images.
View image example:
Save Grid
. . . Continue to Multiplex ELISA Analysis Menu .
Multiplex ELISA Analysis Menu
The Multiplex ELISA Analysis Menu contains features for spot analysis.
View image example:
Multiplex ELISA Analysis Menu
The Analyze Spots command directs the software to analyze the spots in the area circled by the user.
The Duplicate Grid copies and pastes a replicate of the selected ellipses.
The Delete Grid allows the user to delete all selected (red) ellipse
The Delete All Labels allows the user to deleted the labels placed onto each spot by the software flowing analysis so the
user can match the Spot ID with the spot on the image.
View image example:
Delete Grid Labels
. . . Continue to Analyze Spots.
Analyze Spots
The Analyze Spots command directs the software to analyze the spots in the areas circled by the user.
View image example:
Analyze Spots
The software will then analyze the selected spots for pixel intensity in the order that the ellipses were drawn.
View image example:
Select Spot Analysis
Data can be pasted into a spreadsheet for further organization and analysis. Select one cell with the spot value, press
Select All (Ctrl+A), then Copy (Ctrl+C) and Paste (Ctrl+V) into your spreadsheet.
View image example:
Copy All Results
. . . Continue to Abbreviated Software Protocol.
Abbreviated Software Protocol
Load the image desired for analysis.
Size the image as desired.
Click the Ellipse Tool icon.
Encircle the desired spot with the icon and click to mark for analysis.
Repeat for all desired spots.
Click the Analyze Spots icon.
Copy and paste the data into favored spreadsheet.
Better Testing. Better Results
Quansys Biosciences
365 North 600 West
Logan, Utah 84321
Toll Free: 888-Quansys (782-6797)
Fax: 435-750-6869
[email protected]
File Menu Image
Better Testing. Better Results
Quansys Biosciences
365 North 600 West
Logan, Utah 84321
Toll Free: 888-Quansys (782-6797)
Fax: 435-750-6869
[email protected]
Image Scaling Image
Better Testing. Better Results
Quansys Biosciences
365 North 600 West
Logan, Utah 84321
Toll Free: 888-Quansys (782-6797)
Fax: 435-750-6869
[email protected]
Filter Menu Image
Better Testing. Better Results
Quansys Biosciences
365 North 600 West
Logan, Utah 84321
Toll Free: 888-Quansys (782-6797)
Fax: 435-750-6869
[email protected]
Gamma + Image
Better Testing. Better Results
Quansys Biosciences
365 North 600 West
Logan, Utah 84321
Toll Free: 888-Quansys (782-6797)
Fax: 435-750-6869
[email protected]
Gamma - Image
Better Testing. Better Results
Quansys Biosciences
365 North 600 West
Logan, Utah 84321
Toll Free: 888-Quansys (782-6797)
Fax: 435-750-6869
[email protected]
Brightness + Image
Better Testing. Better Results
Quansys Biosciences
365 North 600 West
Logan, Utah 84321
Toll Free: 888-Quansys (782-6797)
Fax: 435-750-6869
[email protected]
Brightness - Image
Better Testing. Better Results
Quansys Biosciences
365 North 600 West
Logan, Utah 84321
Toll Free: 888-Quansys (782-6797)
Fax: 435-750-6869
[email protected]
Selected Spot Image
Better Testing. Better Results
Quansys Biosciences
365 North 600 West
Logan, Utah 84321
Toll Free: 888-Quansys (782-6797)
Fax: 435-750-6869
[email protected]
Create Spot Image
Better Testing. Better Results
Quansys Biosciences
365 North 600 West
Logan, Utah 84321
Toll Free: 888-Quansys (782-6797)
Fax: 435-750-6869
[email protected]
Select Spot Image
Better Testing. Better Results
Quansys Biosciences
365 North 600 West
Logan, Utah 84321
Toll Free: 888-Quansys (782-6797)
Fax: 435-750-6869
[email protected]
Duplicate Grid Image
Better Testing. Better Results
Quansys Biosciences
365 North 600 West
Logan, Utah 84321
Toll Free: 888-Quansys (782-6797)
Fax: 435-750-6869
[email protected]
Duplicated Grid Image
Better Testing. Better Results
Quansys Biosciences
365 North 600 West
Logan, Utah 84321
Toll Free: 888-Quansys (782-6797)
Fax: 435-750-6869
[email protected]
Drag Grid Image
Better Testing. Better Results
Quansys Biosciences
365 North 600 West
Logan, Utah 84321
Toll Free: 888-Quansys (782-6797)
Fax: 435-750-6869
[email protected]
Save Grid Image
Better Testing. Better Results
Quansys Biosciences
365 North 600 West
Logan, Utah 84321
Toll Free: 888-Quansys (782-6797)
Fax: 435-750-6869
[email protected]
Multiplex ELISA Analysis Menu Image
Better Testing. Better Results
Quansys Biosciences
365 North 600 West
Logan, Utah 84321
Toll Free: 888-Quansys (782-6797)
Fax: 435-750-6869
[email protected]
Deleted Grid Labels Image
Better Testing. Better Results
Quansys Biosciences
365 North 600 West
Logan, Utah 84321
Toll Free: 888-Quansys (782-6797)
Fax: 435-750-6869
[email protected]
Analyze Spots Image
Better Testing. Better Results
Quansys Biosciences
365 North 600 West
Logan, Utah 84321
Toll Free: 888-Quansys (782-6797)
Fax: 435-750-6869
[email protected]
Select Spot Analysis Image
Better Testing. Better Results
Quansys Biosciences
365 North 600 West
Logan, Utah 84321
Toll Free: 888-Quansys (782-6797)
Fax: 435-750-6869
[email protected]
Copy All Results Image
Better Testing. Better Results
Quansys Biosciences
365 North 600 West
Logan, Utah 84321
Toll Free: 888-Quansys (782-6797)
Fax: 435-750-6869
[email protected]