1
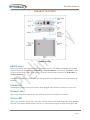
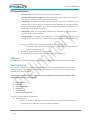
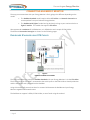
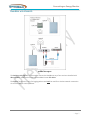
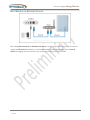
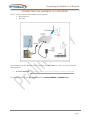
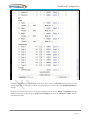
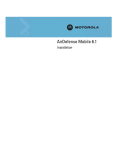
DashBox™ DashBox™ User’s Manual Document Code: DBX-MAN Ver 1.0 2013-06-10 ©Copyright Brultech Research Inc. 2013 DashBox Package Contents TABLE OF CONTENTS DashBox Package Contents .......................................................................................... 2 DashBox Standard:................................................................................................................................... 2 DashBox with Zigbee®: ............................................................................................................................ 2 Optional Accessories:............................................................................................................................... 2 DashBox Features ........................................................................................................ 3 Main Features ........................................................................................... Error! Bookmark not defined. COM1 and COM2: .................................................................................................................................... 3 USB Jack: .................................................................................................................................................. 3 Status LED: ............................................................................................................................................... 3 PB Switch: ................................................................................................................................................ 4 Connecting an Energy Monitor ..................................................................................... 6 Dashboard Standard using STS Cables..................................................................................................... 6 DashBox with Zigbee®: ............................................................................................................................ 7 Both Models via Network Cables:............................................................................................................ 8 Connecting the DashBox to A Network ........................................................................ 9 Finding the DashBox on the Network ......................................................................... 10 Configuring the Energy Monitor: ................................................................................ 11 Dashboard Configuration ........................................................................................... 12 Step 1 - Initial Settings and Admin Account Creation............................................................................ 12 Step 2 – Login to access the Settings Menu .......................................................................................... 13 Step 3 – Accessing the Settings section ................................................................................................. 14 Step 4 – Connecting your Energy Monitor ............................................................................................ 15 Step 5 – Setting up your Energy Monitor .............................................................................................. 17 Network Settings....................................................................................................... 20 Page 1 DashBox Package Contents DashBox™ DASHBOX PACKAGE CONTENTS The following lists the contents of each DashBox package: DASHBOX STANDARD: 1 DashBox 1 5V Wall Transformer OPTIONAL ACCESSORIES: STS (Serial-to-Stereo) cable. Page 2 DASHBOX WITH ZIGBEE®: 1 DashBox. 1 External Antenna. 1 5V Wall Transformer. DashBox Features DASHBOX FEATURES Figure 1 DashBox Overview RS-232 JACKS Figure 1 (1) and (2) shows the two RS-232 communication ports. The COM1 and COM2 ports are both used to connect the DashBox to an ECM-1240 or a GreenEye Monitor. An optional “STS Cable” is used to connect from these 3.5mm stereo jacks to the serial communication terminal of an ECM-1240 or a GreenEye Monitor. The two RS-232 COM ports allows up to two energy monitors to independently communicate with the DashBox. POWER JACK The DashBox is powered via a 5V DC power supply plugged into the barrel jack shown in Figure 1 (3). ETHERNET JACK Figure 1 (4) shows the location of the “RJ-45” Ethernet jack for connection to a network. STATUS LED Figure 1 (5) shows the “Status LED”. This LED is used to indicate various operating states of the DashBox. This LED is also used to indicate which “Function” to select when using the function switch Figure 1(8). Page 3 DashBox Features LED Operating Status “Green (solid)” The DashBox is fully powered and operational “Red (brief flash while solid green)” Under normal operating conditions this indicates that a packet is being received from the Energy Monitor “Red (Solid)” The DashBox is powering up and charging up the “Super Capacitors”. This could take from a few seconds to a couple of minutes depending on the length of time the DB has been powered down. If this occurs during normal operating conditions, this would indicate a fault with the system “Red (Flash)” Under normal operating conditions this indicates that a packet is being received from the Energy Monitor “Orange (Solid)” The DashBox “Super Capacitors” are charged up and the system is now booting up. This occurs after the “solid red LED” sequence when the DB is powered up booting, the LED will stay orange while the power backup is charging. i. The power backup provides enough time for a safe shutdown of the DashBox in case of a power outage. The LED will flash red upon receiving a packet. The LED will flash various colours upon initiating a switch sequence. USB JACK: The USB Jack on the DashBox is reserved for an optional WiFi USB to provide wireless networking. FUNCTION SWITCH: The “Function PB Switch” is a push-button (PB) switch which is recessed below the surface of the DashBox’s bottom. Something small enough to reach the button; such as, a pen tip or paper clip is required to activate this switch. To activate the switch briefly press and release the recessed push switch under the DashBox. After releasing there will be an LED sequence: LED red briefly LED green LED orange briefly LED green LED off briefly back to normal operation There are 3 options within the sequence: 1. Reboot DashBox. When the LED turns red, press then release the switch. Afterwards, the LED will turn green and the DashBox will jump into its reboot sequence. Page 4 DashBox Features 2. Reset Network Settings When the LED turns orange, press then release the switch. The network settings will be set to our defaults and the reboot process described above will start. 3. Reset Dashboard Administration User/Pass. When the LED is clear press then release the switch. The DashBox will reset the administration password to the following: - Username: admin - Password: pass1 Page 5 Connecting an Energy Monitor CONNECTING AN ENERGY MONITOR The way you communicate with your Energy Monitor is likely going to be different depending on the model. The DashBox Standard model requires either STS cables or a Network Connection to receive packets from your Brultech Energy Monitor. The DashBox with Zigbee® model can log wirelessly as long as your monitor also has a Zigbee® module. This model also supports STS cables. We recommend a maximum of 2 GEM devices, or 1 GEM device and a couple of ECM-1240s. The different Connection Strategies are shown on the following pages. DASHBOARD STANDARD USING STS CABLES Figure 2 DashBox Standard via STS Cables The recommended way to setup the DashBox Standard with your Energy Monitors is via the STS cables. The 3-wire end of the STS cable is connected to the serial inputs on the ECM-1240 or GreenEye Monitor and the stereo jack end is plugged into the DashBox. Using this method will ensure that there’s a constant link between the DashBox and your Energy Monitors regardless of network status. The DashBox can support 2 GEMs, 2 ECM-1240s, or one of each using this method. Page 6 Connecting an Energy Monitor DASHBOX WITH ZIGBEE®: Figure 3 DashBox with Zigbee® The DashBox with Zigbee® can be used to connect the DashBox to any of our monitors installed with XBee modules. Additional monitors can be added via our STS cables. The Zigbee® connection is only for logging packets and can’t be used for a wireless network connection via our EtherBee or similar products. Page 7 Connecting an Energy Monitor BOTH MODELS VIA NETWORK CABLES: Figure 4 Both the DashBox Standard and DashBox with Zigbee® can also support packets through the network using the HTTP protocols available on each Energy Monitor. The DashBox must be given a Static IP address for logging over the network as any IP change will interrupt the flow of data. Page 8 Connecting the DashBox to A Network CONNECTING THE DASHBOX TO A NETWORK There’s 2 ways to connect the DashBox to your network: 1. Wired Ethernet. 2. WiFi USB: Figure 5 The DashBox optionally supports a WiFi connection via a WiFi USB stick. We’ve currently tested the following sticks: TP-Link TL-WN721N (http://www.tp-link.com/ca/products/details/?model=TL-WN721N) The DashBox only supports WiFi USB sticks from the Atheros AR9001 and AR9002 family. Page 9 Finding the DashBox on the Network FINDING THE DASHBOX ON THE NETWORK Finding your DashBox on your Network initially depends on your communication scenario. If you’re using Ethernet: The DashBox is set to DHCP so your router will automatically assign it an IP address. You can then log-in to your Router and locate the DashBox in the list of DHCP clients. Optionally, in our GreenEye Setup software, we provide a tool that does a basic scan over your entire network. It will display any IP address on your network that’s running a service over Port 80. You can use this to locate your DashBox by trying the different IP addresses it provides. If you’re using WiFi USB: Make sure you have your WiFi USB stick plugged in before booting the unit, if it isn’t you must unplug the unit, wait for it to power down, plug in the WiFi stick, and reapply power for it detect the USB stick. Once booted, the DashBox is automatically setup to open an Access Point. It will be displayed as “DashBox” on your wireless networks with the default password “brultech”. You can then connect to the DashBox and access the Dashboard at http://192.168.6.1/. From there you can reconfigure your DashBox to your network. Page 10 Configuring the Energy Monitor: CONFIGURING THE ENERGY MONITOR: The DashBox is setup to allow a direct connection to your Energy Monitor using a TCP/IP Client connection. COM1 and Zigbee® can be accessed through your DashBox IP address and Port 8001 COM2 can be accessed through your DashBox IP address and Port 8002 The ECM-1240 can be setup using this method with IA software version 2.50 or higher. TCP/IP client mode was added to the software in version 2.50. The GreenEye Monitors internal Setup Page can be accessed through the DashBox in any web browser using the IP of the DashBox and one of the ports above depending on communication port. Page 11 Dashboard Configuration DASHBOARD CONFIGURATION Once setup, the Dashboard can be accessed by inputting the DashBox’s IP Address into any web browser. STEP 1 - INITIAL SETTINGS AND ADMIN ACCOUNT CREATION Figure 6 The first time you access your DashBox you will be asked to pick a Time zone o All dates are stored in UTC time, thus your Time zone is used to convert times into your local time. Locale o Locale is used for regional settings such as currency symbols and formats. User name Password o Your User name and Password is used for Dashboard Configuration. It’s important to remember this value as it’s required to setup billing rates, energy monitors, dashboards, etc. Page 12 Dashboard Configuration STEP 2 – LOGIN TO ACCESS THE SETTINGS MENU Figure 7 After specifying and creating the information in the first step, you will be redirected to the Dashboard home page. At this point no data is being logged to the system; therefore, everything in the Status Bar will be shown as zero. At this point you’ll want to login to the Settings section. Figure 8 When you click Login, you’ll be prompted for your User Name and Password. These are the values you entered in the first step. Type them in and click Login. Page 13 Dashboard Configuration Figure 9 STEP 3 – ACCESSING THE SETTINGS SECTION Figure 10 Once logged in, Dashboard controls will pop up on the Dashboard home page. Ignore these controls for now as you’ll want to connect your monitor and start logging beforehand. Click Settings in the top menu. Page 14 Dashboard Configuration Figure 11 Energy Monitors is the default page in the Settings section. You’ll want to get your Energy Monitor logging at this point. STEP 4 – CONNECTING YOUR ENERGY MONITOR If you already know your Serial Number, click on Connect a Monitor. If not, you can find your Serial Number by viewing the Raw Data coming into the DashBox. You can do this by clicking System, then Raw Data. The page will open in a new Window. An example of Raw Data coming from the GEM is above. The Serial Number can be seen as 01000010 for our example. An example of Raw Data coming from an ECM-1240 is above. The Serial Number is a combination of the ID number and the Dev number. You take the ID number at the front, and the Dev number at the end, and add 0s in the middle until the Serial Number is 6 digits. The Serial Number in this example is 100044. Page 15 Dashboard Configuration Figure 12 Once you have the Serial Number, input it into the Serial Number text box, select the correct Device Type from the dropdown box, and click Save Device. Page 16 Dashboard Configuration Figure 13 STEP 5 – SETTING UP YOUR ENERGY MONITOR Figure 14 The page will refresh after clicking out of the device creation box, and your Energy Monitor will pop up. Click on Click here to manage to view the channels of your Energy Monitor. Figure 15 On first click, you may see a screen the same as above. Channels are created upon receiving the first packet from the Energy Monitor. Wait a minute then try refreshing the page. If the above screen persists, check the Raw Data page under System to see if any data is coming in. If data is coming in, compare your Serial Number with the Serial Number you have created for your device. If not, recheck the connections for your device and the configuration of your device. Page 17 Dashboard Configuration NOTE: If you’re using our STS cable or Zigbee, for the GEM you must use the Binary GreenEye with Date packet format. For the ECM-1240, you must use the Binary packet format. Figure 16 Page 18 Dashboard Configuration Figure 17 The above example shows the Channel layout for a GEM. Once the Channels populate, you can start configuring them. A description of what each setting does can be found in our DashBox Dashboard manual. Once you get this far you’ll want to verify your readings and set up your Billing and Network settings. When everything is configured go to System, Clear Database and clear the Minute and Hour data to start with fresh data. Page 19 Network Settings NETWORK SETTINGS In most cases, you’ll want to change your Network settings right away. You can do this by logging into the Settings section and using the Network settings in the menu. Figure 18 For Ethernet, you’re likely going to want to define a Static address. A Static address will ensure that you can always access the DashBox from the same IP address. The DHCP and Static values are automatically pulled from the Network settings, the Mask and Gateway are likely not going to change. You can either keep the IP that your router already assigned to the DashBox or input your own IP address within the same range. Figure 19 WiFi can be configured either as a Network connection or an Access Point. In Network mode, select your SSID and input the password for your network. Then either set a static IP or select DHCP. In Access Point mode, define the name of the network and the password you want to use. Upon rebooting, the Access Point will show up on your wireless network lists. Page 20