1
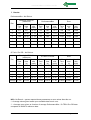
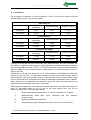
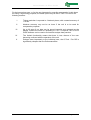
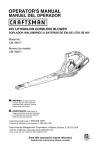
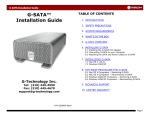
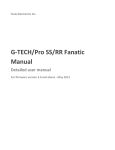
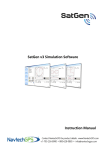
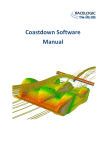
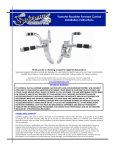
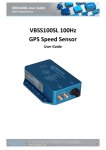
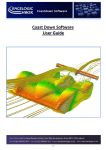
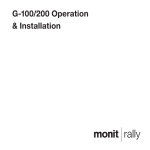
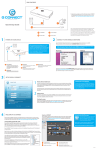
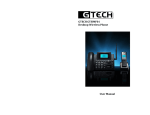
PerformanceBox // G-TECH / Pro RR
TEST REPORT
Comparison of:
Racelogic PerformanceBox Performance Meter
Tesla Electronics Inc. G-TECH / Pro RR Performance Meter
Date of Test: 30 April 2007
Date of Report: 02 May 2007
Test report by: N. Tanner
Issue 1
Page 1 of 19
PerformanceBox // G-TECH / Pro RR
TABLE OF CONTENTS
Title Page
Table of Contents
1.
2.
3.
4.
5.
6.
7.
8.
Purpose of test
Test Equipment
Description of Test Items
Installation
Mode Set-up and Data Presentation
Handling and Usage / Observations
Results
Conclusions
Issue 1
3
3
4
6
8
11
15
17
Page 2 of 19
PerformanceBox // G-TECH / Pro RR
1. Purpose of test
The purpose of this test was to provide a comparison of the 60ft and ¼ mile timings and ¼
mile velocity features of the Racelogic PerformanceBox Performance Meter (hereafter
referred to as “PerformanceBox”) and the Tesla Electronics G-TECH / Pro RR
Performance Meter (hereafter referred to as “G-Tech / Pro RR”), to the following
requirements:
•
•
The test was to be performed over ¼ mile, extracting the 60ft times, the ¼ mile
times and the end velocity at ¼ mile concurrently – 5 runs to be performed.
The test was repeated with the addition of a 1ft rollout (staging) – 5 runs to be
performed.
All other functionality of these units is outside the scope of this particular report.
Please note all observations stated are unbiased and are given in the opinion of the author.
2.
Test Equipment
The test was to be performed using the following:
•
PerformanceBox
Serial number:
Firmware version:
•
3010344
V2.00 Build 29
G-TECH / Pro RR
Serial number: 02-1-1308667489
Firmware version:
4.0.0
•
Racelogic VBOX III 100Hz GPS Datalogger (reference measurement)
Serial number: 030199
Firmware version:
2.09 build 4
The measurements were performed with all three units operational simultaneously.
The host vehicle was 2006 Saab 9-3 1.9TiD and the test was performed at Finmere Mill
Aerodrome, Oxfordshire, UK
Issue 1
Page 3 of 19
PerformanceBox // G-TECH / Pro RR
3. Description of Test Items
PerformanceBox:
The PerformanceBox is a self-contained GPS data logger and performance meter. A 10Hz
fully calibrated GPS engine is used to provide accuracy and precision and the data can be
stored on a removable SD flash card. Real time results are displayed on the back-lit LCD
display and a USB connection allows data to be downloaded to a laptop for further indepth analysis.
Features:
•
•
•
•
•
•
•
Non-contact 10Hz speed and distance measurement using GPS
Internal GPS antenna
Back-lit LCD screen for viewing live data and results
Lateral and longitudinal g-force measurement
SD card slot for use with SD cards
USB interface for reading SD card and upgrading firmware
Full data logging analysis software – “Performance Tools”
Picture of PerformanceBox:
Issue 1
Page 4 of 19
PerformanceBox // G-TECH / Pro RR
G-TECH / Pro RR:
The G-Tech / Pro RR is a self-contained accelerometer-based performance meter. Limited
information on the architecture/ theory of operation of these accelerometers is provided in
the user manual. Real time results are displayed on the back-lit LCD display and a serial
connection allows data to be uploaded to a PC for further in-depth analysis.
Features:
•
•
•
•
•
Triaxial accelerometers covering X, Y and Z orientations.
Back-lit LCD screen for viewing live data and results
Lateral and longitudinal g-force measurement
Serial Interface for uploading run data to PC and upgrading firmware
Performance analysis software – “G-Tech PASS”
Picture of G-Tech Pro RR, showing screen shot of G-Tech PASS perfromance analysis
software
(Note; Picture taken from G-Tech Pro web site www.gtechpro.com)
Issue 1
Page 5 of 19
PerformanceBox // G-TECH / Pro RR
4. Installation
Both units were mounted inside the car, at the bottom centre of the windscreen.
The VBox III and its power supply were placed in the passenger footwell with an external
antenna mounted on the top of the car.
The PerformanceBox was installed to use its internal GPS antenna.
Placement of PerformanceBox and G-TECH / Pro RR
Issue 1
Page 6 of 19
PerformanceBox // G-TECH / Pro RR
Placement of VBox III in passenger footwell
Placement of VBox III external GPS antenna
Issue 1
Page 7 of 19
PerformanceBox // G-TECH / Pro RR
5. Mode Set-up and Data Presentation
To perform the required test as described in section 1, each unit required setting into the
appropriate mode. For the PerformanceBox, this was “Performance Mode” and for the GTECH / Pro RR, this was “Drag Strip Mode”.
5.1
PerformanceBox set-up:
i.
ii.
iii.
iv.
v.
vi.
vii.
5.2
The sample was powered up via the 12VDC Adaptor – the PerformanceBox
logo was displayed along with the unit’s serial number and an audible beep
could be heard to indicate power on.
To set PERFORMANCE MODE, the MODE button was pressed until
PERFORMANCE MODE is displayed. The unit then entered PERFORMANCE
MODE automatically.
Using the ⇑ and ⇓ arrow buttons, the DISTANCE screen was selected.
The required distances of 60 feet and 1320 feet (1/4 mile) were displayed, but
these values can be changed as required by pressing the MENU button and
entering the DISTANCE TESTS MENU.
Next, the rollout setting was checked. This was accessed by pressing MENU
and entering the PERFORMANCE MENU, then using the ⇑ and ⇓ arrow
buttons to highlight 1 FOOT ROLLOUT, then using the OK button to select as
required. (Note: For the first 5 runs the rollout was not required; for the second
set of 5 runs, the rollout was required.)
With the 1 FOOT ROLLOUT selected as required, EXIT was selected to return
to the DISTANCE screen. The PerformanceBox was then ready to make the
required measurements.
The ¼ mile run was performed and the vehicle brought to a halt.
Post ¼ mile run and results display:
i.
ii.
iii.
Issue 1
Post ¼ mile run, the unit displayed the times taken to reach the set parameters
of 60 feet and 1320 feet, plus the velocities at these parameters and the total
number of feet travelled, including the braking period. The run data was
automatically saved to the on-board SD card.
To perform subsequent runs, the vehicle was returned to the start position. The
unit did not re-set the cumulative value of feet travelled despite this being
expected operation. This distance was re-set to 0 feet by pressing and holding
the RESET button for approximately 5 seconds. After this re-set, the unit was
ready to make measurements again.
For retrieval and display of the results post-test, the Performance Tools
software can be used. Additionally, the run data can be saved and viewed
as .txt files. The use of the Performance Tools software and the .txt files
function is outside the scope of this investigation. The run data cannot be
recalled directly to the PerformanceBox display.
Page 8 of 19
PerformanceBox // G-TECH / Pro RR
5.3
G-TECH / Pro RR Set-up:
i.
ii.
iii.
iv.
v.
vi.
vii.
viii.
ix.
x.
xi.
xii.
xiii.
xiv.
Issue 1
The sample was powered up via the 12VDC Adaptor – the bottom right LED
blinked once and initial power up screen showed a digital tachometer,
indicating that the unit was last powered down in the required Drag Strip Mode.
Firstly, the run parameters were checked by pressing the M button to enter the
configuration menu.
Configuration Mode was selected by using the ⇑, ⇓, ⇐, ⇒ button and then
pressing OK.
From the Configuration Mode menu, the “Run Parameters” menu was selected
using the method given in step iii.
In the “Reaction Time” menu, “no tree” was selected as reaction time
measurement was outside the scope of this investigation.
After selecting “no tree”, exit was selected to return to the run “parameters
menu”.
Next, the “Staging/Rollout” menu was selected and the rollout value set to 0
inches (note; for the second round of testing, this value was set to 12 inches).
Next, the “Speed Mark” menu was selected and the speed mark value set to
150mph, to effectively turn the speed mark function off as advised in the user
manual. Note: Speed mark is a function of reaction time and as such is outside
the scope of this investigation.
Next, the “Distance Marks” menu was selected and the 60ft and ¼ mile
distances selected.
When all parameters above were selected, the “Run Parameters” menu was
exited back to the Configuration Mode menu.
From the Configuration Mode menu, Drag Strip Mode was selected to set the
unit into the required mode for test.
From the Simulated Tachometer screen, the next step was to press OK, which
switches to the staging screen. This screen shows the message “staging…”
with an RPM counter and Elapsed Time (E.T.) clock set to 0.000s. This process
ensures that the vehicle is completely stationary.
After about one second, the upper left LED started blinking and the “staging…”
message changed to “Launch when ready.” Indicating that the unit is now
ready to make measurements.
The ¼ mile run was then performed and the vehicle brought to a halt. (Note: in
order to register the run on the G-Tech / Pro RR, the driver is required to
accelerate reasonably briskly to activate the E.T. clock.)
Page 9 of 19
PerformanceBox // G-TECH / Pro RR
5.4
Post ¼ mile run and results display:
i.
ii.
iii.
iv.
v.
vi.
vii.
viii.
Issue 1
Post ¼ mile run, the unit displayed a number of parameters for about 5
seconds and then automatically saved the run to its internal memory. The data
remained displayed.
To perform subsequent runs, the vehicle was returned to the start position. The
unit automatically re-set to Drag strip mode and steps xii to xiv in section 5.3
were repeated.
For retrieval and display of the results post test, “Stored Runs” was selected
from the from the Drag Strip menu.
From the “Stored Runs” menu, “Select a run” was selected.
From the subsequent list of stored runs, the required run was selected.. Note:
runs are stored in [date – ET clock time – speed] format. i.e 04/30/07 17.77481.61 .
From the menu for the selected run, “View this run” was selected to load the
“Run viewing menu”.
The results for the selected run were then chosen from the displayed “Run
viewing menu”.
All stored data can be uploaded to a PC and analysed using G-Tech PASS
software. However this was not required for the purpose of this testing.
Page 10 of 19
PerformanceBox // G-TECH / Pro RR
6. Handling and Usage / Observations
6.1
Physical and Environmental Conditions
PerformanceBox:
Weight:
Dimensions:
Operating Temp.
Storage Temp.
225 grams
113mm x 63mm x 93mm
-20°C to +50°C
-30°C to +80°C
G-TECH / Pro RR:
Weight:
Dimensions:
Operating Temp.
Storage Temp.
6.2
Not Given
Not Given (100mm x 54mm x 40mm approximately)
Not Given
Not Given
Mounting System:
The PerformanceBox uses a mounting system consisting of two sliding parts (to adjust the
mounting angle) connected with tightening bolts on either side (to fix the angle in position).
The mounting system is attached to the vehicle windscreen using three suction cups.
The mounting system for the PerformanceBox is very simple to use and the
PerformanceBox can be mounted in just seconds.
G-TECH / Pro RR mounting system consists of the following parts:
•
•
•
•
•
Suction Cup
Mounting Bracket
Large (Vacuum) Nut
Small (Tensioning) Nut
Mounting Clip
The G-TECH / Pro RR mounting system appears a little complex at first and is a little
awkward to set-up, but once assembled the unit is held very secure.
When mounted, the PerformanceBox mounting system allows for some small movement
of the unit whilst pressing the buttons.
The G-TECH / Pro RR mounting system appears to hold the unit in a more stable position.
Issue 1
Page 11 of 19
PerformanceBox // G-TECH / Pro RR
6.3
Accuracy
The quoted accuracies for velocity, time and distance for each unit are as follows:
PerformanceBox:
Velocity:
+/-0.1km/h
Time:
+/-0.1s
Distance:
+/-0.05%
G-Tech / Pro RR:
Velocity:
+/-0.4mph for 1/4 mile measurement
+/-0.2mph for 0-60mph measurement.
Time:
+/-0.01s
Distance:
Not declared (or, if declared, could not be found).
6.4
Display
PerformanceBox:
44mm x 25mm (approximate measurements) – Green backlit LCD
display with adjustable brightness and contrast.
G-Tech / Pro RR:
53mm x 28mm (approximate measurements) – Orange backlit LCD
display with adjustable contrast only.
Both displays are clear and easy to read.
6.5
Menu System
Both units’ menu systems are easy to navigate around.
PerformanceBox menu is a little more complicated than the G-TECH / Pro RR menu, but
this is expected due to the extra functionality of the PerformanceBox.
6.6
Ease of Use
Both units seem quite easy to use, with user friendly menu options and clear displays.
However the following operational observations were noted:
(see next page)
Issue 1
Page 12 of 19
PerformanceBox // G-TECH / Pro RR
PerformanceBox:
i.
ii.
iii.
iv.
v.
vi.
The PerformanceBox buttons are a soft rubber type and this, combined with
the small amount of movement seen when mounted to the windscreen as
described in section 6.2, sometimes led to one or two “false” button pushes
during the course of the test, whereby a button push was attempted but had to
be re-attempted to achieve the desired state.
Post run, the PerformanceBox was ready to start subsequent runs without any
intervention from the user. However, the distance in feet displayed on the
PerformanceBox from the previous run did not reset for the subsequent runs.
This would not be an issue on a proper ¼ mile drag strip with a lengthy
stopping area, but was a concern when using the Finmere Mill Aerodrome at
higher speeds.
The PerformanceBox could benefit from an audible alarm which sounds when
the desired distance has been reached – this would ensure that the driver is
able to keep his or her eyes on the track. Again, this would be most suited to a
non-professional test track for the same reasons as given in point II, above.
The rollout for the PerformanceBox is not definable by the user, but is set at 1
foot only.
On two occasions, the PerformanceBox either lost power through the DC/DC
adapter, or lost satellite communication leading to aborted runs.
The run data is saved to SD card and can be viewed post-test either by using
the Performance Tools software, or as .txt files.
G-Tech / Pro RR:
i.
ii.
iii.
iv.
v.
vi.
vii.
Issue 1
The M and OK buttons on the G-Tech / Pro RR allow for a definite action, but
the ⇑, ⇓, ⇐ and ⇒ button feels a little loose in the housing.
The G-TECH / Pro RR is quite limited in the distance parameters which can be
selected, with a choice of just 60ft, 1/8 mile and ¼ mile.
The Flashing LED’s to indicate that the selected distance markers have been
reached would be better employed if they latched on for, say, 1s instead of the
very brief flash that they currently give. It is easy to miss this brief flash.
On one occasion, the G-TECH / Pro did not record a full set of data at the end
of the run, possibly due to a poor gear change mid-run which may have made
the unit think that the vehicle was coasting.
The use of the G-Tech Pro / RR is quite limited in comparison to the
PerformanceBox. This limited use is reflected in the price.
The potential to have to re-calibrate the accelerometers could possibly be a
complex process with potential for user error, although the process is described
well in the user manual.
(Note this comment is based purely on opinion from the information give in the
user manual. No actual accelerometer calibration was performed.)
The run data is saved to internal memory and can either be reviewed on the
display, or uploaded to a PC for analysis using the G-TECH PASS software.
Page 13 of 19
PerformanceBox // G-TECH / Pro RR
6.7
Documentation (User guides)
Both user guides are well detailed and appear to contain enough information to enable a
novice user to be able to make the required measurements, with, in both cases, examples
of measurements including screenshots of the units themselves.
The following observations were noted:
The PerformanceBox user manual is 44 pages and is supplied on CD-ROM only, however
a quick start guide is supplied as standard.
The user manual is also available to download via the PerformanceBox web site (see
below).
The user of the PerformanceBox manual is guided via a comprehensive table of contents,
but the manual does not contain an index.
The G-TECH / Pro RR user manual is 148 pages, despite the functionality of the unit being
limited in comparison to the PerformanceBox. The manual is of glued construction which
requires the user to keep a hand on this to prevent it from closing under its own weight.
The manual does, however, contain a full index and a glossary of terminology.
6.8
Cost
The cost of the PerformanceBox is from £311 inc. VAT (2 package options available)
The cost of the G-Tech / Pro RR is $299 (approximately £155 at the time of writing)
As mentioned in section 6.6, it should be noted that the PerformanceBox has considerable
increased functionality over the G-Tech / Pro RR, however, these additional features and
functions are outside the scope of this report. For further information on the full
functionality of these two units, please see their respective user guides and the following
web sites:
www.performancebox.co.uk
www.gtechpro.com
Issue 1
Page 14 of 19
PerformanceBox // G-TECH / Pro RR
7. Results
PeformanceBox - No Rollout:
Run
Racelogic VBOX III
(reference)
60ft
¼ mile V at ¼
Time
time
mile
(s)
(s)
(mph)
PerformanceBox
Error
60ft
Time
(s)
¼ mile
time
(s)
V at ¼
mile
(mph)
60ft
Time
(s)
¼ mile
time
(s)
V at ¼
mile
(mph)
1
3.3
18.7
73.19
3.3
18.7
73.1
0.0
0.0
-0.09
2
3.67
19.29
77.72
3.7
19.3
77.8
+0.03
+0.01
+0.08
3
3.49
18.59
77.14
3.5
18.6
77.1
+0.01
+0.01
-0.04
4
3.19
18.67
76.81
3.2
18.6
76.8
+0.01
-0.07
-0.01
5
3.03
18.05
81.91
3.1
18.1
81.8
+0.07
+0.05
-0.11
Average
3.336
18.660
77.354
3.36
18.66
77.32
0.02**
0.0**
-0.034**
G-Tech / Pro RR – No Rollout:
Run
Racelogic VBOX III
(reference)
60ft
¼ mile V at ¼
Time
time
mile
(s)
(s)
(mph)
G-TECH / Pro RR
Error
60ft
Time
(s)
¼ mile
time
(s)
V at ¼
mile
(mph)
60ft
Time
(s)
¼ mile
time
(s)
V at ¼
mile
(mph)
1
3.3
18.7
73.19
3.493
18.959
73.55
+0.193
+0.259
+0.36
2
3.67
19.29
77.72
3.896
19.621
76.99
+0.226
+0.331
-0.73
3
3.49
18.59
77.14
3.672
18.809
77.39
+0.182
+0.219
+0.25
4
3.19
18.67
76.81
3.389
N/R
N/R
+0.199
N/R
N/R
5
3.03
18.05
81.91
3.271
18.270
81.97
+0.241
+0.22
+0.06
Average
3.336
18.660
77.354
3.544
18.915*
77.48* +0.204** +0.255** +0.126**
N/R = No Result – system reported these parameters as zero values after this run.
* = Average values given based upon available data from 4 runs.
** = Average error given as function of average PerformanceBox / G-TECH Pro RR data
compared to VBOX III reference data.
Issue 1
Page 15 of 19
PerformanceBox // G-TECH / Pro RR
PerformanceBox - With 1ft. Rollout:
Run
Racelogic VBOX III
(reference)
60ft
¼ mile V at ¼
Time
time
mile
(s)
(s)
(mph)
PerformanceBox
Error
60ft
Time
(s)
¼ mile
time
(s)
V at ¼
mile
(mph)
60ft
Time
(s)
¼ mile
time
(s)
V at ¼
mile
(mph)
2.7
17.8
78.9
+0.05
+0.05
+0.05
System re-set
N/C
N/C
N/C
1
2.65
17.75
78.84
2
2.97
18.03
81.20
3
2.81
17.76
81.48
2.8
17.8
81.5
-0.01
-0.01
+0.02
4
2.81
17.83
80.95
2.8
17.8
80.9
-0.01
-0.01
-0.05
5
2.74
N/A
N/A
2.7
17.7
80.7
-0.04
N/A
N/A
Average
2.796
2.75*
17.78*
80.50*
17.843* 80.618*
-0.046** -0.063** -0.118**
G-Tech / Pro RR – with 1 ft. Rollout:
Racelogic VBOX III
(reference)
60ft
¼ mile V at ¼
Time
time
mile
(s)
(s)
(mph)
60ft
Time
(s)
¼ mile
time
(s)
V at ¼
mile
(mph)
60ft
Time
(s)
¼ mile
time
(s)
V at ¼
mile
(mph)
1
2.65
17.75
78.84
2.699
17.823
79.41
+0.049
0.073
+0.57
2
2.97
18.03
81.20
3.006
18.045
80.08
+0.06
+0.015
-1.12
3
2.81
17.76
81.48
2.862
17.774
81.61
+0.052
+0.014
+0.13
4
2.81
17.83
80.95
2.869
17.969
79.93
+0.059
+0.139
-1.02
5
2.74
N/A
N/A
2.781
17.674
80.77
+0.041
N/A
N/A
Average
2.796
2.843
17.857
80.36
Run
17.843* 80.618*
G-TECH / Pro RR
Error
+0.047** +0.014** -0.258**
System re-set = suspect power interruption to PerformanceBox immediately at end of run,
possibly due to 2-way 12VDC adaptor used. Run data not saved.
N/C = Information non- conclusive due to system re-set.
N/A = Information not available – System information incomplete when viewing in VBOX
Tools software.
* = Average values given based upon available data from 4 runs.
** = Average error given as function of average PerformanceBox / G-TECH Pro RR data
compared to VBOX III reference data.
Issue 1
Page 16 of 19
PerformanceBox // G-TECH / Pro RR
8. Conclusions
An at-a-glance comparison of the performance of the 3 units can be made using the
average figures given in the previous tables:
60ft. times (s)
VBOX III
(reference)
PerformanceBox
G-TECH / Pro RR
No rollout
3.336
3.36
3.544
1 ft. Rollout
2.796
2.75*
2.843
¼ mile times (s)
VBOX III
(reference)
PerformanceBox
G-TECH / Pro RR
No rollout
18.660
18.66
18.915*
1 ft. Rollout
17.843*
17.78*
17.857
¼ mile velocity (mph)
VBOX III
(reference)
PerformanceBox
G-TECH / Pro RR
No rollout
77.354
77.32
77.48*
1 ft. Rollout
80.618*
80.50*
80.36
It can be seen that generally the PerformanceBox measurements are more consistent with
the VBOX III reference measurements, which highlights a potential discrepancy between
the PerformanceBox and the G-TECH / Pro RR measurement systems (measurements via
GPS for VBOX III and PerformanceBox; measurements via Accelerometers for the GTECH / Pro RR).
Additionally, it can be seen that using a 1 ft. rollout appears to significantly increase the
accuracy of the G-Tech / Pro RR when compared to this units measurements with no
rollout selected. This could possibly be due to the operation of the accelerometers, which
will not record data from a standing start unless a reasonable acceleration force is applied.
With reference to the applicable user manuals, both units seem generally easy to use
when making the measurements given in this report.
Based upon the respective units’ features and with reference to the tables above and on
page 15, the better choice of unit to use for the more serious user may be the
PerformanceBox due to the following reasons:
I.
Better measurement accuracies at +/-0.1km/h compared to +/-0.4mph.
II.
Measurements made
measurements.
III.
Significant additional functionality.
IV.
No potentially lengthy calibration procedure. Set-up is quick and easy.
were
more
consistent
with
the
reference
* = Average values given based upon available data from 4 runs.
Issue 1
Page 17 of 19
PerformanceBox // G-TECH / Pro RR
For the less serious user, or for the user interested in recording comparative ¼ mile times
for tuning / engineering purposes, the better option may be the G-Tech / Pro RR for the
following reasons:
I.
Timing resolution is reported to 3 decimal places, with a stated accuracy of
+/-0.01s.
II.
Absolute accuracy may not be an issue if the unit is to be used for
comparative purposes.
III.
Up to 30 sets of run data can be stored internally and reviewed on the
display, without the need for uploading to a PC. If required, the G-TECH
PASS software can be used to review and analyse data post-test.
IV.
The limited functionality means that there is less chance of the user
becoming confused with the operation of the unit.
V.
Perhaps most importantly to the individual user, the G-Tech / Pro RR is
significantly cheaper than the PerformanceBox.
Issue 1
Page 18 of 19
PerformanceBox // G-TECH / Pro RR
End Of Document
Issue 1
Page 19 of 19