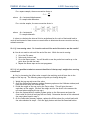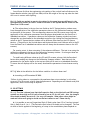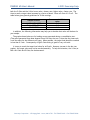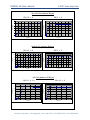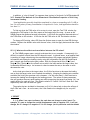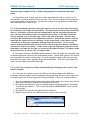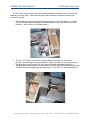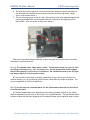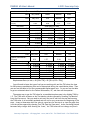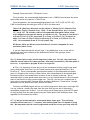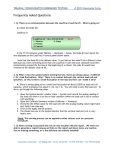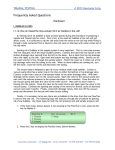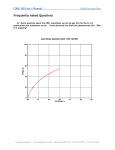
1
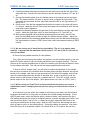
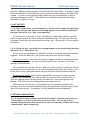
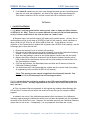
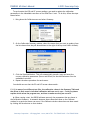
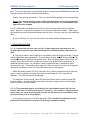
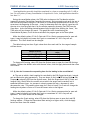
DSHEAR: MS User's Manual © 2013 Geocomp Corp. Frequently Asked Questions Hardware I. GENERAL I-1. Q: The Jog choice from the Position menu for manual horizontal control of ShearTracII does not seem to work. I have been pressing the arrow up and down without any response. The vertical movement works. A: It is necessary to push the left and right arrows when using the Jog choice for horizontal control. I-2. Q: How does the horizontal initialization work? A: The horizontal initialization is a very useful option because it allows you to automatically reset the shear box so that the water bath box is in the middle of its motion range and the stainless steel ball is aligned with the vertical load cell button. But it will work only if the limit switches and water bath box have been set in the correct positions. To set the limit switches and water bath box in the correct positions, use the following steps. 1. Loosen the left four-prong nut that is used to fasten the threaded rod that goes from the horizontal load cell to the positioning bracket and screw it all the way to the load cell. Slide the shear box piston to the right as far as it will go. 2. Assemble shear box and position it securely in the water bath box. Be sure there is gap between the end of the shear box piston and the fastening plate on the right side of the shear box upper half. 3. Put something in the shear box that is about the height of a sample plus porous stones and will be able to support the top cap in its normal position. Place the top cap into position and place a stainless steel ball on the top cap. 4. Swing the crossbar into position, tighten the two four-prong nuts and lower the crossbar until the vertical load cell button is slightly higher than the top of the ball. 5. Use the horizontal key pad and Jog option from the Position menu for horizontal control to make a careful alignment of the top of the ball and the center of the load cell button. Geocomp Corporation · 125 Nagog Park · Acton, MA 01720 · Tel 978-635-0012 · Fax 978-635-0266 DSHEAR: MS User's Manual © 2013 Geocomp Corp. 6. Carefully measure the distance between the left limit switch and the left side of the water bath box. Position the limit switch so that the distance is exactly 12.7 mm (0.5 in). 7. Choose the Initialize option from the Position menu for horizontal control and press Ent. The water bath box will move to the left until it triggers the limit switch. The step count will be zeroed and the water bath box will move to the right exactly 12.7 mm (0.5 in). 8. Check to see if the ball has stopped directly below the center of the load cell button. If it has not, reposition the left limit switch and repeat the initialization until the ball stops with correct alignment. 9. Measure the distance between the right side of the water bath box and the right limit switch. Adjust the right limit switch so that the distance is 12.7 mm (0.5 in). 10. When you are satisfied that everything has been adjusted correctly, use the View menu on the SHEAR control window to open the System Monitor window. Adjust the physical position of the horizontal displacement sensor until the Horizontal reading on the System Monitor window is 32767 counts (this is half the maximum reading of 65535 counts). I-3. Q: We are running out of travel during consolidation. The soil is an organic peaty material. It appears that the maximum vertical travel is 12.7 mm (0.50 in). How can we solve this problem? A: There are two possible solutions for this problem. First, after you have swung the crossbar into position, use the Initialize option on the lefthand LCD Position menu to start the loading mechanism near its highest position. Then use the nuts on the vertical threaded rods to lower the crossbar until the load cell button is close to the stainless steel ball. This will provide the largest possible downward travel. If there is still not enough travel, you will need to reduce the thickness of your sample. But you have to maintain the conditions that the shear plane is midway between the top and bottom of the sample, that there are porous stones on both ends of the sample, and the top cap is the same height above the bottom of the shear box. A way to do this is to use two porous stones at the bottom of shear box, a sample that is 12.7 mm (0.5 in) high, and two porous stones on the top of the sample. (Each porous stone is 6.4 mm, or 0.25 in, thick.) I-4. Q: While running our ShearTrac-II we have noticed that the arm for our vertical displacement sensor is bumping into the rear four-prong nut that holds the crossbar in position. A: At the start of a test (while the crossbar is still swung to one side), use the left-hand keypad on the ShearTrac-II front panel to initialize the vertical loading mechanism. (From the LCD main menu, select the Position option, choose Initialize, then press the Ent key.) The loading mechanism will move to its highest position, activate the upper limit switch, and then move down about 3 mm (0.12 in). Loosen the nut that clamps the LVDT arm to the vertical post and slide the arm up a ways. Raise the LVDT shaft into the housing and use a piece of tape to hold it in the raised position. Swing the crossbar into position. Now lower the LVDT arm until its underside is about 6 to 10 mm (0.25 to 0.4 in) above the rear four- Geocomp Corporation · 125 Nagog Park · Acton, MA 01720 · Tel 978-635-0012 · Fax 978-635-0266 DSHEAR: MS User's Manual © 2013 Geocomp Corp. prong nut. Remove the tape and lower the LVDT shaft onto the crossbar. If necessary, adjust the horizontal position of the LVDT arm so that the shaft is midway between the sides of the crossbar. (It is best to raise the shaft slightly while doing this to avoid having it catch on anything and damage the LVDT.) There should now be clearance even when the loading mechanism is a high as it will go. II. LIMIT SWITCHES II-1. Q: The crossbar moves up at the beginning of the test until it triggers the upper limit switch. Then the test stops and an error message appears on the screen indicating that the upper limit switch is on. Why is this happening? A: This occurs if, at the start of a test, the load cell is registering a load that is greater than the target value for the first incremental consolidation step. To ensure that this does not happen, always zero the load cell before starting a test. (See Section 6.2 for the zeroing procedure.) II-2. Q: During the test, a controller error message appears on the screen telling me that a limit switch is on. What should I do? A: The action you take depends on whether a vertical or horizontal limit switch has been triggered. Check the ShearTrac-II front panel to see which limit switch is blinking. Vertical limit switch: If the lower limit switch is triggered during the consolidation phase, it will have to be adjusted if you want to continue with the test. However, this involves opening up the load frame. We recommend that you abort the test. When you start a new test, initialize the vertical load mechanism then use the nuts on the vertical threaded rods to lower the crossbar. Set it so that there is only a small gap between the load cell button and the stainless steel ball. Horizontal limit switch: Identify which horizontal limit switch (left or right) has been triggered. Move that switch away from the point of contact by about 0.65 mm (0.25 in). Once the triggered switch has been moved, the ShearTrac-II front panel light will stop blinking. Click OK on the error message window and restart the test. Before you start the next test, we recommend that you reset both horizontal limit switches so that the horizontal initialization (using the keypad and the Position menu on the right LCD) works correctly. See Question I-2 in the Hardware section of Appendix F. III. NETWORK COMMUNICATION III-1. Q: We have several systems connected to the same PC. We were running only one of the systems, so we shut off the ones we were not using. Then we got an error message stating that the system we had left on was not responding. It seems that we lost communication. What is happening? Geocomp Corporation · 125 Nagog Park · Acton, MA 01720 · Tel 978-635-0012 · Fax 978-635-0266 DSHEAR: MS User's Manual © 2013 Geocomp Corp. A: A temporary loss of communication is normal when you either shut off or boot up any system unit connected to the same network. Whenever a unit connected to the network is powered down or powered up, the network goes into a re-configuration mode during which no communication is allowed. Depending on how many other units are on the network, this process may take some time. If the software checks connections while the process is going on, you will get the “not responding” message. If not, no message will appear. Should it appear, simply wait a short period of time and then click the Retry button. Everything should be back to normal. III-2. Q: The Network LEDs are RED on the front panel and there is no communication between the PC and the ShearTrac-II unit. All of our ID numbers are correct. What else should we check? A: Probably the network communication cable (gray cable) is plugged into the Ethernet jack on the back of your PC instead of into the special (black) adapter that is plugged into the network communication card that we provided. If you find that this is the case, unplug the cable and plug it into the adapter on the card (see picture below). The LEDs should now glow a solid green. IV. POWER OUTAGE IV-1. Q: After an electrical power problem in our building, it seems that the system is not working properly. We suspect that the set-up values on the embedded controllers are not correct. How do we revert to the original set-up values or default values set at the factory? A: The default values may change either after an electrical power problem or due to inadvertent actions by the end user. You will need to revert back to the internal default values of your system by following these steps: 1. Turn off the ShearTrac-II unit. 2. Wait about 10 sec. 3. Turn it back on and immediately press the ESC key on the keypad to reset everything back to the imbedded controller default values. 4. Now go to your ShearTrac-II hardware manual. In each of Sections 2.1.4 and 2.2.4 (Setup sections) you will find a table of default settings for your system. Got through each LCD menu and be sure the settings on the menu agree with those in the table. If a setting does not agree, change it to the one in the manual. Geocomp Corporation · 125 Nagog Park · Acton, MA 01720 · Tel 978-635-0012 · Fax 978-635-0266 DSHEAR: MS User's Manual © 2013 Geocomp Corp. 5. If the Node ID numbers on your unit were changed (because you are controlling more than one unit with your computer), set them to the values they were changed to. (The default values are 101 for vertical control and 102 for horizontal control.) Software I. CALIBRATION/ZEROING I-1. Q: When I view the system before starting a test, there is always an offset of about ±0.005 kN (1 lb). Why? There is no contact between the vertical load cell and specimen, so why is there a small offset in the load and how can I make it zero? A: Between tests, the load cell output will usually drift a small amount. At best, the noload condition will be in the range of ±0.025% of load cell full capacity, which translates to about ±0.001 kN (±0.25 lb) for a 4.45 kN (1000 lb) load cell. If you observe a no-load condition on the System Monitor window that is greater than ±0.025% of full capacity, use the following steps to zero the load cell. 1. Be sure the load cell is not in contact with anything. 2. Bring down the Calibrate menu and select Summary to open the Calibration Summary window. Position this window beside the System Monitor window. 3. Note the Load reading in counts on the System Monitor window (top left text field). 4. Replace the Offset value that is shown on the Calibration Summary window (when Load is selected for the Channel choice) with the Load reading (in counts) that is on the System Monitor window. 5. Click the Apply button, the Download button and then the Ok button to close the Calibration Summary window. 6. You should now see in the System Monitor window that the vertical load cell reading (in engineering units) is within ±0.025% of full capacity. *Note: This zeroing process cannot be applied to the horizontal load cell. See Section 6.2.2 for the horizontal load cell zeroing procedure. I-2. Q: I noticed that the engineering readings on the LCD screen are different than the ones on the PC screen. Are they supposed to be the same? Did it affect the results of a test I just ran? A: First, be assured that any mismatch of the engineering readings values between the LCD and the PC screens will not affect the results of a test that you run using the SHEAR program. A mismatch can occur if the calibration parameters that are shown in the Calibration Summary (opened using the Calibration menu) have not been downloaded into the imbedded controller of the ShearTrac-II unit. However, the software uses only the Calibration Summary values when it runs a test. Consequently, it is very important that these are correct. Geocomp Corporation · 125 Nagog Park · Acton, MA 01720 · Tel 978-635-0012 · Fax 978-635-0266 DSHEAR: MS User's Manual © 2013 Geocomp Corp. To synchronize the LCD and PC screen readings, you need to update the calibration parameters in the imbedded controllers of the ShearTrac-II unit. To do this, follow the steps shown below. 1. Bring down the Calibrate menu and select Summary 2. On the Calibration Summary window, select the sensor that you want to update (from the list shown when the pull-down button to the right of the top text field is clicked). 3. Click the Download button. This will automatically transfer (copy and save) the current calibration parameters (Factor and Offset) for the selected sensor into the embedded controller. 4. Repeat the above procedure for each sensor. You should now see that the PC and LCD screen values match. I-3. Q: In many of our different test files, the calibration values in the Summary Table and the values in each sensor's individual calibration table are not in sync. Could you please explain which values the program uses, and how to make sure they are correct? A: When running a test, the SHEAR software uses only the parameters that are shown in the Calibration Summary. A mismatch between these values and those on the Calibrate window for a particular sensor can occur if the Calibrate window values have not been saved by clicking the Save button on that window. Geocomp Corporation · 125 Nagog Park · Acton, MA 01720 · Tel 978-635-0012 · Fax 978-635-0266 DSHEAR: MS User's Manual © 2013 Geocomp Corp. To determine whether or not the Summary values are correct, you need to know how the test was set up. The two possibilities are described below. The parameters are correct You have two ShearTrac-II units, A and B. You plan to run a test on unit A. A file for a test run on unit B is a good template for the test, but the calibration parameters in it are those for the sensors on unit B. You open a SHEAR control window and load that file into the window. We will call that file Test-B. Next, you open a second SHEAR control window and load into it a file for a test that was run on unit A. We will call that file Test-A. Finally, you copy the calibration parameters from the Calibration Summary in Test-A and paste them into the Calibration Summary in Test-A. You now have a control program that contains the correct calibration parameters for running a test on unit A, but those shown on the Calibration Summary will be different from those on the individual sensor Calibrate windows. The parameters are not correct You have two ShearTrac-II units, A and B. You plan to run a test on unit A. A file for a test run on unit B is a good template for the test, but the calibration parameters in it are those for the sensors on unit B. You open a SHEAR control window and load that file into the window. We will call that file Test-B. You decide to calibrate the sensors and use Test-B to do it. You go through the calibration procedure for each sensor and click the Calibrate button on each Calibrate window. But you forget to click the Save button on each window before closing it. You now have a control program that has the correct calibration parameters on each Calibrate window, and they will be different from those in the Calibration Summary. However, it is the incorrect Summary values that will be used to run the test. If you know (or suspect) that a test was run using a file with incorrect calibration parameters on the Summary window, you can recover from the error. Error Recovery Open a SHEAR control window and load the erroneous test file into it. You will need to replace the calibration parameters (factors and offsets) that are shown on the Calibration Summary with correct ones. If you are certain that the parameters on the individual Calibrate windows are correct, simply click Save on each of those windows. If you will have to enter new values manually, there are two ways to do this: (1) delete the original values and type the new ones into the text fields or (2) copy and paste the new Geocomp Corporation · 125 Nagog Park · Acton, MA 01720 · Tel 978-635-0012 · Fax 978-635-0266 DSHEAR: MS User's Manual © 2013 Geocomp Corp. ones. For the second option, you will need to open a second copy of SHEAR and load the test file that contains the correct calibration parameters. Finally, save the file and reload it. The new values will be applied to the processed data. *Note: The raw data and the results of data reduction shown on the report pages will be changed. The stress target values that were entered into the Consolidation Table page will not be changed. I-4. Q: I calibrated my transducer and filled out the Calibration table under the Options menu. However, I can't get the program to save the new calibration numbers. When I open the file back up the old calibration numbers are still there. How do I save the new calibration data? A: Go to File>Save As. Save the file under a new name such as newtemplate.dat II. CONSOLIDATION PHASE II-1. Q: I noticed that for some very soft soil, it takes longer than one second for the vertical load to reach the specified load during the consolidation phase. Why does it do that? A: The rate at which a load is applied is controlled by the PID (Proportional gain, Integral gain and Derivative gain) parameters. They are shown on the Load PID Settings window that is opened by selecting PID from the Options menu. Both the Proportional Gain (P-Gain) and Integral Gain (I-Gain) affect the overall rate at which the target load is reached, but in somewhat different ways. An increase in value increases the rate; a decrease in value decreases the rate. The possible value range for P-Gain is from 0.5 to 5 and will change the loading time by about a factor of 3 from the lowest value to the highest. While the default values (2.5 for P-Gain and 0.2 for I-Gain) are appropriate for most soil types, it may be helpful to increase the P-gain to a maximum of 5 for a very soft soil specimen. The I-Gain should not be changed. To change the P-Gain setting, select PID from the Options menu to open the Load PID Settings window. Change the Proportional Gain setting to a higher value, click the Apply button and then close the window. II-2. Q: The responding time for the loading in the consolidation seems a bit slow (we tried to load from 5 to 10kPa, took about 6-7 seconds), I don’t think it’s a big problem for direct shear, but it may be not as good when we use the machine for consolidation tests as we are testing a lot of silty materials. A: According to Section 6.0 of ASTM standard D 2435: Standard Test Methods for OneDimensional Consolidation Properties of Soils Using Incremantal Loading. Geocomp Corporation · 125 Nagog Park · Acton, MA 01720 · Tel 978-635-0012 · Fax 978-635-0266 DSHEAR: MS User's Manual © 2013 Geocomp Corp. “Load application generally should be completed in a time corresponding to 0.01 t100 or less. For soils where primary consolidation is completed in 3 min, load application should be less than 2 s.” During the consolidation phase, the T100 value is shown on the Test Monitor window (opened by choosing Test Monitor from the View menu). But you need to wait until the test is well into the step before using the T100 value (it is continually updated and will not be very accurate at the beginning of the step). A way to determine when the value is a good one for the step is to view the graph that is on the window opened by choosing Test T00 from the View menu. As the line being plotted becomes fairly straight after forming the “knee,” the T100 value will not change very much. This graph has to be viewed during the Consolidation/B phase; it will not be saved when the program goes to the Shear phase. While the default values (2.5 for P-Gain and 0.2 for I-Gain) are appropriate for most soil types, it may be helpful to increase the P-gain to a maximum of 5 for a very soft soil specimen. The I-Gain should not be changed. The table below gives three P-gain values that often work well for the range of sample stiffness shown. Sample stiffness LOOSE /VERY SOFT MEDIUM SOFT/MEDIUM DENSE/STIFF Recommended P-Gain value 5.0 2.5 0.5 To change a PID setting, select PID from the Options menu to open the Load PID Settings window. Replace the default value with the new value, click the Apply button and then close the window. II-3. Q: How do I increase the responding time for the loading in the consolidation? A: The rate at which a load is applied is controlled by the PID (Proportional gain, Integral gain and Derivative gain) parameters. They are shown on the Load PID Settings window that is opened by selecting PID from the Options menu. Both the Proportional Gain (P-Gain) and Integral Gain (I-Gain) affect the overall rate at which the target load is reached, but in somewhat different ways. An increase in value increases the rate; a decrease in value decreases the rate. The possible value range for P-Gain is from 0.5 to 5 and will change the loading time by about a factor of 3 from the lowest value to the highest. While the default values (2.5 for P-Gain and 0.1 for I-Gain) are appropriate for most soil types, it may be helpful to increase the P-gain to a maximum of 5 for a very soft soil specimen. The I-Gain should not be changed. To change the P-gain setting, select PID from the Options menu to open the Load PID Settings window. Change the Proportional Gain setting to a higher value, click the Apply button and then close the window. Geocomp Corporation · 125 Nagog Park · Acton, MA 01720 · Tel 978-635-0012 · Fax 978-635-0266 DSHEAR: MS User's Manual © 2013 Geocomp Corp. II-4. Q: We just ran a full consolidation test and direct shear. I cannot find the consolidation test report to view the graph and data for the consolidation part of the test. Do we have the software to produce a full consolidation test report and I’m just not finding it? A: The report for the shear phase of a test shows only time-displacement data and graphs. There is another software program (ICONP) dedicated to consolidation and swell testing that has full reporting options. However, that program is designed to run tests on a LoadTrac-II system and will not run a test on ShearTrac-II. If you plan to be doing a lot of full consolidation tests, you should consider purchasing the LoadTrac-II system with the ICONP software. III. GENERAL III-1. Q: Can the software detect wrong values that are manually entered by the end user? A: Yes, the software program detects any erroneous values that have been entered. It also detects certain hardware malfunctions. Examples include: 1. Negative values for sample dimensions, calibration factors, and PID control parameters 2. Zero values for sample dimensions, calibration factors (except for offset value), and PID control parameters 3. Wrong Node ID number 4. A malfunctioning sensor that it is giving an analog reading of either 0 (the minimum value) or 65535 (the maximum value) 5. The ShearTrac-II load frame not turned on. III-2. Q: I am running a test. Do I need to wait until the end of the test to see the results? A: You do not need to wait until the end of the test. While the test is running: 1. Go to the File menu. 2. Select and click on Load. 3. Go to the Report menu. You will be able to see the partial test results up to the point when you did the Load. 4. Repeat the above steps as the test progresses. III-3. Q: What is the area correction for a square and a round sample? A: As the shear phase proceeds, soil-to-soil contact area reduces. The correction is calculated using A = FAo where: A = corrected area, F = area correction factor, A0 = Original sample area. Geocomp Corporation · 125 Nagog Park · Acton, MA 01720 · Tel 978-635-0012 · Fax 978-635-0266 DSHEAR: MS User's Manual © 2013 Geocomp Corp. For a square sample, the area correction factor is F = 1− where: Δh = horizontal displacement, B = sample side dimension. ∆h B For a circular sample, the area correction factor is where: Δh = horizontal displacement, D = sample diameter. It is best to calculate the internal friction angle based on the ratio of horizontal load to vertical load instead of shear stress to normal stress to eliminate the area correction and any related correction. III-4. Q: I am running a test. Do I need to wait until the end of the test to see the results? A: You do not need to wait until the end of the test. While the test is running: 1. Go to the File menu. 2. Select and click on Load. 3. Go to the Report menu. You will be able to see the partial test results up to the point when you did the Load. 4. Repeat the above steps as the test progresses. III-5. Q: Is it possible to take into account the effect of the top cap’s weight when running a shear test? A: Yes, by increasing the offset value to match the resulting vertical force due to the weight of the top cap. The following steps will guide you through doing this. 1. Weigh the top cap and record the value. 2. Open the Calibration Summary window (Summary option on the Calibrate window) and note the Factor value for Vertical Load. 3. Divide the weight of the top cap by the Factor value. This will give the count equivalent of the weight. (Be sure the weight unit for the factor is the same as the unit used when weighing the top cap.) 4. Open the System Monitor window (System option on the View menu) and note the count value for Vertical load (top left text field). Determine the sum of this value and the count value found in step 3. 5. On the Calibration Summary window, replace the Offset value (for vertical load) with the value obtained in step 4. Click the Apply button and then the Download button. Geocomp Corporation · 125 Nagog Park · Acton, MA 01720 · Tel 978-635-0012 · Fax 978-635-0266 DSHEAR: MS User's Manual © 2013 Geocomp Corp. You will now find that the engineering unit reading of the vertical load cell shown on the System Monitor window (top right text field) will be the weight of the top cap when the load cell is not in contact with anything. III-6. Q: Could you explain to me why the values for the same items are different in the System Monitor window on the PC screen from those in the System Monitor shown on the ShearTrac-II LCD screen? A: The values shown in the top four text fields on the PC System Monitor window come from the application of the calibration parameters shown on the Calibration Summary window to the output of the sensors. The corresponding values on the LCD screens come from the application of the calibration parameters that have been downloaded into the ShearTrac-II imbedded controllers. If parameter values on the Calibration Summary window have been changed but not downloaded to the imbedded controllers (by clicking the Download button), values on the PC System Monitor window will be different from those on the LCD System Monitor. (The entries in the Vertical Motor and Horizontal Motor text fields are sent to the PC from the ShearTrac-II imbedded controllers and will always be the same as those on the LCD screens.) For running a test, it does not matter if the values are different. The test is run using the calibration parameters that are on the Calibration Summary window. So as long as those are the correct values, the test result will be accurate. To avoid having different values on the PC and LCD screens, always click the Download button after making any change on the Calibration Summary window. Note that only the parameters for the sensor shown in the top text field will be sent to an imbedded controller. To insure that all displays will be the same, download the parameters for each sensor one by one. III-7. Q: What is the definition for the failure condition in a direct shear test? A: According to ASTM standard D 3080: “Failure is often taken to correspond to the maximum shear stress attained, or the shear stress at 15 to 20 percent relative lateral displacement. Depending on soil behavior and field application, other criteria may be defined.” IV. PID SETTINGS IV-1. Q: The User’s Manual says that the Proportion Gain on the Vertical Load PID Settings window can be as high as 5 for soft soils and as low as 0.5 for stiff soils. Also, the Integral Gain should probably be set to 0.1 for very stiff samples. What other values might be used and how are we going to decide on the best values to use? Please clarify. A: It is possible to use any Proportional Gain (P-Gain) value from 0.5 to 5 and any Integral Gain (I-Gain) from 0.1 to 1. (The Derivative Gain value of 0 should not be changed.) The rate at which a load is applied at the beginning of a step in the consolidation phase depends on Geocomp Corporation · 125 Nagog Park · Acton, MA 01720 · Tel 978-635-0012 · Fax 978-635-0266 DSHEAR: MS User's Manual © 2013 Geocomp Corp. both the P-Gain and the I-Gain: lower value = slower rate, higher value = faster rate. The time to reach a target value increases by a factor of about 3 from a P-Gain of 0.5 to 5. The table below gives general guidelines for P-Gain settings. Sample stiffness LOOSE /VERY SOFT MEDIUM SOFT/MEDIUM DENSE/STIFF Recommended P-Gain value 5.0 2.5 0.5 In addition, the following information may help you to decide what value will be best for your sample. The graphs shown below are for loading curves generated during a consolidation test. (They were generated from data dumped into a file after the test.) Note that the time scale is not the same for the different soil types. When possible, the target load should be reached in less than 0.5 min. Consequently a high P-Gain setting is good for very soft soils. It is easy to reach the target load value for stiff soils. However (as seen in the last two graphs), the target value may not be reached smoothly. To help this situation, the I-Gain (or both the I-Gain and P-Gain) can be decreased. Geocomp Corporation · 125 Nagog Park · Acton, MA 01720 · Tel 978-635-0012 · Fax 978-635-0266 DSHEAR: MS User's Manual © 2013 Geocomp Corp. Very Soft Soil (Modulus 290 psi) PID: 5, 1, 0 1.2 1.2 1.0 1.0 0.8 0.8 Load/Target Load/Target PID: 0.5, 1, 0 0.6 0.4 0.2 0.6 0.4 0.2 0.0 0.0 0.0 0.5 1.0 1.5 2.0 2.5 3.0 3.5 4.0 0 0.5 1 1.5 Time (min) 2 2.5 3 3.5 4 Time (min) Medium Soil (Modulus 4000 psi) PID: 0.5, 1, 0 PID: 5, 1, 0 1.2 500 1.0 400 0.8 Load/Target Force (n 600 300 200 100 0 0.00 0.6 0.4 0.2 0.05 0.10 0.15 0.20 0.25 0.30 0.35 0.40 0.45 0.0 0.00 0.50 0.05 0.10 0.15 0.20 Time (mi n) 0.25 0.30 0.35 0.40 0.45 0.50 Time (mi n) Stiff Soil (Modulus 10,000 psi) PID: 0.5, 1, 0 1.2 1.2 1.0 1.0 0.8 0.8 Load/Target Load/Target PID: 0.1, 0.1, 0 0.6 0.4 0.2 0.0 0.00 0.6 0.4 0.2 0.05 0.10 0.15 Time (mi n) 0.20 0.25 0.0 0.00 0.05 0.10 0.15 0.20 0.25 Time (mi n) Geocomp Corporation · 125 Nagog Park · Acton, MA 01720 · Tel 978-635-0012 · Fax 978-635-0266 DSHEAR: MS User's Manual © 2013 Geocomp Corp. In addition, a “rule of thumb” for response time is given in Section 6.0 of ASTM standard D 2435: Standard Test Methods for One-Dimensional Consolidation Properties of Soils Using Incremantal Loading. “Load application generally should be completed in a time corresponding to 0.01 t100 or less. For soils where primary consolidation is completed in 3 min, load application should be less than 2 s.” To find out what the T100 value is for a step in a test, open the Test T100 window (by choosing the T100 option in the View menu) at the beginning of the step. As soon as the SHEAR program has gathered enough information, it will show the graphical determination of the T100 value on the window. It will also list the T100 value in the Test Monitor window. To change a PID setting, select PID from the Options menu to open the Load PID Settings window. Replace the default value with the new value, click the Apply button and then close the window. IV-2. Q: What are the effects and correlations between the PID values? A: The SHEAR program uses a control technique that is very complex. Consequently it is difficult to explain in detail how the PID values are used. In general terms, as an applied load is reaching its target value during the consolidation phase, the program periodically gathers information and adjusts the loading rate by using the information and the PID (Proportional gain, Integral gain and Derivative gain) values. Both the Proportional Gain (P-Gain) and Integral Gain (I-Gain) affect the overall rate at which the load reaches the target value, but in somewhat different ways. An increase in value increases the rate; a decrease in value decreases the rate. As the load gets close to the target value, the P-Gain functions to decrease the loading rate so that the target value is not reached too suddenly. (Keeping the loading rate constant would be like hitting the specimen with a hammer.) On the other hand, I-Gain functions to increase the loading rate throughout the loading process. The values of these parameters that will produce the most rapid loading rate while preventing the target from being “hit” too rapidly differs for each soil type. The default values of 2.5 and 0.2 for the P-Gain and I-Gain respectively work well for most soil types. The graphs that are included in the answer to Q/A IV-1 above help to show the effects of the P-Gain and I-Gain. As can be seen, the I-Gain needs to be changed only for very stiff soils. V. REPORT V-1. Q: When I use report software, the scale does not change to what I want. For example, if I want to change the vertical displacement scale to negative 0.02, it will not change, but if I change it to negative 0.2 it will change. (In this particular case the default Geocomp Corporation · 125 Nagog Park · Acton, MA 01720 · Tel 978-635-0012 · Fax 978-635-0266 DSHEAR: MS User's Manual © 2013 Geocomp Corp. minimum value is negative 0.05). A similar thing happens to normal and shear stress scales. A: The software tries to keep both the vertical and horizontal scale in a ratio of 1:1 so that the Mohr circles are actually circles not ovals. Thus, there are values in the scaling that are not acceptable to the software. You may have to keep on trying different values to get the combination that is best for you. V-2. Q: We are having a problem running the report on one of our tests and I was hoping you could offer your insight on the situation. The shear phase of the test was started and ran for 1.65 minutes, at which time we realized that it was not running at the desired rate. We then proceeded to enter in the desired rate as step 2 in the shear phase and told the program to go to the next step, which it did with no problem. We were then running at the desired rate for the remainder of the test. Our problem comes in that we cannot get the report function to load step 2 of the shear phase, so our report is noting 1.65 minutes to failure at a maximum shearing load of around 8 psf. This is not the correct data and therefore does not lend itself to the phi angle and cohesion calculations necessary for what we are doing. Is there a way to get the program to accept ALL of the shear data, or at least the 2nd step, so we can use the report function? This data is saved as part of the file, as we can view it in table format. A: The report feature of the SHEAR software does not show the graphs for each shear step on separate pages (as it does for the consolidation phase). Instead, each graph on the second two pages plots the result of all the steps. To view the graphs having all the steps on them, bring down the report menu, highlight Graph and choose Shear. Then click View (upper left corner of the window) and choose Next Page. V-3. Q: How can we obtain the failure envelope after performing a series of tests on the same soil sample? A: If you have run a series of tests with different confining stresses under different filenames, then you need to use the companion editing/reporting software, shear.report.exe, to combine up to four tests and generate a failure envelope. Follow the steps given below. 1. Open the companion editing/reporting program (shear.report.exe), bring down the file menu and click Load to load the first test file of the series. 2. Bring down the Window list (the first loaded program will be shown after the number 1) and click the number 2. The list will close and the SHEAR:REPORT control window will go blank. 3. Bring down the File menu and load the second test file. 4. Repeat this process for the additional (up to a total of four) test files. Geocomp Corporation · 125 Nagog Park · Acton, MA 01720 · Tel 978-635-0012 · Fax 978-635-0266 DSHEAR: MS User's Manual © 2013 Geocomp Corp. Once you have loaded all the files, you can select Graph on the Report menu to view the failure envelope (right-hand graph at the top) and a table of test parameters. V-4. Q: Is it possible to make a development in order to obtain the envelope of the residual strength in addition to that of the peak strength? A: The program automatically generates residual shear test graphs. The second page of the window opened using the Shear choice from the Graph option on the Report menu will show a Shear Stress vs. Horizontal Displacement graph for the Residual Shear Test. It will include all steps of the shear phase. (See example below where labeling has been added to help clarify what the graph is showing.) The third page of the window opened using the Shear choice from the Graph option on the Report menu will show a Shear Stress vs. Cumulative Horizontal Displacement graph for the Residual Shear Test. It will include all steps of the shear phase. (See example below where labeling has been added to help clarify what the graph is showing.) Geocomp Corporation · 125 Nagog Park · Acton, MA 01720 · Tel 978-635-0012 · Fax 978-635-0266 DSHEAR: MS User's Manual © 2013 Geocomp Corp. It is best left to engineering judgment to select the residual strength that best reflects the nature of the project. V-5. Q: Is it possible to make a development in order to add the peak and residual displacement values to the resulting data or tables? A: The data are already available under Report Table. V-6. Q: I noticed that Mohr circles are plotted on some results in your manual. Is it correct to draw Mohr circle from the DSB results? A: Yes you could draw Mohr circles from the direct shear tests. V-7. Q: After running a successful test we ran into troubles with the report. We were not able to generate a report because all links on the report pull down menu are inactive. Are we missing something, or is the software not entirely installed? A: To make the links active, parameters and data for a test must be loaded into the SHEAR program so that they can be displayed on the various SHEAR windows. Go through the following steps to load a data file. 1. First pull down the File menu. 2. Next, click on Load. This will display a window that shows data files for tests that have been completed (and for any test that is currently running). Highlight the file name for the test you wish to load and then click Open. 3. Finally, pull down the Report menu. You should now see the Graph, Table, Settings, and Edit options all activated. Geocomp Corporation · 125 Nagog Park · Acton, MA 01720 · Tel 978-635-0012 · Fax 978-635-0266 DSHEAR: MS User's Manual © 2013 Geocomp Corp. Using these options, you can view the results of the test, change various settings for the report and edit the test data points. Remember that each time you change or edit any item, you will need to save the file and load it again. III-7. Q: When testing dry sand specimens, why does Gs, density, and void ratio read zero in the shear report? A: You cannot enter the exact same values for the trimming wet weight and trimming dry weight in the Water content project tab (specimens are never fully dry due to natural moisture content in the air). When running a test on a “dry” specimen, enter your sample weight for the trimming wet weight. For your trimming dry weight, enter a value that is .00001 less than that value. For example, if your trimming weight is 1 g, enter 1 g for the trimming wet weight and enter 0.99999 g for the trimming dry weight. VI. SHEAR PHASE VI-1. Q: During the shear phase, I noticed that my displacement rate is slightly different than the one that I specified in the Shear Table. Why is that? How can I set it up correctly? A: If the first and fifth columns (headed Elapsed Time and Horizontal Displacement) on the second page of the shear report table (opened by selecting Shear from the Table submenu on the Report menu) are used to calculate the rate during the shear phase, the result should agree with the specified value to within ±1 %. The two factors that determine how close the actual horizontal displacement rate is to the value specified on the Shear Table are the horizontal displacement transducer calibration factors and the Step Multiplier for the horizontal motor. First check to be sure that the displacement transducer calibration factors are correct. If there is any reason they might have changed (e.g., the transducer has not been calibrated recently or there was some event that might have affected the transducer functioning), go through the calibration procedure described in Appendix A. The Step Multiplier (that depends on the characteristics of the ShearTrac-II frame) is carefully determined at the factory and is not likely to be incorrect. However, if the calibration factors are correct and the agreement is still outside ±1 %, go through the Geocomp Corporation · 125 Nagog Park · Acton, MA 01720 · Tel 978-635-0012 · Fax 978-635-0266 DSHEAR: MS User's Manual © 2013 Geocomp Corp. following steps to obtain the Step Multiplier value that is now needed for your ShearTrac-II frame. 1. Open the System Monitor window (select System from the View menu) and so that you can view the reading from the horizontal LVDT. 2. Move the water bath box left or right until the horizontal displacement transducer reads about 30000 counts (as seen in the left-hand text field, fourth from the top, on the System Monitor window). 3. Record both the Horizontal reading (in mm or in) and the Pulse Count for the Horizontal Motor. (Note that the Pulse Count is the motor step count.) 4. Now move the water bath box until the horizontal displacement reads about 40000. 5. Again record both the Horizontal reading (in mm or in) and the Pulse Count. 6. Calculate the Load Step Multiplier as follows: Load Step Multiplier = Δ Vertical travel /Δ Pulse count 7. Open the Hardware Setup window (select the Hardware item on the Options menu) and replace the Step Multiplier value for the Horizontal Motor with the one you have calculated. Then click the Apply button. VI-2. Q: I ran a residual shear test on a sand material. The results do not look symmetrical. Could you tell me what happened? A: This is due to play in the horizontal loading mechanism caused by one or more of the fasteners not being tight. There are five places that need to be checked to be sure the connection is tight. 1. The threaded rod from the horizontal stepper motor to the water bath box. Be sure the nut has been tightened against the fastening plate on the left side of the water bath box. Geocomp Corporation · 125 Nagog Park · Acton, MA 01720 · Tel 978-635-0012 · Fax 978-635-0266 DSHEAR: MS User's Manual © 2013 Geocomp Corp. 2. The two “T” bolts at the left of the water bath box that hold the Shear box in position. Be sure they have been tightened. 3. The shear box piston left end. Be sure the nut has been tightened against the fastening plate on the right side of the shear box upper half before the horizontal load cell is zeroed at the beginning of the shear phase. 4. The shear box piston right end. Be sure the nut that fastens the shear box piston to the threaded rod attached to the horizontal load cell has been tightened. 5. The two four-prong nuts at the far right. Be sure they have been tightened against the positioning bracket after the horizontal load cell is zeroed at the beginning of the shear phase. When the horizontal loading mechanism is rigid, the graph will be symmetrical. VI-3. Q. Why does the residual shear graph show zero horizontal load when it reverses direction? Geocomp Corporation · 125 Nagog Park · Acton, MA 01720 · Tel 978-635-0012 · Fax 978-635-0266 DSHEAR: MS User's Manual © 2013 Geocomp Corp. A: This is due to play in the horizontal loading mechanism caused by one or more of the fasteners not being tight. There are five places that need to be checked to be sure the connection is tight. 1. The threaded rod from the horizontal stepper motor to the water bath box. Be sure the nut has been tightened against the fastening plate on the left side of the water bath box. (Left arrow in the picture below.) 2. The two “T” bolts at the left of the water bath box that hold the Shear box in position. Be sure they have been tightened. (Right two arrows in the picture above.) 3. The shear box piston left end. Be sure the nut has been tightened against the fastening plate on the right side of the shear box upper half before the horizontal load cell is zeroed at the beginning of the shear phase. (Left arrow in the picture below.) Geocomp Corporation · 125 Nagog Park · Acton, MA 01720 · Tel 978-635-0012 · Fax 978-635-0266 DSHEAR: MS User's Manual © 2013 Geocomp Corp. 4. The shear box piston right end. Be sure the nut that fastens the shear box piston to the threaded rod attached to the horizontal load cell has been tightened. (Right arrow in the picture above.) 5. The two four-prong nuts at the far right. Be sure they have been tightened against the positioning bracket after the horizontal load cell is zeroed at the beginning of the shear phase. (The two arrow in the picture below.) When the horizontal loading mechanism is rigid, the graph will not show zero horizontal load when it reverses direction. VI-4. Q: The ultimate shear values match closely. The maximum shear is a little off: 36.5 according to Geocomp Corp., 38.7 according to us. Do the maximum DS results suggest that the discrepancy is in the level of compaction? We installed the sand in one dry layer and tamped lightly to form a smooth surface. A: The internal friction angle is directly proportional to the void ratio of the sand (or relative density), so it is not surprising that the two values differ by couple of degrees. The correct compaction is difficult to duplicate. VI-5. Q: Do you have any recommendation for the displacement rates that we should use for the shear phase? A: The best displacement rate depends on what testing standard is used, so you should check the standard you are using to see if there is a recommendation. The information below includes a table that has been prepared for Geotesting Express and an equation used by them. Geocomp Corporation · 125 Nagog Park · Acton, MA 01720 · Tel 978-635-0012 · Fax 978-635-0266 DSHEAR: MS User's Manual © 2013 Geocomp Corp. Recommended Displacement Rates in in/min SAND Very Dense Dense Medium Loose CLAY Very Stiff Stiff Medium Soft Failure Deformation, Df (in) T90 (min) 0.02 0.5 1 5 10 20 30 60 0.0032 0.0016 0.00032 0.00016 0.00008 0.00005 0.00003 0.05 0.1 Shear Rate (in/min) 0.008 0.016 0.004 0.008 0.0008 0.0016 0.0004 0.0008 0.0002 0.0004 0.00013 0.00027 0.00007 0.00013 0.15 0.024 0.012 0.0024 0.0012 0.0006 0.0004 0.0002 Recommended Displacement Rates in mm/min SAND Very Dense CLAY Failure Deformation, Df (mm) T90 (min) Very Stiff 0.51 0.5 1 5 10 20 30 60 0.08128 0.04064 0.00813 0.00406 0.00203 0.00127 0.00076 Dense Medium Loose Stiff Medium Soft 1.27 2.54 Shear Rate (mm/min) 0.20320 0.40640 0.10160 0.20320 0.02032 0.04064 0.01016 0.02032 0.00508 0.01016 0.00330 0.00686 0.00178 0.00330 3.81 0.60960 0.30480 0.06096 0.03048 0.01524 0.01016 0.00508 Displacement Rate (in/min) = Df/[50 x T50] = Df/[50 x (0.25 x T90)] You will need to know the type of soil you are working with and the T90 value (the time for 90% primary consolidation) that can be determined during the consolidation phase. Then you can use the table to find the recommended displacement rate. Or you can use the table to get an estimated value for the Failure Deformation, DF, and then use the equation. The easiest way to get the T90 value for a consolidation phase step is by dividing T100 by 1.5. The T100 value is shown on the Test Monitor window (opened by choosing Test Monitor from the View menu). But you need to wait until the test is well into the step before using the T100 value (it is continually updated and will not be very accurate at the beginning of the step). A way to determine when the value is a good one for the step is to view the graph that is on the window opened by choosing Test T00 from the View menu. As the line being plotted becomes fairly straight after forming the “knee,” the T100 value will not change very much. Geocomp Corporation · 125 Nagog Park · Acton, MA 01720 · Tel 978-635-0012 · Fax 978-635-0266 DSHEAR: MS User's Manual © 2013 Geocomp Corp. Example: Dense sand with a T90 equal to 5 min. From the table, the recommended displacement rate = 0.0008 in/min because the dense sand column shows this value for a T90 of 5 min. From the equation, the recommended displacement rate = 0.05 in/[50 x (0.25 x 5)] = 0.008 in/min because the table gives a DF of 0.05 in for dense sand. *Note: K.H. Head has a discussion on this subject in Volume 2 of his "Manual of Soil Laboratory Testing" (Pentech Press, 1994). In the Second Edition, this is in section 12.7 on pp 247. He includes a table of recommended deformation failure values which depend on the type and density (or stiffness) of soil. The range is from about 5 to 8 mm (0.2 to 0.3 in) for loose sands (2 to 5 mm, or 0.08 to 0.2 in, for dense) to about 1 to 2 mm (0.04 to 0.08 in) for hard clay (2 to 5 mm, or 0.08 to 0.2 in, for stiff). He recommends 8 mm (0.3 in) for plastic clay. Bill Kovacs (Holtz and Kovacs) notes that about 0.2 inches is adequate for most specimens (about 5 mm). If you are inexperienced with this soil type, it is probably best to err on the side of caution and use a lower estimate of the deformation failure value (giving a slower displacement rate). VI-6. Q: Some clients require a multi-stage direct shear test. For this, they want three different normal loads on the same specimen. After each consolidation, the shear phase is to be run. Is it possible to program all this in a single file? A: First, it is important to know that we do not recommend running a multi-stage shear test by using either ShearTrac-II or the Triaxial system (that comprises LaodTrac-II and FlowTrac-II). There is considerable question about quality of the undisturbed soil sample when it is brought to the vicinity of shear failure, then reconsolidated to be sheared again. Furthermore there is no standard that we know of that is related to this test. We do understand that in some special cases when there is a very limited amount of the soil sample there is justification in using a multi-staged test. This way, you can get a complete set of three tests to generate Mohr-Coulomb failure and hence determine “conservative” strength parameters for the sample that never reaches full failure. Currently the SHEAR program will not run a multi-stage direct shear test in one single file. You can, however, combine the data from the three files into one set of data using a spreadsheet program such as Excel. You can either use the Dump option from the File menu or copy the data from the table opened using the Table option from the Report menu. See Appendix B of this manual for details. VI-7. Q: We had a client asking for some special direct shear tests. They call them constant stiffness tests (σv/ εv = constant), and I believe ShearTrac-II is capable of doing this. We may need a special control program and would like to have your help with this. Geocomp Corporation · 125 Nagog Park · Acton, MA 01720 · Tel 978-635-0012 · Fax 978-635-0266 DSHEAR: MS User's Manual © 2013 Geocomp Corp. A: In theory, ShearTrac-II should be capable of running this special test. However, we would need a customized control software program (not currently available) with an entry for constant stiffness. Then the program would vary both the vertical load and the vertical displacement as needed to keep the specified stiffness constant throughout the consolidation phase. Similarly, when the shear phase is run, the vertical load would be varied so that a constant height of the sample would be maintained. Since the area does not change, this would result in keeping the volume constant. The resulting change of vertical stress, Δσv, is indirectly equated to the change of excess pore pressure, ∆u. VI-8. Q: In what unit is the shear rate? The software program shows the Rate as (/min) with no unit in the numerator? A: The unit for rate depends on the Shear Control parameter you have chosen. If you have chosen Displacment, the rate is mm/min (or in/min) for the metric (or English) choice of units (see first example at right). if you have chosen Force, the rate is N/min (or lb/min) for the metric (or English) choice of units (see second example at right). If you wish, you can choose a different unit for time. (The choice of units is made on the window opened by selecting the Units item on the Options menu.) Then the heading in the Rate column would show (/chosen time unit) and the rate would be either Distance/chosen time unit or Force/chosen time unit depending on the choice in ghe Shear Control column. VI-9. Q: I have been getting a consistent “jump” in the shear stress curve at around 2.54 mm (0.1 in) horizontal displacement. See attached. What could be the reason? A: This could be attributed to something mechanical getting in the way at about the 2.5 mm mark. Check the gap in the shear box to be sure the two halves of the box are free to move relative to each other. Check the region around the water bath box to be sure nothing Geocomp Corporation · 125 Nagog Park · Acton, MA 01720 · Tel 978-635-0012 · Fax 978-635-0266 DSHEAR: MS User's Manual © 2013 Geocomp Corp. is close to it. Check under the water bath box to be sure there is nothing there that might hinder its movement. VI-10. Q: The shear rate seems to be varying during the shear phase. I want to make sure that the test is running according the standard. Any comments? A: According to ASTM standard D 3080, the rate should be maintained with less than ±5 % of the target value. (See section 6.4.2 below.) “6.4.2 Device for Shearing the Specimen—The device shall be capable of shearing the specimen at a uniform rate of displacement, with less than ±5 percent deviation, and should permit adjustment of the rate of displacement from 0.0001 to 0.04 in./min (.0025 to 1.0 mm/min). The rate to be applied depends upon the consolidation characteristics of the soils (see 9.12.1). The rate is usually maintained with an electric motor and gear box arrangement and the shear force is determined by a load indicating device such as a proving ring or load cell.” The value shown on the Test Monitor window during the shear phase is based on the displacement transducer. But the actual rate is produced by the micro-stepper motor which is more accurate and precise than the displacement transducer. Typically the displacement transducer is slightly non-linear and has a resolution of 1.2 x10⁻³ mm/count whereas the micro-stepper motor will run at a constant rate and has a resolution of 5.3 x10⁻⁵ mm/step. If both the displacement produced by the micro-stepper motor and the displacement determined by the sensor are plotted as a function of time and the linear correlation, R2, is determined for each, the results show that the correlation for the micro-stepper motor plot is exactly equal to one. This confirms that the test will run well within the standard of ±1 % of the target value. Geocomp Corporation · 125 Nagog Park · Acton, MA 01720 · Tel 978-635-0012 · Fax 978-635-0266 DSHEAR: MS User's Manual © 2013 Geocomp Corp. Displacement Rates Analysis 10 8 y = 0.0137x - 0.3159 R2 = 0.9997 Displacement, mm 6 y = 0.0127x - 0.1328 2 R =1 4 2 From Micro-Steps From Displ. Sensor 0 0 100 200 300 400 500 600 700 800 -2 Time, minutes VII-11. Q: I am running triaxial and direct shear tests with the same specimen properties under the same conditions? Why do the strength parameters not match? A: There are fundamental differences between direct shear test and triaxial tests. The major difference is in the direct shear test, you are forcing the failure plane (interface between top and bottom shear box). In many cases, the strength parameters you obtain in the direct shear test may be overestimations because you are not necessarily failing the specimen along the weakest plane. During the shear phase of a triaxial test, you are failing the specimen along the weakest plane. Geocomp Corporation · 125 Nagog Park · Acton, MA 01720 · Tel 978-635-0012 · Fax 978-635-0266