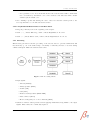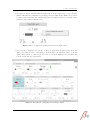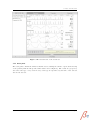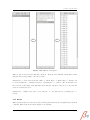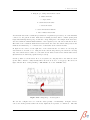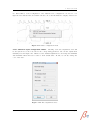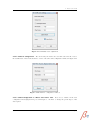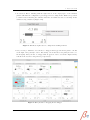
1
Better Care, S.L.
“Better Care” platform
user manual
V 1.0.1.584 Rev.A
“Better Care”, S.L.
Parc Taulı́ 1, Edifici Santa Fe.
Sabadell 08208, Spain
Version control
Release
Author
Data
1.0.0.405A
Jaume Montanyà, Daniel Alomar
Feb-2012
1.0.0.532A
Jaume Montanyà, Bernat Sales
May-2012
1.0.1.546A
Jaume Montanyà, Bernat Sales
Jun-2012
Changes
First version
Added PACS configuration and
the “Better Care Client” description
“Better Care Client” minor
changes
Contents
1 Hardware requirements
1
2 What is “Better Care”?
2.1 Description of the “Better Care” platform . . . . . . . . . . . . . . . . . . . . . . .
2
2
3 Better Care Net Server
3.1 Report . . . . . . . . . . . . . . . . . . . . . . . . . . . . . . . . . . . . .
3.2 Monitoring . . . . . . . . . . . . . . . . . . . . . . . . . . . . . . . . . .
3.2.1 Waves Panel (Basic) . . . . . . . . . . . . . . . . . . . . . . . . .
3.2.2 Waves Panel (Advanced) . . . . . . . . . . . . . . . . . . . . . .
3.2.2.1 Waveform aspect configuration window. . . . . . . . . .
3.2.2.2 Numeric configuration. . . . . . . . . . . . . . . . . . .
3.2.2.3 Global configuration of “Better Care Net Server” look.
3.2.2.4 Keyboard and Mouse Events on the Wave Panel. . . . .
3.2.3 Processing . . . . . . . . . . . . . . . . . . . . . . . . . . . . . . .
3.2.3.1 General view of the interface. . . . . . . . . . . . . . . .
3.2.3.1.1 Visualization options . . . . . . . . . . . . . .
3.2.3.2 Alarm Configuration . . . . . . . . . . . . . . . . . . . .
3.2.3.2.1 Interactive buttons . . . . . . . . . . . . . . .
3.2.3.3 Alarm Log (Alarm Report) . . . . . . . . . . . . . . . .
3.2.3.3.1 Actions on Alarm Log . . . . . . . . . . . . . .
3.3 Review . . . . . . . . . . . . . . . . . . . . . . . . . . . . . . . . . . . . .
3.3.1 Event panel . . . . . . . . . . . . . . . . . . . . . . . . . . . . . .
3.3.2 Review . . . . . . . . . . . . . . . . . . . . . . . . . . . . . . . .
3.3.2.1 Reproduction options of the waves review panel. . . . .
3.3.2.2 Keyboard and mouse events on waves panel. . . . . . .
3.3.3 Trends . . . . . . . . . . . . . . . . . . . . . . . . . . . . . . . . .
3.3.4 Alarms . . . . . . . . . . . . . . . . . . . . . . . . . . . . . . . .
3.4 Cameras . . . . . . . . . . . . . . . . . . . . . . . . . . . . . . . . . . . .
3.5 Local data storage . . . . . . . . . . . . . . . . . . . . . . . . . . . . . .
4 Better Care Client
4.1 Better Care Client configuration . . . . . . . . . . . . . . . . . . .
4.1.1 Better Care Client Server Directory configuration . . . . . .
4.1.1.1 Servers management . . . . . . . . . . . . . . . . .
4.2 General view of Better Care Client . . . . . . . . . . . . . . . . . .
4.2.1 ICU bed pre-selection view . . . . . . . . . . . . . . . . . .
4.2.2 General view of ICU bed . . . . . . . . . . . . . . . . . . .
4.3 Monitoring . . . . . . . . . . . . . . . . . . . . . . . . . . . . . . .
4.3.1 Waves Panel (Basic) . . . . . . . . . . . . . . . . . . . . . .
4.3.2 Waves Panel (Advanced) . . . . . . . . . . . . . . . . . . .
4.3.2.1 Waveform aspect configuration window. . . . . . .
4.3.2.2 Numeric configuration. . . . . . . . . . . . . . . .
4.3.2.3 Global configuration of “Better Care Client” look.
.
.
.
.
.
.
.
.
.
.
.
.
.
.
.
.
.
.
.
.
.
.
.
.
.
.
.
.
.
.
.
.
.
.
.
.
.
.
.
.
.
.
.
.
.
.
.
.
.
.
.
.
.
.
.
.
.
.
.
.
.
.
.
.
.
.
.
.
.
.
.
.
.
.
.
.
.
.
.
.
.
.
.
.
.
.
.
.
.
.
.
.
.
.
.
.
.
.
.
.
.
.
.
.
.
.
.
.
.
.
.
.
.
.
.
.
.
.
.
.
.
.
.
.
.
.
.
.
.
.
.
.
.
.
.
.
.
.
.
.
.
.
.
.
.
.
.
.
.
.
.
.
.
.
.
.
.
.
.
.
.
.
.
.
.
.
.
.
.
.
.
.
.
.
.
.
.
.
.
.
.
.
.
.
.
.
.
.
.
.
.
.
.
.
.
.
.
.
.
.
.
.
.
.
.
.
.
.
.
.
.
.
.
.
.
.
.
.
.
.
.
.
.
.
.
.
.
.
.
.
.
.
.
.
.
.
.
.
.
.
4
5
5
5
7
9
10
10
12
12
13
13
16
17
17
18
18
19
20
21
22
22
24
24
25
.
.
.
.
.
.
.
.
.
.
.
.
27
27
27
28
29
30
31
32
32
34
36
37
37
Contents
4.4
4.5
4.3.2.4 Keyboard and Mouse Events on the Wave Panel.
4.3.3 Processing . . . . . . . . . . . . . . . . . . . . . . . . . . .
4.3.3.1 General view of the interface. . . . . . . . . . . .
4.3.3.1.1 Visualization options . . . . . . . . . .
4.3.3.2 Alarm Configuration . . . . . . . . . . . . . . . .
4.3.3.2.1 Interactive buttons . . . . . . . . . . .
4.3.3.3 Alarm Log (Alarm Report) . . . . . . . . . . . .
4.3.3.3.1 Actions on Alarm Log . . . . . . . . . .
Review . . . . . . . . . . . . . . . . . . . . . . . . . . . . . . . . .
4.4.1 Study Download . . . . . . . . . . . . . . . . . . . . . . .
4.4.1.1 Day Report Download . . . . . . . . . . . . . . .
4.4.1.2 Downloading the full session . . . . . . . . . . .
4.4.2 Event panel . . . . . . . . . . . . . . . . . . . . . . . . . .
4.4.3 Review . . . . . . . . . . . . . . . . . . . . . . . . . . . .
4.4.3.1 Reproduction options of the waves review panel.
4.4.3.2 Keyboard and mouse events on waves panel. . .
4.4.4 Trends . . . . . . . . . . . . . . . . . . . . . . . . . . . . .
4.4.5 Alarms . . . . . . . . . . . . . . . . . . . . . . . . . . . .
Cameras . . . . . . . . . . . . . . . . . . . . . . . . . . . . . . . .
.
.
.
.
.
.
.
.
.
.
.
.
.
.
.
.
.
.
.
.
.
.
.
.
.
.
.
.
.
.
.
.
.
.
.
.
.
.
.
.
.
.
.
.
.
.
.
.
.
.
.
.
.
.
.
.
.
.
.
.
.
.
.
.
.
.
.
.
.
.
.
.
.
.
.
.
.
.
.
.
.
.
.
.
.
.
.
.
.
.
.
.
.
.
.
.
.
.
.
.
.
.
.
.
.
.
.
.
.
.
.
.
.
.
.
.
.
.
.
.
.
.
.
.
.
.
.
.
.
.
.
.
.
.
.
.
.
.
.
.
.
.
.
.
.
.
.
.
.
.
.
.
.
.
.
.
.
.
.
.
.
.
.
.
.
.
.
.
.
.
.
.
.
.
.
.
.
.
.
.
.
.
.
.
.
.
.
.
.
.
39
39
40
40
43
44
44
45
45
46
46
48
49
50
51
51
52
53
53
5 Better Care Review
55
6 Better Care Mobile Server
56
USER MANUAL
Page 4
List of Figures
2.1
3.1
3.2
3.3
3.4
3.5
3.6
3.7
3.8
3.9
3.10
3.11
3.12
3.13
3.14
3.15
3.16
3.17
3.18
3.19
3.20
3.21
3.22
3.23
3.24
3.25
3.26
3.27
3.28
3.29
4.1
4.2
4.3
4.4
4.5
4.6
4.7
4.8
4.9
4.10
4.11
4.12
4.13
Connection scheme of the “Better Care” platform . .
“Net Server” general view . . . . . . . . . . . . . . .
Navigability scheme in “Better Care Net Server” . .
Waves visualization region . . . . . . . . . . . . . . .
User interaction capabilities of Waves Panel . . . . .
“Drag/Drop” over Waves Panel . . . . . . . . . . . .
Waveform configuration menu . . . . . . . . . . . . .
Auto-adjustment active. . . . . . . . . . . . . . . . .
Manual Scale adjustment . . . . . . . . . . . . . . .
Numeric configuration window . . . . . . . . . . . .
Profile modifying . . . . . . . . . . . . . . . . . . . .
Processing scheme . . . . . . . . . . . . . . . . . . .
Variable Box (Variable Container) . . . . . . . . . .
Variable Box different states . . . . . . . . . . . . . .
tool strip menu clicking with the mouse right button
1)Result of dragging Double Trigger Alarm . . . . .
1)Result of dropping Double Trigger Alarm . . . . .
Groups of alarms depending on its kind . . . . . . .
Trapped Air configuration . . . . . . . . . . . . . . .
Interactive Buttons . . . . . . . . . . . . . . . . . . .
Alarm log . . . . . . . . . . . . . . . . . . . . . . . .
General view of the review tab . . . . . . . . . . . .
Clinical events panel . . . . . . . . . . . . . . . . . .
Waves revision panel . . . . . . . . . . . . . . . . . .
Waves reproduction controls . . . . . . . . . . . . . .
Waves reproduction information region . . . . . . . .
Trends panel detail . . . . . . . . . . . . . . . . . . .
Alarms distribution visualization panel . . . . . . . .
Camera control region . . . . . . . . . . . . . . . . .
“Net Server” folder structure . . . . . . . . . . . . .
Better Care Client configuration strip menu . . . . .
Manage Servers Window . . . . . . . . . . . . . . . .
Selected servers management . . . . . . . . . . . . .
ICU bed pre-selection view . . . . . . . . . . . . . .
Preview of ICU bed . . . . . . . . . . . . . . . . . .
Better Care Client with a selected ICU bed . . . . .
Navigability scheme of “Better Care Client” . . . . .
Waves visualization region . . . . . . . . . . . . . . .
Waves panel user interaction capabilities . . . . . . .
“Drag/Drop” on waves panel . . . . . . . . . . . . .
Wave configuration menu . . . . . . . . . . . . . . .
Auto-adjustment active. . . . . . . . . . . . . . . . .
Manual Scale adjustment . . . . . . . . . . . . . . .
.
.
.
.
.
.
.
.
.
.
.
.
.
.
.
.
.
.
.
.
.
.
.
.
.
.
.
.
.
.
.
.
.
.
.
.
.
.
.
.
.
.
.
.
.
.
.
.
.
.
.
.
.
.
.
.
.
.
.
.
.
.
.
.
.
.
.
.
.
.
.
.
.
.
.
.
.
.
.
.
.
.
.
.
.
.
.
.
.
.
.
.
.
.
.
.
.
.
.
.
.
.
.
.
.
.
.
.
.
.
.
.
.
.
.
.
.
.
.
.
.
.
.
.
.
.
.
.
.
.
.
.
.
.
.
.
.
.
.
.
.
.
.
.
.
.
.
.
.
.
.
.
.
.
.
.
.
.
.
.
.
.
.
.
.
.
.
.
.
.
.
.
.
.
.
.
.
.
.
.
.
.
.
.
.
.
.
.
.
.
.
.
.
.
.
.
.
.
.
.
.
.
.
.
.
.
.
.
.
.
.
.
.
.
.
.
.
.
.
.
.
.
.
.
.
.
.
.
.
.
.
.
.
.
.
.
.
.
.
.
.
.
.
.
.
.
.
.
.
.
.
.
.
.
.
.
.
.
.
.
.
.
.
.
.
.
.
.
.
.
.
.
.
.
.
.
.
.
.
.
.
.
.
.
.
.
.
.
.
.
.
.
.
.
.
.
.
.
.
.
.
.
.
.
.
.
.
.
.
.
.
.
.
.
.
.
.
.
.
.
.
.
.
.
.
.
.
.
.
.
.
.
.
.
.
.
.
.
.
.
.
.
.
.
.
.
.
.
.
.
.
.
.
.
.
.
.
.
.
.
.
.
.
.
.
.
.
.
.
.
.
.
.
.
.
.
.
.
.
.
.
.
.
.
.
.
.
.
.
.
.
.
.
.
.
.
.
.
.
.
.
.
.
.
.
.
.
.
.
.
.
.
.
.
.
.
.
.
.
.
.
.
.
.
.
.
.
.
.
.
.
.
.
.
.
.
.
.
.
.
.
.
.
.
.
.
.
.
.
.
.
.
.
.
.
.
.
.
.
.
.
.
.
.
.
.
.
.
.
.
.
.
.
.
.
.
.
.
.
.
.
.
.
.
.
.
.
.
.
.
.
.
.
.
.
.
.
.
.
.
.
.
.
.
.
.
.
.
.
.
.
.
.
.
.
.
.
.
.
.
.
.
.
.
.
.
.
.
.
.
.
.
.
.
.
.
.
.
.
.
.
.
.
.
.
.
.
.
.
.
.
.
.
.
.
.
.
.
.
.
.
.
.
.
.
.
.
.
.
.
.
.
.
.
.
.
.
.
.
.
.
.
.
.
.
.
.
.
.
.
.
.
.
.
.
.
.
.
.
.
.
.
.
.
.
.
.
.
.
.
.
.
.
.
.
.
.
.
.
.
.
.
.
.
.
.
.
.
.
.
.
.
.
.
.
.
.
.
.
.
.
.
.
.
.
.
.
.
.
.
.
.
.
.
.
.
.
.
.
.
.
.
.
.
.
.
.
.
.
.
.
.
.
.
.
.
.
.
.
.
.
.
.
.
.
.
.
.
.
.
.
.
.
.
.
.
.
.
.
.
.
.
.
.
.
.
.
.
.
.
.
.
.
.
.
.
.
.
.
.
.
.
.
.
.
.
.
.
.
.
.
2
4
5
6
7
8
9
9
10
10
11
12
13
13
14
14
15
16
17
17
18
19
20
21
21
22
23
24
25
26
27
28
29
30
30
31
32
33
34
35
36
36
37
List of Figures
4.14
4.15
4.16
4.17
4.18
4.19
4.20
4.21
4.22
4.23
4.24
4.25
4.26
4.27
4.28
4.29
4.30
4.31
4.32
4.33
4.34
4.35
4.36
4.37
Numeric configuration window . . . . . . . . . . . .
Profile customization . . . . . . . . . . . . . . . . . .
Processing scheme . . . . . . . . . . . . . . . . . . .
Variable Box (Variable Container) . . . . . . . . . .
Variable Box different states . . . . . . . . . . . . . .
Mouse right button toolstrip menu clicking with the
Result of dragging P Plat . . . . . . . . . . . . . . .
Result of dropping P Plat . . . . . . . . . . . . . . .
Alarms grouping . . . . . . . . . . . . . . . . . . . .
Trapped Air configuration . . . . . . . . . . . . . . .
Interactive Buttons . . . . . . . . . . . . . . . . . . .
Alarm log . . . . . . . . . . . . . . . . . . . . . . . .
General View of the Review tab . . . . . . . . . . . .
Studyies without beeing downloaded . . . . . . . . .
Downloading studies . . . . . . . . . . . . . . . . . .
Download full session button and advice . . . . . . .
Downloaded study (2012-05-21 (1)) . . . . . . . . . .
Clinical events panel . . . . . . . . . . . . . . . . . .
Waves revision panel . . . . . . . . . . . . . . . . . .
Waves reproduction controls . . . . . . . . . . . . . .
Waves reproduction information region . . . . . . . .
Trends panel detail . . . . . . . . . . . . . . . . . . .
Alarms distribution visualization panel . . . . . . . .
Camera control region . . . . . . . . . . . . . . . . .
USER MANUAL
.
.
.
.
.
.
.
.
.
.
.
.
.
.
.
.
.
.
.
.
.
.
.
.
.
.
.
.
.
.
.
.
.
.
.
.
.
.
.
.
.
.
.
.
.
.
.
.
.
.
.
.
.
.
.
.
.
.
.
.
.
.
.
.
.
.
.
.
.
.
.
.
.
.
.
.
.
.
.
.
.
.
.
.
.
.
.
.
.
.
.
.
.
.
.
.
.
.
.
.
.
.
.
.
.
.
.
.
.
.
.
.
.
.
.
.
.
.
.
.
.
.
.
.
.
.
.
.
.
.
.
.
.
.
.
.
.
.
.
.
.
.
.
.
.
.
.
.
.
.
.
.
.
.
.
.
.
.
.
.
.
.
.
.
.
.
.
.
.
.
.
.
.
.
.
.
.
.
.
.
.
.
.
.
.
.
.
.
.
.
.
.
.
.
.
.
.
.
.
.
.
.
.
.
.
.
.
.
.
.
.
.
.
.
.
.
.
.
.
.
.
.
.
.
.
.
.
.
.
.
.
.
.
.
.
.
.
.
.
.
.
.
.
.
.
.
.
.
.
.
.
.
.
.
.
.
.
.
.
.
.
.
.
.
.
.
.
.
.
.
.
.
.
.
.
.
.
.
.
.
.
.
.
.
.
.
.
.
.
.
.
.
.
.
.
.
.
.
.
.
.
.
.
.
.
.
.
.
.
.
.
.
.
.
.
.
.
.
.
.
.
.
.
.
.
.
.
.
.
.
.
.
.
.
.
.
.
.
.
.
.
.
.
.
.
.
.
.
.
.
.
.
.
.
.
.
.
.
.
.
.
.
.
.
.
.
.
.
.
.
.
.
.
.
.
.
.
.
.
.
.
.
.
.
.
.
.
.
.
.
.
.
.
.
.
.
.
.
.
.
.
.
.
.
.
.
.
.
37
38
39
40
40
41
41
42
43
44
44
45
46
47
47
48
49
50
51
51
51
52
53
54
Page 6
WARNING:
The Better Care software is not intended to replace the main alarm notification
system, and must not replace personnel monitoring neither clinicians criterium.
INTENDED USE:
The Better Care software provides clinical staff a monitoring support system,
including clinical parameters (generated by monitoring devices) remote visualization, as well as its storage. Alarms triggered by the system must be analyzed and
interpreted by an expert clinician only.
1
Hardware requirements
1 Hardware requirements
The minimum requirements to run each “Better Care” platform component are:
Software
BC Net Server
BC Server Directory
BC Review
CPU
1 GHz 32 or 64 bit
1 GHz 32 or 64 bit
RAM
1 GB
1 GHz 32 or 64 bit
4 GB - 16 GB
(Depending on the
number of NS connected)
OS
Windows 98 or higher
5 GB (Depending on local
data that are to be kept)
Microsoft .NET
Framework 3.5 SP1 or
higher
Windows 98 or higher
Windows 98 or higher
50 MB
50 MB
Microsoft .NET
Framework 3.5 SP1 or
higher
Microsoft .NET
Framework 3.5 SP1 or
higher
-
-
LAN: 1 Gb starting from
10 connections
-
HDD
Other req.
Videocam
Serie-Ethernet
Any Axis PTZ
Lantronix EDS4100 (4
ports) or UDS2100 (2
ports) for serial devices
1 GB
Table 1.1: “Net Server”, “Server Directory” and “Review” applications requirements
Software
BC Mobile Server
BC Client
CPU
1 GHz 32 or 64 bit
1 GHz 32 or 64 bit
RAM
1 GB
1 GB
OS
Windows 98 or higher
5 GB (Depending on local
data that are to be kept)
Microsoft .NET
Framework 3.5 SP1 or
higher
Windows 98 or higher
5 GB (Depending on local
data that are to be kept)
Microsoft .NET
Framework 3.5 SP1 or
higher
Any Axis PTZ
Lantronix EDS4100 (4
ports) or UDS2100 (2
ports) for serial devices
-
HDD
Other req.
Videocam
Serie-Ethernet
LAN
Table 1.2: “Mobile” and “Client” application requirements
Note: Due to the feature of showing in “real time” biomedical signals, it is recommended connecting through a VLAN network medical devices with computers where “Net Server” has been
installed.
USER MANUAL
Page 1
2
What is “Better Care”?
2 What is “Better Care”?
2.1 Description of the “Better Care” platform
”‘Better Care”’ is a software platform that captures biomedical signals from a wide range of
medical devices (monitors, invasive ventilators, non invasive ventilators) providing an important
economical saving for Hospitals and Clinics when integrating and centralizing these data.
The “Better Care” platform integrates, processes (in real time) and stores data according to the
DICOM standard. This allows an offline analysis once data have been saved, with the possibility
to export data to many different formats (TXT, XLS, CSV, XML, ...).
The “Better Care” platform is composed of the following elements:
• “Net Server”: Biomedical signals capture, itengration, analysis and Server Directory real
time data sending.
• “Mobile”: A “Net Server” version optimized for mobile vehicles.
• “Server Directory”: Centralizes data sent by one or more “Net Servers” and serves them to
the “Clients” asking for them.
• “Client”: “Server Directory” data (sent by “Net Servers”) real time visualization.
• “Review”: Offline stored data review and analysis.
This is a connection scheme of the elements composing the “Better Care” platform:
Figure 2.1: Connection scheme of the “Better Care” platform
USER MANUAL
Page 2
2
What is “Better Care”?
The system is also powered with medical knowledge by means of parametric alarms based on
complex algorithms aimed to improve patient security.
Functionalities:
• Simple, intuitive and easily customizable interface.
• Unique and homogeneous interface for a wide heterogeneous range of medical devices.
• Saving in medical devices integration.
• Biomedical signals visualization from anywhere in the world with just a simple Internet
connection (“Better Care Client” software).
• Customizable alarms depending on patient and clinician needs.
• Offline data and clinical events revision (“Better Care Review” software).
• Ideal for teaching purposes (“Better Care Review” software)
• Biomedical signals capture and integration with Hospital Information Systems and PACS by
using the HL7 standard.
USER MANUAL
Page 3
3
Better Care Net Server
3 Better Care Net Server
“Net server” is the tool placed at the patient side, responsible of real time biomedical signals
acquisition, processing, ditribution and storage. “Net Server” contains all the elements needed
to monitor and diagnose the patient, grouped by tags. The elements shown in Figure 3.1 are
explained in the following sections.
Figure 3.1: “Net Server” general view
1. Secondary selection tabs.
2. Main selection tabs.
3. Camera region.
4. Real-Time wave panel.
5. Real-Time Alarm Label.
Visible tabs can be in 3 different states:
• Active and selected: Determines the content to show in the elements depending on it.
In figure 3.1, ‘Monitoring’ is the main active and selected tab and ‘Waves’ is the selected
depending one. Active and selected tabs are drawn with a dark background and white text.
• Active and not selected: Active tabs, not selected at the moment but selectable by the
user. In figure 3.1, ‘Revision’ is a main active and not selected tab; “Processing” would
be the corresponding dependant one. Active and not selected tabs are drawn with a bright
background and dark text.
USER MANUAL
Page 4
3
Better Care Net Server
• Inactive: Non selectable tabs. In figure 3.1, “Report” is an inactive tab. Inactive tabs are
drawn with bright background and text.
The following scheme shows the visible elements, grouped by the three main tabs.
Figure 3.2: Navigability scheme in “Better Care Net Server”
3.1 Report
This tab will be enabled if “Net Server” can access the Hospital Information System; it will
include patient data at entry as well as clinical data collected day by day.
3.2 Monitoring
The monitoring tab shows the current session state in real time. This includes waves visualization
(“Waves”), processing or alarm variables (“Processing”) and also remote cameras visualization
and manipulation panel.
3.2.1 Waves Panel (Basic)
Real time configured biomedical waves and constants visualization. Together with the waves and
constants panels, there are 3 interactive buttons -Figure 4.8- allowing:
• “-”: Zoom out.
USER MANUAL
Page 5
3
Better Care Net Server
• “Profiles”: Modifies the visual aspect of these regions.
• “+”: Zoom in.
Figure 3.3: Waves visualization region
1. Wave Panel interactive Buttons.
USER MANUAL
Page 6
3
Better Care Net Server
3.2.2 Waves Panel (Advanced)
Figure 3.4: User interaction capabilities of Waves Panel
USER MANUAL
Page 7
3
Better Care Net Server
1. Drag-drop to change waveform’s location.
2. Waveform name.
3. elapsed time.
4. current waveform value.
5. waveform scales.
6. waveform attached numeric.
7. list for hidden waveforms.
A biomedical wave is the continuous representation of a parameter provided by one of the machines
connected to the patient in time. This wave is usually presented with a constant (trend) that
helps understanding what’s going on with the corresponding wave. An example is the heart rate,
associated with the different ECG channels or the respiratory rate, associated with the air flow.
The name of the constant is drawn in the header and at the center the current value (between the
minScale and maxScale) or ’ ?’ if there is not a valid value at the current moment.
In figure 3.4 we can see at the right side of the waveforms the box where we can drag the
waveforms we don’t want to see. Using the mouse and the drag and drop movement we can drag
any of the visible waves to this box, so the same area is divided between the current visible waves
(hidden waves are still being captured and processed).
It’s also possible to sort the waves. To do it, we just need to drag any wave to the desired location
(a line will be drawn to easily identify where the wave is about to be dropped). We can see in
figure 3.5 the effect of Drag and Drop “AIR FLOW” above the “PLETH” wave.
Figure 3.5: “Drag/Drop” over Waves Panel
We can also configure the look of all the waves globally or individually. In figure 3.6 we can
see the menu generated when the mouse right-button is pressed on “Air Flow”. The first
USER MANUAL
Page 8
3
Better Care Net Server
two funcionalities, “Serie Configuration” and “Numeric serie configuration” are used to configure the wave and its trend, and “Chart” allows to choose the information to display on the screen.
Figure 3.6: Waveform configuration menu
3.2.2.1 Waveform aspect configuration window. Checking “scale auto-adjustment” ?? will
let the system choose the best scale for the corresponding parameter. We can also adjust them
manually as seen in figure ??. When we select manual adjustment we can change the minimum
and maximum values and restore scales to their default value. At last, we can also change the
color of the wave.
Figure 3.7: Auto-adjustment active.
USER MANUAL
Page 9
3
Better Care Net Server
Figure 3.8: Manual Scale adjustment
3.2.2.2 Numeric configuration. We can modify the max scale, the min scale and also restore
the default scale of the trend attached to a wave. We can se this configuration window in figure 3.9.
Figure 3.9: Numeric configuration window
3.2.2.3 Global configuration of “Better Care Net Server” look. If we choose “Chart” in the
serie configuration menu (Figura 3.6), we can navigate to “Profiles” to change the global aspect
of the waves panel.
USER MANUAL
Page 10
3
Better Care Net Server
The options “load” and “Manage” profiles allows loading and modifying the configuration
profiles created with “Profile Management”, that can be accessed through the option “Modify”
in the profile menu (and also by clicking the “Profiles” button) to change the colors used, the
representation environment and configure “Better Care Net Server” as desired.
The window shown when selecting “Modify” is displayed in figure 3.10)
Figure 3.10: Profile modifying
The parameters are:
• Profiles: List of profiles already created. By default only two profiles appear, default and
dark profile.
• Chart attributes:
– Background color.
– Parameter color: Text and waves color.
– Refresh interval: Refresh time/update in milliseconds (the lower it is, the smoother the
waves are drawn).
– Wave representation: Line or area waves representation.
– Grid: Shows/hides a grid in the background.
– High quality : Turns on/off smoothing when drawing waves.
USER MANUAL
Page 11
3
Better Care Net Server
– Force parameter color: if we check this checkbox the texts and waves will be drawn with
the color defined by “Parameter color”; if not checked, texts and waves will be drawn
with the system default color.
• Save: Naming a profile and clicking the “Save” button we adds the current profile to the
stored profiles list to be modified and selected later.
3.2.2.4 Keyboard and Mouse Events on the Wave Panel.
• Drag/drop: Already seen at the beginning of the chapter.
• Cntrl + ’+’ / Mouse Wheel up / Cntrl + Mouse Right-Button: Zoom in.
• Cntrl + ’-’ / Mouse Wheel down / Cntrl + Mouse Right-Button: Zoom out.
3.2.3 Processing
This module performs a real time processing of the selected waves to generate alarms that will
rise when they go out of the defined range of normality or when they increase or decrease during
a limited timespan. This is how this module works:
Figure 3.11: Processing scheme
• Input signals:
– Air flow (FLOW)
– Airway pressure (PAW)
– Volume (VT)
– CO2 (CO2)
– Invasive arterial pressure (PRES ART)
– Pulse oximeter (SPO2)
– Electrocardiogram (one or more channels) (ECG)
• Variables: numeric values generated when applying mathematical algorithms to the input
signals. These values are continuously updated.
USER MANUAL
Page 12
3
Better Care Net Server
• Alarms: An alarm is associated to a variable. An alarm will be triggered when the variable
goes out of range.
3.2.3.1 General view of the interface. The processing interface can be accessed by pressing the
“Processing” tab. It displays the variables being processed at the current moment and its current
state and value. Variables are displayed as boxes that can also be sorted. These boxes display the
following information (Figure 3.12).
Figure 3.12: Variable Box (Variable Container)
1. Variable name.
2. Value and Units.
3. Value Bar.
4. last hour event counter and percentage.
5. Drawable events (last hour).
6. 24 hour event counter and percentage.
The Variable Boxes or Variable containers can change its appearance depending on factors such
as its type, alarm limits and current state. A Variable Box can be presented as:
Figure 3.13: Variable Box different states
3.2.3.1.1 Visualization options All the available variables and alarms (its availability depends
on the input signals) are visible in the alarm panel. This can be modified through the visualization
menu or by a drag/drop action.
USER MANUAL
Page 13
3
Better Care Net Server
• Visualization Menu: Clicking with the right button on the empty space of the variables
panel it will make the configuration options appear as a toolstrip menu. With it, it’s possible
to switch between showing the variables that have an alarm associated or showing all the
variables being calculated (Figure 3.14).
Figure 3.14: tool strip menu clicking with the mouse right button
• Drag and Drop: Variable boxes can also be drag dropped from the panel to the list at the
right of the panel (in order to hide them) or from the list to the panel (in order to be shown
again). They can also be drag dropped in order to sort them. Figures 3.15 y 3.16 show the
actions of drag and drop respectively.
Figure 3.15: 1)Result of dragging Double Trigger Alarm
USER MANUAL
Page 14
3
Better Care Net Server
Figure 3.16: 1)Result of dropping Double Trigger Alarm
• Alarms grouping: Alarms are automatically grouped depending on their type. Each group
can be reordered by following the method described before. By clicking on the name of the
group, all corresponding variable boxes will be shown or hidden.
USER MANUAL
Page 15
3
Better Care Net Server
Figure 3.17: Groups of alarms depending on its kind
3.2.3.2 Alarm Configuration Configuration of a variable alarm limitsis done through the form
of alarm limit configuration. This limits fix the normality minimum and maximum values, so
when the current value is out of this range, the corresponding variable enters in alarm state.
Access to this form is done by pressing the mouse right button on the variable box we want to
configure and selecting “Configure parameter X” or by clicking on the value bar with the mouse
left button. In figure 3.17 we can see the Alarm configuration form.
USER MANUAL
Page 16
3
Better Care Net Server
Figure 3.18: Trapped Air configuration
It is also possible to modify the normality limits without opening the configuration window. This
can be done by dragging the minimum or maximum limit in the variable box to the desired value.
3.2.3.2.1 Interactive buttons
The three interactive buttons -Figure 3.19- allow:
• “Activate All”: Activates all the alarms with at least a minimum or a maximum limit set.
• “Edit”: Initiates edition mode to configure or activate/deactivate each variable individually.
• “Disable All”: Disables all the alarms.
Figure 3.19: Interactive Buttons
3.2.3.3 Alarm Log (Alarm Report) This window (“Alarm Log”) appears when clicking a
variable box with one or more alarms occurred during the last hour. It displays a region where
the alarm is shown as an image and another region with the thumbnails of the different alarms
that have also been detected during the last hour, ordered by the time they were detected. The
figure 3.20 show the “Alarm Log”.
USER MANUAL
Page 17
3
Better Care Net Server
3.2.3.3.1 Actions on Alarm Log The interaction with the alarm log window is done by using
the keyboard and the mouse:
• Next Alarm: Next alarm can be selected by pressing the → key. Drag and drop can also be
used on the list to reach the thumbnail we want to expand.
• Previous Alarm: Previous can be selected by pressing the ← key. Drag and drop can also be
used on the list to reach the thumbnail we want to expand.
• Last Alarm: Last alarm can be directly accessed by pressing the push the “>>” button.
• First Alarm: Last alarm can be directly accessed by pressing the push the “<<” button.
Figure 3.20: Alarm log
3.3 Review
The review tab contains the elements showing patient’s previous state, including a clinical events
panel, stored waves visualization, registered trends (per hour) and a panel showing clinical events
distribution during all day (“Alarms”).
USER MANUAL
Page 18
3
Better Care Net Server
Figure 3.21: General view of the review tab
3.3.1 Event panel
The event panel contains the clinical events list detected during the current or previous monitoring
of the patient (with the ID specified when session was configured). The events are grouped by
date and event type; every event in every event type is represented by the time of the selected
date it was detected.
USER MANUAL
Page 19
3
Better Care Net Server
Figure 3.22: Clinical events panel
When a date is selected in the first list, “Review”, “Trends” and “Alarms” charts will be filled
with the data corresponding to the selected date.
Navigation to a lower level in the list (‘Date’ to ‘Event Type’ or ‘Event Type’ to ‘Event’) can
be done pressing the “→”(right arrow) key or pressing the “>” button. Once in the last level,
the selection of any single event will make data chart (in “Revision” tab) move to the time the
selected event was detected.
Navigation to a higher level can be done with the “←” key (left arrow) or pressing the “<”
button.
3.3.2 Review
When review tab is selected in review, waves revision panel shows the stored signals and biomedical
constants. Three buttons are shown -Figure 3.23- allowing:
USER MANUAL
Page 20
3
Better Care Net Server
• “-”: Performs a ‘zoom out’.
• “Profiles”: Customization of the look and characteristics of the waves and constants.
• “+”: Performs a ‘zoom in’.
Figure 3.23: Waves revision panel
This panel is shown similarly to the waves panel previously described, but also includes a
navigation bar, similar to a media player.
3.3.2.1 Reproduction options of the waves review panel. Reproduction options can be accessed
by the navigation bar at the bottom of the panel where waves are shown. This navigation bar
allows the manipulation of the current monitoring similarly to a standard media player. Figure
3.24 explains the function of each button in the bar region.
Figure 3.24: Waves reproduction controls
1. previous event.
2. decrease simulation speed.
3. Backwards and Normal Play Buttons.
4. Zoom buttons.
5. Increase and decrease trend sampling period.
6. Slider Bar.
Figure 3.25 shows: Current date and time, time elapsed, current window time and event info in
case there’s an event detected at the current time.
USER MANUAL
Page 21
3
Better Care Net Server
Figure 3.25: Waves reproduction information region
3.3.2.2 Keyboard and mouse events on waves panel. Keyboard and mouse events on waves
review panel are the same described for the waves panel, with the addition of:
• Cntrl + 1: Only waves are shown.
• Cntrl + 2: Only trends are shown.
• Cntrl + 3: Waves and trends are shown simultaneously.
• Cntrl + N: Navigate to next event.
• Cntrl + P: Navigate to previous event.
• Alt + Left Mouse Button: shift mode. Navigates through the study by moving the mouse
left and right.
3.3.3 Trends
When inside Review, Trends tab is selected, the Trends visualization panel becomes visible; it
shows the mean values of the trends hour by hour. Trends include physiological constatns as well
as a selection of the values calculated by the software processing module, depending on the signals
registered in the selected date.
Zooming is disabled when viewing trends. Zoom is fixed to show always a 24 hour window,
although other chart characteristics are still enabled.
This panel automatically updates durnig the monitoring
USER MANUAL
Page 22
3
Better Care Net Server
Figure 3.26: Trends panel detail
1. Trend Name.
2. Current Trend Value.
3. Daytime in hours.
4. Slider Bar.
5. Current Time position.
6. Trend 24h Mean.
7. List of hidden Trends.
The trends panel is organized and displayed the same way waves panel and review panel are, and
even parameter drag and drop is exactly the same.
Navigation through the 24 values can be done with the navigation bar at the bottom of the panel
(Figure 3.26), the left and right cursor keys or shifting (Left Mouse Button +Alt Key).
USER MANUAL
Page 23
3
Better Care Net Server
3.3.4 Alarms
Alarms panel is shown in Figure 3.27. For each alarm, it shows the ocurrence percentage (number
of times it was detected vs number of times it was calculated).
Figure 3.27: Alarms distribution visualization panel
With this panel, it’s very easy to see the most critical hours of the day.
3.4 Cameras
The camera panel will be visible in case at least one camera is configured in the setup screen. This
panel contains:
USER MANUAL
Page 24
3
Better Care Net Server
Figure 3.28: Camera control region
1. Selected Camera.
2. Real-Time Camera image.
3. Level of Zoom.
• Current camera: Selection of the current camera.
• Current camera view: Real time video of the current camera.
• Current camera zoom: Zoom selection of the current camera (0 to 100).
Pressing the left mouse button no the camera panel, will cause it to expand or contract (depending
on the state it had when pressed), resizing also the waves and processing panels.
3.5 Local data storage
Data are locally stored in folders in “My Documents\B-CARE”. These folders are first organized
by the patient ID and for each patient a folder with the data and time of every patient session is
created. Figure 3.29 shows how data are organized.
USER MANUAL
Page 25
3
Better Care Net Server
Figure 3.29: “Net Server” folder structure
The studies can be opened by selecting the corresponding folder in the “Review” application.
USER MANUAL
Page 26
4
Better Care Client
4 Better Care Client
4.1 Better Care Client configuration
On first execution, a valid the Server Directory IP address must be specified in order to retrieve
real time data from all the ICU beds connected. We can access this feature by clicking with
the mouse left button on the label with the text “No Server Selected” and selecting “Manage
Servers. . . ” as shown in figure 4.1.
Figure 4.1: Better Care Client configuration strip menu
4.1.1 Better Care Client Server Directory configuration
When “Manage Servers” is pressed, a Window Form will appear asking for a IP adress and a
password (Figure 4.2). When introduced, pressing the “Add” button will make the system add the
available ICU beds currently connected and sending data to the corresponding Server Directory.
The IP adress of the Server Directory will be stored for further executions.
USER MANUAL
Page 27
4
Better Care Client
Figure 4.2: Manage Servers Window
It is possible to add more than one Server directory at once. Also, in case the service in the server
directory is published in a port different than 80, we can specify the port by using the following
syntax “IP:port”.
4.1.1.1 Servers management Once connected to a Server Directory, in the region labeled
“Servers”, we can check or uncheck the available servers in order to receive data only from the
desired (checked) Servers/ICU beds.
USER MANUAL
Page 28
4
Better Care Client
Figure 4.3: Selected servers management
4.2 General view of Better Care Client
Once configured, the ICU beds available will be presented as its preview version, in a view that
called “ICU bed pre-selection view” (Figura 4.4).
USER MANUAL
Page 29
4
Better Care Client
Figure 4.4: ICU bed pre-selection view
4.2.1 ICU bed pre-selection view
Each box, representing a single patient, displays the Number/name of the ICU Bed, the Patient
ID from the patient being monitored, an “Overview!” of the parameters that are beeing received
and the alarm messages in case there’s any message to show. When an alarm is triggered,
the background of this preview box will turn blue; if silenced (all the alarms are deactivated),
background will turn yellow. in the Figure 4.5 we see the detail of a box in the ICU bed
pre-selection view.
Figure 4.5: Preview of ICU bed
1. Net Server Given Name.
2. Numeric parameter Name.
3. Numeric parameter Units.
4. Numeric parameter Value.
5. Alarm messages.
USER MANUAL
Page 30
4
Better Care Client
General view of an ICU bed is accessed by clicking with the mouse left button on any of the boxes
which we have in the pre-selection view. It is possible to go back to pre-selection view clicking the
selected ICU bed with the mouse left button again.
4.2.2 General view of ICU bed
This view shows the detail of the selected ICU bed. We can see the waves (shown by default when
selecting a bed), the current alarm messages and the real time video (if available)and even review
clinical data of the corresponding patient. In figure 4.6 a selected bed is shown.
Figure 4.6: Better Care Client with a selected ICU bed
1. Preview of the Selected ICU Bed (Net Server).
2. Detailed view of the Selected ICU Bed (Net Server).
the visible tabs can have three different states:
• Active and selected: Depending on the tap which is active and selected the content in
the application will change. In the figure 4.6, “Monitorization” is the main tab active and
selected and the dependent tabs, “Waves” is the selected. The active and selected tabs have
dark background and white text.
• Active and non-selected: corresponds to active tabs non-selected but can be selected
whenever the user wants. In the figure 4.6, “Review” is a active and non-selected main tab
and from dependent tabs “Processing”. The active but non-selected tabs are light background
and dark text.
• Inactive: corresponds to tabs that can not be selected by the user. In the Figure 4.6,
“Report” is an inactive tab. The inactive tabs are light background and light text.
USER MANUAL
Page 31
4
Better Care Client
The visible elements are grouped by the three main tabs. Theese element are described next.
Figure 4.7: Navigability scheme of “Better Care Client”
4.3 Monitoring
The monitoring tab shows the current session state in real time. This includes waves visualization
(“Waves”), processing or alarm variables (“Processing”) and also remote cameras visualization
and manipulation panel.
4.3.1 Waves Panel (Basic)
Real time configured biomedical waves and constants visualization. Together with the waves and
constants panels, there are 3 interactive buttons -Figure 4.8- allowing:
• “-”: Zoom out.
• “Profiles”: Modifies the visual aspect of these regions.
• “+”: Zoom in.
USER MANUAL
Page 32
4
Better Care Client
Figure 4.8: Waves visualization region
USER MANUAL
Page 33
4
Better Care Client
4.3.2 Waves Panel (Advanced)
Figure 4.9: Waves panel user interaction capabilities
USER MANUAL
Page 34
4
Better Care Client
1. Drag-drop to change waveform’s location.
2. Waveform name.
3. elapsed time.
4. current waveform value.
5. waveform scales.
6. waveform attached numeric.
7. list for hidden waveforms.
A biomedical wave is the continuous representation of a parameter provided by one of the machines
connected to the patient in time. This wave is usually presented with a constant (trend) that
helps understanding what’s going on with the corresponding wave. An example is the heart rate,
associated with the different ECG channels or the respiratory rate, associated with the air flow.
The name of the constant is drawn in the header and at the center the current value (between the
minScale and maxScale) or ’ ?’ if there is not a valid value at the current moment.
In figure 4.9 we can see at the right side of the waveforms the box where we can drag the
waveforms we don’t want to see. Using the mouse and the drag and drop movement we can drag
any of the visible waves to this box, so the same area is divided between the current visible waves
(hidden waves are still being captured and processed).
It’s also possible to sort the waves. To do it, we just need to drag any wave to the desired location
(a line will be drawn to easily identify where the wave is about to be dropped). We can see in
figure 4.10 the effect of Drag and Drop “AIR FLOW” above the “PLETH” wave.
Figure 4.10: “Drag/Drop” on waves panel
We can also configure the look of all the waves globally or individually. In figure 4.11 we
can see the menu generated when the mouse right-button is pressed on “Air Flow”. The first
USER MANUAL
Page 35
4
Better Care Client
two funcionalities, “Serie Configuration” and “Numeric serie configuration” are used to configure the wave and its trend, and “Chart” allows to choose the information to display on the screen.
Figure 4.11: Wave configuration menu
4.3.2.1 Waveform aspect configuration window. Checking “scale auto-adjustment” 4.12 will
let the system choose the best scale for the corresponding parameter. We can also adjust them
manually as seen in figure 4.13. When we select manual adjustment we can change the minimum
and maximum values and restore scales to their default value. At last, we can also change the
color of the wave.
Figure 4.12: Auto-adjustment active.
USER MANUAL
Page 36
4
Better Care Client
Figure 4.13: Manual Scale adjustment
4.3.2.2 Numeric configuration. We can modify the max scale, the min scale and also restore
the default scale of the trend attached to a wave. We can se this configuration window in figure 4.14.
Figure 4.14: Numeric configuration window
4.3.2.3 Global configuration of “Better Care Client” look. If we choose “Chart” in the serie
configuration menu (Figura 4.11), we can navigate to “Profiles” to change the global aspect of the
waves panel.
USER MANUAL
Page 37
4
Better Care Client
The options “load” and “Manage” profiles allows loading and modifying the configuration
profiles created with “Profile Management”, that can be accessed through the option “Modify”
in the profile menu (and also by clicking the “Profiles” button) to change the colors used, the
representation environment and configure “Better Care Client” as desired.
The window shown when selecting “Modify” is displayed in figure 4.15)
Figure 4.15: Profile customization
The parameters are:
• Profiles: List of profiles already created. By default only two profiles appear, default and
dark profile.
• Chart attributes:
– Background color.
– Parameter color: Text and waves color.
– Refresh interval: Refresh time/update in milliseconds (the lower it is, the smoother the
waves are drawn).
– Wave representation: Line or area waves representation.
– Grid: Shows/hides a grid in the background.
– High quality : Turns on/off smoothing when drawing waves.
USER MANUAL
Page 38
4
Better Care Client
– Force parameter color: if we check this checkbox the texts and waves will be drawn with
the color defined by “Parameter color”; if not checked, texts and waves will be drawn
with the system default color.
• Save: Naming a profile and clicking the “Save” button we adds the current profile to the
stored profiles list to be modified and selected later.
4.3.2.4 Keyboard and Mouse Events on the Wave Panel.
• Drag/drop: Already seen at the beginning of the chapter.
• Cntrl + ’+’ / Mouse Wheel up / Cntrl + Mouse Right-Button: Zoom in.
• Cntrl + ’-’ / Mouse Wheel down / Cntrl + Mouse Right-Button: Zoom out.
4.3.3 Processing
This module performs a real time processing of the selected waves to generate alarms that will
rise when they go out of the defined range of normality or when they increase or decrease during
a limited timespan. This is how this module works:
Figure 4.16: Processing scheme
• Input signals:
– Flow (FLOW)
– Airway pressure (PAW)
– Volume (VT)
– the CO2 (CO2)
– invasive arterial pressure (PRES ART)
– the pulsoximeter (SPO2)
– Electrocardiogram (one or more channels) (ECG)
• Variables: numeric values generated when applying mathematical algorithms to the input
signals. These values are continuously updated.
USER MANUAL
Page 39
4
Better Care Client
• Alarms: An alarm is associated to a variable. An alarm will be triggered when the variable
goes out of range.
4.3.3.1 General view of the interface. The processing interface can be accessed by pressing the
“Processing” tab. It displays the variables being processed at the current moment and its current
state and value. Variables are displayed as boxes that can also be sorted. These boxes display the
following information (Figure 4.17).
Figure 4.17: Variable Box (Variable Container)
1. Variable name.
2. Value and Units.
3. Value Bar.
4. last hour event counter and percentage.
5. Drawable events (last hour).
6. 24 hour event counter and percentage.
The Variable Boxes or Variable containers can change its appareance depending on factors such as
its type, alarm limits and current state. A Variable Box can be presented as:
Figure 4.18: Variable Box different states
4.3.3.1.1 Visualization options All the available variables and alarms (its availability depends
on the input signals) are visible in the alarm panel. This can be modified through the visualization
menu or by a drag/drop action.
USER MANUAL
Page 40
4
Better Care Client
• Visualization Menu: Clicking with the right button on the empty space of the variables
panel it will make the configuration options appear as a toolstrip menu. With it, it’s possible
to switch between showing the variables that have an alarm associated or showing all the
variables being calculated. (Figure 4.19).
Figure 4.19: Mouse right button toolstrip menu clicking with the
• Drag and Drop: Variable boxes can also be dragged and dropped from the panel to the list
at the right of the panel (in order to hide them) or from the list to the panel (in order to be
shown again). They can also be dragged and dropped in order to sort them. Figures 4.20 y
4.21 show the actions of drag and drop respectively.
Figure 4.20: 1) Result of dragging Double Trigger
USER MANUAL
Page 41
4
Better Care Client
Figure 4.21: 1) Result of dropping Double Trigger
• Alarms grouping: Alarms are automatically grouped depending on their type. Each group
alarms can be reordered by following the method described before. By clicking on the name
of the group, all corresponding variable boxes will be shown or hidden.
USER MANUAL
Page 42
4
Better Care Client
Figure 4.22: Alarms grouping
4.3.3.2 Alarm Configuration Configuration of a variable alarm limitsis done through the form
of alarm limit configuration. This limits fix the normality minimum and maximum values, so
when the current value is out of this range, the corresponding variable enters in alarm state.
Access to this form is done by pressing the mouse right button on the variable box we want to
configure and selecting “Configure parameter X” or by clicking on the value bar with the mouse
left button. In figure 4.22 we can see the Alarm configuration form.
USER MANUAL
Page 43
4
Better Care Client
Figure 4.23: Trapped Air configuration
It is also possible to modify the normality limits without opening the configuration window. This
can be done by dragging the minimum or maximum limit in the variable box to the desired value.
4.3.3.2.1 Interactive buttons
The three interactive buttons -Figure 4.24- allow:
• “Activate All”: Activates all the alarms with at least a minimum or a maximum limit set.
• “Edit”: Initiates edition mode to configure or activate/deactivate each variable individually.
• “Disable All”: Disables all the alarms.
Figure 4.24: Interactive Buttons
4.3.3.3 Alarm Log (Alarm Report) This window (“Alarm Log”) appears when clicking a
variable box with one or more alarms occurred during the last hour. It displays a region where
the alarm is shown as an image and another region with the thumbnails of the different alarms
that have also been detected during the last hour, ordered by the time they were detected. The
figure 4.25 show the “Alarm Log”.
USER MANUAL
Page 44
4
Better Care Client
4.3.3.3.1 Actions on Alarm Log The interaction with the alarm log window is done by using
the keyboard and the mouse:
• Next Alarm: Next alarm can be selected by pressing the → key. Drag and drop can also be
used on the list to reach the thumbnail we want to expand.
• Previous Alarm: Previous can be selected by pressing the ← key. Drag and drop can also be
used on the list to reach the thumbnail we want to expand.
• Last Alarm: Last alarm can be directly accessed by pressing the push the “>>” button.
• First Alarm: Last alarm can be directly accessed by pressing the push the “<<” button.
Figure 4.25: Alarm log
4.4 Review
The review tab will contain the past days since the admission until the current date which are
stored in PACS. Each day (study) will include the main clinical events, the curve visualization
(“Waves”), the registered trends (“Trends”), and the distribution of the events in the 24 hours of
the day (“Alarms”). This tab will only be enabled if we pre-configured the PACS connection.
USER MANUAL
Page 45
4
Better Care Client
Figure 4.26: General View of the Review tab
4.4.1 Study Download
By default, only the descriptions of the studies stored in the PACS are downloaded. For each
study, it is possible to download the day report only and also the full session (that includes the
24 hour waves). The study name will be coloured light gray if no data have been downloaded yet.
4.4.1.1 Day Report Download To download the Day Report of any of the available studyies in
the PACS the corresponding element in the list has to be selected (left mouse button click). It is
possible to download all the Day Reports from all the available studies simultaneously by clicking
the right mouse button.
USER MANUAL
Page 46
4
Better Care Client
Figure 4.27: Studyies without beeing downloaded
Once the download is started its progress will be shown together with the name of the corresponding
study.
Figure 4.28: Downloading studies
Once downloaded, the name of the study will be coloured dark gray and it will be possible to
select the trends and alarms tabs.
USER MANUAL
Page 47
4
Better Care Client
4.4.1.2 Downloading the full session The full session can be downloaded by clicking the button
that appears at the right of a study when placing the mouse over it. Once pressed, the system
will ask for confirmation (Figure 4.29).
Figure 4.29: Download full session button and advice
The name of the full downloaded studies will be drawn blue and review, trends and alarms tabs
will be selectable. Waves of the study will be downloaded in packets of 15 minutes. Waves can be
reviewed once the first packet is fully downloaded. The downloaded percentage will be drawn at
the right of the study name until it reaches 100. (Figura 4.30).
USER MANUAL
Page 48
4
Better Care Client
Figure 4.30: Downloaded study (2012-05-21 (1))
4.4.2 Event panel
The event panel contains the clinical events list detected during the current or previous monitoring
of the patient (with the ID specified when session was configured). The events are grouped by
date and event type; every event in every event type is represented by the time of the selected
date it was detected.
USER MANUAL
Page 49
4
Better Care Client
Figure 4.31: Clinical events panel
When a date is selected in the first list, “Review”, “Trends” and “Alarmas” charts will be filled
with the data corresponding to the selected date.
Navigation to a lower level in the list (‘Date’ to ‘Event Type’ or ‘Event Type’ to ‘Event’) can
be done pressing the “→”(right arrow) key or pressing the “>” button. Once in the last level,
the selection of any single event will make data chart (in “Revision” tab) move to the time the
selected event was detected.
Navigation to a higher level can be done with the “←” key (left arrow) or pressing the “<”
button.
4.4.3 Review
When review tab is selected in review, waves revision panel shows the stored signals and biomedical
constants. Three buttons are shown -Figure 4.32- allowing:
USER MANUAL
Page 50
4
Better Care Client
• “-”: Performs a ‘zoom out’.
• “Profiles”: Customization of the look and characteristics of the waves and constants.
• “+”: Performs a ‘zoom in’.
Figure 4.32: Waves revision panel
This panel is shown similarly to the waves panel previously described, but also includes a
navigation bar, similar to a media player.
4.4.3.1 Reproduction options of the waves review panel. Reproduction options can be accessed
by the navigation bar at the bottom of the panel where waves are shown. This navigation bar
allows the manipulation of the current monitoring similarly to a standard media player. Figure
4.33 shows the function of each button in the bar region.
Figure 4.33: Waves reproduction controls
1. previous event.
2. decrease simulation speed.
3. Backwards and Normal Play Buttons.
4. Zoom buttons.
5. Increase and decrease trend sampling period.
6. Slider Bar.
Figure 4.34 shows: Current date and time, time elapsed, current window time and event info in
case there’s an event detected at the current time.
USER MANUAL
Page 51
4
Better Care Client
Figure 4.34: Waves reproduction information region
4.4.3.2 Keyboard and mouse events on waves panel. Keyboard and mouse events on waves
review panel are the same described for the waves panel, with the addition of:
• Cntrl + 1: Only waves are shown.
• Cntrl + 2: Only trends are shown.
• Cntrl + 3: Waves and trends are shown simultaneously.
• Cntrl + N: Navigate to next event.
• Cntrl + P: Navigate to previous event.
• Alt + Left Mouse Button: shift mode. Navigates through the study by moving the mouse
left and right.
4.4.4 Trends
When Trends tab is selected, the Trends visualization panel becomes visible; it shows the mean
values of the trends hour by hour. Trends include physiological constatns as well as a selection of
the values calculated by the software processing module, depending on the signals registered in
the selected date.
Zooming is disabled when viewing trends. Zoom is fixed to show always a 24 hour window,
although other chart characteristics are still enabled.
This panel automatically updates durnig the monitoring
USER MANUAL
Page 52
4
Better Care Client
Figure 4.35: Trends panel detail
1. Trend Name.
2. Current Trend Value.
3. Daytime in hours.
4. Slider Bar.
5. Current Time position.
6. Trend 24h Mean.
7. List of hidden Trends.
The trends panel is organized and displayed the same way waves panel and review panel are, and
even parameter drag and drop is exactly the same.
Navigation through the 24 values can be done with the navigation bar at the bottom of the panel
(Figure 4.35), the left and right cursor keys or shifting (Left Mouse Button +Alt Key).
USER MANUAL
Page 53
4
Better Care Client
4.4.5 Alarms
Alarms panel is shown in Figure 4.36. For each alarm, it shows the ocurrence percentage (number
of times it was detected vs number of times it was calculated).
Figure 4.36: Alarms distribution visualization panel
With this panel, it’s very easy to see the most critical hours of the day.
4.5 Cameras
The camera panel will be visible in case at least one camera is configured in the setup screen. This
panel contains:
USER MANUAL
Page 54
4
Better Care Client
Figure 4.37: Camera control region
1. Selected Camera.
2. Real-Time Camera image.
3. Level of Zoom.
• Current camera: Selection of the current camera.
• Current camera view: Real time video of the current camera.
• Current camera zoom: Zoom selection of the current camera (0 to 100).
Pressing the left mouse button no the camera panel, will cause it to expand or contract (depending
on the state it had when pressed), resizing also the waves and processing panels.
USER MANUAL
Page 55
5
Better Care Review
5 Better Care Review
Coming soon
USER MANUAL
Page 56
6
Better Care Mobile Server
6 Better Care Mobile Server
Coming soon
USER MANUAL
Page 57