1
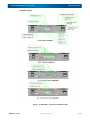
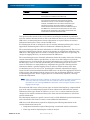
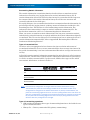
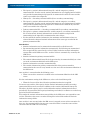
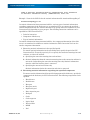
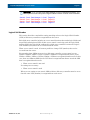
SnapSAN 3000/5000 Disk Array User Guide Function Overview Displays the latest load state in bar graphs Displays the latest load state in time-series graphs. You can set the update frequency (Display Refresh Rate) of display on the Numeric Table and the Time-series Graph at environment setting. You can also change the setting from the iSM server menu while the iSM server is operating if the performance monitoring screen is not started. For details on environment setting, refer to the installation guide. For changing Display Refresh Rate, refer to the “User’s Manual” or “User’s Manual (UNIX)” in accordance with your OS in use. Set the Display Refresh Rate as the number of screen updates per minute. Table 1-1 shows relation between Display Refresh Rate and Display Refresh Interval. Display refresh rate (times/minute) 1 2 3 4 5 6 Display refresh interval (second) 60 30 20 15 12 10 You cannot change the Display Refresh Rate while the Performance Monitoring screen is started. Change to the Display Refresh Rate applies to all the disk arrays monitored by the server. Increasing the Display Refresh Rate detects change in the performance information in a shorter interval but the number of components simultaneously display is decreased. This is because the number of collection of performance information by a single disk array controller in certain period is restricted not to obstruct file I/O from the application host in the overhead at collection of performance information. This tendency is eminent especially when statistic information is being stored simultaneously with real-time displaying. Monitoring Overloads Specifying a threshold as an index value of overload allows iSM to automatically detect the occurrence of overload in a disk array or a disk array component (occurrence of a load exceeding a specified threshold value). Upon detecting overload, a message (event log/syslog, operation log) notifying overload is displayed. At the same time, asterisks (**) are displayed at the location where the overload occurred on the Performance Monitoring screen. When the occurrence of overload is reported by a message, an administrator must identify the location of overload occurrence on the Performance Monitoring screen. In addition, by specifying the threshold monitoring conditions and conditions to reset threshold excess state, it is possible to perform operations such that overloads in a temporary disturbance are not detected and, when threshold exceeding continues, overloads are detected and notified continuously. To detect overload of the entire disk array, it is enough to set thresholds for the entire disk array, IOPS of the port, transfer rate, and average response time, and to monitor the performance. You do not have to specify a threshold for each and every logical disk and physical disk. If you need to restrict the I/O load of a specific logical disk and physical disk for some reason such as data of the database application, specify thresholds for the logical disk and physical disk. Then you can detect an abnormal load on them. 10400386-001 07/2012 ©2012 Overland Storage, Inc. 7-4