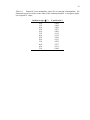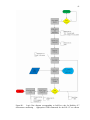
1
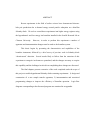
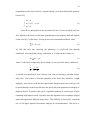
APPARATUS AND INSTRUMENTATION DESIGN FOR
INVESTIGATION OF HYPERTHERMAL- AND
LOW-ENERGY SURFACE IMPACT
CURRENT PRODUCTION
A Thesis
Presented to
the Graduate School of
Clemson University
In Partial Fulfillment
of the Requirements for the Degree
Master of Science
Physics
by
Stephen Andrew Moody
August 2006
Advisor: Dr. Chad E. Sosolik
ABSTRACT
Recent experiments in the field of surface science have demonstrated electronhole pair production due to thermal energy neutral particle adsorption on a thin-film
Schottky diode. We seek to extend these experiments into higher energy regimes using
the hyperthermal- and low-energy ion beamline installed in the Sosolik Research Lab at
Clemson University.
However, in order to perform this experiment a number of
apparatus and instrumentation changes must be made to the beamline system.
This thesis begins by presenting the characteristics and capabilities of the
beamline instrument, followed by a brief survey of previous work in Schottky diode
“chemicurrent” detection. Several results likely to follow from the extension of this
experiment to energetic ion beams are postulated, and the changes necessary to acquire
this capability and the challenges involved in accomplishing those changes are discussed.
The final chapters present a narrative of the work completed under the scope of
this project to enable hyperthermal Schottky diode scattering experiments: 1) design and
construction of a new sample transfer apparatus; 2) instrumentation and associated
programming changes to improve the efficiency of beamline operation.
Logic-flow
diagrams corresponding to the discussed programs are contained in an appendix.
ACKNOWLEDGEMENTS
I would like to thank my advisor, Dr. Chad Sosolik, for his invaluable assistance,
particularly for his patience in explaining the ins and outs of beamline operation and
scattering experiments. His mentoring in these areas left me with many valuable insights
with much broader application. I can’t imagine having a better advisor during my two
years here at Clemson. Dr. Sosolik’s friendly and congenial professionalism made the
lab a comfortable and enjoyable place in which to work.
I am grateful to my other committee members, Dr. Meyer, Dr. Rao, and Dr.
Skove, for their time and helpful suggestions.
My fellow group members are also much appreciated. Matt Ray in particular
provided invaluable assistance through his oversight of day to day operation of the
instrument. Without his knowledge and expertise in running the beamline from the
beginning my work would have taken much longer to complete. The hours we spent
discussing all sorts of things, whether physics-related or not, were also enjoyable and will
be missed.
Finally, my fiancée, Elisabeth Manka, deserves a word of thanks for her patience
in putting up with me during these past several months of “writing my thesis.” Although
I’m certain she wondered at times if I would ever complete it, her patience,
encouragement, and love in the meantime were instrumental sources of motivation and
mean to me more than I can express.
TABLE OF CONTENTS
Page
TITLE PAGE .................................................................................................................
i
ABSTRACT ..................................................................................................................
iii
ACKNOWLEDGEMENTS ............................................................................................ v
LIST OF FIGURES ..................................................................................................... viii
1. INTRODUCTION AND EXPERIMENTAL BACKGROUND .................
1
Introduction ............................................................................................ 1
Beamline Instrument Design .................................................................. 1
Schottky Diode Experiment ................................................................... 5
Background and Survey of Previous Work ..................................... 5
Extension to Higher-Energy Regimes ............................................. 9
Scope of Work ....................................................................................... 11
2. SAMPLE HOLDER AND TRANSFER SYSTEM...................................... 13
Introduction ............................................................................................
Sample Holder .......................................................................................
Sample Carrier Module ....................................................................
Sample Mount Module ....................................................................
Sample Dock ..........................................................................................
Sample Transfer System ........................................................................
Load Lock/Magnetically Coupled Linear-Rotary Translator ..........
Sample Transfer Tool ......................................................................
Design Revision Process ........................................................................
13
14
14
15
18
21
21
22
23
3. ELECTRONICS, INSTRUMENTATION AND INTERFACING.............. 27
Introduction ............................................................................................
Current Monitoring/Electrometer Automation ......................................
Wien Filter Beam Tuning ......................................................................
Electrostatic Analyzer Automation ........................................................
Conclusion .............................................................................................
27
29
31
34
34
v
Table of Contents (Continued)
Page
APPENDICES ................................................................................................................ 37
A. Table of Manipulator Centering Values by Angle ...................................... 41
B. Logic Flow Diagrams of LabView Programs ............................................. 40
REFERENCES .............................................................................................................. 43
LIST OF FIGURES
Figure
Page
1.1
Kinetic energy regimes for single-particle incident scattering ..........................
2
1.2
Plan view of beamline instrument ......................................................................
4
1.3
Survey of energy exchange mechanisms in surface interactions .......................
5
1.4
Schottky diode design for molecular scattering experiments ............................
6
1.5
Basic operating principle of n-type Schottky diode device . ..............................
7
1.6
Typical chemicurrent vs. exposure time profile ................................................
9
2.1
Sample carrier back view, without sample holder assembly . ............................ 15
2.2
Example sample mount configuration ............................................................... 16
2.3
Front view of sample holder assembly .............................................................. 17
2.4
Diagram of sample dock . ................................................................................... 19
2.5
Sample transfer system ...................................................................................... 22
2.6
Sample transfer tool as installed on MCLR shaft .............................................. 23
B.1
Logic flow diagram corresponding to LabView code for Keithley 617
electrometer monitoring .................................................................................. 44
B.2
Logic flow diagram corresponding to LabView code for Wien filter
automation ....................................................................................................... 45
B.3
Logic flow diagram corresponding to LabView code for electrostatic
analyzer (ESA) automation ............................................................................. 46
CHAPTER 1
INTRODUCTION AND EXPERIMENTAL BACKGROUND
Introduction
All work for this project was done relating to a single instrument, a
low/hyperthermal energy ion beamline installed in the Sosolik Research Laboratory at
Clemson University. While the instrument was originally designed and operated at
Cornell University, it was transferred to Clemson and the Sosolik Research Group in the
spring of 2004.
Comprehension of the scope and purpose of this project requires an understanding
of 1) the design and capability of the beamline instrument; 2) the anticipated experiment.
These two points will be explored in that order in this chapter, concluding with a short
summary of the work to follow in chapters 2 and 3 discussing the motivations and scope
of work undertaken.
Beamline Instrument Design
As noted above, the instrument is categorized as a hyperthermal-to-low energy
beamline, operating at ultrahigh vacuum (UHV) and capable of operation using a wide
variety of gas and solid-state (typically alkali or occasionally alkali-earth metals) sources.
The hyperthermal regime is defined loosely to be the regime of single particle energies
above thermal energies (< 1 eV) but lower than approximately 1 keV. The low energy
regime starts where the hyperthermal regime leaves off and continues to ~ 10 keV [1].
As Figure 1.1 shows, these regimes are particularly important because it is in these
2
regimes that kinetic effects dominate particle-surface interactions. At lower (thermal)
energies the interaction is dominated by adsorption effects, while at very high energies
complex phenomena such as embedding result. Therefore, the low and hyperthermal
energy regimes, with scattering as the dominant phenomenon, generate the most directly
observable information about complex surface-particle interactions. This information is
particularly useful to characterize a broad range of chemical reactions, and in particular
the set of reactions occurring in the presence of a surface catalyst.
Figure 1.1
Kinetic energy regimes for single-particle incident scattering. The
regimes considered here are characterized by incident particle scattering events of
approximately the given magnitudes: thermal, E < 1 eV; hyperthermal, 1 eV < E < 1
keV; low, 1 keV < E < 10 keV. It is important to note that these regimes are approximate
and useful as guidelines only. Note that scattering probability is peaked in the
hyperthermal region [2].
.
3
The instrument utilizes a beam of ions for two primary reasons. First, the need to
generate, characterize, focus, transport, and accelerate a particle beam at above-thermal
energies requires that the constituent particles be ionized. Generation of a particle beam
at thermal energies is possible through use of a pressurized source or with a hot aperture
calibrated to produce an energy distribution about the required energy. In higher-energy
regimes this breaks down, since the pressures required become difficult to achieve while
maintaining controllable chamber pressure. In addition, the hot aperture begins to ionize
the constituent particles above a certain temperature. Energy and species characterization
is also quite difficult using neutral particle beams since energy spectra are generally quite
broadly spaced and elemental or isotopic impurities cannot be differentiated from the
constituent population. True beam focusing and efficient transport of neutral particles is
not possible using typical sources and can only be approximated using highly collimated
transport sections, resulting in high-loss transport.
Finally, acceleration is also not
generally possible, as neutral particles present no physical properties which can be used
to do work.
All of these problems become trivial using an ionizing beam source and
appropriately designed charged-particle optics and characterization instrumentation.
Figure 1.2 shows the plan layout of the ion beam instrument with relevant components
noted.
A wide variety of beam species are available, using a hot-filament source for gas
beams or aluminosilicate source for alkali beams. The produced beam is energy and
species characterized with a high degree of precision using a Wien filter [3, 4] and
spherical monochromator [5], which narrows the beam energy spread to ∆E/E ~ 1% [6].
4
The beam is focused for transport and accelerated to voltage at various stages of the
instrument using a series of electrostatic lens elements [7].
Ion pump
Monochromator (90º
spherical analyzer)
Turbo pump
Lens #3
Scattering
chamber
Lenses #4A, #4B
Load lock
chamber
Lens #2
Turbo pump port
MCLR
translator
Colutron ion gun, including
electrostatic lens #1, X-Y
deflectors, Wien filter
Ion source
Figure 1.2
Plan view of beamline instrument. Key components, including Einzel
lenses, filtering apparatus, vacuum pumps, scattering chamber, and newly installed loadlock/linear translator are shown.
While using an ionized beam greatly simplifies many of the challenges involved
in producing a reliable, well-characterized beam, the use of an ionized beam also allows
exploration of charge transfer and spin-dependent surface effects. Although sometimes it
may be desirable to neutralize the incident beam before striking a surface, in general
5
these effects provide another useful parameter and several previous studies utilizing this
instrument have dealt with these effects specifically.
Schottky Diode Experiment
The unique capabilities of this ion beam instrument make it an intriguing tool for
exploring a recently active field of study. While electron-hole pair creation has long been
assumed to be one of the primary means of energy exchange at surfaces (see Figure 1.3),
until recent experiments by Nienhaus, et al. that mechanism had not been studied via
direct observation.
Metal
Exoelectrons
e-
Electron-hole
pairs
e-h
Relaxation
Incident Gas
Exothermic
reaction
ħν
Photons
ħω
ħω
Phonons
Figure 1.3
Survey of energy exchange mechanisms in surface interactions. Electronhole pair creation is an important pathway but has been difficult to detect directly [8].
Background and Survey of Previous Work
Recent groundbreaking experiments [9, 10] have directly measured electron-hole
pair creation due to neutral particle surface impact events in the form of a “chemicurrent”
passing through a metal thin film rectifying (Schottky) diode. A basic Schottky diode
device consists of a thin metal film (often Ag, Au, Cu, or Ti) deposited on a doped
6
semiconductor with some way of measuring current between the thin film and outer edge
of the semiconductor. Figure 1.4 illustrates the general design as implemented in these
previous experiments.
Au contact
Metal thin film
(d ~ 100 Å)
Doped Si Wafer
A
SiO2
Figure 1.4
Schottky diode design for molecular scattering experiments. The incident
molecular beam strikes the metal thin film, allowing a “chemicurrent” to be measured
between the front and back contacts [11].
An electron-hole pair consists of a “hot,” or energized, electron excited above the
Fermi level and leaving behind a “hot” hole in the conduction band at an energy below
the Fermi level.
Due to their increased energies both the electron and hole are
transported ballistically through the material. In bulk materials scattering and coupling
effects reduce the pair’s energy, eventually causing them to recombine at the Fermi level
and disappear.
While theoretically detectable, under laboratory conditions this
recombination time (or equivalently the e-h pair’s mean free path) is so short as to make
the process undetectable in practice.
To surmount this detection limitation a Schottky diode utilizes a thin film
rectifying contact to make it energetically impossible for electrons (or holes, depending
on the diode type) transported across the barrier from returning to recombine with their
paired component, thus preventing e-h pair recombination. After a large number of such
7
events a bulk charge difference builds up across the barrier such that if a circuit is
connected between the opposite sides of the device the resulting net flow of electrons
would be significant enough to be detectable as current. Figure 1.5 shows an example of
the n-type semiconductor case, in which an electron is excited above the Fermi level and
ballistically transported into the conduction band of the semiconductor. The electron
quickly loses the energy required to return to the metal layer and is then constrained
within the conduction band by the energy band gap shifting near the interface.
Incident
Atom/Molecule
Ballistic
Transport
E
CBM
e-h pair
EFermi
Egap
VBM
Metal
Layer
n-Semiconductor
Figure 1.5
Basic operating principle behind n-type Schottky diode device. The ptype would be similar except that the hole would cross the barrier below the Fermi level
and into the semiconductor valence band [12].
Studies into device optimization so far have shown that measured current depends
very sensitively on film thickness, not surprisingly dropping off quite rapidly once the
film thickness exceeded the electron mean free path for the film material [13]. Optimal
devices used up to this point for the detection of thermal neutral species have generated
8
chemicurrent of magnitude < 10 nA using film thicknesses of 10 nm or less [multiple
sources].
The introductory studies in chemicurrent detection have all used neutral gas
species at thermal (< 1 eV) energies, where, as Figure 1.1 shows, the primary source of
energy for electron-hole pair creation in the thermal regime is surface adsorption, as
incident molecules form a stable bond with the surface and release the excess energy to
the surroundings.
Because adsorption (particularly chemisorption) is the dominant energy source
the current detected came to be known as “chemicurrent.” Although for the energies
considered here chemisorption is not the dominant source of energy transfer the term
“chemicurrent” will be used throughout this paper to refer to a measurable current due to
bulk electron-hole pair creation by some mechanism of surface energy exchange, whether
chemical or kinetic.
One distinctive feature of thermal energy incidence experiments and the
accompanying predominance of adsorption effects is the tendency of the adsorbing
surface to eventually become saturated such that equilibrium is reached between surface
adsorption and desorption rates. Gratifyingly this saturation effect manifests itself quite
clearly as a distinctive current decay profile as shown in Figure 1.6. The chemicurrent
produced starts abruptly when the beam is introduced, decreases exponentially as a
function of time, and then terminates abruptly when the beam is shut off.
9
Chemicurrent
Exposure Initiated
End of Exposure
Beam Exposure Time
Figure 1.6
Typical chemicurrent vs. exposure time profile. Chemicurrent decay due
to surface saturation effects is well illustrated [14].
In addition to being sensitive to exposure time, the chemicurrent profile has been
shown to depend on several other parameters consistent with the current understanding of
chemicurrent production. These parameters include variation in molecular species, diode
semiconductor type (n-type or p-type), beam flux, thin film composition, and even
isotopic species.
Extension to Higher-Energy Regimes Using Ion Beam Instrument
The current research goal for the beamline instrument is to extend the
chemicurrent sensor results obtained using thermal neutral beams into the low and
hyperthermal energy regimes. In doing so it is important to gain an understanding of how
the differences between the two experiments are likely to affect the results obtained.
Several differences are immediately apparent. The dominant mechanisms for
particle-surface interactions in the different regimes are significant.
As mentioned
previously, particle-surface interaction is dominated by adsorption effects for thermal
energies and by kinetic effects in the hyperthermal and low energy regimes. Accordingly
10
the chemicurrent profile shown in Figure 1.6 is likely characteristic only for thermal
incidence measurements with higher energy profiles exhibiting significantly lesspronounced decay.
Although the particle flux is approximately comparable for the two different
cases, it is also likely that the higher-energy case would yield higher overall chemicurrent
densities, since the incident particles each carry higher energy. This could result both
from the incident particle event imparting more energy to each excited electron and from
more electrons being excited for each incident particle. In either case a greater number of
electrons would clear the Schottky barrier and the chemicurrent measured would be
larger.
Another consequence of the likelihood of higher energies for each electron-hole
pair is that thicker films would be more sensitive to chemicurrent than before, since the
electron mean free path is dependent on the electron energy. In fact, thicker films may
even become necessary to preserve adequate film thickness because of increased
sputtering probability at the higher beam energies involved.
The largest area of uncertainty in conducting this experiment involves estimating
beforehand what effect the beam’s charge state will have on chemicurrent production.
Although neutralizing the beam inside the scattering chamber before reaching the
Schottky diode sample does not appear to be workable using the present configuration, by
carefully choosing the beam and film species it is possible to ensure either very low or
very high ion neutralization probabilities after the sample scattering event. The possible
effects of ion neutralization “current”, electronic heating, and other probabilistic charge
dependent effects on surface electronic structure and overall chemicurrent production are
11
unclear at this point. This is an important question to be considered for future work,
possibly to be explored concurrently with preparation for the initial experiment itself.
Scope of Work
The beamline instrument was originally designed to facilitate alkali or gas ion
scattering off metal crystal surfaces [15], and while the beam species used have varied
from experiment to experiment, the available scattering samples have been limited to a
small selection of “hat” style metal-crystal samples, with copper and silver being most
commonly used. The system was also restricted by the difficulty required to change
samples, with the result being that the same sample was often used for months or even
years at a time.
One of the primary goals of this work is to increase the sample versatility of the
ion beamline, with the primary purpose being to make the experiment outlined above
feasible. This involves two separate but related aims: 1) retrofit the manipulator/sample
holder design to be able to accommodate rectangular diode samples; 2) make the
necessary changes to the sample holder design and the scattering chamber to enable quick
sample turnaround.
Chapter 2 discusses the design that has been implemented to
simultaneously accomplish both aims.
The second primary goal of this work is improve daily operational efficiency for
the beamline by designing LabView programs to provide transparent, interactive
automation capability for several key processes. Chapter 3 discusses the three main
automation applications and sketches the solutions implemented in each case.
CHAPTER 2
SAMPLE HOLDER AND TRANSFER SYSTEM
Introduction
In order to increase the versatility of the ion beamline’s scattering chamber, and in
particular to facilitate the conduct of the proposed Schottky diode experiment as outlined
in Chapter 1, the project required design of a new sample transfer/load lock system with
capability to seamlessly transfer samples under vacuum on a carrier specifically designed
to provide the enhanced characterization and measurement capability required. The
system as nearly completed consists of the following: 1) a sample dock that retrofits the
previous sample mounting system of the existing XYZ-translator/manipulator and meets
the physical constraints of the system; 2) a sample holder incorporating the necessary
electronics contacts as well as intrinsic heating and cooling capabilities; and 3) a vacuumisolatable load lock/magnetically-coupled linear translator system for transfer and
mounting of the new sample holder design.
All of the components mentioned above were custom-designed for our particular
requirements: the sample holder/dock stage was designed in AutoCAD using 3D
modeling and fabricated by the departmental machine shop, while the load lock/linear
translator package was supplied to specification by a third-party vendor. The remainder
of this chapter is devoted to discussion of the specification, design, and procurement
process for this upgrade, with the major design elements discussed previously divided
into separate sections.
13
Sample Holder
The basic design approach taken for the sample holder assembly, which includes
the sample, contacts, heating/cooling capability, and mechanical securing hardware, was
to separate the sample and its associated heating and cooling components from the
problem of securing the assembly and providing electrical contact to the sample dock.
As such the accommodations for the sample and associated components were
incorporated into a discrete module which will henceforth be referred to as the sample
mount, while the components needed to provide electronic connectivity and secure the
sample holder assembly to the sample dock were combined in a separately designed
module, known as the sample carrier. The sample mount and sample carrier could then
be fastened together to form the complete sample holder device. In addition to making
the design process simpler, this approach also has the advantage of allowing a single
unified sample carrier design for a variety of possible sample types and shapes.
Sample Carrier Module
The design for the sample carrier module was considered first.
Basic
requirements included providing connectivity for at least six contacts from sample mount
to sample dock while capable of quick sample turnaround at high vacuum.
To
accomplish this a design consisting of a set of three stacked, rotationally staggered rings
that couple to matching hooks on the sample dock was used to provide connectivity, with
each split to give a total of six electrical contacts on the sample carrier. A front sample
transfer ring designed to couple to a matching sample transfer claw (discussed at the end
of this chapter) is stacked on top of the three contact rings to provide rapid sample
transfer capability. The four levels are electrically isolated from each other using hollow
14
alumina spacers. The entire assembly is fastened using lengths of threaded rod passed
through the alumina spacers and secured with a hex nut on each end. Figure 2.1 shows
the design and primary components of the sample carrier (with no sample or sample
mount shown).
Transfer ring
(faceplate)
Insulating
spacers
Conducting
posts (6)
Split contact rings (6)
Figure 2.1
Sample carrier back view, without sample holder assembly.
Sample Mount Module
The sample mount had to be versatile enough to allow access for heating and
cooling the sample. The same basic design also needed to be able to accommodate both
rectangular cleaved silicon-type samples and circular hat-type metal crystal samples. The
dimensions for metal crystal samples are already well established, so the new design
needed to be able to incorporate those samples without modification. However,
the
basic design consists of a set of rings designed to be bolted to the face of the sample
carrier along with the actual sample retaining piece, which can be interchanged
15
depending on the sample type. See Figure 2.2 for a diagram of the sample mount as
designed for a standard hat-type copper crystal sample.
Sample holder ring
Heat sink (OFHC Cu)
“hat” Cu crystal
Heater retaining rings (3)
Figure 2.2 Example sample mount configuration for “hat”-type metal crystal sample.
Heater rings and OFHC heat sink are shown.
There are several other possible configurations. The sample mount assembly for
use in the future with rectangular diode samples will need to be able to electrically isolate
the sample from the sample carrier, which the standard sample does not require. This
design is not complete since diode dimensions have yet to be determined, but it would
presumably incorporate alumina/Macor® spacing rings between the conducting rings in
order to accomplish that effect, in much the same way as the individual rings of the
sample carrier are electrically isolated from each other.
As an example of a configured sample carrier/holder system, Figure 2.3 shows the
standard sample carrier with the sample mount shown in Figure 2.2 installed.
16
Face contacts (6)
Sample carrier
Sample mount
With sample
Figure 2.3
Front view of sample holder assembly. Shown are front of sample carrier
faceplate and installed locations of sample carrier and sample mount.
In order to provide the ability to monitor and control the sample temperature an
integrated heater and external cooling system was implemented. The cooling stage
operates via heat conduction through the copper body of the sample dock (described
below) as heat is transferred away from the sample via 1/8” flat copper braid strung from
the (existing) cooling Dewar mounted alongside the manipulator [16]. In order to cool the
sample liquid nitrogen is circulated through the Dewar.
The heater from the previous design was reused in the interest of saving design
and implementation time and the sample holder then designed with those size parameters
in mind. The heater is integrated into the system via a set of hollow rings designed to
hold the heater module close to the back of the sample without making contact with the
sample to provide optimum heating qualities without the possibility of damaging the
sample or apparatus.
17
In order to monitor sample temperature set points during heating and cooling
cycles it is also necessary to incorporate a thermocouple into the sample mount design.
The thermocouple used is of the alumel-chromel type, and measures the sample’s frontside temperature via a slot built into the sample holder.
Electrical contacts for both the heater and thermocouple come from the sample
dock via the set of staggered rings described previously. This requires a total of four
contacts, leaving two contacts for sample sensing or characterization. However, since the
heater, thermocouple, and sample contacts are unlikely to ever require simultaneous use
the current design should remain robust enough to allow future experiments requiring
more than two sample contacts.
Sample Dock
The sample dock was designed in tandem with the sample carrier and was
likewise required to be capable of incorporating six sample contacts since the sample
carrier module interfaces directly with the hook-contacts on the sample dock.
The
original manipulator head was quite versatile and would have required significant effort
to redesign adequately, so instead the new dock was designed to be dimensionally
consistent with the constraints of the original design (although this was not always
possible—see ‘Redesign’ section below). The manipulator allows for six total degrees of
freedom (XYZ translation, X-, Y-rotation, tilt). Translation is the simplest, being
accomplished using standard linear translation stages to translate the entire manipulator
assembly. Rotation about the vertical axis is also accomplished via rotation of the entire
assembly, while a worm gear mounted on the manipulator head engages the back
securing plate of the sample dock to enable sample rotation along the axis perpendicular
18
to the sample (X). Finally, a cable tensioning system accessed via an external screwdriver
mounted at the top of the manipulator shaft provides capability to tilt the entire
manipulator head a few degrees each direction. Figure 2.4 shows the sample dock
arrangement as installed in the body of the manipulator and the available rotational
degrees of freedom.
Z-Rotation
Main body (OFHC Cu)
Macor spacers
X-Rotation
Tilt
Alumina hat washers
Hooks/contacts (6)
Cooling head insulators (Macor)
Cooling head (OFHC)
Figure 2.4
Diagram of sample dock. Key exterior parts and available rotational
degrees of freedom are labeled.
Since the sample dock needs to fit within the cylindrical bounds provided by the
previous design, the foundation of the sample dock is a machined cylinder of oxygenfree, high-conductivity (OFHC) copper of high purity obtained from McMaster-Carr
Supply Co. with the appropriate outer diameter to fit within the previously allowed
dimension. Copper was chosen because of its high thermal conductivity, while the
19
specific alloy is used because of its favorable outgassing characteristics in vacuum,
particularly when heated [17]. The cylinder interior is cut to a hollow profile as described
previously to provide a conduit to the sample carrier for electrical contacts and cooling
braid. In order to save space and prevent shorting issues between the cooling braid and
electrical contacts, the copper cooling braid is mounted in slots machined in the interior
diameter of the dock body.
In order to accomplish the securing of the sample carrier to the dock a system of
securing hooks was implemented. The hooks are staggered at three levels with two hooks
on each level but on opposite sides of the dock body. This allows each of the six hooks to
engage a different ring, and since at each level of the sample carrier the rings are split so
that each half-ring is electrically isolated from all the others each of the six hooks
engaged a unique split ring so that mechanical docking and electrical contact
requirements were met simultaneously. In addition, since the rings (and hence the hooks)
are to serve as electrical contacts to the sample front plate, the hooks had to be
individually electrically isolated. This was achieved via the use of machined Macor
spacers with thru holes drilled in them such that the hooks could be secured to the dock
body via machine screws threaded into radial tapped holes in the dock body while still
being electrically isolated from the dock and from each other. The hooks were in turn
isolated from the machine screws by the use of Alumina hat washers obtained from
McAllister Technical Services, Coeur d’Alene, Idaho.
Figure 2.4, a diagram of the docking system, shows how the design met both the
mechanical and electrical requirements. The design also allows the sample to be secured
redundantly since secure docking of the sample carrier does not require all six hooks to
20
be securely fastened at once. Using this sequence of hardware it was possible to assemble
a docking system that met our requirements both in providing a sufficient number of
electrical contacts as well as being mechanically robust enough to allow effective, stable
sample docking.
Sample Transfer System
Load Lock/Magnetically Coupled Linear-Rotary Translator
The final component of the completed, operational system is the load lock/linear
translator system.
Without the versatility to be able to transfer samples quickly in
vacuum, the proposed Schottky diode experiment, which requires multiple tests using
diodes of varying parameters, would not have been feasible. The most rapid and
inexpensive method of procuring such a system was to purchase one off-the-shelf from
one of the many vacuum projects vendors in the industry. Because such systems are
readily available, the components of the sample transfer system discussed previously
were designed to require only linear and rotary translation to complete the sample
transfer cycle.
The requirements for the mounting port also need to be taken into consideration.
To provide adequate clearance for the sample carrier design, the inside dimension for
flanges and tubing in the transfer system needs to be slightly larger than the sample
carrier’s outer dimension of 2.0”. A total inside diameter of 2.25” is therefore adequate
to provide clearance for the sample transfer head while avoiding friction or interference
in the event that the sample carrier or transfer rod is slightly misaligned.
The chosen mounting port needs to be on the lower level for proper vertical
alignment with the sample dock position. A survey of available chamber ports found an
21
unused 4-½" chamber port (with inside dimension of 2.41”) to meet requirements.
Competitive quotes were obtained from a number of vacuum firms, and a solution
provided by Thermionics Inc., of Port Townsend, WA was contracted, delivered, and
installed. See Figure 2.5 for a schematic view of the purchased system. Figure 1.2 shows
the general location of the transfer system relative to the rest of the instrument.
(a)
28” magnetically-coupled
linear-rotary translator
6” load lock chamber
with door
(b)
Figure 2.5
Sample transfer system. Top (a) and side views (b) of 28” magneticallycoupled linear-rotary translator (MCLR) with 6” load lock chamber and 6” x 4½”
adapter.
Sample Transfer Tool
The final step was to design and construct a "claw" attachment for the linear
translator shaft that would securely grasp the sample and enable us to transport the
sample carrier securely between the load lock chamber and the sample mounting dock.
22
This was a fairly simple exercise, using hooks similar to the ones employed on the dock
which this time engage only the front transport ring of the sample carrier. In this case
there is no need for electrical connectivity to be provided through the hooks and onto the
transport ring, so all three hooks contact the single transport ring without the need for
them to be staggered or electrically isolated as on the sample dock. Figure 2.6 shows a
detail of this design and the available degrees of freedom used when performing sample
transfer.
Retract
Sample transfer head
Extend
CCW: Insert
MCLR Shaft
Sample transfer hooks (3)
CW: Remove
Figure 2.6
Sample transfer tool as installed on MCLR shaft.
degrees of freedom are utilized for sample transfer as shown.
Rotary and linear
Design Revision Process
The design went through a major revision near the end of the project when it was
discovered that the increased length of the sample from the vertical center of rotation on
the original design made it impossible to conduct scattering experiments at significant
angles or to clean samples via use of the sputter gun. Accordingly a substantial redesign
23
took place with the goal of dramatically shortening the overall length of the
configuration. This goal was reached via the following changes:
1. Moving the worm gear used to rotate the sample dock from the front of the
manipulator head to the back. This then made it possible to move the entire
docking system closer to the body of the manipulator.
2. Reducing the thickness of each of the rings on the sample carrier from 1/8" to
1/16" The clearance between successive rings was also reduced from 3/16" to
1/16". These changes required that the docking hooks and alumina spacers
between rings had to be modified (shortened) as well.
3. Adding a separate cooling head.
4. Moving the sample holder stack so that it was no longer secured to the front of the
sample carrier faceplate, but to the back. The sample is then accessible via a
circular aperture in the carrier faceplate. This has the added advantage that it
allows us to bring the sample carrier into direct contact with the dock's cylindrical
copper body, making cooling more efficient and less likely to adversely effect the
fragile insulators used in design of the carrier.
These changes allowed us to reduce the overall distance of the sample from the
vertical axis by over 1.1". The original design centered the face of the sample within the
scattering chamber. While still leaving the sample 0.66" off center, the changes outlined
above are adequate to achieve all likely scattering parameters using X and Y manipulator
translations. Since these axes rotate with the sample, the X axis, perpendicular to the face
of the sample allows control over the radial distance of the sample from the chamber
center. Both the X and Y translation axes allow approximately 0.5” total translation off
center in each direction, so by translating along the X axis radially toward the center of
the chamber we can reduce the total sample displacement from center from 0.66” to
0.16”. To re-align the center of a sample with the center of the beam then requires Y axis
translation, along the direction parallel to the sample face, with the translation distance
depending on the incident scattering angle parameter. A table of Y axis manipulation
values necessary to maintain sample centering for particular incident scattering angles is
24
presented in Appendix A.
Fabrication drawings of the various sample holder, dock, and transfer apparatus
are available for future reference in the “Sample Transfer System Fabrication Drawings”
notebook stored in Lab 13.
CHAPTER 3
ELECTRONICS, INSTRUMENTATION AND INTERFACING
Introduction
A significant portion of the scope of this project involved adding to and/or
upgrading the existing instrumentation and electronics capabilities of our experiment. As
originally installed the beamline was operated almost exclusively by a wide range of
custom-built, manual, analog power supplies and control boxes. This meant that
practically any operation on the beamline, even something as simple as tuning a beam or
monitoring its stability over time required a large amount of repetitive labor and
observation, from the actual tuning operation to monitoring and recording of instrument
readings. While some level of manual control is desirable with the system because of the
sensitive and temperamental nature of many of the existing beamline instruments and the
difficulty and expense that would be required to fully automate most processes, it is
desirable to reduce the amount of tedious manual operations required for certain basic,
frequent operations such as monitoring of long-term beam stability. To this end a
LabView software program was written, integrated, and implemented to give a basic realtime graphical readout (and text-file output capability) of the beam current data obtained
via the Keithley 617 GPIB-capable electrometer we use to measure beam intensity at one
of the 3 Faraday cup devices on the beamline [18].
In addition to the need to automate repetitive tasks was the need to perform
complex or high-speed automated data acquisition processes. Previously this was
accomplished by using a GPIB-bus enabled Linux/Unix workstation to interface with
26
several analog and digital acquisition devices, both off-the-shelf and custom built. These
routines involved simultaneous analog to digital conversion, counting, and analog and
digital IO using several discrete components. However, upon bringing the system back
online it was found that several of the key components from the previous implementation
were no longer operational. Additionally, the age of several of the other components, the
difficulty of adapting and debugging the legacy C code, and the overall preference for an
integrated, graphical interface/virtual instrument approach made it reasonable to simply
rewrite these components from scratch using LabView, a highly intuitive yet quite
versatile graphical programming language.
The flexibility, usability, and capability of our LabView instrumentation server
was greatly enhanced by installation of a high-data rate, multifunction DAQ card
(IOTech DaqBoard/1000). Several key programs would have been significantly more
difficult to implement without the capabilities provided by this advanced interface.
The remainder of this chapter will be devoted to discussing instrumentation and
programming work for the following three systems: 1) current monitoring/electrometer
automation; 2) Colutron beam tuning; and 3) electrostatic analyzer (ESA) operation.
These projects will be discussed in turn and related to each other where appropriate.
They are listed above in order of increasing algorithmic and/or implementational
complexity:
Due to the nature of LabView graphical code it is not practical to include the
actual code in this document. However, Appendix B includes logic flow charts of the
three main programs discussed here for future reference. The appropriate files may be
found using the filenames accompanying those charts.
27
Current Monitoring/Electrometer Automation
During beamline operation it is frequently desirable to obtain some indication of
the beam's ion flux. Since the charge state of individual ions is known (this is
constrained by Colutron and monochromator tuning), a generalized relationship exists
between the current carried by a beam and the flux. This relationship can be quantified
as
I = ∑ qi Φ i
(1)
i
where q is the charge state of a particular species i and Φi is the species’ total flux.
Beam current is measured using Faraday cups installed at strategic positions along
the beamline. Coupling these devices with a high-precision digital electrometer (in this
case a Keithley 617) produces an instrument capable of measuring the beam flux with a
high degree of precision. Since the KE 617 is also programmable via the General
Purpose Instrumentation Bus (GPIB/IEEE-488) specification [19], the instrument can be
interfaced with a PC to enable real-time monitoring of the beam's behavior, with graph
history and the ability to output data files.
There are several circumstances in which a measurement of the behavior of a
beam’s flux over time would be desired. First, when tuning a beam we desire to
maximize the total beam flux into one of the three Faraday cups installed in the different
sections of the beamline. The first one, just past the source/Colutron section, is needed to
maximize beam flux through the Colutron (magnetic filter) and the first set of
electrostatic filters. The second, past the 90º monochromator section, is needed to
properly tune the monochromator settings, again with the goal of maximizing beam flux.
28
The third one is mounted inside the chamber at the bottom of the manipulator head and
can be maneuvered into position where the sample would normally sit to maximize final
beam flux. Use of an automated program speeds up this tuning process by giving a visual
representation of beam flux as the filter parameters are adjusted. Although it is possible
to manually adjust the beam flux using the electrometer readout, it is usually more
efficient to use an automated program to visualize the maximization process instead.
The second requirement for a beam current monitor is due to the need to monitor
beam stability over relatively long periods of time. Because of the natural fluctuation of
emitted flux due to source variations, heating effects, etc it is vital that we be able to
monitor changes to beam flux to ensure that beam flux at the sample is constant over
relatively short time scales, such as the amount of time it would take to acquire a set of
scattering measurements. After tuning a beam into the chamber and prior to obtaining
scattering measurements it then becomes necessary to monitor beam current into one of
the Faraday cups for some period of time to ensure that the beam is relatively stable.
This monitoring operation is difficult to do without the aid of a graphical interface
showing the beam history. The program also needs to be able to quantitatively calculate
a statistical measure of the change in flux over its history since graph scaling issues can
sometimes lead to misinterpretation of purely graphical results.
Implementation of the program was fairly straightforward: the program needed to
begin a continuous acquisition via GPIB from the Keithley 617 on demand, outputting
real-time electrometer data to a history graph while simultaneously calculating the
percentage change from the beginning of the acquisition. It should also automatically
generate an output data file at the end of each acquisition. This program has been
29
completed, tested and debugged and is presently in operation. Details of the algorithm
employed can be found in the corresponding logic flowchart in Appendix B.
Wien Filter Beam Tuning
One of the first procedures undertaken in preparing a beam for an experiment
involves tuning the Wien filter, often referred to as the "Colutron" after its manufacturer.
The device consists of a pair of coupled coil electromagnets at right angles to a pair of
electrostatic deflectors, all mounted on opposite sides of the first section of the beamline,
just past the ion source. Between the electromagnets the magnetic field is approximately
linear and is roughly linearly dependent on the coil current. By graphing magnetic field
versus coil current for a known source (Rb) we obtained a magnetic field-current
relationship of
B0 = 0.022 I coil .
(2)
The electric field between the plates is also linear can be considered to be equal to the
voltage difference across the plates divided by their separation. For this system the
relationship between voltage and electric field is given by
E 0 ≅ (12 500 225 m ) Vm
(3)
(based on manufacturer specs of E0 =12 500 V/m @ 225 V [20]). A general set of
)
differential equations describing the system would be as follows, with the z direction the
beam’s direction of propagation [21].
⎧m &x& = e E x + e z& B y
⎪
⎨m &y& = e E y − e z& B x
⎪ &&
⎩m z = e E z − e z& B z
(4)
If we assume the magnetic field to be B0, directed along the x-axis and
30
perpendicular to the electric field, E0, aligned with the y-axis, these differential equations
become [22]:
⎧ m &x& = 0
⎪
⎨ m &y& = e E y − e z& B x
⎪ &&
⎩ mz = 0
(5)
Since the second equation is the only nontrivial one it is obvious that the only net
force applied to the beam is in the plane perpendicular to the magnetic field and depends
on the velocity ( z& ) of the beam. Solving for the case of an undeflected beam, where
∑ F = m &y& = 0 ,
(6)
we find that only ions satisfying the parameter z& = v = E 0 B0 will pass through
undeflected. Since the kinetic energy of the beam, K, is related to the velocity via
K = 12 m v 2 = q V
(7)
where V is the beam voltage and q the ion charge, we can rewrite the above condition as
q
1 E 02
=
,
m 2 V B02
(8)
so for this case specifying a beam velocity is the same as choosing a particular chargemass ratio. This makes it clear that operation of the Wien filter introduces a slight
ambiguity, since all ions with the same approximate charge-to-mass ratio (velocity) will
be passed through, so the Wien filter does not specify the beam parameters as uniquely as
might be desired. In practice, this can be a significant problem for certain types of beam
containing high impurity ratios, especially when the impurities exist in multiply-charged
states and significantly different atomic mass. This difficulty is resolved by concurrent
use of a 90-degree spherical electrostatic analyzer as a monochromator. This device is
31
designed such that it passes only particles of a precise energy, Epass, such that
Vsphere = E pass ⎛⎜ ∆r ⎞⎟
⎝ rm ⎠
[23], thus eliminating the ambiguity.
(9)
The monochromator is designed such
that ∆E E ≅ 1 % , so the Wien filter and monochromator together give us a very clean,
precisely specified beam.
Because of its ability to pass ions of only a selected q/m ratio, the Wien filter is
just as useful for isolating the desired beam current out of the background of various
isotopes, charge states, and atomic species present in commercially available ion sources
as it is for maximizing beam current. Although for some source types, such as
aluminosilicate solid-state sources, this background is relatively minimal, other types,
particularly gas sources, often generate a fairly "dirty" beam which would be impossible
to purify without a device of this type. In any case, even the purest beam emitter sources
contain at least some isotopic impurities which it would be desirable to filter out before
the scattering section, making the Wien filter a necessary component of a "clean"
experiment.
The process of tuning a beam through the Wien filter requires the operator to
cycle through a range of magnet current values while recording the corresponding beam
current values in the Faraday cup mounted just past the Colutron section. Unfortunately,
the process of cycling the magnets while monitoring beam current becomes very tedious
and time-consuming. Since the process is easily automated given a relatively small set of
arbitrary initial parameters a LabView program was written to carry out this task
automatically. (Note that this program is operational, but as the first major program
written for this project is in need of some modification to achieve optimal operation.)
32
This program required simultaneous GPIB access to two channels: first, the
channel used by the Kenwood PD36-20AD/GP-610D power supply controlling the Wien
filter magnet current [24] and second, the channel used to obtain beam current data from
the ubiquitous KE617 electrometer.
The algorithm for this program is more difficult due to the large number of input
variables. The program needed to be able to increment either automatically (timed) or
manually through a set of data points which the program calculates using a set of input
parameters for initial and final current values and current step increment. It should pause
after switching current values but before reading the corresponding electrometer value by
an amount of time given by a delay time control, which allows the change in beam
parameters to catch up before a reading is taken. Once it reaches the peak value the
program then needs to be able to gradually ramp down since a sudden increase or
decrease of current may be harmful to the Wien filter magnets. Peripheral functions also
desired include a built-in calculator to calculate peak mass based on the corresponding
input parameters and the ability to zero or un-zero the electrometer on demand.
The logical design of this program is likewise given in the corresponding
flowchart figure in Appendix B.
Electrostatic Analyzer Automation
During a scattering experiment the most basic piece of experimental data is the
range of scattered intensities for the particular incident angle. To obtain this data we use
a hemispherical electrostatic analyzer, or ESA. The central component of the ESA is an
electron-multiplier detection unit, mounted in the plane of the beam and rotateable to be
able to intercept ions scattered from the sample at a wide range of angles. This allows us
33
to obtain beam intensity values for whatever needed. Typically the sample is set at some
standard incident angle θ i to the beam (i.e. 30°, 45°, 60°, etc) and the ESA detector is
rotated through a spectrum of scattered angles θ f giving a spectrum of angular intensity
information for a particular incident angle.
The actual data generated by the ESA comes from the electron multiplier but is
first processed by a Modern Instrumentation Technology (MIT) F-100T preamplifier,
which amplifies the electron multiplier signal and generates a corresponding binary
signal from the analog input based on a built-in discriminator level. The preamp output
signal is then measured by a counter, which generates frequency or totalized counting
information as required.
Taking ESA data requires a software solution, since the scanning needs to take
place at higher rates than possible for manual acquisition. The previous solution
consisted of PC interfaced with a custom-built DAC board (which generated
programming voltages) and also, via GPIB, with a HP5335A counter. The PC's C++
program used the DAC board to sequentially generate programming voltages while
simultaneously monitoring the counter output over GPIB. Unfortunately the DAC board,
which had a history of unreliability, failed again, leaving the necessity of replacing it with
something more reliable. In addition, the age of the equipment, the difficulty of
maintaining the code, and the desire for more graphical, real-time feedback results made
it reasonable to scrap the previous system altogether. Rather than replacing the failed
components an IOTech DaqBoard/1000 LabView-capable PCI interface card was
acquired. The multiple previous components and custom-built electronics could then be
abstracted to graphical, modular LabView code, simultaneously giving greater code
34
flexibility and more transparent operation.
The design process for this program was convoluted.
The first major issue
encountered was due to the difficulty of setting up even a simple acquisition or output
using IOTech’s supplied LabView code library.
Unfortunately the design of these
components was quite non-intuitive and required several poorly-documented steps to
obtain the desired results. Nevertheless, these issues were eventually overcome and the
algorithm design stage completed.
Because of IOTech’s peculiar LabView implementation the first step to be taken
at the beginning of an acquisition was to initialize the DAQ board by inputting the
relevant channel and I/O information. Subsequently the program would begin cycling
through pass energy values using the starting and final energy values supplied and
dividing the energy bandwidth by the number of desired points. For a given pass energy
value the program calculates the necessary power supply programming voltage for the
power supply being used (either the low- or hyperthermal-energy ESA power supply)
using a formula derived from manual calibration of the supply. It then writes that
programming voltage to the power supply, which sets the ESA sphere voltage as desired
and specifies the pass energy. The program then waits for a period of time specified as
the sleep time before beginning to record counts.
Another major hurdle was encountered in the process of attempting to obtain ESA
counts using the TTL counter channel on the IOTech board. Since the F-100T preamp
apparently outputs a voltage well below standard TTL-high levels the initial assumption
was that the signal needed to be amplified.
However, testing of various op-amp,
discriminator, and trigger circuits never showed capability to do anything other than
35
amplify the noise background.
Meanwhile the HP 5335A counter used previously
worked fine as long as the trigger level was set low enough to trigger off the reducedamplitude preamp signal. Deeper investigation showed that while the HP counter is
capable of measuring signals with frequency of up to 200 MHz [25], our IOTech
Daqboard/1000 was limited to 200 kHz [26]. Although the counting rate was only
approximately 1 kHz, the extremely short pulse length (~10 ns) made the necessary
effective sampling rate approximately 100 MHz. Since the DAQ board clearly was
unsuitable for this application it was decided to revert to using the HP 5335A counter for
sampling while continuing to use the DAQ board to output voltage values to the power
supplies.
Returning to the algorithm execution narrative, the HP counter will be instructed
using GPIB to collect data for a precisely defined time window, which the program refers
to as dwell time. At the end of that time a GPIB read command returns the collected
number of counts to the program, which stores the data in an array and displays it on a
graph showing the data for the current sweep. The program then increments the pass
energy and continues to take successive detector counts vs. pass energy data until it
reaches the end of the acquisition. Once data acquisition is complete the program takes
the necessary steps to properly close the DAQ interface.
The user then has the
opportunity to save an output file of the acquired data.
This program is functional but still in the testing stage. Just as the issues with the
DAQ counter operation were not apparent until the program could be tested with a real
signal it is likely that other bugs will be encountered under increasingly realistic testing
scenarios. Nevertheless, the basic program algorithm as shown in the corresponding
36
logic flowchart in Appendix B will likely remain basically unchanged.
Conclusion
This thesis has been devoted to discussing changes to the Sosolik Group ion
beamline instrument necessary to accomplish a new class of experiments extending
previous Schottky diode chemicurrent measurements to hyperthermal- and low-energies
using an accelerated ion beam. The previous experiments are discussed and the results
likely to be observed using the different experimental parameters are evaluated. The final
chapters discuss the scope of work involved to enable these measurements to be taken,
with separate chapters devoted to changes made in the areas of apparatus and
instrumentation design, respectively.
APPENDICES
38
Appendix A
Table of Manipulator Centering Values by Angle
39
Table A.1
Required Y-axis manipulator values for re-centering of manipulator. All
dimensions given are relative to the center of the scattering chamber. For negative angles
use reciprocal Y values.
Incident Angle, θι [°]
Y position [in.]
10.0
15.0
20.0
25.0
30.0
35.0
40.0
45.0
50.0
55.0
60.0
65.0
70.0
0.028
0.044
0.058
0.075
0.092
0.112
0.134
0.160
0.191
0.229
0.277
0.311
0.440
40
Appendix B
Logic Flow Diagrams of LabView Programs
41
Figure B.1
Logic flow diagram corresponding to LabView code for Keithley 617
electrometer monitoring . Appropriate GPIB commands for the KE 617 are shown.
42
Figure B.2
B.2
Logic flow diagram corresponding to LabView code for Wien
filter automation. The necessary GPIB commands for both the KE617 and Kenwood
PD36-20AD are shown.
43
Figure B.3
Logic flow diagram corresponding to LabView code for electrostatic
analyzer (ESA) automation.
REFERENCES
1.
D. L. Adler Kinematics of Hyperthermal Energy Ion Scattering (Cornell
University: Dissertation) (1989) 11.
2.
C. E. Sosolik Heavy Atom Collisions and Thermal Effects in Hyperthermal
Energy Ion-Surface Scattering (Cornell University: Dissertation) (2001) 4.
3.
R. L. McEachern Trajectory and Impact Parameter Analysis of Hyperthermal Ion
Scattering (Cornell University: Dissertation) (1990) 22.
4
R. L. Seliger J. Appl. Phys 43 5 2352-57 (1972).
5.
Adler 23-28.
6.
Adler 15.
7.
Adler 17-22.
8.
Adapted from H. Nienhaus Surf. Sci. Rep. 45 5 (2002).
9.
H. Nienhaus Phys. Rev. Lett. 82 446- 449 (1999).
10
H. Nienhaus Appl. Phys. Lett. 74 4046-4048 (1999).
11.
Adapted from H. Nienhaus Phys. Rev. Lett. 82 446 (1999).
12.
Adapted from H. Nienhaus Phys. Rev. Lett. 82 446 (1999).
13.
H. Nienhaus Phys. Rev. Lett. 82 447 (1999).
14.
H. Nienhaus Phys. Rev. Lett. 82 447 (1999).
15.
McEachern 17-18.
16.
McEachern 29.
17.
J. H. Moore, C. C. Davis, and M. A. Coplan Building Scientific Apparatus
(Cambridge[Mass.]: Perseus Books) (2003) 105.
18.
McEachern 24.
45
19.
Model 617 Programmable Electrometer: Quick Reference Guide (Cleveland:
Keithley Instruments) (1984) 35.
20.
http://www.colutron.com/products/kit/sample.html
21.
Seliger 2352.
22.
Seliger 2352.
23.
Adler 24.
24.
GP-610A/GP-610D GP-IB Adapter Instruction Manual (Yokohama [Japan]:
Kenwood TMI Corp.).
25
Operating and Service Manual; 5335A Universal Frequency Counter (Santa
Clara: Hewlett Packard Co.) (1980) 1-2.
26
DaqBoard/1000 and /2000 Series User’s Manual (Cleveland: IOTech Inc.)
(2005) 1-2.