1
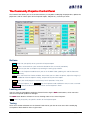
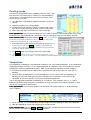
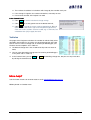
Community Projector 2010 User M anual T he C o m m unity P ro jecto r is an interactive planning calculato r that uses the latest availab le d ata to create co nsistent pro jectio ns fo r the po pulatio n and d w elling s o f a Lo cal G o vernm ent A rea, and calculate the co ntrib utio n to g ro w th o f new d w elling s o f d ifferent types and sizes. ................................................................ ........................................... S tarting the C o m m unity P ro jecto rr................................ ................................ ................................ ........... 2 U sing the C o m m unity P ro jecto r................................ ................................................................ .............................................. r................................ ................................ .............. 2 ................................................................ ................................................................ ....................................... ....... 2 T he initial d ata ................................ ................................ ................................ anel................................ ................................................................ .................................. 3 T he C o m m unity P ro jecto r C o ntro l P anel ................................ ................................ B uttons ......................................................................................................................................................... 3 Looking around ............................................................................................................................................. 3 Tuning ........................................................................................................................................................... 3 R eset buttons ............................................................................................................................................... 4 anel................................ ................................................................ ......................................... S o m e setting s in the C o ntro l P anel ................................ ................................ ......... 4 P rojection Y ears and P lanning P eriod .......................................................................................................... 4 Focus ............................................................................................................................................................ 4 N am ing .......................................................................................................................................................... 4 Locality.......................................................................................................................................................... 4 S etting A ssum ptio ns ................................ ................................................................ .............................................................. .............................. 5 ................................ D w elling Lim its.............................................................................................................................................. 5 V acancy rates ............................................................................................................................................... 5 D w elling trends ............................................................................................................................................. 6 C om position ................................................................................................................................................. 6 O ccupancy changes..................................................................................................................................... 7 O ccupancy lim its .......................................................................................................................................... 7 Institutions .................................................................................................................................................... 7 V ehicles......................................................................................................................................................... 8 p? ? ................................ ................................................................ ................................................................ ............................................ M o re h elp ................................ ................................ ............ 8 C om m unity P rojector 2010 U ser M anual The P ublic P ractice P ty Ltd 2010 S tarting the C o m m unity P ro jecto r The C om m unity P rojector is provided as an E xcelw orkbook called Projector2010n.xls, w here n is the version num ber. It prints out as a 27-page report, w ith explanatory text and tables that progressively calculate population, dw elling num bers and occupancies for an area. The C om m unity P rojector w orkbook has three sheets – The Projector sheet is about 1000 row s long and has the m ain report, The D ata sheet contains the localarea data, and The Tables sheet has som e C ensus tables from 2001 and 2006. T o start the P ro jecto rr, open E xcel, check that m acros are enabled (so the program can run), then open the P rojector2010 spreadsheet. The P rojector opens as a norm alE xcelspreadsheet. A License N ote w illappear, and you m ust click agreem ent to the conditions in order to proceed. S elect your printer and P review the P rojector report to check it fits neatly. The P rint A rea is set for the w hole report (but you can change this to print parts). If the report does not fit neatly onto pages (eg a row flow s over onto its ow n page, or a colum n does not fit), adjust the m argins so it fits for your printer. N ote that the P rojector sheet is “protected” every tim e it updates, to restrict data entry only to the allow ed areas (yellow /orange cells). If you need to adjust other parts of the spreadsheet (eg to im prove layout), you m ust unprotect the spreadsheet first. There is no passw ord. U sing the C o m m unity P ro jecto r The C om m unity P rojector calculates future dw elling num bers and occupancies from the baseline of the 2006 C ensus count. These calculations are based on assum ptions w hich the user adjusts untila realistic scenario is calculated. A ssum ptions m ust be m ade for trends in dw elling construction and usage – the default assum ptions are that 2001 to 2006 trends are follow ed. T he essential task o f the user is to m o d ify these assum ptio ns to achieve a d evelo pm ent scenario that is reaso nab le and pro b ab le. Y ou can alter assum ptions in the P rojector either directly into the spreadsheet or by using the C ontrolP anel. C licking the S hield icon on the spreadsheet (just to the right of the report area) m akes the C ontrolP anelappear. O nce assum ptions have been set, clicking the U pdate button on the C ontrolP anel runs the P rojector m odelfor each selected year, and sum m arises the results into the E xecutive S um m ary and the m ain P rojections Table. The graph updates. The scenario is ready to print. Y ou can alter the assum ptions and run as m any scenarios as you w ant, untilyou have a projection w hich is reasonable w ith defensible assum ptions. Whenever you update a scenario, the spreadsheet is locked, allow ing data to be entered only in the yellow or orange cells containing the assum ptions. Y ou can unlock the spreadsheet if you w ish. T he initial d ata Y our C om m unity P rojector com es loaded w ith data for your area, region and state/city. S om e data is from the 2001 and 2006 C ensuses, since these provide the m ost accurate count of dw ellings and occupancies. P opulation and dw elling data is loaded for every C ensus C ollectors D istrict (C C D ) or in your LocalG overnm ent A rea. These C C D s are added into the localities you w ant, such as suburbs, w ards, tow nships or districts. P rojections are m ade for every locality. S elected C ensus tables giving dw elling, bedroom and vacancy data for the LG A are loaded. This data is not available at the C C D level. From other A B S sources, recent building approvals data and population estim ates are loaded. A ny other population projections for your LG A can be entered for com parison w ith the P rojector m odelling. C om m unity P rojector 2010 U ser M anual page 2 of 8 T he C o m m unity P ro jecto r C o ntro l P anel The C ontrolP anelallow s you to see and am end m any assum ptions underlying the projections, update the projections, look at various parts of the P rojector report, and print any scenario you w ant. Buttons B lue buttons let you quickly see any part of the P rojector report R eset buttons reset trends to a pre-set form ula based on C ensus trends (see below ) A lter buttons let you alter assum ptions by factoring the settings up or dow n. U pdate runs the P rojector m odelfor each year set in the M ain Table, updating this and the Executive S um m ary. P rint opens the ExcelP rint P review w indow , from w here you can select the printer, adjust the m argins (if needed to m ake the report fit neatly), and print allor part of the report. Em ail opens your em ailprogram to m ake it easy to ask questions if they arise. S ave saves the P rojector, as is. S aveA s saves the P rojector under a different nam e, to save a scenario. C lose M enu closes the C ontrolP anelso you return to the P rojector in Excel. Looking around Y ou can m ove the spreadsheet under the C ontrolP anelusing the lo o k arrow buttons, w hich m ove the view of the P rojector up/dow n or left/right The zo o m arrow buttons w illzoom in or out, show ing m ore or less of the P rojector. B lue buttons let you quickly see specific sections of the P rojector report Tuning There are a num ber of buttons on the C ontrolP anelthat let you alter or reset som e of the underlying assum ptions. M ore detailon these is given later. C om m unity P rojector 2010 U ser M anual page 3 of 8 Reset buttons The R eset buttons set the assum ption back to a default form ula based on C ensus trends. D w elling ss: sets the dw elling changes in Table 3 to the rates over 2001 to 2006. ns: sets the annualchange rate in non-private (institutional) dw ellings (Table 9) in each Institutio ns locality as the average rate over 2001 to 2006 for the locality, the LG A , region and state. ccupancy: sets the annualoccupancy change rate in Table 7 to the rates over 2001 to 2006. O ccupancy C o m po sitio nn: sets the projected com position of dw ellings (ie % of houses, sem is and flats w ith 01, 2, 3 and 4+ bedroom s) in Table B 7 to the 2006 rates. es: sets the projected change rate in vehicles per dw elling to the rates over 2001 to 2006. V ehicles acancy: sets the anticipated long-term vacancy rates in 2031 (in Table 2) to the 2006 rates. V acancy ts: sets the m axim um and m inim um occupancy rates for each type of dw elling to O ccupancy lim its the highest and low est across the localities in 2006. unt: adjusts visible row s and heights in locality tables Lo cality co unt ts: the C lear button deletes any dw elling lim its set in Table 3. D w g Lim its S o m e setting s in the C o ntro l P anel Projection Years and Planning Period In the sum m ary Table 1, there is a colum n for each year projected. Y ou can enter any years you w ant in these colum ns. The start and end year of any planning period should be included. When you U pdate the P rojector, it calculates each of these years. The P lanning P eriod is the period reported in the P rojector E xecutive S um m ary. Y ou enter the start and end years you w ant into the C ontrolP anel. These m ust be tw o of the colum n years Focus The Focus Y ear is the year reported in the bulk of the P rojector, illustrating the projection calculations. Y ou enter any year you w ant into the C ontrolP anel. It does not have to be one of the P rojection Y ears. Naming Y ou enter the nam e of the LG A , as it is to be reported in the P rojector. If you w ant to change locality nam es, do so in the D ata S heet by changing the nam es in the first colum n of the D ata Table. To add new localities, do so in the m ain D ata Table E nter the locality nam e and the data (eg by adding together C C D s into a new area) in a blank row in the D ata Table. If there are no spare row s, do N O T add row s. Y ou w illhave to replace an area. Leave a blank row betw een localities included in the LG A total, and others of interest. Then alter the Locality num ber in the C ontrolP anel, and R eset the row heights in tables. Locality Y ou enter the nam e of the generic nam e of the localities, e.g. ‘suburb’ or ‘district’, for use in the P rojector text. If you change the C ount of localities reported in the P rojector, record this here. Y ou enter the num ber of localities in the locality tables, w hich together add up to the LG A . Y ou enter the num ber of other localities, as show n in the locality tables, for w hich you w ant projections, but w hich are not included in the LG A total(even if in the LG A ). The R eset B utton adjusts the tables to hide unw anted row s, using these counts. C om m unity P rojector 2010 U ser M anual page 4 of 8 S etting A ssum ptio ns Y ou can alter assum ptions in any of the yellow / orange cells directly into the spreadsheet, or you can use the C ontrolP anelto alter or reset key assum ptions. A ssum ptions are m arked in the P rojector by show ing them in yellow cells: Long-term vacancy rates (enter future vacancy rates for dw elling types here:) 5.7% 6.3% 8.1% If alternative assum ptions are types into any yellow cells, they turn orange to show they have been altered from the default form ula: Long-term vacancy rates (enter future vacancy rates for dw elling types here:) 5.7% 7.0% 8.1% Dwelling Limits D w elling lim its can be set in Table 3 for houses, sem is and flats in each locality, to reflect available opportunities. When the num ber of dw ellings reaches this lim it, it w illno longer increase, regardless of the rate set. This w illconstrain population grow th. In Tables 3 and 4, show ing the projected num ber of dw ellings, the cells are shaded pink if the num ber has reached the lim it. D w elling lim its can be set based on a study of developm ent opportunities in each locality, or in order to constrain cum ulative grow th to a desired target. In the spread sheet: Y ou can enter num bers into the yellow cells under ‘D w elling Lim its’ in Table 3. A blank cellm eans no lim it is set. Totals are not calculated as they are not relevant. In the C o ntro l P anel: Y ou can S how or C lear the D w elling Lim its, but can only enter new lim its directly onto the spreadsheet by closing the C ontrolP anel. Vacancy rates V acancy rates determ ine the proportion of dw elling stock that is occupied. Increasing vacancy rates over tim e w illm ean that a stock of dw ellings w illhold few er people, allother things being equal, so population w illrise slow er, or fallfaster, than otherw ise. Y ou can either assum e that vacancy rates w illnot change over the planning period, and use the default settings, or can set alternative vacancy trends. U sing the default vacancy settings (the 2006 C ensus rates for houses, sem is and flats, rounded to 0.1% ) is a sensible starting position, given that the ‘vacancy rate’ used in the P rojector is a C ensus m easure, and can only be re-m easured in subsequent C ensuses. O nce a reasonable scenario is set using other variables, the vacancy rates can be changed to test the sensitivity of outcom es. The 2006 vacancy rates are show n in Table 2 from C ensus data. Future vacancy rates are set at the bottom of Table 2 by entering the estim ated vacancy rates for the year 2031. The P rojector calculates the vacancy rates for other years by assum ing a linear trend from 2006 to 2031. In the spread sheet: V acancy rates are set in Table 2. R ates can be entered for each type of dw elling, as either a fraction ‘.057’ or as a percentage ‘5.7% ’. Vacancy rates 2006 5.7% 6.3% 8.1% Vacancy rates in 2031 5.7% 6.3% 8.1% 5.7% 6.3% 8.1% Long-term vacancy rates (enter future vacancy rates for dw elling types here:) In the C o ntro l P anel: A lternative rates can be entered into text boxes for each type of dw elling, as either a fraction ‘.057’ or as a percentage ‘5.7% ’. Y ou can also R eset the vacancy rates to the default 2006 rates. C om m unity P rojector 2010 U ser M anual page 5 of 8 Dwelling trends Y ou enter the anticipated num ber of additionalhouses, sem is, and flats per annum for each locality in Table 3 (net, after dem olitions). Future stock is calculated from the 2006 C ensus baseline at the annualrates you set here. The LG A totalis calculated by adding the localities, and is not entered. N egative num bers m ean net dem olitions. The default rates for dw elling changes in each locality are the rates for the locality over 2001 to 2006, show n in yellow cells. When alternative rates are entered, the cells turn orange. In the spread sheet: R ates of extra dw ellings are set in Table 3. N um bers (extra dw ellings per year) can be entered for each type of dw elling in each locality. C ells turn orange to show that new data is entered. In the C o ntro l P anel: C licking the D w elling A lter button on the C ontrol P anelopens the D w elling A djustm ent Form . This show s the current num ber of extra dw ellings pa set in the P rojector. E nter alternative Targets for the annualextra (or loss) of houses, sem is and flats, then click A djust. The difference betw een the C urrent and Target figures w illbe distributed am ong the localities. The C urrent figures w illbe revised. The R eset B utton sets changes to the 2001-2006 trend. The S m ooth B utton w illiron out m inor opposite variations in the annualnum ber of sem is and flats, as these could be caused by different classification betw een C ensuses, Composition The com position of dw ellings is the proportion of different size, m easured by bedroom s. If the com position of dw ellings changes over tim e, say to a higher proportion of 1-bedroom units, this w illaffect the num ber of bedroom s, and hence potentialoccupancy. M ore sm aller dw ellings w ould m ean few er residents. A baseline com position for the LG A can be calculated from 2006 C ensus data, for each type of dw elling. C ouncils often set requirem ents for new developm ents to have certain m inim um proportions of dw ellings of each size. S etting the long-term rate allow s the com position of extra stock to be calculated, to check assum ptions are consistent w ith planning policies. Y ou set the projected com position of dw ellings (ie % of houses, sem is and flats w ith 0-1, 2, 3 and 4+ bedroom s) by determ ining a long-term com position (in 2031), from w hich the P rojector calculates a linear change rate, using 2006 as the baseline. In the spread sheet: Y ou can enter num bers into the yellow cells under ‘long-term % of dw elling each size’ in Table B 7. D o not enter the % in 0-1 B R dw ellings, or the average long-term B R /dw g, as these are calculated. Totalfor alldw ellings are not calculated as they are not relevant. In the C o ntro l P anel: Y ou can S how or R eset the Long-term C om position, but can only enter new data directly onto the spreadsheet by closing the C ontrolP anel. C om m unity P rojector 2010 U ser M anual page 6 of 8 Occupancy changes In the P rojector, one of the m ost im portant assum ptions influencing future population is the trend in occupancy rates. Increasing occupancy rates w illm ake the population grow even if dw ellings are static. Table 7 show s the occupancy trends. If the cells are yellow , they are the default trends (over 2001-2001). If they are orange, other rates have been entered. In the spread sheet: Y ou can enter occupancy rates for each type of dw elling in each suburb directly into Table 7. The rates are in percentage change per annum , so –0.2% m eans the occupancy rate falls at the rate of 0.2% p.a. (linearly). A fter 5 years, it w illhave fallen 1% . The LG A average are calculated from the suburb rates on the w eighted by num ber of dw ellings. Y ou cannot enter these. In the C o ntro l P anel: C lick S how to see current settings for occupancy grow th, C lick R eset to set the change rate to the default form ula, C lick A lter current settings proportionally. This opens the O ccupancy C hange m enu, w here you enter alternative rates for occupancy changes in house, sem is and flats across the LG A , and select how to distribute these across the localities. Occupancy limits Y ou can sets the m axim um and m inim um occupancy rates for each type of dw elling through the C ontrol P anel. If the occupancy trend is such that the occupancy of a type of dw elling in a locality reaches the lim it in som e future year, it cannot change further. The default lim its are set as the highest and low est found for each type of dw elling across the localities in 2006. Y ou type alternative occupancy lim its in the C ontrolP anel. The rates are stored outside of the report in the S ettings B ox. They are reported in the text above Table 7. C lick R eset to set the rates to the 2006 lim its. Institutions The projected population in non-private dw ellings (eg institutions) is calculated separately from the population in private dw ellings; the tw o are added to give the totalpopulation. This occurs in Table 9. The baseline institutionalpopulation is the count of residents in non-private dw ellings in the 2006 C ensus. The change p.a. rate is the annualchange in the num ber of people counted in institutions betw een 2001 and 2006, as a percentage of 2001. The future change rates are assum ptions that can be altered. The default assum ption is that each locality w illchange at the average rate of the locality, LG A , region and city/state over 2001-2006, expressed in extra/few er residents per year. In the spread sheet: Y ou can enter num bers into the yellow cells under ‘future instit’lchange, residents’ in Table 9. C om m unity P rojector 2010 U ser M anual page 7 of 8 The num ber of residents in institutions w illchange by that num ber each year. If the change is negative, the num ber w illdecline, eventually to zero. D o not enter the total; the P rojector can add. I n the C o ntro l P anel: C lick S how to see the institutionalchange settings. C lick R eset to set the grow th rate to the default form ula, C lick A lter to change the current settings proportionally. This w ill open the query box show n right. Enter the percentage factor by w hich the current num bers are to be scaled, e.g. 50 w illhalve, 200 w illdouble. C lick [O K ]to apply the factor. Vehicles O ne page of the P rojector calculates the num ber of vehicles likely to be garaged in the localities in any future year, by projecting from the 2006 C ensus count at a linear change rate, in vehicles per dw elling per year. The data and assum ptions are in Table 10. The default change rate is the sm oother locality rate over 2001 to 2006, Y ou can enter alternative change rates for vehicles per dw elling p.a. in the yellow cells in Table 10. In the C ontrolP anel, you can S how or R eset the dw elling change rate, but you can only enter data by closing the C ontrolP anel. M o re h elp? p? C allThe P ublic P ractice on 02 9716 8530 or em ailcolin@ publicpractice.com .au E dition printed: 21 O ctober 2010 C om m unity P rojector 2010 U ser M anual page 8 of 8