1
Example Transforms
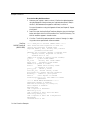
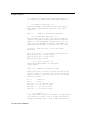
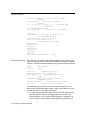
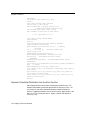
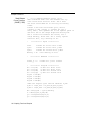
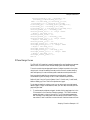
h*cell(n5,i2)
‘yt
cell(n5,i2) = cell(n5,i2) +
cell(n4,i2)
‘dym = dym + dyt
end for
for i3 = 1 to neqn do
cell(n4,i3) = fp(xk+h,cell(n2,1),cell(n2,2),
cell(n2,3),cell(n2,4),i3)
‘dyt
cell(i3+1,k+1) = cell(i3+1,k) + h6*(cell(n3,i3)
+ cell(n4,i3) + 2*cell(n5,i3))
end for
cell(1,k+1) = cell(1,k) + h
end for
F-test to Determine Statistical Improvement in Regressions
0
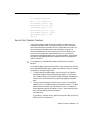
This transform compares two equations from the same family to determine if the
higher order provides a statistical improvement in fit.
Often it is unclear whether a higher order model fits the data better than a lower
order. Equations where higher orders may produce better fits include: simple
polynomials of different order, the sums of exponentials for transient response data,
and the sums of hyperbolic functions for saturation ligand binding data.
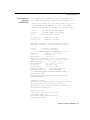
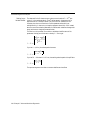
F-TEST.XFM uses the residuals from two regressions to compute the sums of squares
of the residuals, then creates the F statistic and computes an approximate P value for
the significance level.
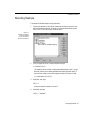
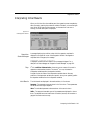
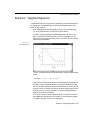
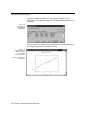
You can try this transform out on the provided sample graph, or run it on the
residuals produced by your own regression sessions. Residuals are saved to the
worksheet by the Regression Wizard.
1.
80 Data Transform Examples
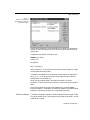
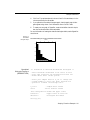
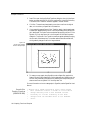
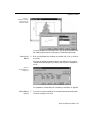
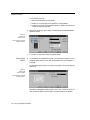
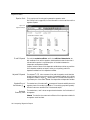
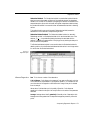
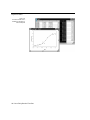
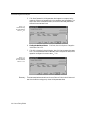
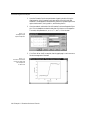
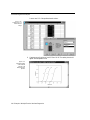
To use the provided sample data and graph, open the F-test worksheet and
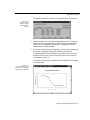
graph in the XFMS.JNB notebook. The worksheet contains raw data in columns 1 and 2, and curve fit results for the two competitive binding models in
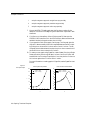
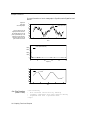
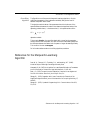
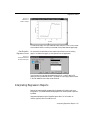
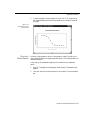
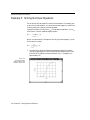
columns 3-5 and 6-8. The graph plots the raw data and the two curve fits.