1
56
CHAPTER 5. IMPLEMENTATION AND INTERPRETATION OF RESULTS
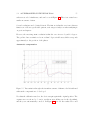
after compensation.
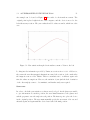
Studying the results is is easy to see that there is a point, in -75cm, where the error
has not been properly compensated. This is because the variation between -70 and -80
is so abrupt that the resolution taken (10cm) is not enough to guarantee a complete
elimination of the error. Anyway, taking into account that the normal variance of the
three parameters is around 5 degrees, the average error is not only acceptable, but
enough to work with the glasses with confidence.
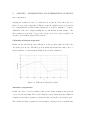
Calibration with 20cm separation
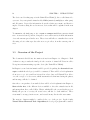
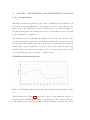
In this case the user has an easier calibration, as the necessary values are half of the
ones in the previous case. The likely problem is that the intermediate values, due to a
sudden variation, doesn’t match the numbers stored in the calibration.
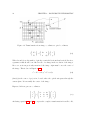
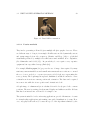
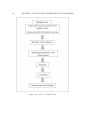
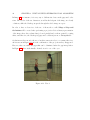
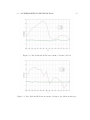
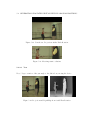
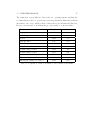
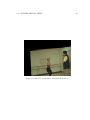
Figure 5.6: Calibration Values Every 20cm
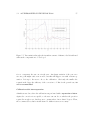
Automatic compensation
In this case, there weren’t troubling points, as the abrupt transition was perfectly
corrected by the algorithm. The reason is that the nearest values may vary within few
centimeters, but with a separation of 20cm, the value used is the better in the region.
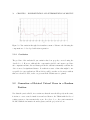
The conclusion is that a separation between samples of 20cm provides enough informa-