1
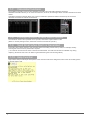
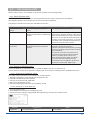
GL100-APS USER’ S MANUAL MANUAL NO. APS(GL100)-UM-151 Contents 1. Main Features........................................................................................................................................................4 1-1.A Variety of Display Formats............................................................................................................................4 1-2.Simple and Easy to Use...................................................................................................................................5 1-3.Multichannel Measurement..............................................................................................................................5 1-4.Export to Direct Excel File Function.................................................................................................................6 1-5.Thumbnail Waveform Display..........................................................................................................................6 1-6.CSV File Batch Conversion..............................................................................................................................6 1-7.Calculation functions........................................................................................................................................7 1-8.Printing Function, Screen Save Function.........................................................................................................7 1-9.Send Email when Alarm is Generated.............................................................................................................7 1-10.Help Function.................................................................................................................................................7 2. System Requirements............................................................................................................................................8 3. Connecting to a PC (Personal Computer)..............................................................................................................9 3-1.Connecting via USB.........................................................................................................................................9 3-2.Set wireless LAN............................................................................................................................................10 3-2-1. About Wireless LAN........................................................................................................................10 3-2-2. Setting up Wireless LAN.................................................................................................................10 4. Installing the USB Driver......................................................................................................................................13 5. Installing the Application Software.......................................................................................................................14 6. Basic Operating Procedure..................................................................................................................................15 6-1.Controlling Device..........................................................................................................................................15 7. Launching and Exiting the Software.....................................................................................................................16 7-1.Launching the Software.................................................................................................................................16 7-2.Exiting the Software.......................................................................................................................................16 8. PC Connection Settings.......................................................................................................................................17 9. Display Screens...................................................................................................................................................20 9-1.Y-T (Main Screen)..........................................................................................................................................21 9-2.Digital.............................................................................................................................................................23 9-3.Statistics and History......................................................................................................................................24 10.Settings Screens..................................................................................................................................................25 10-1.AMP Settings...............................................................................................................................................25 10-1-1. Span Settings...............................................................................................................................26 10-1-2. Settings for the Sensors...............................................................................................................27 10-2.Data Capture Settings..................................................................................................................................29 10-3.Trigger/Alarm Settings.................................................................................................................................31 10-3-1. Trigger Level Condition.................................................................................................................32 10-3-2. Alarm Condition............................................................................................................................34 10-4.Report Settings............................................................................................................................................35 10-5.Email Settings .............................................................................................................................................37 10-6.Other Settings..............................................................................................................................................38 11.FILE menu............................................................................................................................................................39 11-1.Open Data....................................................................................................................................................39 2 11-2.CSV File Batch Conversion..........................................................................................................................40 11-3.Print Screen.................................................................................................................................................41 11-4.Save Screen.................................................................................................................................................42 11-5.CSV Config..................................................................................................................................................42 12.Replay Data..........................................................................................................................................................43 12-1.Y-T...............................................................................................................................................................43 12-2.Digital...........................................................................................................................................................45 12-3.XY................................................................................................................................................................46 12-4.Superimpose/Link........................................................................................................................................47 12-5.Convert then Save.......................................................................................................................................48 12-6.Scale Operations..........................................................................................................................................48 12-7.Scroll bar......................................................................................................................................................48 13.Other Functions....................................................................................................................................................49 13-1.Alarm............................................................................................................................................................49 13-2.About Icons..................................................................................................................................................50 13-2-1. Waveform Operation.....................................................................................................................50 13-2-2. Input Comments...........................................................................................................................51 13-2-3. Move/Search.................................................................................................................................52 3 1.Main Features This software can control and operate settings, recording data playing etc. when GL100 is connected to a USB or LAN. 1-1. A Variety of Display Formats Special features include Y-T display, digital display, statistic and history display on a large easy to read screen. Y-T View This graph shows data with the input signal levels on the Y-axis and the time on the X-axis. It can display a waveform and digital values of each channel at the same time. The control icons in the lower part of the screen allow you to scale up and down the time axis, X-axis, etc. This graph can be displayed in two or five split screens, each showing different signals. Digital View Displays digital values of each channel in a large, easy-to-read numbers. Statistics and History Display Maximum, minimum and average values can be confirmed during recording. Alarm operation can be displayed as a list in time sequence for your confirmation. 4 1-2. Simple and Easy to Use Large icons make it simple and easy to control the waveforms. Time axes, spans, waveform positions can be changed easily. Also, you can maximize a window to fit the screen. 1-3. Multichannel Measurement Can measure a maximum of 10 units. Since a maximum of 4 can be recorded as a group in each device, the recording start-up and stopping of each group can be synchronized. Group 1 Group 2 Group 3 5 1-4. Export to Direct Excel File Function Captured data can be exported directly to an Excel file and displayed as graphs. Ready-to-use template files are provided as standard for your convenience. (Note: The Microsoft Excel program must be installed.) 1-5. Thumbnail Waveform Display Before replaying captured data, the waveforms can be checked by referring to the small images (thumbnails) provided next to each file name. These thumbnails provide easy confirmation of the data before opening the file. 1-6. CSV File Batch Conversion Data captured in binary files is converted in a batch to CSV files. 6 1-7. Calculation functions The available calculation functions are Statistical Calculation and Calculation between Channels. Statistical Calculation allows you to check the maximum, minimum, and average values of all the channels as numeric values. Calculation between Channels allows you to set four arithmetic operations between channels up to four at the maximum and check the results as waveforms. 1-8. Printing Function, Screen Save Function The waveform screen can be printed out on a printer, and screen copies saved to a file. (Note: To use the printing function, the device must be connected to a printer.) 1-9. Send Email when Alarm is Generated Information about alarm operation and periodical state of recording can be sent by email, for example, thereby ensuring that a check can be performed if required. (* You need an environment in which e-mail can be transmitted. The mail send function is available only during capturing. No mail is sent even if an alarm is generated during the Free Running status.) 1-10. Help Function Help buttons that provide simple descriptions of the various functions are assigned to each of the menu setting items to provide ease of use. 7 2.System Requirements Make sure that the computer on which you plan to install the software meets the following requirements. Item System requirements OS Windows Vista 32Bit/64Bit Windows 7 32Bit/64Bit Note: Supported edition (Ultimate Enterprise Professional HomePremium) Windows 8/8.1 32Bit/64Bit CPU Memory HDD Display Other Pentium 4 : 1.7GHz or higher 256MB or more (512 MB or more is recommended.) 200 MB additional space is required for installing software. (1GB or more free space is recommended.) 1024 x 768 resolution or higher, 65535 colors or more (16-bit or more) USB port, TCP-IP port, CD-ROM drive (for installing from CD) Microsoft Excel software (for the Export to Direct Excel File and Display in Excel functions) ەەCHECKPOINT • Even when using a PC that meets the system requirements, measurement data may not be captured correctly depending on the PC status (e.g. running other applications or insufficient memory capacity in the storage media used). Exit all other applications before capturing data to the internal hard disk. • While you are using this software, do not activate any other software. Whenever possible, avoid manipulations or processing of other software than this one (e.g., screen saver, virus check, file copy and transfer, and file search processing, etc.). 8 3.Connecting to a PC (Personal Computer) 3-1. Connecting via USB The GL is connected to a PC via a USB cable. ەەCHECKPOINT • When connected by a USB cable, a USB driver must be installed on the PC. Installation is performed from the GL100-Network_Config by use of the enclosed CD-ROM. • Main power supply is available by connecting USB cable to PC. Use an A-B type USB cable to connect the GL to a PC. 9 A connector Micro B connector 3-2. Set wireless LAN Wireless LAN function is only available on GL100-WL (wireless LAN mounting) models. 3-2-1. About Wireless LAN The GL100-WL wireless LAN connection is broadly divided into two modes: "Access point" and "Station". The respective features and necessary devices and environment are different. Comparison of Access Point Connection and Station Connection Contents GL100 Wireless LAN Settings Access Point Access Point (operation as parent device) Station Station (operation as child device) Features One to One Wireless LAN connection Can use when connecting for example to a between GL100 and PC or Smartphone commercially available wireless LAN parent or tablet. device and controlling more than one GL100 with a PC, or with GL100 email send/receive functions, an Internet connection, or the like (*necessary when sending/receiving email or in an Internet connection environment). Necessary Devices or Environment • PC capable of wireless LAN connection (required to operate the software) • PC capable of wireless LAN connection (required to operate the software) • Wireless LAN parent device (device mounting a wireless LAN parent device function receiving Wi-Fi verification) • An Internet connection environment when connecting to the Internet (Internet provider contract, or mobile carrier contract, etc.) When sending/receiving email, an Internet connection and email sending/receiving environment (use of an SMTP or POP3 such as Internet provider email, WEB email) 3-2-2. Setting up Wireless LAN Use GL100-Network_Config software in the provided CD-ROM or set up in GL100 main unit. The GL-Network_Config is a PC application software, and can be used by installing from the CD-ROM onto the PC. 3-2-2-1. Setting up GL100 Network_Config (For details, follow instructions for GL100-Network_Config software) 1. Install GL100-Network_Config from GL100 CD-ROM onto PC. 2. Install GL100 USB driver from CD-ROM. 3. Connect GL100 and PC with USB cable. 4. Start-up GL100-Network_Config. 5. Set up by following instructions for GL100-Network_Config. 3-2-2-2. Setting up on GL100 Main Unit 1. Turn GL 100 power ON 2. Press MENU key several times to display [I/F] menu. 3. Perform [I/F] menu settings. Setting details differ depending on access point or station mode. Contents WLAN Mode Access Point Set to Access Point Station Set to Station 10 Contents DHCP Access Point Switch ON when using an automatic sorting function for information such as IP addresses for the wireless LAN child device connected to GL100 (the PC, Smartphone or tablet). Switch OFF when automatic sorting not used, and when the child device sets the respective IP addresses. Station When the connected wireless LAN parent device includes a DHCP function, switching to ON will automatically acquire and set the IP addresses. When set to OFF, the IP addresses or the like are manually set on the TCP/IP page. TCP/IP Setting Your IP Address, Subnet Mask and Gateway. Settings are performed with DHCP switched OFF. The segment of the wireless LAN parent device to be connected must match. EX.) When the wireless LAN parent device IP address is “192.168.1.1” and the subnet mask is “255.255.255.0”, the IP address that is set on the main unit is “192.168.1.***” and the subnet mask is “255.255.255.0”. ***" is a number from 2 to 254, and a number that a same address does not exist on the wireless LAN parent device network needs to be allocated. SSID This is the wireless identification ID. For an Input SSID of wireless LAN parent device to be access point, set your own SSID. The wireless connected. LAN child device connected to the device is connected by setting this SSID. When using access point mode, you can use without change. Security Key Security can be enhanced by encrypting the wireless LAN connection. A third party who does not know the key can be prevented from connecting wirelessly to the device by a setting other than OFF. Normally, a setting of WPA or WPA2 is suitable. Off Encryption will not be performed Auto WPA/WPA2 will automatically be identified. Access point mode cannot be used. WEP Simple encryption method. Just set a 13 character key. WPA Stronger encryption format than WEP. WPA2 Set a key having from 8 characters to 63 characters. 11 Input encryption key and security format for wireless LAN parent device. Refer to left side for security format. 3-2-2-3. Connect PC to Wireless LAN Device Connect PC mounting wireless LAN to GL100 (when using access point settings) or wireless LAN parent device (when using GL100 station settings). 1. Click wireless LAN icon from PC taskbar. 2. Select GL100 or wireless LAN parent device to be connected from wireless network connection column. Not connected Connections are available Wireless Network Connection Open Network and Sharing Center 3. When performing a security setting for GL100 or wireless LAN parent device to be connected, input security key, and press OK. When security is OFF, this item does not appear. Connect to a Network Type the network security key Security key: Hide characters Cancel 4. Wireless LAN is connected 12 4.Installing the USB Driver Install USB driver from GL100-Network_Config in the enclosed CD-ROM. 13 5.Installing the Application Software This chapter describes how to install the application software. 1. Insert the User's Guide CD-ROM provided into the PC's CD-ROM drive. 2. Click the Taskbar's Start button, and then click the Run... icon to open the "Run" window. 3. Enter the CD-ROM drive name and \English\GL100-APS\Setup.exe as the name of the file you wish to open. If the disk is in drive D, for example, enter "D\English\GL100-APS\Setup.exe" in the box and then click "OK" to launch the installer. 4. Follow the instructions on the screen to continue with the installation. 5. When a message to restart your PC appears after the installation, be sure to restart it and then start this software. ەەCHECKPOINT Be sure to observe the following points when connecting the GL to a PC. • Do not connect any devices apart from a mouse or a keyboard to any of the other USB terminals on your PC. • Set the PC's power-saving functions to Off. • Set the Screen Saver to Off. • Set the anti-virus software auto update and scan scheduler functions to Off. Also, set the Windows auto update and scheduler functions to Off. • When using the note PC, if you close the display, the PC may be in stand-by mode. Please do not close the display during using the software. Trademarkes • Windows, Windows Vista and Windows 7 are registered trademarks of Microsoft Corporation in the US and other countries. • The company names, logos and product names mentioned herein are the trademarks or registered trademarks of their respective companies. 14 6.Basic Operating Procedure The basic operating procedure of this software consists of the following four operations: Operation Description Controlling the GL100 Device With the GL100 connected to a PC, you can load the setting information of this unit to this software and make settings and control operations of this unit. The setting conditions can be saved as a configuration file in a PC. This file can be read to reflect the setting conditions. Checking Input Data With the GL100 connected to a PC, you can display signals entered to this unit in a graph on this software and check them in real time. Data Capture When the GL100 is connected to a PC, data can be exported to a PC and saved. Data can be also saved in the GL. Either of the saved data can be used as a backup. *There is a case where data that has been recorded in GL100 body and real-time recording of this software is different. (Data of the first point start time, trigger time, stop time, recorded the number, the beginning) Replaying Captured Data Data files captured and saved in a PC can be replayed. When the GL100 is connected to a PC, data saved in the GL can be also replayed. You can clip the desired parts from the replayed data or convert it to a different file format and save it. 6-1. Controlling Device This software can perform the following operations: • Start/Stop Data Capture • AMP Settings (Input, Range, etc.) • Data Capture Settings (Sampling Interval, etc.) • Trigger, Alarm Settings (Trigger Settings, Alarm Settings, etc.) • Other Settings (Temperature Unit, Factory Default Settings, etc.) 15 7.Launching and Exiting the Software 7-1. Launching the Software Click the Taskbar's "Start" button → "Programs" → "Graphtec"→"GL100-APS" → "GL100-APS" to launch the application software. Once the program has started up, the following screen is displayed. 7-2. Exiting the Software To exit the software, click the "End" button in the upper right corner of the main screen. Exit When you try to exit the software in the connected status, a message appears to confirm if the setting conditions are saved to the device. Operation Yes Description Click this button to save the setting conditions on this software in the GL device and exit. Next time connecting to the device, the last setting conditions are reflected. No Click this button to exit without saving the setting conditions on this software in the GL device. After the power is turned on, the setting conditions on GL device returns to the state before connecting to the software. Cancel This software is not disconnected and it remains active. ەەCHECKPOINT The following settings are not saved to this unit. • Setting items not available on the GL unit • Line color settings 16 8.PC Connection Settings Configure the communication settings between GL and a PC. 1 1. Click the "Connect" in the Main screen, and the Connection screen will be displayed. 2 3 4 2. Select device model to be connected from "unregistered" device registration. 3. Select interface to be connected (USB connection/LAN connection/demo connection) 4. At "Device Name" enter a desired name. (\ / : * ? " < > | characters can not use the name of the device.) 5. At "3. Connecting to a PC" enter the settings that have been made on this unit. - For TCP/IP connection: Enter an "IP address" and a "Port No.". - To use Retrieve by Name on TCP/IP Click the Retrieve by Name button to display a list of devices. When the LAN-connected GL100 is automatically detected, select a model to be connected and click the "Select" button. - When using USB: select "COM port number". Port number sets the USB Serial Port (COM number) of the port for the device manager of the PC (COM and LPT). The device manager can be confirmed by control panel → device manager. When a USB Serial Port is not displayed, install USB driver and confirm connection between GL100 and PC. 6. Click the "Connect" button to perform the connection to enable communication between the devices. 7. Click the "Close" button to close the Connect screen. * Demo Connection Demo Connection does not actually connect to the GL unit but makes a pseudo-connection. A supplied demo waveform will be displayed. ەەCHECKPOINT • Before making a connection, check that this unit is either in a "STOP" or "REC" status. • When they are connected, the software works with the setting conditions read from the GL unit.When you want to use the PC's settings, press the "Read Setting Conditions" button to read the saved configuration file. To do this, you should save the setting conditions. The following settings are not saved to this unit. • Setting items not available on the GL unit 17 • Line color settings • Annotation Settings • Trigger time, duration, and repeated capture settings • After a connection is established, the time on the PC is transferred to this unit. Note that the time of this unit will be changed. 18 Connecting multiple devices GL100-APS can connect up to 10 GL devices. Make settings for each of the devices to be connected. * Refer to the previous page for details on the settings. The connected tabs are displayed. Select each device to make desired settings. 19 9.Display Screens This section explains the display screens in Free Running or Capturing status in this software. • Y-T • Digital • Statistics and History Display 20 9-1. Y-T (Main Screen) 1 7 2 3 11 4 5 12 6 8 9 13 10 14 16 15 18 19 17 20 22 No. 1 2 3 4 21 Name Connect Description Opens a screen for connecting to this unit. File Conducts file-related operations. Open Data Displays the data in files stored on the PC or files stored on this unit as waveforms. CSV file batch conversion Click this button to convert multiple GBD (binary data) files captured to the PC to CSV files. Print Screen Click this button to print out a copy of the screen. Printing is performed at the printer that has been selected as the default printer. If you change the printer, relaunch the software. Save Screen Click this button to save the displayed screen as a BMP file. CSV Config Set decimal point and delimiter according to the OS using. Simplified message The operating status is displayed here. area Free Running Stopped status (not capturing data) Capture Settings Armed Awaiting trigger activation; data has not been captured. Recording Data capture status Click this button to open the data capture settings screen. Refer to "10. Setting Screen" for details. 5 Start Click this button to start data capture. 6 Stop Click this button to stop data capture. 7 Protect Click this button to set the password to protect the software. * Protection operations occur only in this software. Be careful that this software can be exited via Windows operations. 21 8 End Click this button to exit the application. 9 Alarm Alarm output port state will be displayed. 10 AC/Battery Power source state will be displayed. Battery residual charge during battery operation can be confirmed. 11 Start Time Data capture start time. 12 Capture Time The amount of time that has elapsed since the start of data capture. 13 Allowable Time The amount of time available for data capture. When the remaining time is up, data capture stops at both the device and the PC. 14 Sampling Interval The sampling interval. * EXT is displayed during external sampling. 15 PC Capture Destination The data capture destination at the PC. 16 Screen switching Switches between screens (Y-T/Digital/Statistics and History Views). 17 Waveform Graph The waveforms are displayed here. 18 Cursors Selects which of the cursor values should be displayed in the digital display area when scroll is stopped during capture. Up to three values (Cursor A, Cursor B, Cursor A-B) can be displayed at the same time. 19 Switch displayed groups Click one of these buttons to select a group whose waveform and digital values are displayed. 20 Digital The digital values are displayed in this area. Clicking on any of the CH numbers enables the waveform for that channel to be hidden/displayed. The channels for which an alarm has been generated are shown in red. This function is available when the scroll is Off during capture, or during replay. The waveform display On/Off setting is cleared when the capture settings are changed and is reset to On. 21 Cursor Time The cursor times are displayed during data capture when Scroll Off has been selected. 22 Waveform Op. Click this button to perform various settings for the waveform display. Refer to section 13-2 for details. 22 9-2. Digital The captured data is displayed as digital values. Instantaneous values are displayed in large characters to enable easy confirmation. 1 2 4 3 No. 1 23 Name Analog Description Digital values are displayed here. 2 Set displayed CH Click one of these buttons to select 20 analog channels to display the digital values. 3 Pulse Pulse signals' digital values are displayed here. (when the Logic/Pulse setting is "Pulse") 4 Logic Logic signals' digital values are displayed here. (when the Logic/Pulse setting is "Logic") 9-3. Statistics and History During recording, statistics such as maximum, minimum and average value of each CH is displayed. Alarm operation history is displayed in list format. 1 2 No. 1 3 Name Saving results to a file Description The details displayed in the list are saved in CSV file format. 2 Statistical List Display Displays statistical value of each CH. 3 Alarm History Displays history of alarm operation. Maximum of 100 alarms are displayed. 24 10. Settings Screens This chapter describes the screens used to perform settings related to data capture. 10-1. AMP Settings This screen is used to make the analog input, logic input, and pulse input settings. 1 2 4 3 5 6 7 8 9 10 11 12 13 14 15 16 17 18 19 20 21 22 23 24 25 26 No. 1 Name Settings tabs 27 28 Description These tabs are used to change the settings screen. AMP Settings This tab is used to make input-related settings. Data Capture Settings This tab used to make settings related to data capture. Trigger/Alarm Settings This tab is used to make settings related to the trigger and alarm functions. 2 CH 3 Color Report Settings This tab is used to make settings related to the daily report, monthly report, and Export to Direct Excel File functions Email Settings Settings for sending emails. Other Settings This tab is used to make various other settings, to display information, and so forth. These are the channel numbers for analog input. The color used for the waveform for each channel can be specified here. * Color settings are the setting values for the software and a different color may be shown during recording and playing. 4 Annotation Each channel can be freely annotated (input the signal name, etc.). The maximum number of characters is 31 (in single-byte). *Annotation settings cannot be stored in recorded data. Since such settings are a setting value on the software, they may differ during recording and playing operations. 25 5 Input It is different depending on the sensor. 6 Range It is different depending on the sensor. No. 7 Name Description Filter Cannot use. 8 Unit The selected unit is displayed here. 9 Adjust Setting items are required when a sensor has an adjust function. 10 Span Use these buttons to set the upper limit and lower limit values for the waveforms displayed in the waveform graph. Refer to section 10-1-1 for details 11 Scaling Cannot use. 12 CH Group Use these buttons to set the display group for each channel. Only the groups set here can be viewed in Y-T display screen. 13 Graph Display The waveforms for which settings have been made can be checked here. Click 14 Logic/Pulse switching Use this button to switch the digital input. Logic, Pulse, or OFF can be set here. (Off/Pulse/Logic) 15 Logic CH number The channel numbers for logic input. the "Apply" button to apply the settings that have been made. 16 Logic Line Color Make the logic waveform color setting here. 17 Logic Filter Cannot use. 18 Pulse CH number The channel numbers for pulse input. 19 Pulse Line Color Make the pulse line color setting here. 20 Pulse Input Use the Input button to select the pulse input type. Counts A cumulative count is made of the number of pulses generated in one sample. Inst. The number of pulses generated in one sample is counted. 21 Pulse Range Cannot use. 22 Pulse Filter Cannot use. 23 Pulse Slope Cannot use. 24 Pulse Span Use this button to set the upper limit and lower limit values for the waveforms displayed in the waveform graph. 25 Pulse Scaling Cannot use. 26 OK Click this button to register your settings and close the screen. 27 Cancel Click this button to close the screen without registering your settings. 28 Apply Click this button to apply the settings mode. 10-1-1. Span Settings Span settings are made at this screen. To make the settings, input numerical values directly or use a cursor to adjust values. Upper Value Input Settings CH Level Cursor Waveform Lower Value Input 26 10-1-2. Settings for the Sensors Amp setting screen of the sensors 1 Temperature / Humidity (GS-TH) 2 4ch Voltage / Temperature (GS-4VT) 3 4ch Thermistor (GS-4TSR) No. 1 2 3 4 27 4 Adapter for AC Current (GS-DPA-AC) 5 3-axis Acceleration / Temperature (GS-3AT) 6 CO2 (GS-CO2) 7 Illumination / Ultraviolet (GS-LXUV) Name Temperature / Humidity (GS-TH) Description Input TEMP HUM. DEWP Range None Filter None (No more filter settings for all sensors) Ref. Temp (Adjust button) Ref. Temp↑/Ref. Temp↓ Ref. Temp: -20 to 85 degC 4ch Voltage / Temperature (GS-4VT) Input Off/DCV/TEMP Off/Logic/Pulse (Count / Inst) Range DCV: 20/50/100/200/500(mV)/1/2/5/10/20/50/1-5(V) TEMP: TC-K/TC-T 4ch Thermistor (GS-4TSR) Input ON(A)/ON(J) Off/Logic/Pulse (Count / Inst) Range None Mode AC1φ2W/AC1φ3W/AC3φ3W Input Current Power Range 50/100/200(A) Volt (Adjust button) 90 to 264(V) P.F. (Adjust button) 0.30 to 1.00 Adapter for AC Current (GS-DPA-AC) No. 5 Name 3-axis Acceleration / Temperature (GS-3AT) Description Input Acceleration (XYZ-3ch) TEMP Range XYZ common 2/5/10(G) 20/50/100(m/s2) (However acceleration due to gravity 1G = approx. 9.807m/ s2) OFFSET ADJUST (Adjust button) Adjust current static acceleration value to zero *memory mode of measurement mode is not supported. It is changed to direct mode forced. 6 7 CO2 (GS-CO2) Illumination / Ultraviolet (GS-LXUV) Input CO2 Range None Calibration CO2 Calibration On/Off Input Illumination Ultraviolet Range Illumination: 2000/20000/200000lx Ultraviolet: 30mW/cm2 28 10-2. Data Capture Settings Settings such as the Sampling Interval, Device Capture Settings and PC Capture Settings are made at this screen. 1 2 4 5 6 3 7 8 No. 1 Name Sampling Interval Description Specifies the sampling interval for data capture. The sampling interval that can be specified depends on the number of measured channels. 500(ms)/1/2/5/10/20/30(s)/1/2/5/10/20/30/60(min) 2 Subsampling Calculated at internal sampling 5ms during acceleration sensor Peak hold/average value/effective value output 3 Device Capture Settings Main memory/SD card (when SD card inserted) 4 PC Capture Destination Settings button Use this button to select the format of the data saved to the PC (personal computer). 5 29 PC Capture Settings Name Type Binary format (GBD) The data is saved as binary data. When compared with a CSV file, the file size is somewhat small. Text format (CSV) The data is saved as text data in a format that can be displayed in Excel. Use this button to select the method for appending the file name. Auto A folder with the date as the file name is created within the specified folder, and then a file with the date and time as the file name is created within the newly-created folder. (Example: Device1_2010-04-01_12-34-56.GBD) User The file name can be freely specified by the user. 6 PC Capture Settings Save Path 7 PC Capture To enable this function, click the checkbox to display the check mark. The backup Settings file is created at the same location as that specified in Item 14 "Save Path" above. Create Backup File The "_bk" file extension is appended to the file name. The save destination at the PC (personal computer) for the captured data is selected here. No. 8 Name PC Capture Settings Backup Interval Description Use this button to select the backup interval. During data capture, a backup data file is created at the specified intervals. If all the backup files are linked, the data will be same as that of the original data. (1/2/6/12/24(h)) * A fluctuation of about 10 seconds will be generated in the backup interval. Therefore, the data size of a backup file fluctuates to some degree. Since there is no loss of data, however, you can concatenate backup files to obtain data equivalent to that of one backup file that you would obtain from continuous capture. 30 10-3. Trigger/Alarm Settings Settings such as the trigger start condition, stop condition, alarm settings, and those for sending email are made at this screen. 1 2 3 4 6 No. 1 2 Name Trigger Selection Trigger Start/Stop Condition Description Use this button to select the trigger start(stop) condition. Off There is no data capture start condition. (There is no stop condition.) Start Set the trigger start condition. Stop Set the trigger stop condition. Set the trigger condition. Off There is no data capture start condition. (There is no stop condition.) Level Data capture starts(stops) when the desired channel reaches the specified level value. Alarm Data capture starts(stops) when the specified alarm occurs. Date Data capture starts(stops) at the specified date and time. *There is a possibility that the deviation of the sampling time of one minute maximum occurs in real-time recorded data. 3 Level Condition If "Level" has been selected for the Trigger setting 4 Date Settings Sets the Date for starting (stopping) the capture when the trigger start (stop) condition is "Date". ەەCHECKPOINT When the sampling is set to the External, the start trigger and the stop trigger cannot be set to the external at the same time. Also when the start trigger or the stop trigger is set to the External, if the sampling is set to the External, the start trigger or the stop trigger is force set to Off. 31 10-3-1. Trigger Level Condition If "Level" has been selected for the Trigger setting, the "Trigger Start/Stop Condition" settings must be made. 1 2 3 4 5 7 8 12 13 9 10 11 6 14 15 No. 1 2 3 CH Name Description The channel numbers are displayed here. Function Use this button to select the trigger level detection mode. Upper/Lower Off Disabled Hi A trigger is generated if the input signal is above the specified level. Lo A trigger is generated if the input signal is below the specified level. The level settings are displayed here. 4 Unit The unit is displayed here. 5 Setting Click this button to make the level settings. 6 Switch CH Cannot use. 7 Pulse CH Cannot use. 8 Pulse Function Cannot use. 9 Pulse Upper/Lower Cannot use. 10 Pulse Unit Cannot use. 11 Pulse Settings Cannot use. 12 Logic CH Cannot use. 13 Logic Function Cannot use. 14 Combination Use this button to set the combination of configured triggers. 15 OR Data capture starts (stops) when one of the configured trigger conditions is true. AND Data capture starts (stops) when all of the configured trigger conditions are true. Detection methods Edge operation will be fixed. Refer to section 10-3-1-2 for details. 32 10-3-1-1. Trigger Level Settings Screen This screen is used to make the level settings to detect a trigger. To make the settings, you input numerical values directly or use a cursor. Upper Value Input Settings CH Level Cursor Waveform Lower Value Input 10-3-1-2. Edge Detection In the edge detection, a trigger is detected when an input signal is above/below the specified level. Even if an input signal reached the detection level before, a trigger is not detected unless it reaches the level again after it is outside. Edge: Hi Edge: Low Trigger Level 33 10-3-2. Alarm Condition The alarm level settings for each input are made at this screen. 1 2 3 4 5 6 8 9 14 15 10 11 12 13 7 No. 1 2 Name 16 CH Description The channel numbers are displayed. Function Select the alarm level detection mode. 17 Off Disabled. Hi An alarm is generated if the input signal is above the specified level. Lo An alarm is generated if the input signal is below the specified level. 3 Upper/Lower The level settings are displayed here. 4 Unit The unit is displayed here. 5 Setting Click this button to make the level settings. 6 Output Output CH is fixed to 1 ch. 7 Switch CH Cannot use. 8 Pulse CH Cannot use. 9 Pulse Function Cannot use. 10 Pulse Upper/Lower Cannot use. 11 Pulse Unit Cannot use. 12 Pulse Settings Cannot use. 13 Pulse Output Cannot use. 14 Logic CH Cannot use. 15 Logic Function Cannot use. 16 Logic Output Cannot use. 17 Detection methods Level operation will be fixed. 34 10-4. Report Settings The daily report and monthly report settings, as well as the Direct to Excel settings, are made at this screen. The daily report and monthly report are created as separate CSV files at capture intervals that are separate from those of the captured data. The Export to Direct Excel File function transfers data in real time to an Excel file as it is being captured. If a template is used for the Excel file, waveforms can also be drawn in Excel in real time. 3 4 1 2 8 9 5 6 7 10 11 12 13 No. 1 Name Daily report Description Click this checkbox to enter a check and enable the Daily report function. 2 Monthly report Click this checkbox to enter a check and enable the Monthly report function. 3 Daily report Capture Interval Use this button to select the daily capture interval. 1/5/10/30/60min. Data is captured at the sampling interval when the settings are faster than the sampling interval. 4 Monthly report Capture Interval Use this button to select the monthly capture interval. Available settings are 1/2/6/12/24hours. Data is captured at the sampling interval when the settings are faster than the sampling interval. 5 Output Format Use this button to select the output format for the report(s). Save as CSV batch files The data is saved as CSV batch files. Export to direct The captured data is exported directly to Excel. If a template Excel file file that was created in Excel is used, an original report can be created in real time. The template files that were provided as standard accessories can also be used. * EXCEL must be installed to use this function. * Transfer of 32000 points or more is disabled if a graph is used in the template. 35 6 Configure CSV file: This parameter is used to specify the save destination for the Daily report. Daily report 7 Configure CSV file: This parameter is used to specify the save destination for the Monthly report. Monthly report No. 8 Name Periodic email Description Function to send a periodic email at the designated time. Email sent only during recording. 9 Date/Time Settings Set date and time for sending periodic email. 10 Template file The template file settings for the Export to Direct Excel File function are made here. Files with the "xlt" and "xls" extensions can be used. Template files are provided as standard in the "Temp" folder that is installed with this software. 11 Destination sheet This parameter is used to specify the name of the specified template sheet. 12 Start cell This parameter is used to specify the start position on the sheet from which to transfer data. 13 Switch sheet When the specified number of points is reached, data is transferred to a different sheet. * When data is transferred to a different sheet, the graph or other element may not work correctly. * EXCEL versions before 2007: Supports display up to Row 65536. * EXCEL 2007 and later versions: Supports display up to Row 1048576. * Transfer of 32000 points or more is disabled if a graph is used in the template. 36 10-5. Email Settings Can send an email during alarm operation, or send a periodic email. (Environment required for sending of emails) 1 4 3 2 5 8 6 9 10 7 11 No. 1 Name Description Send Email when To send an email when an alarm has been generated, click the checkbox to insert Alarm is Generated a check 2 On/Off 3 Address(s) Enter the email address. 4 Title Enter the Title. 5 Sender address Enter the sender email address. 6 SMTP Server Enter the SMTP server name or address. 7 SMTP Port Set SMTP server sending port. When not using SSL, 25, when using SSL, 587 or 465 8 User Input authorized user name for SMTP server 9 Password Input authorized user name for SMTP server 10 Use SSL Input authorized user name for SMTP server 11 Send Test Mail Send test mail to emil addres. EX) When sending to Gmail (as of June 2014) SMTP server smtp.gmail.com SMTP port 587 User Account Name at Gmail Password Password for Gmail account Use SSL On ەەCHECKPOINT The mail send function is available only during capture. No mail is sent even if an alarm is generated during the Free Running status. 37 10-6. Other Settings This screen is used to make various other settings and to display information. 1 2 3 4 5 6 7 8 No. 1 Name Room Temp. Compensation Description This parameter is used when thermocouples are used to perform temperature measurement. When using this device for room temperature compensation, select Internal.(Always select Internal for this setting.) 2 Burnout Set to On to regularly check a thermocouple sensor line break. If a thermocouple is connected parallel with other measurement devices, please set this to Off as it may affect the other devices. When a sensor line break is detected, "BURNOUT" message appears. 3 Temp. Unit The display unit can be switched between Celsius and Fahrenheit. 4 Acceleration unit Switch acceleration unit (G) with (m/s2). 5 Return to Factory Default Settings Click this button to return the settings to the default values. 6 Software Version The software version is displayed here. 7 Device Information Information relating to the connected device is displayed here. 8 Graphtec Web site Click this button to access the Graphtec web site. 38 11. FILE menu The FILE menu provides replay, CSV conversion, printing, and screen saving of captured data. 11-1. Open Data Replays data captured to the PC or GL device unit. Select "Open Data" to open the file selection screen (See figure below). Select a file to be replayed. *Please do not use alphanumeric characters other than the folder and file names. Can not read the file correctly. 1 3 2 4 5 6 8 7 9 10 11 No. 1 Name 12 Drive Description Use this button to select the appropriate PC drive. 2 File Path The file location is displayed here. 3 Select Folder Click this button to select the folder that has data files. 4 Create Folder Click this button to create a new folder. 5 Delete Click this button to delete the selected file. 6 Order Use this button to select the file arrangement order. 7 File Tree The hierarchies of the device are displayed in a tree format. The "Data" is the default location to save files in this application. This is the GL100-APS folder in the user document folder. 8 Frequently-used folder Use these buttons to select a frequently-used folder and move the file to that folder.Single click : SelectDouble click : Move. 9 File List Files/folders in the current hierarchy are displayed. 10 File Information When you select binary or text data in the current hierarchy, file information is displayed. 11 Register as frequently-used folder Click this button to register the currently displayed folder as one of the frequentlyused folders. After registering, it is added to Item 5 "Frequently-used folder". 12 Select File Click this button to select a file (display the file). 13 Cancel Click this button to cancel the selected file. Refer to "12. Replay Screen" for details on data replay. 39 13 11-2. CSV File Batch Conversion This function enables multiple GBD (binary data) files to be converted in a batch to CSV format files. 2 3 1 4 5 6 No. 1 7 Name List of converted files Description The batch-converted files are displayed in a list. 2 Add Click this button to add a file to the batch to be converted. 3 Delete Click this button to remove a file from the batch to be converted. With the SHIFT or CTRL key pressed, you can select more than one file. 4 Save destination folder Select the save destination for the batch-converted files here. 5 Save folder path Displays the path of the save folder. 6 Start batch conversion Click this button to start batch file conversion. 7 Cancel Click this button to cancel the batch conversion operation and close the screen. 40 11-3. Print Screen Prints the display screen on the printer. Printing is performed at the printer that has been selected as the default printer. If you change the printer, relaunch the software. 1 2 3 4 5 No. 1 2 6 Name Screen range Print range Description Select a screen range to be printed. Entire screen Prints all of the displayed screen. Waveform only Prints only the waveform graph. Selects a range to be printed. * Selection is available when the scroll is Off during capture, or during data replay. Current view area Prints the current view area. Between the cursor A and B Prints data between Cursors A and B in the time scale in which it is displayed. If the range is too large, data is printed on more than one sheet. 3 White background chart Prints the waveform graph against a white background. 4 Print information Prints the graph with information in it. The information to be printed is the span, Time/DIV, and sampling interval. Not all the channel information may be included depending on the number of channels to be displayed. 41 5 Print Starts printing. 6 Cancel Cancels printing. 11-4. Save Screen To save the displayed screen as a BMP file. 1 2 3 4 No. 1 Name Screen range 5 Description Selects a range of the screen to be saved in BMP. Entire screen Saves all the displayed screen in BMP. Waveform only Saves only the waveform graph in BMP. 2 White background chart Saves the waveform graph against a white background in BMP. 3 Print information Saves the graph with information displayed in it in BMP. The information to be displayed is the span, Time/DIV, and sampling interval. 4 Save Starts saving the screen in BMP. 5 Cancel Cancels saving the screen. * Not all the channel information may be included depending on the number of channels to be displayed. 11-5. CSV Config This setting is for the decimal point and the delimiter that are used in the CSV file for output. Please set according to the setting of OS that actually used. The CSV file which uses different decimal point and delimiter cannot be opened. ەەNOTE Please set to the delimiter other than the comma (,) if the comma (,) is set to the decimal point. Do not set comma (,) to both the decimal point and the delimiter at same time. 42 12. Replay Data This section explains how to replay data that has been captured. 12-1. Y-T 1 6 2 3 4 5 7 8 10 9 11 13 No. 1 43 Name File 14 12 Description Operations related to files are performed. Open Data Click this button to open the screen for opening files captured to a PC or to the device. Open in new window Opens a file in a new window. This function is useful when you compare captured waveforms. Superimpose/ Link For the reviewing data, you can overwrite the waveform of other captured data or link and display the waveform. Refer to section 12-4 for details. Convert then Save Click this button to convert data being replayed into GBD or CSV files and save them. Data cannot be saved during Free Running. Refer to section 12-5 for details. Print Screen Click this button to print out a copy of the displayed screen. Printing is performed at the printer that has been selected as the default printer. If you change the printer, set the printer and then restart the software. Refer to section 11-3 for details. Save Screen Click this button to save the displayed screen as a BMP file. 2 Capture File Name The name of the data capture file that is being replayed. 3 Start Time The time at which data capture was started. 4 Capture Time The data capture time 5 Sampling Interval The sampling interval * EXT is displayed during external sampling. 6 Close Click this button to close the replay screen. 7 Alarm Displays the status of the alarm port on Cursor A. Refer to section 13-1 for details. 8 Display switch Switches display modes. Refer to the page on each of the display modes for details. 9 Waveform Graph The waveforms are displayed here. 10 Cursors Selects which of the cursor values should be displayed in the digital display area. Up to three values (Cursor A, Cursor B, Cursor A-B) can be displayed at the same time. 11 Digital The digital values are displayed in this area. Clicking on any of the CH numbers enables the waveform for that channel to be hidden/displayed. The channels for which an alarm has been generated are shown in red. 12 Cursor Time The cursor times are displayed during data capture when Scroll Off has been selected. 13 Scale operations Click this button to perform various settings for the waveform display. Refer to section 12-6 for details. 14 Scroll bar Moves waveform. Can also move Cursors A and B. Refer to section 12-7 for details. ەەNOTE Regarding displaying waveform to the screen. This software is trimming the data for highspeed displaying when the waveform is displaying to the screen. Therefore the high response of waveform will not be displayed on the screen when the waveform is displaying by expanding or reduction. This depends on expanded or reduction ratio. Expand the waveform displaying until the high response of waveform is displayed on the screen when the high response of waveform is not displayed on the screen. 44 12-2. Digital You can select "Digital" tab to switch to the digital display. The Digital screen is used mainly to perform operations such as statistical calculation using the A and B cursors. 1 3 2 4 No. 1 Name Waveform Graph The waveforms are displayed here. Description 2 Digital display The cursor A and B levels, calculation results, and so forth are displayed here. 3 Execute Stat. Calc Click this button to perform statistical calculation of the data between Cursors A and B. 4 Cursor Time The cursor A and B times are displayed here. ەەNOTE Regarding displaying waveform to the screen. This software is trimming the data for highspeed displaying when the waveform is displaying to the screen. Therefore the high response of waveform will not be displayed on the screen when the waveform is displaying by expanding or reduction. This depends on expanded or reduction ratio. Expand the waveform displaying until the high response of waveform is displayed on the screen when the high response of waveform is not displayed on the screen. 45 12-3. XY This function is used to display the data between the A and B cursors in an XY format. (Max 10000 points) 1 2 3 4 5 6 7 No. 1 Name X-Y Waveform Graph Description The X-Y waveform graph is displayed here. 2 Waveform operation icons Use these buttons to expand, shrink, or move X and Y axes. 3 Range These buttons specify display of the scale values for the channels selected for the X and Y axes. 4 On/Off Click these buttons to specify the display as ON or OFF. 5 X Axis Use these buttons to select the channels for the X axes. 6 Y Axis Use these buttons to select the channels for the Y axes. 7 Cursor Information The cursor levels of the channels for which Range has been specified are shown here. 46 12-4. Superimpose/Link This function enables multiple files to be superimposed on the display, or to be linked. The data must be captured under the same conditions to be linked. 1 2 3 4 5 No. 1 2 Name Add Delete 6 7 Description Click this button to add a file to those selected for the superimposing or linking operation. Click this button to delete the added file from the list. With the SHIFT or CTRL key pressed, you can select more than one file. 3 File List The files added to those selected for superimposing or linking are listed here. 4 Superimpose Click this button to superimpose files. (* Overlapped data cannot be saved.) 5 Link method Select link method 6 Link Arranging to overlap at top of data Overlapping at top data position Arranging the trigger time and position to overlap Overlapping display of trigger time and position. Files with a large time difference cannot be superimposed. Click this button to link files. * Data with different capture conditions cannot be concatenated. When chain the files, the date and time for chained file is displayed based on the date and time of No. 1 file. Therefore the date and time which are for No. 2 and later files may not be same as actual measurement date and time. 7 47 Calcel Click this button to close the screen. 12-5. Convert then Save This function is used to convert replayed data to a different format (GBD, CSV), and to clip and save only the data between the cursors. 1 4 2 3 5 6 No. 1 Name Save format 7 Description Select a format to convert and save data. GBD binary data CSV text data. This is a file format that can be opened with Microsoft's * CSV data cannot be converted to binary data. EXCEL and other software. 2 Path Select a location to which you want to save data. 3 Open with EXCEL after the conversion * This setting cannot be selected if data is saved in binary format. 4 5 If this setting is selected, a file converted into CSV format is opened with EXCEL. * EXCEL must be installed to use this function. * This function is not available with EXCEL 2000 or any previous versions. Select data to be converted All Data All of the data being replayed is saved. Between Cursor Data between cursors A and B is saved. Spot Samples Spot samples are extracted when saving data. Ex) 1 → 1 :Spot samples are not extracted. Ex) 2 → 1 :One of two data points is extracted. 6 Save Executes conversion and saving. 7 Cancel Click to close the screen. 12-6. Scale Operations Use this area to perform scale operations, enlarge the selected area, etc. Expand x-axis range specification Drag in X-axis direction Ordinary Cursor Display all the data in one screen 12-7. Scroll bar Allows you to move waveforms and cursors. X-axis display area All Data Move waveform to left Cursor A Cursor B Move waveform to right 48 13. Other Functions 13-1. Alarm The alarm output port status is displayed in this screen, together with the Alarm Clear button. During replay, it shows the alarm output port status at the cursor point selected in the digital value display. Alarm detected 49 13-2. About Icons Y-T View (Y-T Zoom) provides control icons that allow you to perform intuitive operations. Each of the icons has the following functions: 1 2 3 4 5 6 7 8 9 10 No. 1 Name Expand/Shrink Time axis Expands/Shrinks the time axis. Description 2 Display Uses the display width of one screen to display time. 3 Expand/Shrink Y axis span Expands/Shrinks the Y axis of the selected channel. 4 Move Y axis position Click this icon to move up and move down the Y axis position for the selected channel. 5 Waveform Operation Click this icon to open the screen to edit graph waveforms. Refer to section 13-21 for details. 6 Displays Cursor Displays Cursor A/B in the waveform display. 7 Comment Allows you to enter a comment on a waveform of a desired channel during capture or replay. The entered comment will be redisplayed when the file is opened again. Refer to section 13-2-2 for details. 8 Cursor direction switching Switches the vertical and horizontal sides of a cursor. 9 Move/Search During replay, click this icon to open the screen to move to the desired time or points and to search at any level. Refer to section 13-2-3 for details. 10 Switch Scale Click this icon to switch between a relative time and an absolute time. Fixed to a point while external sampling setting is used. * Disables selection of absolute time in Free Running status. 13-2-1. Waveform Operation Various types of waveform operations can be performed. 1 2 3 7 4 8 9 5 6 10 No. Scale 1 2 Name Description Zone Divisions Divide the Y-T waveform graph into the upper side and the lower side. (No Divisions/2 Divisions/5 Divisions/10 Divisions) Y Axis When "Zone Divisions" is set to "No Divisions", up to four Y axis ranges can be displayed. 50 Display 3 Expands between A-B Expands data between Cursors A and B when the scroll is stopped during capture, or during replay. 4 Y Axis Operation Reset Click this button to revert the values set in the Y axis span and position to the default values. The default values are the same values as those of when switching the ranges. 5 Plot Click this button to display plot marks at the actual sample points on the waveforms. 6 Line Width * The expansion in the Y-axis direction is not available. Change the line width of the waveforms.(1/2/3/4/5) * The line may be thicker than the selected number of dots due to circumstances regarding input signals. Calculation 7 Calculation CH On/ Use these buttons to set calculations 1-4 to On/Off. On : Calculation results are Off shown as waveforms and digital values. Off : Do not perform calculations.The calculation results are only shown in Y-T display, and do not affect the captured data. 8 Calculation channel Sets the calculation channel for which calculation is to be set (* The unit conforms to CH X.) X/Y 9 Calculation Formula Use this button to set the variable for a linear expression between channels. A • CH X * B • CH Y + C The expression you set appears at the bottom of this window. (A and B are arbitrary coefficients. * is an arithmetic operation (+-x÷). X and Y are arbitrary channels, and C is an arbitrary constant.) 10 Expression Displays the calculation specified in the Expression setting. 13-2-2. Input Comments Click this icon to input a comment above the waveform of the desired channel during a data capture (replay) operation. If the scroll is ON, the input position is at the "Comment Input" in the upper part of a waveform. If the scroll is OFF, it is the position of Cursor A. 1 2 3 4 No. 1 Name CH Description Select a channel for entering a comment. 2 Comment input/ select Enters a comment. Up to 20 comments can be entered. If you change a position where a comment has already been entered, the entered comment will also be changed. 3 Input Click this button to input the comment.. 4 Delete Click this button to delete the comment that was input ەەCHECKPOINT Comments will be displayed based on the scale specified at the start of the data capture operation.If the Y-axis scale is changed during data capture, the input comments will be off positioned when displayed on the replay screen. To display the comments above the waveform, change the Y-axis scale after the replay. 51 13-2-3. Move/Search During replay, cursor A and the waveforms can be moved to the desired position. You select how to move them and perform the operation with the "Move" tab. 1 2 8 3 9 4 5 10 6 7 No. Search 1 Name 11 Description CH Use this button to select the CH to be searched. 2 Slope Use this button to select the slope to use for performing the search. H : Search for a rising signal. L : Search for a falling signal. 3 Level Use this button to set the search level. 4 Prev./Next Search Performs analog search. The judgment criteria of search is an edge. • Find Previous: Search in the past direction • Find Next: Search in the future direction This parameter is used to specify the alarm port number. 5 Alarm 6 Generated/Cleared Use this button to set the alarm status in which searches are performed. Generated : Performs search when an alarm is generated. Cleared : Performs search when an alarm is cleared. 7 Prev./Next Search Performs alarm search. The judgment criteria of search is an edge. • Find Previous: Search in the past direction • Find Next: Search in the future direction Move 8 CH Use this button to select the CH to be moved. 9 Search Max/Min Searches for the maximum and minimum values of the specified channel. • Find Maximum: Searches for the maximum value. • Find Minimum: Searches for the minimum value. 10 Serch in absolute time * This function is not available for external sampling data. Search in relative time Search the specified time. The searched time is the relative time from when data capture was started. 11 Search the specified time/date. * This function is not available for external sampling data. 52 ●Specifications are subject to change without notice. GL100 Application Software User's Manual APS (GL100) -UM-151 Sep. 1, 2014 GRAPHTEC CORPORATION 53