1
Condensed NMR Hands-on Operation Manual
Supplement and suitable only for training by T.A. or Senior Peer
Full version is available at http://chem.umd.edu/nmr
Yiu‐fai Lam, Frederick Nytko, III and Min Guo Caution and Reminder:
You are working very close to several strong super-conducting magnets in the
NMR lab. Follow all safety procedures and policiesy as disclosed to you at the
safety orientation.
To reserve spectrometer: Go to http://www2.chem.umd.edu/nmr
PLANNING ----- Your NMR measurements.
Contact staff for additional assistance. Appointment is highly recommended for project
consultation.
Basic sample preparation:
NMR Tube: 5mm OD, 7” long. Quality grade at least for 400MHz field strength.
Amount of compound: (assuming M.W. < 1,000, soluble at room temperature, and pure)
o
o
Solid compounds:
Liquid compounds:
~ 1-- 4 mg for H-1; ~ 10 – 40 mg for C-13.
~ 0.1 – 0.2 Volume % for H-1, ~ 5 – 15 % for C-13.
Volume of Solvent: ~ 0.5 to 0.6 ml. Deuterated solvent. Avoid mixed solvents.
Prior to NMR measurement:
Insert NMR sample tube into a special holder :
Select a blue plastic sample holder (also known as spinner).
Follow the recommended procedure as shown in the safety orientation.
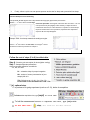
Adjust proper position of the sample:
Improper adjustment leads to no detectable
signals or breaking the NMR tube inside the
detector.
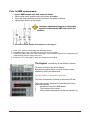
Insertion of NMR sample (with spinner) to the magnet:
1. Press “LIFT” button on the keypad (see description below).
2. A standby sample, if any, will slowly rise up to the top of the magnet.
3. Replace the sample with yours. Before releasing it, ensure the tube & spinner are supported by the
compressed air from the magnet entry port.
4. Press the “LIFT” button again to lower your sample into the magnet.
The Keypad:
Located next to the console Computer.
The layout consists of a matrix of buttons.
By pressing a specific button, a certain function can be
modified by turning the wheel-knob.
The LED flashes if a selected function fails.
The value of adjustment is shown on the center LED bar.
Three major groups: details will be described later in the
instruction sessions.
1.
Mechanical control on NMR sample.
2.
Field controls (lock, sweep).
3.
Shim gradient adjustments (details see Appendix A).
NMRFacility,UofMaryland.Y.F.Lam
Page2
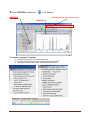
TO start TOPSPIN®, double click
on PC desktop,
NMR Data:
UM custom icons and pull down menu
Parameters
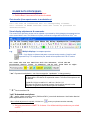
To execute a command: 3 options
a) With the mouse: point; click; and/or drag. Icons.
b) Click the command line and type in the command via key board!
c) Use UM pull down menu or icons, examples as shown below
NMRFacility,UofMaryland.Y.F.Lam
Page3
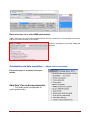
Create a DATA file: Click or type
“NEW”
a. Name: Define the name to identify your sample. e.g. sample813
b. EXPNO: “experiment number”…. Any integer [1 ….. 999].
c.
PROCNO: 1
d. Dir: C:\reserach-group
e. USER:
Mandatory format
“Your-name-month”.
where month is when the data sets are created.
f. Solvent: click and select the solvent in your sample.
g. Mandatory to keep the next two entries as shown in the
figure.
i. Experiment Dirs:
ii. Experiment:
“C:/Bruker/TOPSPIN/exp/stan/nmr/par/user”.
“Use current params”.
Basic Setup procedure:
After you create a file and with your sample properly
inserted into the magnet:
Click on UM Setup, to select and load standard experiment.
Format:
“ * ” wild card represents any characters.
[rpar Ah1*] shows all applications with a title that contains any
characters with “h1”, proton measurements.
[rpar Ac13*] shows all applications with a title that contains “c13”.
e.g. c13cpd for C13 measurement with H-1 decoupled.
[ getprsol ] “Load pulse values” specific for the spectrometer
being used.
Neglecting to load the current values will not
give proper NMR measurement.
NMRFacility,UofMaryland.Y.F.Lam
Page4
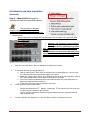
Basic procedure for a select NMR measurement:
[ edti ] Read instruction for the selected measurement. Once you review them, one may replace the content
with your comments relevant to your sample.
Or click the title page once you finish loading the
parameter.
Optimization and data acquisition --- Adjust and Acquire menu:
Execute the steps in sequence from top to
bottom.
Skip Step 3 for routine spectrometer.
Tune probe [wobb]: Not applicable for
routine spectrometers!
NMRFacility,UofMaryland.Y.F.Lam
Page5
Optimization and data acquisition
(Continued)
Step 4 --- Manual Shim (Essential for
obtaining high resolution sharp NMR signals).
The procedure is the basic
Remark:
simplified steps at UM facility only, where
calibration of shim settings are updated weekly.
Ultimate criteria:
Always check the line shape with a quick single scan to obtain a H-1 spectrum after
any shimming!
Spinning: OFF for short or routine samples
(< 0.5ml)
Adjust your speed in shimming any gradient
shim such that the lock level can response to the
change.
During the course of shim adjustment, if the
lock level exceeds the display scale, reduce the lock
gain to a level ~ 80 % of the display window.
I.
Take note of the lock level in the lock display as the initial reference level.
II.
To test which direction you should change Z2:
a. Start by reducing the Z2 shim value as indicated in the key pad slightly by ~ 20 to 50 units.
Very often the lock level may decrease slightly, don’t worry!
b. Adjust with Z shim in such manner as to increase the lock level by a few segments. Value of
the Z shim (as indicated in the key pad) could increase or decrease.
c. If the lock level has increased higher than the initial reference level, cycle steps a to b to
achieve the highest possible maximum.
d. The final level may vary from one sample to the others.
If level cannot be improved after step b:
III.
o
o
IV.
Reverse the adjustment of Z2. Namely, increase the Z2 shim value by 20 to 50 units, and
use the Z shim to increase for the lock level.
Cycle Z2 and Z a few times to obtain the highest possible lock level. (compared with the
initial reference level).
For best resolution, also adjust the X, Y and XY shims to obtain the maximum lock level.
NMRFacility,UofMaryland.Y.F.Lam
Page6
V.
Finally, collect a quick one scan proton spectrum and review for sharp and symmetrical line shape.
.
Common Examples of Poor Shimming:
Example ONE: All NMR signals have humps towards the large ppm (figure below) at their base.
Reason ----- Z2 shim value is set too large.
Correction procedure: Use keypad, reduce the value of Z2 shim ~ 25—50
units (lock level may drop slightly at this moment); re-adjust Z1 shim to
maximize the lock level; re-collect another H-1 spectrum. If the line shape
improves and becomes more symmetrical, repeat the same adjustment
sequence till the humps disappear.
Example TWO: Line humps towards the small ppm region.
Reason --- Z2 shim value is set too small; not enough Z2 current.
Reverse the correction procedure for example 1.
Follow the rest of steps (5 to 8) to collect data.
Step 6: Receiver gain auto-adjust (for best digitizer scaling).
Step 7: Sample dependent parameters.
Adjust as needed, otherwise use defaults.
D1, NS, and TDO.
D1 – relaxation delay for proper integration.
NS-- number of scans (concentration of your
sample) Min is 8.
TD0 –Default set to 1 for H1. 5 or 10 for C13.
Final number of accumulated scans = NS * TD0
** [tr] optional step.
*** to preview an on-going experiment (such as a C-13), before its completion.
To find out the acquisition time, type [expt] Or click time
To halt the measurement before it completes the scans, Type [halt] or click
DO NOT TYPE STOP!
NMRFacility,UofMaryland.Y.F.Lam
[stop] will erase all the data collecte
Page7
1D-NMR DATA PROCESSING:
Ask your peer trainer or NMR T.A. for demo.
Refer to Basic User manual Full version for details.
Data transfer (from spectrometer to workstations):
Data file must be transferred with its corresponding filename.
Don’t transfer an EXPNO subfolder alone that cannot be processed via
TOPSPIN software.
Visual display adjustments & commands:
The content in the Spectrum window can be adjusted or processed by clicking/dragging the appropriate icon
at the second &third rows: The UM short-cut (basic) commands are appended at the end of the 3rd row.
e.g.
Multiple displays: to compare spectra.
Cut: Copy display to clipboard and paste to external word processing. Good for small
expansion only. For comprehensive plot, details will be explained in the PLOT section.
For users who are not familiar with the software, click the UM
Processing (basic) icons, in sequence, one by one, from left to right.
“em” Exponential multiplication; one of the most popular “apodization” in data processing.
Apply an exponential weighting function with a value of {LB}. A positive LB value
will attenuate the FID data in an exponential manner. The noise of the spectrum will
be reduced.
Typical LB 0.3 (Hz) is used for H-1, and 2 to 4 Hz for C-13.
The larger the LB value, the greater amount of noise will be reduced, but the
sharpness of signals will also be reduced [loss in resolution].
“ ft ” Fourier transform FID.
“apk” Automated reset phase
“pk” applies phase correction values { PHC0 and PHC1 } stored with the data set. Useful when identical
phase adjustments are to be used.
When refined adjustment is required, click the icon
to carry out phase correction manually
Ask your peer trainer or NMR T.A. for demo. You will be test this procedure on your check
out!!!!!!!
NMRFacility,UofMaryland.Y.F.Lam
Page8
Chemical shift calibration, select and click either circled icons as shown in the figure --
TIPS:
Expand the spectrum first around the signal to be used for chemical shift calibration.
IF your sample contains no standard reference signal (such as TMS), use the residual H-1
signal from the solvent. This method is acceptable but not a universal standard. Some
solvent signals may shift with temperature or pH.
When solvent doesn’t give any residual H-1 or C13 signals, the external reference method
is to be used.
(Approximation method):
o Prepare a reference sample that contains a suitable chemical with a known
chemical shift value in the same solvent as your sample.
o Collect a 1 D NMR spectrum at the same temperature as your sample.
o Calibrate the shift and type “ sr “ to obtain a value known as the spectral
reference .
o Return to your original spectrum data file, import the value of sr obtained from the
reference sample.
Peak Picking:
Option: Click the pick peaks icon or the
in software top menu row.
Remark: Chemical shift calibration must be carried out before hand.
Ask your peer trainer or NMR T.A. for demo.
Refer to full User manual for description.
Option:
Sensitivity of Peak picking factor “pc “.
Pick peaking sensitivity can be modified with a parameter pc,
The default value is 4.The smaller the value of PC, the larger the number of peaks will be
indentified.
Integration:
Caution:
For routine 1D H-1 NMR, proper integration will reflect the relative population of spins in a
compound. This is only true when the processing is done properly sufficient relaxation delay time
(D1) when the data is collected.
NMRFacility,UofMaryland.Y.F.Lam
Page9
Procedure:
Ask your peer trainer or NMR T.A. for demo.
Refer to full User manual for description.
STEP 1: Auto integrate: Click the integrate icon or type [ abs ] at command line.
STEP 2: Modification and calibration (if needed) Click
to review and/or modify the integrals:
Slope and bias on a particular Integral:
a) Select the region: Place the mouse on the integral of interest, right click and a pop-up menu appears.
Click “Select/Deselect” once. The integral region turns yellowish-green.
b) Adjust the slope then bias:
SAVE INTEGRATION:
When all adjustments and modification are completed, calibrate the
integral, and click “SAVE” to exit.
NMRFacility,UofMaryland.Y.F.Lam
Page10
PLOT
Before printing:
TAB the TITLE PAGE! Replace the original
instruction with comment relevant to your
sample measured. Click save when editing is
completed.
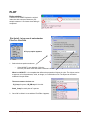
Plot [print]: In top row of main window
File >>>> click Print
A Pop-up option appears:
1. Select the three options as shown:
o
If the LAYOUT is not desirable. Click the
LAYOUT pull down menu and select a different LAYOUT.
What is a LAYOUT? It is a template that defines the properties of objects in a plot. The objects can be
a spectrum, a list of parameters, a title, an image, or a combination of all. The object can be further
modified in the plot editor.
The most common choices are:
1D_H.xwp for proton; 1D_BB.xwp for X-nuclei.
Stack_3.xwp for stack plots of 3 spectra.
2. Once OK is clicked. A new window “Plot Editor “appears,.
NMRFacility,UofMaryland.Y.F.Lam
Page11
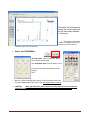
Plot editor will automatically
import the current spectrum
as the main object defined
in the layout.
To modify the size and/or
content of an object (such as the
spectrum), place the mouse
inside the object, left click to select.
Select the 1D/2D-Editor:
.
The Edit option (shown on the left) gives
lots of options and is digital.
The 1D/2D-Edit option is much easier to use!
Be sure to select either the Spectrum or the
integral !
Then,
When you finish modifying all the objects, click File and print within the
Plot editor (Don’t use the File- print in the main NMR software window).
CAUTION:
When you exit (close) the Plot editor window, don’t save the File when the
software prompts. The file it’s asking to save is the layout. It is not your spectrum.
NMRFacility,UofMaryland.Y.F.Lam
Page12
ABOUT THE Basic level NMR CHECK OUT (Open book):
Last update:
Oct, 2013.
Dead Line for your check out: __________________________________
Name and signature of trainer: _______________________________________
Basic expectation:
a) Able to log on with your own User ID to activate the spectrometer.
b) Able to compile all basic safety procedure (no loose metal objects; proper sample
insertion) when working in the NMR lab.
c) Able to collect a properly shimmed H1 spectrum within ten minutes.
d) Able to FTP raw FID data to one of the workstations in the NMR Lab.
All data is to be processed and plot with TOPSPIN software and the workstations in NMR facility
within TEN minutes.
Process the spectrum (properly phased and calibrate chemical shifts).
You will be tested use manual
to do phase adjustment.
Basic understanding:
You are expected to know the function of the essential terms: D1, NS, SW, em; ft; apk. (study
Manual for details).
Print two copies spectra with TOPSPIN software.
a) The first plot must contain the following items—select layout: 1D_H1.xwp.
Acquisition & processing parameters listed.
Full spectral range.
No integration and peak. (Erase them if they appears in the plot screen).
Your name and USER ID included in the title.
b) The second plot --- based on the first plot, delete the list of parameters, but add back the
listing of shifts and integrations using the “1D/2D-Edit”.
Make full use of the length of the chart paper for the plot.
The signals and the integrals are expended sufficiently large correspondingly, but the
integrals are not overlapping the base line of the spectrum.
Pay particular attention on integrations over multiplex signals: proper slope; bias and
range of integrals (study Manual for details).
Basic reference: www.chem.umd.edu/nmr
NMRFacility,UofMaryland.Y.F.Lam
Page13