1
ABI PRISM 7900HT
®
Sequence Detection System
User Guide
Basic Operation and Maintenance
ABI PRISM 7900HT
®
Sequence Detection System
User Guide
© Copyright 2001, Applied Biosystems. All Rights Reserved.
For Research Use Only. Not for use in diagnostic procedures.
ABI PRISM and its design, AmpliCover and MicroAmp are registered trademarks of Applera Corporation or its subsidiaries in the U.S. and certain
other countries.
ABI, Applied Biosystems, FAM, JOE, NED, ROX, TAMRA, TET, VIC, and Primer Express are trademarks of Applera Corporation or its
subsidiaries in the U.S. and certain other countries.
AmpErase, AmpliTaq, AmpliTaq Gold, GeneAmp, SYBR, and TaqMan are registered trademarks of Roche Molecular Systems, Inc.
Windows and Microsoft are registered trademarks of Microsoft, Inc.
Twister Universal Plate Handler is a trademark of Zymark Corporation. Twister Users Guide (part number 66503 from Zymark Corporation)
All other trademarks are the sole property of their respective owners.
Applera Corporation is committed to providing the world’s leading technology and information for life scientists. Applera Corporation consists of
the Applied Biosystems and Celera Genomics businesses.
Authorized Thermal Cycler
This ABI PRISM® 7900 HT Sequence Detection System Base Unit, Serial No___________, in combination with its immediately attached sample
block modules, comprise an Authorized Thermal Cycler. The purchase price of this Base Unit includes the up_front fee component of a license
under United States Patent Nos. 4,683,195, 4,683,202 and 4,965,188, owned by Roche Molecular Systems, Inc., and under corresponding claims in
patents outside the United States, owned by F. Hoffmann_La Roche Ltd, covering the Polymerase Chain Reaction ("PCR") process to practice the
PCR process for internal research and development using this instrument. The running royalty component of that license may be purchased from
Applied Biosystems or obtained by purchasing Authorized Reagents. This instrument is also an Authorized Thermal Cycler for use with
applications licenses available from Applied Biosystems. Its use with Authorized Reagents also provides a limited PCR license in accordance with
the label rights accompanying such reagents. Purchase of this product does not itself convey to the purchaser a complete license or right to perform
the PCR process. Further information on purchasing licenses to practice the PCR process may be obtained by contacting the Director of Licensing
at Applied Biosystems, 850 Lincoln Centre Drive, Foster City, California 94404.
DISCLAIMER OF LICENSE: No rights for any application, including any in vitro diagnostic application, are conveyed expressly, by implication
or by estoppel under any patent or patent applications claiming homogeneous or real_time detection methods, including patents covering such
methods used in conjunction with the PCR process or other amplification processes. The 5' nuclease detection assay and certain other homogeneous
or real_time amplification and detection methods are covered by United States Patent Nos. 5,210,015, 5,487,972, 5,804,375 and 5,994,056, owned
by Roche Molecular Systems, Inc.; by corresponding patents and patent applications outside the United States, owned by F. Hoffmann_La Roche
Ltd; and by United States Patent Nos. 5,538,848 and 6,030,787, and corresponding patents and patent applications outside the United States, owned
by Applera Corporation. Purchase of this instrument conveys no license or right under the foregoing patents. Use of these and other patented
processes in conjunction with the PCR process requires a license. For information on obtaining licenses, contact the Director of Licensing at Applied
Biosystems, 850 Lincoln Centre Drive, Foster City, California 94404, or The Licensing Department, Roche Molecular Systems, Inc., 1145 Atlantic
Avenue, Alameda, California, 94501
JpegEncoder Licensing Statement
The JpegEncoder and its associated classes are Copyright (c) 1998, James R. Weeks and BioElectroMech. This software is based in part on the
work of the Independent JPEG Group.
Redistribution and use in source and binary forms, with or without modification, are permitted provided that the following conditions are met:
1. Redistributions of source code must retain the above copyright notice, this list of conditions, all files included with the source code, and the
following disclaimer.
2. Redistributions in binary form must reproduce the above copyright notice, this list of conditions and the following disclaimer in the documentation
and/or other materials provided with the distribution.
THIS SOFTWARE IS PROVIDED BY THE AUTHOR AND CONTRIBUTORS ``AS IS'' AND ANY EXPRESS OR IMPLIED WARRANTIES,
INCLUDING, BUT NOT LIMITED TO, THE IMPLIED WARRANTIES OF MERCHANTABILITY AND FITNESS FOR A PARTICULAR
PURPOSE ARE DISCLAIMED. IN NO EVENT SHALL THE AUTHOR OR CONTRIBUTORS BE LIABLE FOR ANY DIRECT, INDIRECT,
INCIDENTAL, SPECIAL, EXEMPLARY, OR CONSEQUENTIAL DAMAGES (INCLUDING, BUT NOT LIMITED TO, PROCUREMENT OF
SUBSTITUTE GOODS OR SERVICES; LOSS OF USE, DATA, OR PROFITS; OR BUSINESS INTERRUPTION) HOWEVER CAUSED AND
ON ANY THEORY OF LIABILITY, WHETHER IN CONTRACT, STRICT LIABILITY, OR TORT (INCLUDING NEGLIGENCE OR
OTHERWISE) ARISING IN ANY WAY OUT OF THE USE OF THIS SOFTWARE, EVEN IF ADVISED OF THE POSSIBILITY OF SUCH
DAMAGE.
Contents
1 Safety
Attention Words and Warning Labels . . . . . . . . . . . . . . . . . . . . . . . . . . . . . . . . . . . . . . . 1-2
Chemical Hazards, Waste Profiles, and Disposal . . . . . . . . . . . . . . . . . . . . . . . . . . . . . . 1-3
Obtaining Material Safety Data Sheets (MSDS) . . . . . . . . . . . . . . . . . . . . . . . . . . . . . . . 1-5
Safe Instrument Use. . . . . . . . . . . . . . . . . . . . . . . . . . . . . . . . . . . . . . . . . . . . . . . . . . . . . 1-6
2 Product Overview
System Overview. . . . . . . . . . . . . . . . . . . . . . . . . . . . . . . . . . . . . . . . . . . . . . . . . . . . . . . 2-2
Section: Getting to Know the Hardware . . . . . . . . . . . . . . . . . . . . . . . . . . . . . . . . . . 2-3
7900HT Instrument . . . . . . . . . . . . . . . . . . . . . . . . . . . . . . . . . . . . . . . . . . . . . . . . . . . . . 2-4
Computer . . . . . . . . . . . . . . . . . . . . . . . . . . . . . . . . . . . . . . . . . . . . . . . . . . . . . . . . . . . . . 2-7
Bar Code Readers . . . . . . . . . . . . . . . . . . . . . . . . . . . . . . . . . . . . . . . . . . . . . . . . . . . . . . 2-8
Zymark Twister Microplate Handler . . . . . . . . . . . . . . . . . . . . . . . . . . . . . . . . . . . . . . . . 2-9
Compatible Consumables . . . . . . . . . . . . . . . . . . . . . . . . . . . . . . . . . . . . . . . . . . . . . . . 2-10
Instrument Connections . . . . . . . . . . . . . . . . . . . . . . . . . . . . . . . . . . . . . . . . . . . . . . . . . 2-11
Section: Getting to Know the Software . . . . . . . . . . . . . . . . . . . . . . . . . . . . . . . . . . 2-13
Sequence Detection System Software Components and Features. . . . . . . . . . . . . . . . . 2-14
Managing Sequence Detection System Data. . . . . . . . . . . . . . . . . . . . . . . . . . . . . . . . . 2-15
Working with SDS Software Files. . . . . . . . . . . . . . . . . . . . . . . . . . . . . . . . . . . . . . . . . 2-16
3 Getting Started
Getting Started . . . . . . . . . . . . . . . . . . . . . . . . . . . . . . . . . . . . . . . . . . . . . . . . . . . . . . . . . 3-2
About This Manual . . . . . . . . . . . . . . . . . . . . . . . . . . . . . . . . . . . . . . . . . . . . . . . . . . . . . 3-3
Turning on the ABI PRISM 7900HT Sequence Detection System. . . . . . . . . . . . . . . . . . 3-5
Using the SDS Software Workspace . . . . . . . . . . . . . . . . . . . . . . . . . . . . . . . . . . . . . . . . 3-7
Basic Software Skills Tutorial . . . . . . . . . . . . . . . . . . . . . . . . . . . . . . . . . . . . . . . . . . . . 3-11
Using SDS Plate Documents . . . . . . . . . . . . . . . . . . . . . . . . . . . . . . . . . . . . . . . . . . . . . 3-21
4 Run Setup and Basic Operation
Before You Begin . . . . . . . . . . . . . . . . . . . . . . . . . . . . . . . . . . . . . . . . . . . . . . . . . . . . . . 4-2
Setup Checklists . . . . . . . . . . . . . . . . . . . . . . . . . . . . . . . . . . . . . . . . . . . . . . . . . . . . . . . 4-3
iii
Section: Plate Document Setup . . . . . . . . . . . . . . . . . . . . . . . . . . . . . . . . . . . . . . . . . .4-5
Step 1 – Creating a Plate Document . . . . . . . . . . . . . . . . . . . . . . . . . . . . . . . . . . . . . . . . 4-6
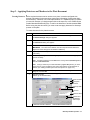
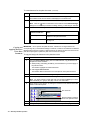
Step 2 – Applying Detectors and Markers to the Plate Document . . . . . . . . . . . . . . . . . 4-7
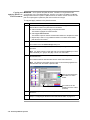
Step 3 – Configuring the Plate Document with Detector Tasks . . . . . . . . . . . . . . . . . . 4-11
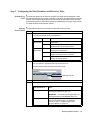
Step 4 – Programming the Plate Document Method . . . . . . . . . . . . . . . . . . . . . . . . . . 4-13
Step 5 – Saving the Plate Document as a Template . . . . . . . . . . . . . . . . . . . . . . . . . . . 4-17
Step 6 – Creating a Plate Document from the Template. . . . . . . . . . . . . . . . . . . . . . . . 4-18
Step 7 – Applying Sample and Plate Information . . . . . . . . . . . . . . . . . . . . . . . . . . . . 4-19
Step 8 – Running the Plate on the 7900HT Instrument . . . . . . . . . . . . . . . . . . . . . . . . 4-20
Section: Running an Individual Plate . . . . . . . . . . . . . . . . . . . . . . . . . . . . . . . . . . .4-21
Saving the Plate Document. . . . . . . . . . . . . . . . . . . . . . . . . . . . . . . . . . . . . . . . . . . . . . 4-22
Preparing and Running a Single Plate . . . . . . . . . . . . . . . . . . . . . . . . . . . . . . . . . . . . . 4-23
Operating the 7900HT Instrument Using the SDS Software . . . . . . . . . . . . . . . . . . . . 4-25
After the Run . . . . . . . . . . . . . . . . . . . . . . . . . . . . . . . . . . . . . . . . . . . . . . . . . . . . . . . . 4-27
Section: Running Multiple Plates Using the Automation Controller . . . . . . . . . . .4-29
Adding Plate Documents to the Plate Queue for Automated Operation . . . . . . . . . . . 4-30
Adding a Plate Document to the Plate Queue from the SDS Software . . . . . . . . . . . . 4-31
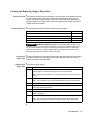
Creating Plate Documents Using the Template Batch Utility . . . . . . . . . . . . . . . . . . . 4-32
Running Plates Using the Automation Controller Software. . . . . . . . . . . . . . . . . . . . . 4-34
Loading Plates onto the Automation Module . . . . . . . . . . . . . . . . . . . . . . . . . . . . . . . . 4-36
Operating the 7900HT Instrument Using the Automation Controller Software. . . . . . 4-38
After the Run . . . . . . . . . . . . . . . . . . . . . . . . . . . . . . . . . . . . . . . . . . . . . . . . . . . . . . . . 4-38
5 End-Point Analysis
End-Point Runs on the 7900HT Instrument . . . . . . . . . . . . . . . . . . . . . . . . . . . . . . . . . . 5-2
Section: Allelic Discrimination . . . . . . . . . . . . . . . . . . . . . . . . . . . . . . . . . . . . . . . . . .5-3
Overview. . . . . . . . . . . . . . . . . . . . . . . . . . . . . . . . . . . . . . . . . . . . . . . . . . . . . . . . . . . . . 5-4
Before You Begin . . . . . . . . . . . . . . . . . . . . . . . . . . . . . . . . . . . . . . . . . . . . . . . . . . . . . . 5-7
Analysis Checklist . . . . . . . . . . . . . . . . . . . . . . . . . . . . . . . . . . . . . . . . . . . . . . . . . . . . . 5-8
Analyzing a Completed Allelic Discrimination Run . . . . . . . . . . . . . . . . . . . . . . . . . . . 5-9
Calling and Scrutinizing Allelic Discrimination Data . . . . . . . . . . . . . . . . . . . . . . . . . 5-10
After the Analysis . . . . . . . . . . . . . . . . . . . . . . . . . . . . . . . . . . . . . . . . . . . . . . . . . . . . . 5-15
6 Real-Time Analysis
Real-Time Runs on the 7900HT Instrument. . . . . . . . . . . . . . . . . . . . . . . . . . . . . . . . . . 6-2
Section: Absolute Quantification . . . . . . . . . . . . . . . . . . . . . . . . . . . . . . . . . . . . . . . .6-3
Overview. . . . . . . . . . . . . . . . . . . . . . . . . . . . . . . . . . . . . . . . . . . . . . . . . . . . . . . . . . . . . 6-4
Before You Begin . . . . . . . . . . . . . . . . . . . . . . . . . . . . . . . . . . . . . . . . . . . . . . . . . . . . . . 6-6
Analysis Checklist . . . . . . . . . . . . . . . . . . . . . . . . . . . . . . . . . . . . . . . . . . . . . . . . . . . . . 6-7
Analyzing the Run Data . . . . . . . . . . . . . . . . . . . . . . . . . . . . . . . . . . . . . . . . . . . . . . . . . 6-8
Viewing Results . . . . . . . . . . . . . . . . . . . . . . . . . . . . . . . . . . . . . . . . . . . . . . . . . . . . . . 6-13
After the Analysis . . . . . . . . . . . . . . . . . . . . . . . . . . . . . . . . . . . . . . . . . . . . . . . . . . . . . 6-15
iv
Section: Dissociation Curve Analysis . . . . . . . . . . . . . . . . . . . . . . . . . . . . . . . . . . . . 6-17
Overview . . . . . . . . . . . . . . . . . . . . . . . . . . . . . . . . . . . . . . . . . . . . . . . . . . . . . . . . . . . . 6-18
Before You Begin . . . . . . . . . . . . . . . . . . . . . . . . . . . . . . . . . . . . . . . . . . . . . . . . . . . . . 6-19
Analysis Checklist . . . . . . . . . . . . . . . . . . . . . . . . . . . . . . . . . . . . . . . . . . . . . . . . . . . . . 6-20
Analyzing the Run Data . . . . . . . . . . . . . . . . . . . . . . . . . . . . . . . . . . . . . . . . . . . . . . . . 6-21
Determining Tm Values for the Analyzed Run . . . . . . . . . . . . . . . . . . . . . . . . . . . . . . . 6-22
After the Analysis . . . . . . . . . . . . . . . . . . . . . . . . . . . . . . . . . . . . . . . . . . . . . . . . . . . . . 6-24
7 System Maintenance
Recommended Maintenance Schedule . . . . . . . . . . . . . . . . . . . . . . . . . . . . . . . . . . . . . . 7-2
Section: Maintaining the 7900HT Instrument . . . . . . . . . . . . . . . . . . . . . . . . . . . . . 7-3
Replacing the Sample Block . . . . . . . . . . . . . . . . . . . . . . . . . . . . . . . . . . . . . . . . . . . . . . 7-4
Changing the 7900HT Plate Adapter. . . . . . . . . . . . . . . . . . . . . . . . . . . . . . . . . . . . . . . . 7-9
Decontaminating the Sample Block . . . . . . . . . . . . . . . . . . . . . . . . . . . . . . . . . . . . . . . 7-11
Performing a Background Run . . . . . . . . . . . . . . . . . . . . . . . . . . . . . . . . . . . . . . . . . . . 7-13
Performing a Pure Dye Run. . . . . . . . . . . . . . . . . . . . . . . . . . . . . . . . . . . . . . . . . . . . . . 7-17
Adding Custom Dyes to the Pure Dye Set . . . . . . . . . . . . . . . . . . . . . . . . . . . . . . . . . . 7-21
Verifying Instrument Performance Using a TaqMan RNase P Plate . . . . . . . . . . . . . . . 7-24
Section: Maintaining the Plate Handler . . . . . . . . . . . . . . . . . . . . . . . . . . . . . . . . . 7-27
Adjusting the Sensitivity of the Plate Sensor Switch . . . . . . . . . . . . . . . . . . . . . . . . . . 7-28
Aligning the Plate Handler . . . . . . . . . . . . . . . . . . . . . . . . . . . . . . . . . . . . . . . . . . . . . . 7-32
Aligning the Fixed-Position Bar Code Reader . . . . . . . . . . . . . . . . . . . . . . . . . . . . . . . 7-40
Cleaning and Replacing Gripper Finger Pads . . . . . . . . . . . . . . . . . . . . . . . . . . . . . . . . 7-43
Section: Maintaining the Computer and SDS Software . . . . . . . . . . . . . . . . . . . . . 7-45
General Computer Maintenance . . . . . . . . . . . . . . . . . . . . . . . . . . . . . . . . . . . . . . . . . . 7-46
Maintaining the SDS software. . . . . . . . . . . . . . . . . . . . . . . . . . . . . . . . . . . . . . . . . . . . 7-48
8 Troubleshooting
Troubleshooting Table . . . . . . . . . . . . . . . . . . . . . . . . . . . . . . . . . . . . . . . . . . . . . . . . . . . 8-2
Low Precision or Irreproducibility . . . . . . . . . . . . . . . . . . . . . . . . . . . . . . . . . . . . . . . . . 8-4
Background Runs . . . . . . . . . . . . . . . . . . . . . . . . . . . . . . . . . . . . . . . . . . . . . . . . . . . . . . 8-8
Pure Dye Runs . . . . . . . . . . . . . . . . . . . . . . . . . . . . . . . . . . . . . . . . . . . . . . . . . . . . . . . . 8-10
Real-Time Runs (Quantitative PCR and Dissociation Curves) . . . . . . . . . . . . . . . . . . . 8-11
End-Point Runs (Allelic Discrimination) . . . . . . . . . . . . . . . . . . . . . . . . . . . . . . . . . . . 8-13
Software and 7900HT Instrument . . . . . . . . . . . . . . . . . . . . . . . . . . . . . . . . . . . . . . . . . 8-14
Zymark Twister Microplate Handler and Fixed-Position Bar Code Reader . . . . . . . . . 8-17
9 User Bulletins
v
A Theory of Operation
Fluorescent-Based Chemistries. . . . . . . . . . . . . . . . . . . . . . . . . . . . . . . . . . . . . . . . . . . . A-2
Fluorescence Detection and Data Collection . . . . . . . . . . . . . . . . . . . . . . . . . . . . . . . . . A-4
Mathematical Transformations . . . . . . . . . . . . . . . . . . . . . . . . . . . . . . . . . . . . . . . . . . . . A-5
Real-Time Data Analysis . . . . . . . . . . . . . . . . . . . . . . . . . . . . . . . . . . . . . . . . . . . . . . . . A-7
B Importing and Exporting Plate Document Data
Importing Plate Document Setup Table Files . . . . . . . . . . . . . . . . . . . . . . . . . . . . . . . . . B-2
Setup Table File Format . . . . . . . . . . . . . . . . . . . . . . . . . . . . . . . . . . . . . . . . . . . . . . . . . B-4
Exporting Graphics . . . . . . . . . . . . . . . . . . . . . . . . . . . . . . . . . . . . . . . . . . . . . . . . . . . . . B-8
Exporting Plate Document Data . . . . . . . . . . . . . . . . . . . . . . . . . . . . . . . . . . . . . . . . . . . B-9
C Designing TaqMan Assays
Assay Development Guidelines . . . . . . . . . . . . . . . . . . . . . . . . . . . . . . . . . . . . . . . . . . . C-2
Design Tips for Allelic Discrimination Assays . . . . . . . . . . . . . . . . . . . . . . . . . . . . . . . C-5
Design Tips for Quantitative PCR Assays . . . . . . . . . . . . . . . . . . . . . . . . . . . . . . . . . . . C-6
D Kits, Reagents and Consumables
E References
F Contacting Technical Support
G Limited Warranty Statement
Index
vi
Safety
1
1
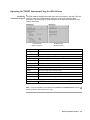
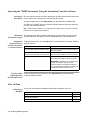
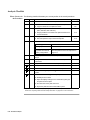
In This Chapter This chapter discusses the following topics:
Topic
Attention Words and Warning Labels
See Page
1-2
Chemical Hazards, Waste Profiles, and Disposal
1-3
Obtaining Material Safety Data Sheets (MSDS)
1-5
Safe Instrument Use
1-6
Safety 1-1
Attention Words and Warning Labels
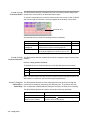
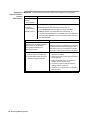
Documentation User Five user attention words appear in the text of all Applied Biosystems user
Attention Words documentation. Each word implies a particular level of observation or action as
described below.
Note
Calls attention to useful information.
IMPORTANT Indicates information that is necessary for proper instrument operation.
! CAUTION Indicates a potentially hazardous situation which, if not avoided, may result in
minor or moderate injury. It may also be used to alert against unsafe practices.
! WARNING Indicates a potentially hazardous situation which, if not avoided, could result in
death or serious injury.
! DANGER Indicates an imminently hazardous situation which, if not avoided, will result in
death or serious injury. This signal word is to be limited to the most extreme situations.
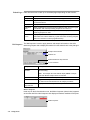
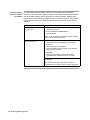
Instrument Safety labels are located on the instrument. Each safety label has three parts:
Safety Labels ♦ A signal word panel, which implies a particular level of observation or action
(e.g., CAUTION or WARNING). If a safety label encompasses multiple hazards,
the signal word corresponding to the greatest hazard is used
♦
A message panel, which explains the hazard and any user action required
♦
A safety alert symbol, which indicates a potential personal safety hazard. See the
ABI PRISM 7900HT Sequence Detection System Site Preparation and Safety
Guide (P/N 4317595) for an explanation of all the safety alert symbols provided in
several languages.
Laser Exposure The components of the ABI PRISM® 7900HT Sequence Detection System contain
several lasers including an Argon laser within the 7900HT instrument and a low power
laser within each bar code reader (fixed-position and hand-held).
! WARNING LASER HAZARD. Exposure to direct or reflected laser light can burn the retina
and leave permanent blind spots. Never look directly into the laser beam. Remove jewelry and
other items that can reflect the beam into your eyes. Protect others from exposure to the beam.
Site Preparation and A site preparation and safety guide is a separate document sent to all customers who
Safety Guide have purchased an Applied Biosystems instrument. Refer to the guide written for your
instrument for information on site preparation, instrument safety, chemical safety, and
waste profiles.
1-2 Safety
Chemical Hazards, Waste Profiles, and Disposal
Chemical Hazard ! WARNING CHEMICAL HAZARD. Some of the chemicals used with Applied Biosystems
Warning instruments and protocols are potentially hazardous and can cause injury, illness, or death.
♦
Read and understand the material safety data sheets (MSDSs) provided by the
chemical manufacturer before you store, handle, or work with any chemicals or
hazardous materials.
♦
Minimize contact with chemicals. Wear appropriate personal protective equipment
when handling chemicals (e.g., safety glasses, gloves, or protective clothing). For
additional safety guidelines, consult the MSDS.
♦
Minimize the inhalation of chemicals. Do not leave chemical containers open. Use
only with adequate ventilation (e.g., fume hood). For additional safety guidelines,
consult the MSDS.
♦
Check regularly for chemical leaks or spills. If a leak or spill occurs, follow the
manufacturer’s cleanup procedures as recommended on the MSDS.
♦
Comply with all local, state/provincial, or national laws and regulations related to
chemical storage, handling, and disposal.
Chemical Waste ! WARNING CHEMICAL WASTE HAZARD. Wastes produced by Applied Biosystems
Hazard Warning instruments are potentially hazardous and can cause injury, illness, or death.
♦
Read and understand the material safety data sheets (MSDSs) provided by the
manufacturers of the chemicals in the waste container before you store, handle,
or dispose of chemical waste.
♦
Handle chemical wastes in a fume hood.
♦
Minimize contact with chemicals. Wear appropriate personal protective equipment
when handling chemicals (e.g., safety glasses, gloves, or protective clothing). For
additional safety guidelines, consult the MSDS.
♦
Minimize the inhalation of chemicals. Do not leave chemical containers open. Use
only with adequate ventilation (e.g., fume hood). For additional safety guidelines,
consult the MSDS.
♦
After emptying the waste container, seal it with the cap provided.
♦
Dispose of the contents of the waste tray and waste bottle in accordance with
good laboratory practices and local, state/provincial, or national environmental
and health regulations.
Safety 1-3
About Waste Profiles A waste profile was provided with this instrument and is contained in the ABI PRISM
7900HT Sequence Detection System Site Preparation and Safety Guide. Waste
profiles list the percentage compositions of the reagents within the waste stream at
installation and the waste stream during a typical user application, although this
application may not be used in your laboratory. These profiles assist users in planning
for instrument waste handling and disposal. Read the waste profiles and all applicable
MSDSs before handling or disposing of waste.
IMPORTANT Waste profiles are not a substitute for MSDS information.
About Waste As the generator of potentially hazardous waste, it is your responsibility to perform the
Disposal actions listed below.
♦
Characterize (by analysis if necessary) the waste generated by the particular
applications, reagents, and substrates used in your laboratory.
♦
Ensure the health and safety of all personnel in your laboratory.
♦
Ensure that the instrument waste is stored, transferred, transported, and disposed
of according to all local, state/provincial, or national regulations.
Note Radioactive or biohazardous materials may require special handling, and disposal
limitations may apply.
1-4 Safety
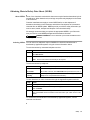
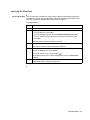
Obtaining Material Safety Data Sheets (MSDS)
About MSDSs Some of the chemicals used with this instrument may be listed as hazardous by their
manufacturer. When hazards exist, warnings are prominently displayed on the labels
of all chemicals.
Chemical manufacturers supply a current MSDS before or with shipments of
hazardous chemicals to new customers and with the first shipment of a hazardous
chemical after an MSDS update. MSDSs provide you with the safety information you
need to store, handle, transport and dispose of the chemicals safely.
We strongly recommend that you replace the appropriate MSDS in your files each
time you receive a new MSDS packaged with a hazardous chemical.
! WARNING CHEMICAL HAZARD. Be sure to familiarize yourself with the MSDSs before
using reagents or solvents.
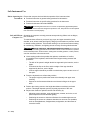
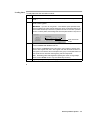
Ordering MSDSs You can order free additional copies of MSDSs for chemicals manufactured or
distributed by Applied Biosystems using the contact information below.
To order documents by automated telephone service:
Step
Action
1
From the U.S. or Canada, dial 1.800.487.6809, or from outside the U.S. and Canada,
dial 1.858.712.0317.
2
Follow the voice instructions to order documents (for delivery by fax).
Note
There is a limit of five documents per fax request.
To order documents by telephone:
In the U.S.
Dial 1.800.345.5224, and press 1.
♦ To order in English, dial 1.800.668.6913 and press 1, then 2, then 1.
In Canada
♦ To order in French, dial 1.800.668.6913 and press 2, then 2, then 1.
From any other
country
See the specific region under “To Contact Technical Support by
Telephone or Fax (Outside North America).”
To view, download, or order documents through the Applied Biosystems web site:
Step
Action
1
Go to http://www.appliedbiosystems.com
2
Click SERVICES & SUPPORT at the top of the page, click Documents on Demand,
then click MSDS.
3
Click MSDS Index, search through the list for the chemical of interest to you, then
click on the MSDS document number for that chemical to open a PDF version of the
MSDS.
For chemicals not manufactured or distributed by Applied Biosystems, call the
chemical manufacturer.
Safety 1-5
Safe Instrument Use
Before Operating the Ensure that everyone involved with the operation of the instrument has:
Instrument ♦ Received instruction in general safety practices for laboratories
♦
Received instruction in specific safety practices for the instrument
♦
Read and understood all related MSDSs
! CAUTION Avoid using this instrument in a manner not specified by Applied Biosystems.
Although the instrument has been designed to protect the user, this protection can be impaired
if the instrument is used improperly.
Safe and Efficient Operating the computer correctly prevents stress-producing effects such as fatigue,
Computer Use pain, and strain.
To minimize these effects on your back, legs, eyes, and upper extremities (neck,
shoulder, arms, wrists, hands and fingers), design your workstation to promote neutral
or relaxed working positions. This includes working in an environment where heating,
air conditioning, ventilation, and lighting are set correctly. See the guidelines below.
! CAUTION MUSCULOSKELETAL AND REPETITIVE MOTION HAZARD. These hazards
are caused by the following potential risk factors which include, but are not limited to, repetitive
motion, awkward posture, forceful exertion, holding static unhealthy positions, contact pressure,
and other workstation environmental factors.
♦
♦
1-6 Safety
Use a seating position that provides the optimum combination of comfort,
accessibility to the keyboard, and freedom from fatigue-causing stresses and
pressures.
–
The bulk of the person’s weight should be supported by the buttocks, not the
thighs.
–
Feet should be flat on the floor, and the weight of the legs should be
supported by the floor, not the thighs.
–
Lumbar support should be provided to maintain the proper concave curve of
the spine.
Place the keyboard on a surface that provides:
–
The proper height to position the forearms horizontally and upper arms
vertically.
–
Support for the forearms and hands to avoid muscle fatigue in the upper
arms.
♦
Position the viewing screen to the height that allows normal body and head
posture. This height depends upon the physical proportions of the user.
♦
Adjust vision factors to optimize comfort and efficiency by:
–
Adjusting screen variables, such as brightness, contrast, and color, to suit
personal preferences and ambient lighting.
–
Positioning the screen to minimize reflections from ambient light sources.
–
Positioning the screen at a distance that takes into account user variables
such as nearsightedness, farsightedness, astigmatism, and the effects of
corrective lenses.
♦
When considering the user’s distance from the screen, the following are useful
guidelines:
–
The distance from the user’s eyes to the viewing screen should be
approximately the same as the distance from the user’s eyes to the keyboard.
–
For most people, the reading distance that is the most comfortable is
approximately 20 inches.
–
The workstation surface should have a minimum depth of 36 inches to
accommodate distance adjustment.
–
Adjust the screen angle to minimize reflection and glare, and avoid highly
reflective surfaces for the workstation.
♦
Use a well-designed copy holder, adjustable horizontally and vertically, that allows
referenced hard-copy material to be placed at the same viewing distance as the
screen and keyboard.
♦
Keep wires and cables out of the way of users and passersby.
♦
Choose a workstation that has a surface large enough for other tasks and that
provides sufficient legroom for adequate movement.
Safety 1-7
Product Overview
2
2
In This Chapter This chapter discusses the following topics:
Topic
System Overview
See Page
2-2
Section: Getting to Know the Hardware
2-3
7900HT Instrument
2-4
Computer
2-7
Bar Code Readers
2-8
Zymark Twister Microplate Handler
2-9
Compatible Consumables
2-10
Instrument Connections
2-11
Section: Getting to Know the Software
2-13
Sequence Detection System Software Components and Features
2-14
Managing Sequence Detection System Data
2-15
Working with SDS Software Files
2-16
Product Overview 2-1
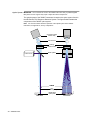
System Overview
About the 7900HT The ABI PRISM® 7900HT Sequence Detection System is a second-generation
Instrument sequence detection system instrument designed for automated, high-throughput
detection of fluorescent PCR-related chemistries. The instrument is capable of
real-time, end-point, and dissociation curve analysis of assays arrayed on multiple
formats. The 7900HT instrument is optimized for use with Applied Biosystems
chemistries including those related to nucleic acid quantification and detection.
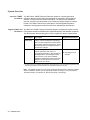
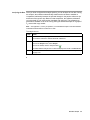
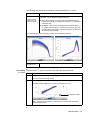
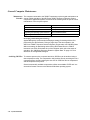
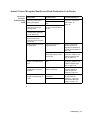
Supported Runs and The ABI PRISM 7900HT Sequence Detection System is designed to support several
Chemistries PCR-related chemistries available from Applied Biosystems and affiliated companies.
The SDS software features two types of runs to support the variety of applications.
Run/Analysis
Description
Supported Chemistries
End Point
(Plate Read)
In an end-point run, the 7900HT instrument
collects a single reading after completing a
PCR run. After analysis by the SDS software,
the resulting multicomponent data is used to
assess the presence of target sequences in
the unknown samples.
♦ Allelic Discrimination
Real Time
In an real-time run, the 7900HT instrument
collects data during each cycle of a
pre-programmed PCR run. After analysis by
the SDS software, the resulting threshold
cycle values (CT) are used to establish
quantitative relationships between the initial
template concentrations of the unknowns
and those of the controls.
♦ Absolute Quantification
♦ Dissociation Curve
Analysisa
a. For dissociation curve analysis, the instrument collects data during a pre-programmed temperature ramp
and plots the negative of the first derivative for normalized fluorescence over time.
Note For detailed information on any of the chemistries supported by the ABI PRISM 7900HT
Sequence Detection System, see the appropriate chapter for the type of run (see Chapter 5,
“End-Point Analysis,” and Chapter 6, “Real-Time Analysis,” respectively).
2-2 Product Overview
Section: Getting to Know the Hardware
In This Section This section contains the following information:
Topic
See Page
7900HT Instrument
2-4
Computer
2-7
Bar Code Readers
2-8
Zymark Twister Microplate Handler
2-9
Compatible Consumables
2-10
Instrument Connections
2-11
GR2009
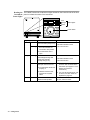
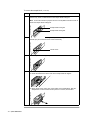
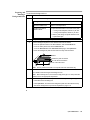
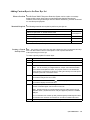
Instrument The ABI PRISM 7900HT Sequence Detection System consists of the following
Components components:
1
Number
1
2
4
4
5
6
For information on the…
See Page
7900HT Instrument
2
3
3
2-4
Fixed-Position Bar Code Reader
Automation Accessory
(optional)
Zymark®
Twister™ Microplate Handler
Extended Capacity Stacks
5
Hand-Held Bar Code Reader
6
Microsoft®
Windows®-Compatible
2-8
2-9
2-8
Computer
2-7
Product Overview 2-3
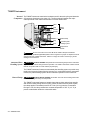
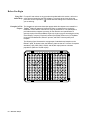
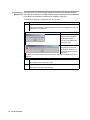
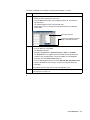
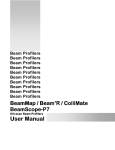
7900HT Instrument
Internal The 7900HT instrument contains the hardware used for thermal cycling and detection
Components of fluorescent chemistries (see page 2-2). The figure below illustrates the major
subcomponents of the instrument described in further detail below.
Laser
CCD
camera
Optics
system
Reader
GR2112
Heated clamp
Tray
Door
Automated plate
handling system
Sample block
module
! CAUTION Do not remove the cover to the ABI PRISM 7900HT Sequence Detection
System. Only a qualified Applied Biosystems service engineer may repair or adjust the internal
components of the 7900HT instrument. Failure to comply can result in serious injury and/or
damage to the instrument.
Automated Plate ! WARNING PHYSICAL HAZARD. Keep hands and loose clothing away from the instrument
Handling System tray and door at all times during instrument operation. The 7900HT instrument contains several
internal components that can cause serious physical injury.
The 7900HT instrument features an automated plate handling system to provide easy
loading and removal of plates from the instrument. In combination with the automation
module, the plate handling system allows unattended operation of the instrument.
Heated Clamp
! WARNING PHYSICAL INJURY HAZARD. Hot Surface. Use care when working around this
area to avoid being burned by hot components.
The 7900HT instrument features a heated clamp that provides optimal heat transfer
and uniform heating during thermal cycling. When the instrument tray loads a plate,
the clamp applies a downward pressure of 70 lbs (31.8 kg) onto the consumable.
During the run, the clamp maintains a constant temperature of 105 °C (± 3 °C) to
prevent condensation within the consumable wells.
2-4 Product Overview
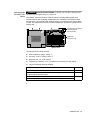
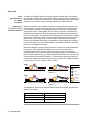
Interchangeable ! WARNING PHYSICAL INJURY HAZARD. Hot Surface. Use care when working around
Thermal Cycler this area to avoid being burned by hot components.
Blocks The 7900HT instrument features a Peltier-based, interchangeable sample block
module based on the technology established in the GeneAmp ® PCR System 9700
thermal cycler. The internal Peltier heating/cooling unit is housed in the sample block
module. The sample block module is made of aluminum to provide the optimal thermal
transfer rate.
Circuitry and connections
to the instrument
(Do Not Touch)
Warning
GR2028
GR2028
Heat sinks
(Do Not Touch)
Top View
Bottom View
The sample block module provides:
♦
Wide temperature range: 4–99.9 °C
♦
Accuracy: ±0.25 °C from 35–99.9 °C
♦
Heat/cool rate: 1.5 °C per second
♦
Temperature uniformity: ±0.5 °C (measured 30 sec after the clock starts)
♦
Long-term stability and high reliability
The interchangeable sample block module…
See Page
supports multiple consumable formats.
2-10
provides several different modes of operation (including 9600 mode and
programmable temperature ramps).
4-13
reduces instrument downtime by allowing immediate replacement of the block.
7-4
permits easy access to the sample block for troubleshooting and maintenance.
Product Overview 2-5
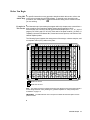
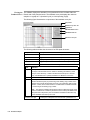
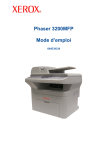
Optics System IMPORTANT Do not remove the cover to the 7900HT instrument. Only a qualified Applied
Biosystems service engineer may repair or adjust the internal components.
The optical system of the 7900HT instrument is based on the optics system found in
the ABI PRISM ® 7700 Sequence Detection System. The figure below illustrates the
components of the 7900HT optics system.
Note For more information about the operation of the optical system of the 7900HT
instrument, see Appendix A, “Theory of Operation.”
Charged coupled
device array
Camera lens
Grating
Emission filter
Beam splitter
Laser source
Fresnel
GR2103
Lens
(within Lensplate)
384/96-Well
optical plate
Side View
2-6 Product Overview
Front View
Computer
Description The computer coordinates the operation of the Sequence Detection instrument,
automation module, and the bar code readers via the SDS software. The figure below
illustrates the general configuration of the computer supplied with the ABI PRISM
7900HT Sequence Detection System.
Monitor power button
GR2009
Computer power button
System IMPORTANT The following requirements are valid for Version 2.0 of the SDS software and
Requirements may change with future revisions of the 7900HT instrument software and firmware. Check the
release notes accompanying your version of the SDS software for updates.
To run the SDS software and/or to operate the ABI PRISM 7900HT Sequence
Detection System, a computer must meet the following minimum requirements:
Component
Minimum Requirement
Processor
Intel Pentium II processor, 400 MHz or faster
Memory
256 MB RAM
Hard Drive
Minimum 25 GB available hard disk space
Additional Drives
CD-ROM drive
Operating Systems
Microsoft Windows NT 4.0 with Service Pack 6A
Hard Drive During installation of the 7900HT instrument, the computer hard drive was partitioned
Partitions to create the following logical drives:
Partition
C
Size (GB)
2
Contains
Operating system files
Note Applied Biosystems recommends that you do not install
programs to the C drive. The computer will boot faster if the
C drive contains only the operating system.
D
≥25
♦ SDS 2.0 Software
♦ Automation Controller Software
♦ Additional Third-Party Software
♦ ABI PRISM SDS Plate Document Files
Product Overview 2-7
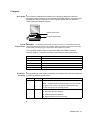
Bar Code Readers
Description The ABI PRISM 7900HT Sequence Detection System incudes two bar code readers
for data entry and plate recognition:
♦
a hand-held bar code reader for scanning plates manually
♦
a fixed-position bar code reader for automated scanning of plates as they are
loaded into the instrument (available with automation accessory only)
Both bar code readers use a 488 nM laser to scan plates and are capable of reading
Code 128 (alpha-numeric), which supports 128 ASCII characters.
Locations of the The following figure illustrates the locations of the bar code readers in the system.
Bar Code Readers
1
Fixed-Position Bar Code Reader
GR2009
2
Hand-Held Bar Code Reader
1
2
Splitter
To computer
keyboard port
To keyboard
GR2015
GR2018
~~
~
~
~
~
(Shown with cover removed)
Using the ! WARNING LASER HAZARD. Exposure to direct or reflected laser light can burn the retina
Bar Code Readers and leave permanent blind spots. Never look into the laser beam. Remove jewelry and anything
else that can reflect the beam into your eyes. Protect others from exposure to the beam.
For directions on...
2-8 Product Overview
See Page
Using the Hand-Held Bar Code Reader
3-19
Aligning the Fixed-Position Bar Code Reader
7-40
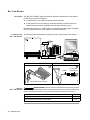
Zymark Twister Microplate Handler
Description The Zymark Twister Microplate Handler coordinates plate handling for the ABI PRISM
7900HT Sequence Detection System permitting 24-hour unattended operation. The
arm features a 310-degree rotational swing that permits access to the 7900HT
instrument drawer, up to five plate stacking areas, and the fixed-position bar code
reader.
To...
See Page
Turn on the Automation Module
3-5
Align the Automation Module
7-27
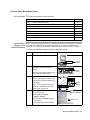
Zymark Twister The plate handler consists of the following components:
Microplate Handler
Components
GR2014a
Adjustment
knob
Gripper
Plate-sensor switch
(cross-sectional view of the gripper)
Plate stack
Expansion stacks
Zymark Twister Microplate Handler
Fixed-position bar code reader
Product Overview 2-9
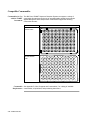
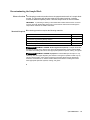
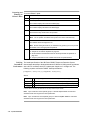
Compatible Consumables
Consumables for Use The ABI PRISM 7900HT Sequence Detection System can support a variety of
with the 7900HT consumable formats through the use of interchangeable sample block modules.
Instrument Applied Biosystems offers sample block modules that support the following
consumable formats:
Consumable
Illustration
GR2107
ABI PRISM™ 384-Well
Reaction Plate
GR2108
ABI PRISM™ Optical
96-Well Reaction
Plate
Consumable See Appendix D, “Kits, Reagents and Consumables,” for a listing of available
Requirements consumables, requirements, and purchasing instructions.
2-10 Product Overview
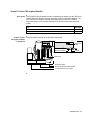
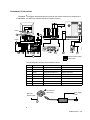
Instrument Connections
Electrical The diagram below illustrates the electrical connections between the components of
Connections the ABI PRISM 7900HT Sequence Detection System.
Power
A
H
HI-POT
A
Power
B
C
D
GR2020
Power
HI-POT
A
B
C
E
A
F
G
B
C
Power
D
E
Power
G
D
C
Communications Cable
Power Cable
The following table lists the communications cables.
Cable
Connects…
To…
Communication
Computer (Monitor Port)
Monitor
Comm/Power
Computer (Mouse Port)
Mouse (not shown)
C
Serial
Computer (Serial Port 1)
7900HT Instrument
D
Comm/Power
Computer (Keyboard Port)
Hand-held Bar Code Reader
E
Communication
Computer (Serial Port 2)
Plate Handler (Port C)
F
Ethernet
Network
Computer (Ethernet Port)
Ga
Comm/Power
Computer (ISA Card 1)
Fixed-Position Bar Code Reader
H
Comm/Power
Bar Code Reader Cable
Keyboard (not shown)
A
B
Type
a. See the figure below.
To Lava Card
(ISA Card 1)
Power supply
Bar Code
Reader Cable
Power
G
GR2067
Product Overview 2-11
2-12 Product Overview
Section: Getting to Know the Software
In This Section This section contains the following information:
Topic
See Page
Sequence Detection System Software Components and Features
2-14
Managing Sequence Detection System Data
2-15
Working with SDS Software Files
2-16
Product Overview 2-13
Sequence Detection System Software Components and Features
Software The ABI PRISM 7900HT Sequence Detection System uses several software
Components applications to set up, run, and analyze experiments completed on the 7900HT
instrument.
Application
Function
SDS Software
♦ Constructs and edits plate document files (*.sds files)
♦ Performs initial and end analysis of raw data from allelic
discrimination and absolute quantification runs
♦ Saves, prints, and exports run data
Automation
Controller Software
♦ Controls and coordinates the action of the 7900HT instrument
and the automation module
♦ Initiates and controls the sequence detection run
♦ Acquires data during the run
Java® Runtime
Environment
It includes additional files and software used to run the SDS
software.
IMPORTANT Do not delete the Java Runtime Environment files.
These files are crucial to the operation of the SDS software. If the
files are deleted or become corrupt, reinstall the SDS software from
the CD as explained on page 7-48.
Zymark Twister
Software
Used to calibrate the Zymark Twister Microplate Handler.
LAVA Software
Used to align the fixed-position bar code reader.
Instrument Firmware
♦ Controls the most basic operations of the 7900HT instrument
♦ Controlled by commands sent from the computer
♦ Acts as the link between the software commands and hardware
operations
2-14 Product Overview
Managing Sequence Detection System Data
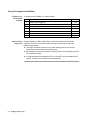
7900HT Instrument Data management strategy is a crucial element of successfully integrating the
Dataflow ABI PRISM 7900HT Sequence Detection System into a laboratory workflow. During a
single 24-hour period of real-time operation, the 7900HT instrument can produce up to
200 MB of data. To manage the information produced by the 7900HT instrument
successfully, it helps to have a basic understanding of how data is collected and
processed prior to analysis.
The figure below contains a summary of the 7900HT instrument data flow.
ABI PRISM 7900HT Sequence Detection System
Instrument Firmware
Thermal Cycling and
Sequence Detection
Data Collection
Serial
Cable
Computer
Automation Controller/
SDS Software
♦ SDS files added to and
run from the plate queue
Raw data saved to
SDS files
♦ SDS file run individually
Hard drive
*.sds
*.sds
files
files
SDS Software
Plate document
creation
Data analysis
Downstream application
specific analysis
Product Overview 2-15
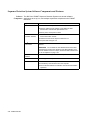
Working with SDS Software Files
Files Used and IMPORTANT Never move or delete a SDS software file or folder unless specifically directed to
Created by the do so by an Applied Biosystems representative or documentation.
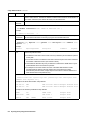
SDS Software The SDS software includes many different files and folders. Some of these are
created to store run data and calibration data, others are required to run the software.
File Type
Extension
Description
Plate Document Files
ABI PRISM SDS
Single Plate
*.sds
A plate document is a virtual representation of a
consumable (plate) used to contain samples and reagents
during an sequence detection run. During the run, the
software uses the plate document to coordinate the
operation of the instrument (thermal cycling, data
collection), to organize and store the data gathered during
the PCR, and to store the results of the downstream
analysis of the run data.
ABI PRISM SDS
Template File
*.sdt
Templates contain can be used to create an unlimited
number of plate documents. Templates are optional but
useful as a time-saving devices for experiments where
samples are run on plates with identical assay
configurations.
Imported/Exported Files
Tab-delimited
text file
*.txt
The SDS software can export raw or analyzed data in
tab-delimited (*.txt) format for all or a select group of wells
on a plate document. The exported files are compatible with
most spreadsheet applications.
JPEGa graphic
files
*.jpg
The SDS software can export most panes and plots of the
plate document as JPEG graphic files. The JPEG format is
compatible with most word processing and spreadsheet
applications and can be incorporated directly into HTML
documents for viewing by most web browser software.
a. Joint Photographic Experts Group
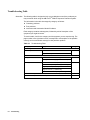
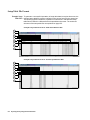
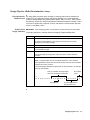
Average SDS Plate The SDS software can produce SDS files of varying sizes depending on the type of
Document File Size runs for which they are created. The table below lists the average sizes of typical files
produced by the SDS software.
Compressed File Sizea
Run Type
Average File Size
Plate-read
150–180 KB
70–90 KB
Real-timeb
15–25 MB
10–15 MB
a. Compressed files sizes shown are estimates based on standard compression using the WinZip® utility.
For more information, see “Archiving SDS Files” on page 7-46.
b. The maximum file sizes displayed above are nominal for real-time runs (absolute quantification). File size
can increase depending on the plate document’s data collection options.
2-16 Product Overview
Getting Started
3
3
In This Chapter This chapter discusses the following topics:
Topic
See Page
Getting Started
3-2
About This Manual
3-3
Turning on the ABI Prism 7900HT Sequence Detection System
3-5
Using the SDS Software Workspace
3-7
Basic Software Skills Tutorial
3-11
Using SDS Plate Documents
3-21
Getting Started 3-1
Getting Started
Before You Begin If this is your first time using the ABI PRISM® 7900HT Sequence Detection System,
consider completing the “Basic Software Skills Tutorial” on page 3-11 before
continuing. The tutorial will provide you with the fundamental knowledge required to
operate the SDS software and will teach you time-saving techniques to allow you to
use it quickly and efficiently.
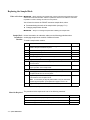
Procedure The following table contains a list of major procedures described within this manual.
Quick Reference
Procedure
Turning on the ABI PRISM 7900HT Sequence Detection System
See Page
3-5
Setting Up and Running SDS Experiments
Creating an SDS plate document
4-6
Running an individual SDS plate document
4-21
Running batches of SDS plate documents (using the automation accessory)
4-29
Stopping a run in progress
♦ From the SDS software
4-26
♦ From the Automation Controller Software
4-38
Ejecting a plate
♦ From the SDS software
4-27
♦ From the Automation Controller Software
4-38
Analyzing Run Data
Analyzing an allelic discrimination run
5-3
Analyzing an absolute quantification run
6-3
Analyzing a dissociation curve (melting curve) run
6-17
Maintaining the 7900HT Instrument
Changing the 7900HT Plate Adapter
7-9
Replacing the Sample Block
7-4
Decontaminating the Sample Block
7-11
Performing a Background Run
7-13
Performing a Pure Dye Run
7-17
Adding Custom Dyes to the Pure Dye Set
7-21
Verifying Instrument Performance Using a TaqMan RNase P Plate
7-24
Maintaining the Automation Accessorya
Adjusting the Sensitivity of the Plate Sensor Switch
7-28
Aligning the Plate Handler
7-32
Aligning the Fixed-Position Bar Code Reader
7-40
Cleaning and Replacing Gripper Finger Pads
7-43
a. The automation accessory includes the Zymark® Twister™ Microplate Handler and the fixed-position bar
code reader. See “Instrument Components” on page 2-3 for more information.
3-2 Getting Started
Using the SDS The SDS software features an online help system that can guide you through the
Software procedures for setting up, performing, and analyzing runs. To get help at any time,
Online Help click a Help button located within the dialog box or window in which you are working.
The SDS software provides two ways to access the online help as follows:
To…
Then…
access general help
select SDS Online Help from the Help menu.
get help for using a specific
dialog box, plot, or feature
click a help button ( ) located within the dialog box or
window in which you are working.
For More For information about the ABI PRISM 7900HT Sequence Detection System or the SDS
Information software, Applied Biosystems recommends the following references:
Title
P/N
ABI PRISM 7900HT Sequence Detection System Site Preparation and Safety Guide
4317595
ABI PRISM 7900HT Sequence Detection System Software Online Help
—
Microsoft Windows Operating System Online Help
—
About This Manual
Intended Audience This guide is written for technicians, scientists, and researchers who will use
ABI PRISM 7900HT Sequence Detection System (SDS) instruments.
Background Needed This manual assumes that you are familiar with the following:
♦
Basic Microsoft® Windows® operations such as using the mouse, choosing
commands, working with windows, and using the hierarchical file system
♦
A general understanding of electronic storage devices and data files
♦
An understanding of assay preparation and basic laboratory techniques
Computer To use the ABI PRISM 7900HT Sequence Detection System, you should be familiar
Vocabulary and with the following basic computer vocabulary and operations:
Operations
Vocabulary and Operations
Description
Using the mouse
Clicking and double-clicking, selecting, and dragging.
Choosing commands
Using menus and drop-down lists, dialog boxes, radio
buttons, and check boxes.
Working with windows
Opening and closing, resizing and repositioning,
scrolling, understanding the active window.
Using the Microsoft Windows
hierarchical file system
Finding files and creating folders.
Getting Started 3-3
Conventions Used in This manual uses the following conventions to convey information:
This Manual
Convention
>
Bold text
Definition
Examples
This symbol is used to convey a
command or directory path in
the Windows operating system.
♦ From the Start menu, select
Programs > SDS 2.0 > SDS 2.0.
Bold text appearing with
procedures corresponds to the
text as it appears on the screen.
♦ From the File menu, select Save.
♦ Navigate to the Program Files >
Applied Biosystems > SDS 2.0 >
Templates directory.
♦ The Detector Manager dialog box opens.
How This Manual is This manual contains the following chapters and supporting appendices:
Organized
3-4 Getting Started
Chapter/Appendix
Content
1
Safety
Explains information on ABI PRISM 7900HT Sequence
Detection System safety
2
Product Overview
Describes the components of the ABI PRISM 7900HT
Sequence Detection System and its software
3
Getting Started
Introduces and explains how to use this manual and the
SDS software
4
Run Setup and
Basic Operation
Explains how to create and run plate documents on the
ABI PRISM 7900HT Sequence Detection System
5
End-Point Analysis
Describes how to analyze data from allelic
discrimination experiments
6
Real-Time Analysis
Describes how to analyze data from absolute
quantification and dissociation curve experiments
7
System Maintenance
Explains how to perform both routine and incidental
system maintenance for the components of the
ABI PRISM 7900HT Sequence Detection System
8
Troubleshooting
Contains tips for troubleshooting problems with the
ABI PRISM 7900HT Sequence Detection System
9
User Bulletins
This chapter is reserved for user bulletins
A
Theory of Operation
Describes the principles behind the operation of the
ABI PRISM 7900HT Sequence Detection System
B
Importing and Exporting
Plate Document Data
Explains the Import/Export function of the SDS software
and also diagrams the structure and annotation of setup
table files
C
Designing TaqMan Assays
Contains brief instructions for designing TaqMan probe
and Sequence Detection primer sets
D
Kits, Reagents and
Consumables
Contains a list of Applied Biosystems kits and
consumables for use with the 7900HT instrument
E
References
Contains a bibliography of references for this manual
F
Contacting Technical Support
How to contact Applied Biosystems Technical Support
G
Limited Warranty Statement
The Applied Biosystems limited warranty statement
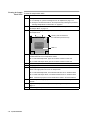
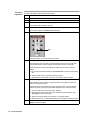
Turning on the ABI PRISM 7900HT Sequence Detection System
Turning On the The activation of the ABI PRISM 7900HT Sequence Detection System is sequential,
7900HT Instrument each component must be activated in a specific order for the system to initialize
properly. If performed out of sequence, the components may not be able to establish
the necessary communication connections.
Monitor
power button
GR2009
Status lights
7900HT instrument
power button
Computer
power button
Zymark Twister Microplate
Handler (power button in the rear)
IMPORTANT Turn on the power to the instrument and the plate handler at least 10 min before
use. When activated, the instrument heats the sample block cover to 105 °C. If a run is started
before the heated cover reaches 105 °C, the instrument will pause until it reaches the optimal
temperature before commencing the run.
To activate the components of the ABI PRISM 7900HT Sequence Detection System:
Step
Action
1
Turn on the monitor and computer.
2
Turn on the Zymark Twister Microplate Handler by pressing the power switch
located on the back panel of the plate handler (see below).
! CAUTION PHYSICAL HAZARD. Keep clear of the arm when activating the
plate handler. Once activated, the arm automatically moves to its home position.
Power switch
HI-POT
B
C
D
GR1728
A
Rear Panel of the Twister
If operating normally, the plate handler moves the arm to the home position (over
the output stack).
3
Turn on the 7900HT instrument by pressing the power button located below the
status lights on the front of the instrument (see the figure at the top of the page).
If operating normally, the 7900HT instrument will do the following on startup:
♦ Emit a high-pitched tone signalling that system has been initialized.
♦ Cycle the status lights (Red > Orange > Green) indicating that the 7900HT
instrument is active (see “Reading the Instrument Status Lights” on page 3-6 for
more information).
Getting Started 3-5
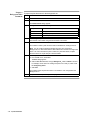
Reading the The 7900HT instrument contains three lights located on the lower-left side of the front
Instrument panel to indicate the status of the instrument.
Status Lights
Red
Orange
Green
Status lights
Power button
GR2010
Light/Appearance
Status
Action
Green
Solid
The 7900HT instrument is on
and in idle state (ready to run)
None
Flashing
♦ Interlocks are open and/or
the scan head has not
reached the safe position.
This state indicates normal
instrument function.
♦ The instrument door is
open.
Orange
Flashing
Solid
The 7900HT instrument is
transmitting/receiving data
to/from the computer
(usually during a run).
None
If the light remains on during
startup for more than 2 min:
a. Check that the computer is
turned on and connected to the
instrument. (See page 2-11 for a
diagram of instrument
connections.)
♦ The instrument did not boot
properly, or
Red
3-6 Getting Started
Solid
This state indicates normal
instrument function.
♦ 7900HT instrument has
experienced a system
failure
b. If so, turn off the instrument, wait
for 30 sec, and then restart as
explained on page 3-5.
The 7900HT instrument has
detected a fatal problem.
Turn off the instrument, wait for
30 sec, and then restart.
Using the SDS Software Workspace
Launching the To launch the SDS software, either:
Software ♦ Select Start > Programs > SDS 2.0 > SDS 2.0, or
♦
Double-click the SDS software program icon on the desktop.
Select SDS 2.0, or
Double- click
The computer launches the SDS software and attempts to establish communication
with the 7900HT instrument. If the connection is successful, the software displays the
Connected icon (
) in the status bar when a plate document is open.
See “About the Status Bar” on page 3-10 for more information.
Getting Started 3-7
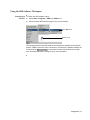
About the All software operations and displayed information occur within the workspace of the
Software Interface SDS software. The workspace provides quick access to all elements of the software
through the menubar and a pair of toolbars. The following figure summarizes the
features of the user interface of the SDS software.
1
2
3
4
6
5
The following table describes the elements of the workspace:
Number
Component
Description
1
Menubar
Contains a directory of menus that govern the operation of
the software.
2
General Toolbar
Contains clickable icons for controlling the basic functions of
the software (file management and basic editorial).
3
Display Toolbar
Contains clickable icons for controlling the display of
information within the SDS software workspace.
4
Workspace
Contains all plate documents, dialog boxes, and message
boxes used by the SDS software.
5
Message Bar
Displays a variety of messages to indicate the status of the
instrument.
Note See “About the Status Bar” on page 3-10 for a
complete description of the message bar.
6
Instrument
Connection Icon
Indicates the status of the connection to the 7900HT
instrument.
Note See “About the Status Bar” on page 3-10 for a
complete description of the instrument connection icon.
3-8 Getting Started
Using the General The following table describes the icons located within the General Toolbar:
Toolbar
Icon
Function
Creates a new plate document
Opens an existing plate document
Saves the current plate document
Imports data from a text file
Exports data to a tab-delimited text file
Opens the SDS software Find utility
Removes the selected object and places it into memory
Copies the selected object into memory
Inserts a cut object into the current selection
Analyzes the current plate document
Opens the Analysis Options dialog box for the current plate document
Using the Display The following table describes the icons located within the Display Toolbar:
Toolbar
Icon
Function
Hides or shows the Well Inspector Panel
Hides or shows the Plate Grid
Hides or shows the Table View
Hides or shows the System Raw Data Plot
Hides or shows the Multicomponent Plot
Hides or shows the Amplification Plot
Hides or shows the Standard Curve Plot
Hides or shows the Dissociation Plot
Zooms the plate grid in or out
Opens the Display Settings dialog box used to modify the appearance of the plate
document plate grid, plots, and views
Getting Started 3-9
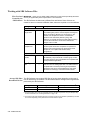
About the Status Bar The status bar consists of two components: a message bar for indicating the status of
software functions and a instrument status icon for indicating the status of the
instrument.
About the Message Bar
The message bar displays a variety of messages to indicate the status of the
instrument. The following table summarizes all of the messages displayed in the
Message bar.
Message
Then the SDS software is…
Ready
ready and awaiting instructions.
Collecting Data
currently running a plate document.
Reanalyze data
requesting analysis of plate document data.
The Analysis Options for the plate document have been
changed and the document requires reanalysis for them
to take effect.
Analyzing data... + Progress bar
completing the calculations for the current analysis.
The metered bar to the right of the message displays the
progress of the analysis.
Saving data... + Progress bar
saving the plate document or template to a storage
device.
The metered bar to the right of the message displays the
progress of the action.
importing a file.
Importing data...
The metered bar to the right of the message displays the
progress of the action.
Exporting data... + Progress bar
exporting the data within the current plate document to a
file.
The metered bar to the right of the message displays the
progress of the action.
About the Instrument Status Icon
Indicates the status of the connection to the 7900HT instrument.
Icon
Instrument Status
Connected and awaiting a command
Not connected or turned off
3-10 Getting Started
Basic Software Skills Tutorial
About This Tutorial This tutorial will:
♦
Teach you to create, save, print, export, and import SDS plate documents
♦
Familiarize you with the basic components of the SDS software interface
♦
Explain how to customize and arrange the user interface to suit your needs
♦
Teach you to use the hand-held bar code reader
♦
Provide you with time-saving devices to increase your effectiveness on the SDS
software
Using the Online Version of the Basic Skills Tutorial
The SDS Online Help features a version of this tutorial. If you prefer to follow the
online tutorial open the SDS Online Help as follows:
Step
1
Action
If not already active, launch the SDS software as explained on page 3-7.
The SDS software workspace appears.
2
From the Help menu, select SDS Online Help.
3
When the SDS Online Help appears, select Basic Skills Tutorial from the list of
options.
4
Follow the directions displayed on your screen.
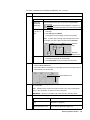
Lesson 1: Using Every plate run on the ABI PRISM 7900HT Sequence Detection System requires the
Plate Documents creation of a plate document within the SDS software. A plate document is a virtual
representation of a consumable used to contain samples and reagents during a
sequence detection run. The software uses the plate document to coordinate the
operation of the instrument (thermal cycling and data collection), to organize and store
the data gathered during the PCR, and to analyze the run data.
The SDS software can produce the two types of plate document files described in the
table below.
Plate Document File
Extension
Description
ABI PRISM SDS
Single Plate
*.sds
SDS Single Plate Documents are the primary file you
will use. They are generated for every kind of
experiment and are generally used to run plates.
ABI PRISM SDS
Template Document
*.sdt
Although optional, templates are useful as
time-saving devices for experiments where samples
are run on plates with identical assay configurations.
The exercises on the following pages will familiarize you with the use of SDS plate
documents.
Getting Started 3-11
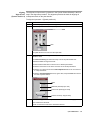
Exercise 1: Creating a Plate Document
You will need to create a plate document for every plate you run on the 7900HT
instrument. The following procedure explains how to create a plate document using
the SDS software.
To create a plate document:
Step
1
Action
If not already active, launch the SDS software as explained on page 3-7.
The SDS software workspace appears.
2
Choose one of the following options:
♦ Click the New Document button (
) from the General toolbar, or
♦ From the File menu, select New.
The New Document dialog appears.
IMPORTANT The SDS software can handle multiple documents simultaneously,
however the processing speed of your computer will decrease with each open
document. For that reason, Applied Biosystems recommends limiting the number of
open documents to 10.
3
4
Configure the New Document dialog box with the following settings:
Drop-Down List
Select…
Assay
Absolute Quantification
Container
384 Wells Clear Plate
Template
Blank Template
Click OK.
The software displays a new plate document with appropriate attributes.
Exercise 2: Saving a Plate Document
The Save command stores any changes to the plate document setup information and
display settings. The following procedure explains how to save the open plate
document.
To save the plate document:
Step
1
Action
Choose one of the following options:
♦ Click the Save button (
) from the General toolbar, or
♦ From the File menu, select Save As.
2
From the File of type drop-down list, select ABI PRISM SDS Single Plate (*.sds).
3
Click the File name text field, and type Practice.
4
Click Save.
The software saves the plate document to a file entitled Practice.sds.
Note
3-12 Getting Started
Do not close the plate document at this time.
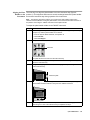
Exercise 3: Opening a Plate Document
In this exercise you will be opening a template file that you will use in the following
exercises.
To open a plate document:
Step
1
Action
Choose one of the following options:
♦ Click the Open button (
) from the General toolbar, or
♦ From the File menu, select Open.
2
From the Look In text field of the Open dialog box, navigate to Program Files >
Applied Biosystems > SDS 2.0 > Templates.
3
From the File of type drop-down list, select ABI PRISM SDS Template Document
(*.sdt).
4
From the Look In text field, click the file entitled ‘384 Well RNaseP Install Plate.sdt’ to
select it.
5
Click Open.
The software opens the plate document file.
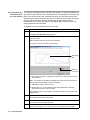
Exercise 4: Exporting Data from a Plate Document
In the following exercise, you will export the plate setup so that you can import it (see
Exercise 6). The SDS software allows you to export several components of the plate
document as tab-delimited text files, a format compatible with most spreadsheet
applications.
Note For more information on exporting setup table data using the SDS software, see
Appendix B, “Importing and Exporting Plate Document Data.”
To export the contents of the template to a setup table file:
Step
1
Action
Choose one of the following options:
♦ Click the Export button (
) from the General toolbar, or
♦ From the File menu, select Export.
2
From the Export drop-down list of the Export dialog box, select Setup Table.
3
Select the All Wells radio button.
4
Click the File name text field, and type Practice.
5
Click Export.
The software saves the plate document setup table information to a tab-delimited
text file entitled ‘Practice.txt’.
Note The software also can export the data from most of the analysis plots,
graphs, and tables. See Appendix B, “Importing and Exporting Plate Document
Data,” for more information.
Getting Started 3-13
Exercise 5: Closing a Plate Document
When finished viewing or editing a plate document, you will need to close it. If the
plate document has been altered since last saving it, the software will prompt you to
save the document. In the following procedure, you will close the template document
opened in Exercise 3.
To close a plate document:
Step
Action
1
From the File menu, select Close.
2
If prompted to save the plate document, click No.
The SDS software closes the file without saving it.
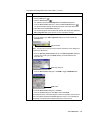
Exercise 6: Importing Setup Table Data into a Plate Document
As a time-saving device, the SDS software allows you to import a setup table
information into a plate document from an exported tab-delimited text file. To illustrate
this feature, import the plate grid setup information contained in the Practice.txt file
(from Exercise 4) into the empty plate document created in Exercise 1.
To import a setup table file into an empty plate document:
Step
1
Action
If the plate document from Exercise 1 is still open, go to step 2. Otherwise, create a
new plate document to receive the setup table data as follows:
a. From the File menu, select New.
b. Configure the New Document dialog box with settings for the new template.
Drop-Down List
Select…
Assay
Absolute Quantification
Container
384 Wells Clear Plate
Template
Blank Template
c. Click OK.
The software displays a new plate document with appropriate attributes.
2
Choose one of the following options:
♦ Click the Import button (
) from the General toolbar, or
♦ From the File menu, select Import.
3
From the Look In text field of the Import dialog box, select the Practice.txt file
created in Exercise 4.
4
Click Import.
The software imports the setup information of the Practice.txt file into the plate grid
and table of the empty plate document.
Note For more information on importing and exporting setup table data using the
SDS software, see Appendix B, “Importing and Exporting Plate Document Data.”
3-14 Getting Started
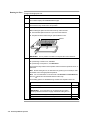
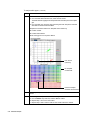
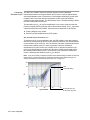
Lesson 2: Viewing Because plate documents can display setup and analysis data in multiple views
and Resizing Panes simultaneously, the SDS software has been designed with several navigational
devices to help manage the information. This lesson will teach you to use the different
aids to reduce screen clutter and ensure efficient use of the software.
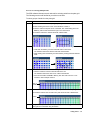
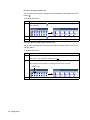
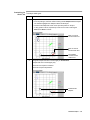
Exercise 1: Resizing Panes, Views, and Plots
You can resize the panes, views, and plots of plate documents by moving the grey
lines dividing them horizontally and vertically.
To illustrate the this feature, resize the plate grid pane horizontally as follows:
Step
1
Action
Click and drag the grey line dividing the plate grid and well inspector to the right.
The software expands the plate grid and table pane to the new width.
Dividing line (click and drag)
2
Using the grey dividing lines, resize other elements of the plate document until
comfortable using the feature.
Exercise 2: Maximizing/Minimizing Panes, Views, and Plots
You can maximize the panes, views, and plots of plate documents by clicking the
sizing buttons embedded within the grey dividing lines.
Note Sizing buttons are the arrow-head marks (
) that appear between adjacent
elements of the plate document. When clicked, a sizing button hides the element to which it
points.
To illustrate the maximize/minimize feature, maximize the plate grid as follows:
Step
1
Action
Click the down-arrow sizing button ( ) in the divider between the plate grid and the
table pane to maximize the plate grid vertically.
The software maximizes the plate grid by minimizing the table pane.
Sizing
button
2
Click and drag the grey divider at the bottom of the plate document to restore the
table pane to its original size (using the action described in Exercise 1 above).
3
Using the sizing buttons, maximize/minimize other elements of the plate document
until comfortable using the feature.
Getting Started 3-15
Exercise 3: Hiding and Showing Panes, Views, and Plots
You can also toggle the presence of the plate document panes, views, and plots using
the icons in the Display toolbar.
To illustrate this feature, hide and show the table pane as follows:
Step
1
Action
From the Display toolbar, click the Show/Hide Table Pane button (
).
The software removes the table pane from the plate document.
2
Click the Show/Hide Table Pane button (
) again to show the table pane.
The software restores the table pane to the plate document.
The display toolbar can be particularly useful for manipulating information shown in
the plate document. See “Using the Display Toolbar” on page 3-9 for a list of the
other icons of the display toolbar and the panes they control.
3
Practice hiding and showing the other plate document elements by clicking other
buttons in the Display toolbar until comfortable using the feature.
Lesson 3: Using the The plate grid (see below) is an important interface tool for the SDS software. The
Plate Grid software uses the grid to convey information about the plate and allows you to select
specific wells for viewing and analysis. The following exercises will teach you how to
use and modify the elements of the plate grid.
Plate grid
Exercise 1: Viewing Well Information
The SDS software provides two methods for viewing the information associated with a
well or wells of the plate document.
To view the information for a well of the plate document, do one of the following:
3-16 Getting Started
Action
Result
Click any well in the plate grid
to select it.
When selected, the software outlines the well in black and
displays the associated information in the well inspector of
the Setup tab.
Move the mouse pointer over
any well of the plate grid.
After holding position, the software displays the
information for the well in a yellow pop-up window.
Exercise 2: Selecting Multiple Wells
The SDS software features several methods for selecting wells from the plate grid.
The following exercise will familiarize you with most of them.
To select groups of wells from the plate grid:
Step
1
Action
Select a block of wells from the plate grid by doing one of the following:
♦ Click and drag the mouse cursor across the block of wells, or
♦ Click the well at the top-left corner of the block, then while holding-down the
Shift key, click the well at the bottom-right corner of the block.
The software outlines the selected wells with a black border.
2
Select several isolated wells of the plate grid by doing of the following:
a. Hold-down the Ctrl key, and click individual wells to select them.
The software outlines the selected wells with a black border.
b. While holding down the Ctrl key, de-select wells by clicking individual selected
wells.
3
Select an entire column or row of wells using the headers as follows:
a. Click the header for row A to select all wells in the row.
The software outlines the wells of row A with a black border.
b. Press and hold either the Shift or Ctrl key, then click other columns or row
headers to select multiple columns.
Row A
header
4
Select all wells of the plate grid by clicking the top-left corner of the plate grid.
The software outlines all of the wells in the plate document with a black border.
Button
5
Using the techniques illustrated in steps 1 to 4, practice selecting portions of the
plate grid until comfortable using the feature.
Getting Started 3-17
Exercise 3: Zooming the Plate Grid
You can zoom the plate grid to display the well information by clicking the Zoom Grid
button ( ).
To illustrate this feature:
Step
Action
1
Click the Zoom Grid button (
well information.
) and observe how the grid expands to display the
2
Click the Zoom Grid button (
) again to restore the plate grid to the original size.
3
Practice zooming portions of the plate grid until comfortable using the feature.
Exercise 4: Resizing Wells Using the Border Lines
You can also adjust the size of the plate grid wells by moving the lines in the row or
column headers.
To illustrate this feature:
Step
1
Action
Move the mouse cursor over a border line in the row or column header.
The mouse cursor becomes a double arrow (
2
).
Click and drag the mouse cursor to adjust the well to a new width.
The software resizes all wells in the plate grid to match the new width.
Mouse cursor
3
3-18 Getting Started
Practice resizing the wells of the plate grid until comfortable using the feature.
Lesson 4: Using The hand-held bar code reader functions as an extension of the keyboard and can be
the Hand-Held used to automatically type bar codes into the SDS software. When the reader is used
Bar Code Reader successfully to scan a bar code, it automatically:
♦
transmits the alpha-numeric equivalent of the bar code to the software. The
software types the bar code text wherever the cursor is active.
♦
transmits a carriage-return (the equivalent of pressing the Enter key).
Exercise: Entering Bar Code Information Using the Hand-Held Bar Code Reader
Note The following procedure explains how to enter the bar code number into the plate
document from the Document Information dialog box. You can also scan the bar code into the
New Document dialog box during plate document creation.
To enter a bar code number using the hand-held bar code reader:
Step
1
Action
From the Tools menu, select Document Information.
The Document Information dialog box appears.
2
Click the Barcode text field.
Click here
The software places the blinking cursor in the text field.
3
While holding the hand-held bar code reader 20 to 30 cm away from a plate, aim at
the center of the bar code and press the trigger. The scanner emits a sweeping
laser beam that appears as a red line on the plate. Slowly move the scanning beam
slowly across the bar code until the scan gun emits a high-pitched tone
acknowledging that it has read the code.
! WARNING LASER HAZARD. Exposure to direct or reflected laser light can
burn the retina and leave permanent blind spots. Never look into the laser beam.
Remove jewelry and anything else that can reflect the beam into your eyes. Protect
others from exposure to the beam.
PECY001DL3
GR2110
20-30 cm
Once the gun has read the bar code, the software automatically populates the
selected text field with the alpha-numeric equivalent of the bar code.
4
Click OK to close the Document Information dialog box.
Getting Started 3-19
Lesson 5: Using The SDS software features contextual menus as a time-saving devices that provide
Contextual Menus access to the commands for an associated view or pane.
To access a contextual menu, move the mouse pointer over a pane or view of interest
and click the right mouse button. The menu appears at the location of the pointer.
Contextual menu
All contextual menus provide the following common commands:
Command
Result
See Page
Hide <pane or plot>
Hides the pane or view.
3-16
Save <pane or plot>
to Image File
Opens the Export Graphic dialog box for exporting the
selected view or pane as a JPEG graphic file.
B-8
Display Settings
Opens the display settings dialog box that allows you
to modify the appearance of the view, pane, or plot.
4-17
Lesson 6: Using The SDS software features keyboard shortcuts for invoking the major functions of the
Keyboard Shortcuts software.
Exercise: Closing the Plate Document
To illustrate the use of a keyboard shortcut, close the plate document as follows:
Step
Action
1
Simultaneously press the Ctrl and W keys (Ctrl+W).
2
When prompted to save the plate document, click No.
Note The SDS software online help contains a complete list of the keyboard shortcuts for the
SDS software. To view the list, open the online help as explained below.
Lesson 7: Using the The SDS software features an online help system that can guide you through the
SDS Software procedures for setting up, performing, and analyzing runs. To get help at any time,
Online Help click a Help button located within the dialog box or window in which you are working.
The SDS software provides two ways to access the online help as follows:
s
3-20 Getting Started
To…
Then…
access general help
select SDS Online Help from the Help menu.
get help for using a specific
dialog box, plot, or feature
click a help button ( ) located within the dialog box or
window in which you are working.
Using SDS Plate Documents
Using Multiple The SDS software can handle multiple documents simultaneously, however the
Plate Documents processing speed of the computer will decrease with each open document. For that
reason, Applied Biosystems recommends limiting the number of open documents to 10.
Elements of a This section will familiarize you with the elements of plate documents. The figure
Plate Document below illustrates a typical plate document. The following pages describe its
components.
Plate grid
Tabbed pages
Well inspector
Table pane
Plate Grid Each plate document consists of a grid that corresponds to the wells of a reaction
device. The grid displays well information depending on the type of plate document.
The information displayed within the cells of the grid are determined by the Plate Grid
properties settings located within the Display Settings dialog box.
Note For more information on configuring the display settings for the plate grid, click a help
button ( ).
Table Pane The table pane displays the setup and analysis properties for the plate document in a
tabular format. The table pane can be exported as a tab-delimited text file for use by a
spreadsheet application (see Appendix B, “Importing and Exporting Plate Document
Data,” for more information).
Getting Started 3-21
Tabbed Pages Plate documents can contain up to six tabbed pages depending on their function:
Tab
Used to...
Setup
display well information, and to configure the plate grid with setup information.
Instrument
program the plate document method, and to run the plate document or send
it to the Plate Queue.
Raw Data
display the raw fluorescence collected from the sequence detection run.
Calibration
Data
display the Background and Pure Spectra calibration data used for the signal
normalization and multicomponenting analysis of the current run.
Results
display analyzed run data. The Analysis tab is visible only in plate documents
containing analyzed run data.
Dissociation
Curve
display analyzed dissociation curve data from a programmed ramp. The
Dissociation Curve tab is visible only in plate documents containing analyzed
data from a real-time run with a programmed ramp.
Well Inspector The Well Inspector is used to apply detector and sample information to the wells
within the grid pane and to display information from the selected cells in the plate grid.
Sample name text field
Detector list
Passive Reference drop-down list
In Use check box
Component
Description
Sample name
text field
An editable text field that displays the sample name applied to the
selected well(s)
Note The Sample name text field will display *Mixed* if multiple
wells with different sample names are selected.
Detector list
Lists all available detectors copied to the plate document
In Use check box
Toggles the activity of the well. If unchecked, the software eliminates
the data from the selected well from all analysis procedures.
Passive Reference
Displays the fluorescent dye used as a passive reference
drop-down list
Marker Inspector
Used only for allelic discrimination runs, the Marker Inspector (shown below) appears
as the lower half of the Well Inspector and displays all markers available for the plate.
Marker inspector
3-22 Getting Started
Run Setup and
Basic Operation
4
4
In This Chapter This chapter discusses the following topics:
Topic
See Page
Before You Begin
4-2
Setup Checklists
4-3
Section: Plate Document Setup
4-5
Step 1 – Creating a Plate Document
4-6
Step 2 – Applying Detectors and Markers to the Plate Document
4-7
Step 3 – Configuring the Plate Document with Detector Tasks
4-11
Step 4 – Programming the Plate Document Method
4-13
Step 5 – Saving the Plate Document as a Template
4-17
Step 6 – Creating a Plate Document from the Template
4-18
Step 7 – Applying Sample and Plate Information
4-19
Step 8 – Running the Plate on the 7900HT Instrument
4-20
Section: Running an Individual Plate
4-21
Saving the Plate Document
4-22
Preparing and Running a Single Plate
4-23
Operating the 7900HT Instrument Using the SDS Software
4-25
After the Run
4-27
Section: Running Multiple Plates Using the Automation Controller
4-29
Adding Plate Documents to the Plate Queue for Automated Operation
4-30
Adding a Plate Document to the Plate Queue from the SDS Software
4-31
Creating Plate Documents Using the Template Batch Utility
4-32
Running Plates Using the Automation Controller Software
4-34
Loading Plates onto the Automation Module
4-36
Operating the 7900HT Instrument Using the Automation Controller Software
4-38
After the Run
4-38
Run Setup and Basic Operation 4-1
Before You Begin
Background Chapters 5 and 6 include brief discussions of the experiments that can be performed
Information using the 7900HT instrument. Before beginning, you may want to review the
appropriate chapter for your experiment:
Run Type
Experiment
See Page
End-point
Allelic Discrimination
5-3
Real-time
Absolute Quantification
6-3
Dissociation Curve Analysis
6-17
Getting More The SDS software features an online help system that can guide you through the
Information from procedures for setting up, performing, and analyzing runs. To get help at any time,
button located within the dialog box or window in which you are working.
the Online Help click the
Maximizing For end-point applications such as allelic discrimination, the throughput of the
Throughput for ABI PRISM® 7900HT Sequence Detection System can be increased by dividing the
End-Point Runs workload between the 7900HT instrument and several thermal cyclers. Unlike
real-time runs, the 7900HT instrument collects data for end-point runs after the
completion of the PCR. Consequently, the thermal cycling of end-point plates can be
done elsewhere and then transferred to the 7900HT instrument afterwards for data
collection and analysis.
IMPORTANT To perform the thermal cycling and the plate read using the 7900HT instrument,
run the plate first as a real-time plate document and then again as an allelic discrimination plate
document (see “Step 4 – Programming the Plate Document Method” on page 4-13 for the
procedure).
4-2 Run Setup and Basic Operation
Setup Checklists
Experiments/Runs See the appropriate page for the type of experiment or run you want to perform:
Performed on the
See Page
7900HT Instrument Experiment/Run
Absolute Quantification
4-3
Allelic Discrimination
4-4
Background
7-13
Dissociation Curve (Melting Curve)
4-4
Pure Dye (Spectral Calibration)
7-17
RNase P Instrument Performance Verification
7-24
Absolute To create and set up a plate document for an absolute quantification run:
Quantification
Checklist Done Step Description
See Page
1
Create an absolute quantification plate document.
4-6
2a
a. Create detectors for the absolute quantification probes.
4-7
b. Copy the detectors to the plate document.
4-8
a. Configure the plate document with detector tasks
(NTC, Standard, and Unknown).
4-11
b. Assign quantities to the wells of the plate document that
contain standards.
4-12
3a
4
5
a. Program the method for the absolute quantification run.
4-13
b. If performing an assay in which you would like to collect
dissociation data, add a temperature ramp to the thermal
profile to perform a dissociation curve analysis.
4-16
Choose from the following:
If running…
Then…
a single plate
continue to step 7.
the first plate in a series
of plates with identical
assay configurations
Save the plate document as an ABI PRISM
SDS Template Document as explained on
page 4-17.
6
Create a plate document from the template created in
step 5.
4-18
7
Configure the document with sample names and plate
information.
4-19
8
Prepare and run the absolute quantification plate or plates.
4-20
9
Analyze the run data.
6-3
a. Steps 2 and 3 can be eliminated by importing the plate document setup information from a tab-delimited
text file. See “Importing Plate Document Setup Table Files” on page B-2 for more information.
Run Setup and Basic Operation 4-3
Allelic To create and set up a plate document for an allelic discrimination run:
Discrimination
Checklist Done Step Description
See Page
1
Create an allelic discrimination plate document.
4-6
2a
a. Create detectors for the allelic discrimination probes.
4-7
b. Create a marker for each allelic discrimination probe
pairing.
4-9
c. Copy the marker(s) to the plate document.
4-10
3a
Assign detector tasks to the wells of the plate document
(NTC and Unknown).
4-11
4
If you would like to perform thermal cycling of the allelic
discrimination plate on the 7900HT instrument, create a
real-time plate document for the plate and program it with the
the method for the allelic discrimination run. Otherwise,
continue to step 5.
4-13
5
Choose from the following:
If running…
Then…
a single plate
continue to step 7.
the first plate in a series
of plates with identical
assay configurations
Save the plate document as an ABI PRISM
SDS Template Document as explained on
page 4-17.
6
Create a plate document from the template created in step 5.
4-18
7
Configure the document with sample names and plate
information.
4-19
8
a. Prepare the allelic discrimination plate or plates and
perform thermal cycling on a designated thermal cycler.
4-20
b. Run the allelic discrimination plate or plates on the
7900HT instrument.
9
Analyze the run data.
5-3
a. Steps 2 and 3 can be eliminated by importing the plate document setup information from a tab-delimited
text file. See “Importing Plate Document Setup Table Files” on page B-2 for more information.
Dissociation A dissociation curve analysis is performed as part of a real-time PCR run (absolute
(Melting) Curve quantification). To perform a dissociation curve, construct a plate document for
Checklist absolute quantification as explained on page 4-3 and configure the method with a
temperature ramp as explained on page 4-16.
4-4 Run Setup and Basic Operation
Section: Plate Document Setup
In This Section This section discusses the following topics:
Topic
See Page
Step 1 – Creating a Plate Document
4-6
Step 2 – Applying Detectors and Markers to the Plate Document
4-7
Step 3 – Configuring the Plate Document with Detector Tasks
4-11
Step 4 – Programming the Plate Document Method
4-13
Step 5 – Saving the Plate Document as a Template
4-17
Step 6 – Creating a Plate Document from the Template
4-18
Step 7 – Applying Sample and Plate Information
4-19
Step 8 – Running the Plate on the 7900HT Instrument
4-20
Quick Review: Note The following table includes a set of abridged procedures for activating the components
Turning On the of the ABI PRISM 7900HT Sequence Detection System. For a complete explanation of the
7900HT Instrument procedure, see “Turning on the ABI Prism 7900HT Sequence Detection System” on page 3-5.
To activate the ABI PRISM 7900HT Sequence Detection System:
Step
Appearance
Turn on the monitor and computer.
Power
buttons
GR2009
1
Action
2
If using an automation module, turn on
the Zymark® Twister™ Microplate
Handler.
HI-POT
3
B
C
D
GR1728
A
Press the power switch located on the
back panel of the plate handler.
(Rear panel of the Twister)
Turn on the 7900HT instrument.
Press the power button located on the
front panel of the instrument below the
LED display.
Power
button
Note For a description of the LED
display, see “Reading the Instrument
Status Lights” on page 3-6.
4
Power
switch
GR2010
Launch the SDS 2.0 software by doing
one of the following:
Select
♦ Select Start > Programs >
SDS 2.0 > SDS 2.0.
or
♦ Double-click the SDS 2.0 icon from
the desktop.
SDS 2.0 > SDS 2.0,
Double- click
The computer launches the software.
Run Setup and Basic Operation 4-5
Step 1 – Creating a Plate Document
About ABI PRISM Every plate run on the 7900HT instrument requires the creation of a plate document
Plate Documents within the SDS software. Plate documents are virtual representations of the
consumables (MicroAmp® 384/96-well plates) used to contain samples and reagents
during runs.
Plate documents contain the following information:
♦
Detector information and arrangement on the plate
♦
Marker information and arrangement on the plate (allelic discrimination only)
♦
Sample information and their arrangement on the plate
♦
Method parameters for the run (absolute quantification only)
Creating a Plate To create a plate document:
Document
Step
Action
1
If not already open, launch the SDS software as explained on page 4-5.
2
Choose from the following:
♦ From the File menu, select New, or
♦ From the tool bar, click the New Document button (
3
).
Configure the New Document dialog box with settings for the run as follows:
Drop-Down List
Select…
Assay
the type of assay appropriate for your plate.
Note
If performing a dissociation curve experiment, select
Absolute Quantification from the Assay drop-down list.
Container
the type of plate you intend to run.
Template
Blank Template
Assay drop-down list
Container drop-down list
Template drop-down list
Barcode text field
(Leave blank)
Note Because this chapter emphasizes the use of a template file, the Barcode
text field is left blank. However, if creating a plate document to run a single plate,
scan or type the bar code for the plate into the Barcode text field.
4
Click OK.
The software displays a new plate document with the appropriate attributes.
5
4-6 Run Setup and Basic Operation
Create and copy detectors (and markers) to the new plate document as described
on page 4-7.
Step 2 – Applying Detectors and Markers to the Plate Document
Creating Detectors Before a plate document can be used to run a plate, it must be configured with
detector information for the experiment (and marker information if performing allelic
discrimination). A detector is a virtual representation of: a TaqMan® probe in a master
mix used for detection of a single target nucleic acid sequence, or the SYBR® Green
Double-Stranded DNA Binding Dye 1 used for the detection of double-stranded DNA.
Before using the plate document, you must create and apply detectors for all assays
present on the plate.
To create detectors for the plate document:
Step
1
Action
From the Tools menu of the SDS software, select Detector Manager.
The Detector Manager dialog box appears.
2
Click File, and from the drop-down list select New.
3
Click the Name text field, and type a name for the detector.
The Add Detector dialog box appears.
IMPORTANT The name of the detector must be unique and should reflect the
target locus of the assay (such as GAPDH or RNase P).
4
(Optional) Click the Description text field, and type a brief, 32-character description
of the assay.
5
Click the Reporter Dye and Quencher Dye drop-down lists and select the appropriate
dyes for the assay.
Note If creating a detector for a SYBR Green 1 assay, set the Quencher Dye drop
down list to Non Fluorescent.
Note If using a custom dye not manufactured by Applied Biosystems, you must
create and run a pure dye plate for the custom dye before it can be applied to a
detector (see “Adding Custom Dyes to the Pure Dye Set” on page 7-21).
6
Click the Color box, select a color to represent the detector using the Color Picker
dialog box, and click OK.
7
(Optional) Click the Notes text field, and type any additional comments for the
detector (up to 200 characters).
Name text field
Description
text field
Dye drop-down
lists
Color box
Notes text field
Creation and
Modification
date stamps
Allelic Discrimination Detector
Absolute Quantification Detector
Run Setup and Basic Operation 4-7
To create detectors for the plate document:
Step
8
(continued)
Action
Click OK to save the detector and return to the Detector Manager dialog box.
The software saves the new detector and displays it in the detector list.
9
Repeat steps 2 to 8 to create detectors for all remaining assays on the plate.
Note Click the
button for information on the features of the Detector Manager
dialog box or to view the procedures for editing, deleting, or searching for detectors.
10
Choose from the following:
If constructing a
plate document for…
Copying and
Applying Detectors
to the Plate
Document
Then…
absolute quantification
copy the detector(s) to the plate document as
explained in the procedure below.
allelic discrimination
create markers to the plate document as explained
on page 4-9.
IMPORTANT Once copied to the plate document, a detector is no longer linked to the
corresponding entry in the Detector Manager. Therefore, if a detector is modified in the Detector
Manager after it has been copied to a plate document, the detector must be removed from the
plate and copied again to update the plate document with the changes.
To copy and assign the detectors to the plate document:
Step
1
Action
From the Detector Manager dialog box of the SDS software, copy the detectors to
the plate document as follows:
a. While pressing and holding the Ctrl key, click the detectors you want to apply to
the plate document.
The software highlights the selected detectors.
b. Click Copy to Plate Document.
The software adds the detectors to the well inspector of the plate document.
2
Click Done to close the Detector Manager dialog box.
3
From the plate grid, select the wells containing the assay for the first detector.
Note For easier selection of plate grid wells, use the Ctrl and Shift keys to select
wells individually or in groups. See page 3-16 for more information.
4
Apply detector to the selection by clicking the check box for the detector in the Use
column of the well inspector.
Use check box
Detector added to selected
wells of the plate document
5
Repeat steps 3 and 4 to apply the remaining detectors to the plate grid.
6
Configure the plate document with detector tasks as explained on page 4-11.
4-8 Run Setup and Basic Operation
Creating an Allelic Allelic discrimination plate documents feature the use of ‘markers’ to aid in organizing
Discrimination and applying detectors based on the loci they target. A marker is a pairing of two
Marker detectors representing chemical assays designed to amplify different alleles of a
common locus. The SDS software uses marker information during data analysis to
organize and compare the processed run data.
IMPORTANT Allelic discrimination plate documents must contain at least one marker.
To create a marker for an allelic discrimination plate document:
Step
Action
1
If the Detector Manager dialog box is open, click Done to close it.
2
From the Tools menu of the SDS software, select Marker Manager.
The Marker Manager dialog box appears.
3
Click Create Marker.
The Add Marker dialog box appears.
4
Click the Enter name of new Marker text field, type a name for the new marker, and
click OK.
The new marker appears within the Markers text field.
5
Apply detectors to the new marker and follows:
a. From the Markers text field, click the new marker to select it.
The software highlights the selected marker.
b. From the Available Detectors text field, click a detector that you want to add to
the marker.
The software highlights the selected detector.
c. Click Add Detector.
The software applies the detector to the marker and displays it below the Marker
entry.
d. Repeat steps b and c for the remaining detector.
Detectors assigned to
Marker ‘CYP 2C9*2’
6
If evaluating multiple loci, repeat steps 3-5 to create additional markers as needed.
IMPORTANT A marker must be configured with two detectors before it can be
applied to a plate document.
Note Click the
button for information on the features of the Marker Manager
dialog box or to view the procedure for deleting markers from the Markers list.
7
Apply the marker(s) to the allelic discrimination plate document as explained in
“Copying and Applying Markers to a Plate Document” on page 4-10.
Run Setup and Basic Operation 4-9
Copying and IMPORTANT Once copied to the plate document, a marker is no longer linked to the
Applying Markers to corresponding entry in the Marker Manager. Therefore, if a marker is modified in the Marker
a Plate Document Manager after it has been copied to a plate document, the marker must be removed from the
plate and copied again to update the plate document with the changes.
To copy and apply markers to the plate document:
Step
1
Action
From the Marker Manager dialog box of the SDS software, copy the allelic
discrimination marker to the plate document as follows:
a. Click the marker you want to apply to the plate document.
The software highlights the selected marker.
b. Click Copy to Plate Document.
The software copies the marker and associated detectors to the plate document.
c. Repeat steps a and b to copy additional markers to the allelic discrimination
plate document as needed.
2
Click Done.
The software closes the Marker Manager dialog box.
3
Select the wells containing the assays for a marker you configured in the previous
procedure.
Note For easier selection of plate grid wells, use the Ctrl and Shift keys to select
wells individually or in groups. See page 3-16 for more information.
4
From the marker inspector, click the Use check box of the marker you want to add to
the selected wells.
The software labels the selected wells with the marker and its detectors.
Note The detectors associated with the marker are automatically applied to the
selected wells when the marker is placed in Use.
Detectors associated with
the ‘PDAR CYP 2C9*2’
marker
Use check box for the
‘PDAR CYP 2C9*2’ marker
(selected)
5
If necessary, repeat steps 3 and 4 to assign additional markers to the plate
document.
6
Configure the plate document with detector tasks as explained in
“Step 3 – Configuring the Plate Document with Detector Tasks” on page 4-11.
4-10 Run Setup and Basic Operation
Step 3 – Configuring the Plate Document with Detector Tasks
About Detector The detectors applied to each well of the plate document must be assigned a ‘task’
Tasks that defines their specific purpose or function on the plate. The SDS software uses the
detector task assignments to determine how to treat the data produced by the wells
when analyzing the run data. Detector tasks vary depending on the type of experiment
for which the plate document was created.
Applying To apply detector tasks to the detectors of the plate document wells:
Detector Tasks
Step
1
Action
Using the Ctrl and Shift keys, select the wells of the plate grid containing samples
for a particular task described in the table below.
Experiment
Task
Apply to…
Allelic
Discrimination
Unknown
all detectors of wells containing PCR reagents and
test samples.
NTC
all detectors of negative control wells containing
reagents for the PCR, but lacking samples.
Unknown
all detectors of wells containing PCR reagents and
test samples for quantification.
Standard
the appropriate detectors of wells containing PCR
reagents and samples of known quantities.
NTC
all detectors of negative control wells containing PCR
reagents, but lacking samples.
Absolute
Quantification
2
From the well inspector, click the text field in the Task column for each detector
entry, and select the appropriate task from the drop-down list.
The SDS software labels all selected wells with the task.
Task drop-down list
3
Repeat steps 1 and 2 to apply any remaining tasks to the plate document.
4
Choose from the following options:
If constructing a
plate document for…
absolute quantification
Then…
assign quantities to the standard wells of the plate
document as explained on page 4-12.
IMPORTANT The software will disregard data from
all Standard wells that have Quantity values of 0.
allelic discrimination
if necessary, set the passive reference for the plate
document as explained page 4-12. Otherwise,
continue to “Step 4 – Programming the Plate
Document Method” on page 4-13.
Run Setup and Basic Operation 4-11
Assigning Quantities
to Standards for
Absolute
Quantification
For the SDS software to create a standard curve for quantification of unknown
samples, absolute quantification plate documents must contain quantity values for the
standards contained on the plate. The software expresses quantity as the number of
copies of the target sequence present within an individual well of the plate.
IMPORTANT The SDS software excludes from analysis data from Standard wells assigned a
Quantity value of 0.
To apply quantities to the plate document:
Step
Action
1
From the plate grid of the SDS software, select the replicate wells containing the
first standard in the dilution series.
2
From the well inspector, click the text field in the Quantity column for the appropriate
detector, type the number of copies of the target template the replicate wells
contain, and press Enter.
The software labels the selected standard wells with the specified quantity.
Quantity
text field
3
Repeat steps 1 and 2 to configure the other sets of replicate standard wells on the
plate with the appropriate quantities.
When finished, the plate grid should contain a complete set of replicate wells
labeled with the Standard task and assigned quantities which the software will use
to compute the standard curve for the run.
4
If necessary, set the passive reference for the plate document as explained below.
Otherwise, program the method for your run as explained on page 4-13.
Setting the If using an Applied Biosystems chemistry, use the default Passive Reference setting
Passive Reference (Applied Biosystems chemistries use the ROX™ passive reference molecule). If
running a custom chemistry, select a dye to use as a passive reference for the run.
Note Applied Biosystems recommends using a passive reference to normalize the signals
from the reporter dyes (see page A-6 for more information).
To set the passive reference dye for the plate document:
Step
1
Action
From the Passive Reference drop-down list, select the appropriate reference dye.
Passive Reference
drop-down list
Select the appropriate
passive reference
2
4-12 Run Setup and Basic Operation
Program the method for the run as explained on page 4-13.
Step 4 – Programming the Plate Document Method
About SDS Methods During a run, the SDS software controls the instrument based on the instructions
encoded within the method of the plate document. Each new plate document
(except allelic discrimination) contains a default method that must be edited for the
specifics of the experiment.
Methods contain the:
♦
Thermal Cycler Conditions
♦
Auto Increment Values
♦
Ramp Rates
♦
Data Collection Options
♦
Reaction Volume Setting
To create a method for…
Then…
absolute quantification
program the method as explained on page 4-14.
allelic discrimination
see page 4-14.
dissociation curve analysis
Dissociation curves are preformed as part of a real-time PCR
run (absolute quantification). Therefore, to perform a
dissociation curve analysis do the following:
a. Program the method for the absolute quantification
experiment as explained on page 4-14.
b. Add a temperature ramp to the method for dissociation
curve analysis as explained on page 4-16.
Run Setup and Basic Operation 4-13
Programming The SDS software is designed to maximize instrument throughput and therefore does
Methods for Allelic not provide the option to thermal cycle allelic discrimination plate documents.
Discrimination Because allelic discrimination experiments are end-point runs that do not require data
collection during the PCR, thermal cycling can be performed on a dedicated thermal
cycler and then transferred to the 7900HT instrument for data collection and analysis.
If you want to thermal cycle the
allelic discrimination plates on…
Then…
a designated thermal cycler
go on to “Step 5 – Saving the Plate Document as a
Template” on page 4-17
the 7900HT instrument
follow the procedure below.
Performing Thermal Cycling of Allelic Discrimination Plates on the 7900HT Instrument
To perform the thermal cycling and the plate read using the 7900HT instrument, run
the plate first as a real-time plate document and then again as an allelic discrimination
plate document as explained below.
IMPORTANT Follow the procedure below only if you intend to perform the PCR on the
7900HT instrument. Otherwise, perform the PCR on a dedicated thermal cycler and then
transfer the plate to the 7900HT instrument for data collection.
To conduct allelic discrimination thermal cycling on the 7900HT instrument:
Step
Action
1
Launch the SDS software.
2
Create a real-time plate document for absolute quantification as described on
page 4-6.
Note
It is not necessary to configure the plate document with detectors.
3
Program the plate document method with the thermal cycling times and
temperatures for your protocol as described in “Programming the Method for
Absolute Quantification,” below.
4
Run the plate using the real-time plate document as described on page 4-21.
Note Although large, the real-time file may be helpful in diagnosing and
troubleshooting the experiment later if the data from the allelic discrimination run
produces unexpected results.
5
Go on to “Step 5 – Saving the Plate Document as a Template” on page 4-17.
Programming the Note The following procedure describes how to configure only the basic features of the
Method for Absolute method: thermal cycler conditions, sample volume, and data collection options. To further
Quantification customize the method for the plate document, click the button in the Instrument tab and refer
to the online help for instructions on configuring the auto increment and ramp rate values.
To create a method for the absolute quantification run:
Step
Action
1
From the SDS software, click the Instrument tab of the plate document.
2
If necessary, select or de-select the 9600 Emulation check box.
Note When the 9600 Emulation check box is checked, the SDS Software reduces
the ramp rate of the 7900HT instrument to match that of the ABI PRISM® 7700
Sequence Detection System instrument.
4-14 Run Setup and Basic Operation
To create a method for the absolute quantification run:
Step
3
(continued)
Action
Modify the default thermal profile for the method as needed:
To…
Then…
adjust step
parameters
(time/temp)
select a text field value, type a new value, and press Enter.
Temperature text field (between 4 and 99.9 °C)
Time text field (between 0:01 and 98:59 minutes)
add a hold,
cycle set, or
step
a. Click step to the left of the location you want to place the
new stage.
b. Click Add Cycle or Add Hold.
The software inserts the stage into the thermal profile.
Note To add a step to a stage, select the step to the left of
the location you want to place the step and click Add Step.
Selected
step
New step
appears here
remove a step
a. Click the step you want to remove.
The software highlights the selected step.
b. Click Delete Step to remove the step from the profile.
4
Configure the data collection options for the method as follows:
a. Click the Data Collection tab.
b. Click each plateau or ramp within the cycle stage of the thermal profile to place a
data collection icon at each step.
Data collection icons
5
Click the Sample Volume (µL) text field and type the volume of the reactions to be
run on the plate.
Note ‘Sample Volume’ refers to the entire contents of any well, including buffer
blank, or any combination of master mix and nucleic acids.
IMPORTANT All wells on one plate must contain the same reaction volume.
6
Choose from the following options:
If performing an…
Then…
absolute quantification run
only
go to “Step 5 – Saving the Plate Document as a
Template” on page 4-17.
absolute quantification run
with a dissociation curve
add a temperature ramp to generate dissociation
curve data as explained on page 4-16.
Run Setup and Basic Operation 4-15
Programming a
Temperature Ramp
for Dissociation
Curve Analysis
To generate the data required to perform a dissociation curve analysis, the 7900HT
instrument must be programmed to run a ‘temperature ramp’ in which it slowly
elevates the temperature of the samples while collecting fluorescence measurements
once every 7-10 seconds (see page 6-18 for a detailed explanation).
To add a temperature ramp to the method for dissociation curve analysis:
Step
1
Action
From the Instrument tab of the plate document, click the Thermal Profile tab.
The software displays the Thermal Profile tabbed page.
2
Click Add Dissociation Stage.
The SDS software inserts a temperature ramp at the end of the thermal profile
consisting of a set of default steps.
The default temperature ramp can be customized, however Applied Biosystems
recommends the following guidelines to ensure the greatest separation of the
derivative peaks during the analysis, and therefore the maximum resolution for the
run.
Guideline
Example
The Start and End steps of the
temperature ramp must:
♦ be separated by a minimum
temperature difference of
35 °C.
End step
♦ elapse 15 seconds (0:15) each.
Start step
The ramp rate setting for the End
step of the temperature ramp must
be 2 %.
End step
ramp rate
setting
A data collection icon must be
placed on the temperature ramp in
the thermal profile.
3
4-16 Run Setup and Basic Operation
Data
collection
icon
Go to “Step 5 – Saving the Plate Document as a Template” on page 4-17.
Step 5 – Saving the Plate Document as a Template
Adjusting the Because plate documents created from the template will retain its display settings,
Display Settings configure the display settings of the template as you would like the child plate
(Optional) documents to be displayed.
To configure the display settings for the template:
Step
1
Action
From the View menu of the SDS software, select Display Settings.
The Display Settings dialog box appears.
2
Configure the display settings for the Results Grid, and the Results Table.
For more information on the Display Settings dialog box or to view the procedures
for configuring the display settings for the template, click the
button to open the
SDS software online help.
3
When finished, click OK.
The SDS software applies the new display settings to the plate document.
4
Go to “Saving the Plate Document as a Template,” below.
Saving the Plate IMPORTANT Saving the plate document as a template is an optional step and recommended
Document as a for instances where the document can be used to create duplicate plate documents for a series
Template of plates with identical assay configurations. If you choose not to use your plate document as a
template, go to “Step 7 – Applying Sample and Plate Information” on page 4-19.
To save the template file:
Step
1
Action
From the File menu of the SDS software, select Save As.
The Save As dialog box appears.
2
From the Look in text field, navigate to the Program Files > Applied
Biosystems > SDS 2.0 > Templates directory.
Note By saving the template file to the Templates directory, it becomes available
from the Template drop-down list in the New Document dialog box.
3
From the File of type drop-down list, select ABI PRISM SDS Template Document
(*.sdt).
4
Click the File name text field, and type a name for the template.
5
Click Save.
The software saves the template plate document file.
6
From the File menu, select Close.
If the software prompts you to save the plate document, click No.
The SDS software closes the template file.
7
Create a plate document from the template as explained on page 4-18.
Run Setup and Basic Operation 4-17
Step 6 – Creating a Plate Document from the Template
Options for Creating The SDS software offers two options for creating plate documents from a template file:
Plate Documents individually or in batches.
from the Template
Option
Description
See Page
Create an individual
plate document from
the template
The procedure below explains how to create a
single plate document from a template file for
running a plate. By repeating the procedure, you
can create as many plate documents as needed.
Follow the
procedure
below.
Create multiple plate
documents using the
Template Batch utility
As a faster alternative to the option above, the
software includes a Template Batch utility that can
simultaneously create multiple plate documents
from the template file.
4-32
Creating a Single To create a plate document from the template file:
Plate Document
Step
Action
from a Template
1
From the File menu of the SDS software, select New.
The New Document dialog box appears.
2
Configure the New Document dialog box as follows:
Drop-Down List
Select…
Assay
the same assay as the template.
Container
the same plate type as the template.
Templatea
the template file (*.sdt) created on page 4-17.
If the template file does not appear within the Template
drop-down list, select the file as explained below:
a. Click Browse.
The Open dialog box appears.
b. From the Look in text field, navigate to and select the
template file (*.sdt) created on page 4-17.
c. Click Open.
The Template drop-down list displays the template file.
a. The Template drop-down list displays all template files contained in the Templates
subdirectory of the SDS 2.0 program directory.
3
(Optional) Click the Barcode text field and either:
♦ Type the bar code number for the plate, or
♦ Scan the plate bar code using the hand-held bar code scanner.
4
Click OK.
The software creates a new plate document from the template file.
5
4-18 Run Setup and Basic Operation
Configure the new plate document with sample and plate information as explained
on page 4-19.
Step 7 – Applying Sample and Plate Information
Applying Sample The plate document must contain sample attributes to effectively organize and
Names to the Plate analyze data produced from the run. Once applied, the software displays the sample
Document names within the plate grid and table views.
Note You can apply sample names after the plate has been run, but they must be added prior
to the analysis of the run data.
Note The SDS software features the ability to import setup table information (detector,
detector task, and sample name layouts) into a plate document from a tab-delimited text file.
See “Importing Plate Document Setup Table Files” on page B-2 for more information.
Applying sample names to the plate document:
Step
Action
1
From the plate grid of the plate document, select the wells containing the first
sample.
2
Click the Sample Name text field, type a name for the sample, and press Enter.
The software labels the selected wells with the new sample name.
3
Repeat steps 1 and 2 for all remaining samples.
Sample Name
text field
Name
appears
here
4
Configure the plate document with plate information as explained below.
Configuring the To add or edit any plate information (Barcode, Operator setting, or Plate Comments):
Plate Document
Step
Action
Information
1
From
the Tools menu of the SDS software, select Document Information.
(Optional)
The Document Information dialog box appears.
2
Edit the Barcode, Operator, or Plate Comments information.
Note For more information on the features of the Document Information dialog
box or the data it contains, click the
button to open the contextual online help.
3
When finished, click OK.
4
Run the plate document and associated plate as explained on page 4-20.
Run Setup and Basic Operation 4-19
Step 8 – Running the Plate on the 7900HT Instrument
Options for The 7900HT instrument can run prepared microplates individually or in groups using
Running SDS Plates the Zymark Twister Microplate Handler.
IMPORTANT If you are not using a Zymark Twister Microplate Handler, you must run plates
individually.
Choose one of the following options to run the plate:
Option
Description
Individual
Operation
Run the plate individually from the SDS software.
4-22
Automated
Operation
Run the plate with others as part of a batch from the
Automation Controller Software using the Zymark Twister
Microplate Handler.
4-31
IMPORTANT You must have a Zymark Twister Microplate
Handler to run plates using this option.
4-20 Run Setup and Basic Operation
See Page
Section: Running an Individual Plate
In This Section This section discusses the following topics:
Topic
See Page
Saving the Plate Document
4-22
Preparing and Running a Single Plate
4-23
Operating the 7900HT Instrument Using the SDS Software
4-25
After the Run
4-27
Run Setup and Basic Operation 4-21
Saving the Plate Document
Saving the Plate Before the plate document can be run, you must save it as an ABI PRISM SDS Single
Document for Single Plate (*.sds) file.
Plate Operation To save the plate document:
Step
1
Action
From the File menu of the SDS software, select Save As.
The Save As dialog box appears.
2
3
From the Look in text field, navigate to and select a directory for the software to
receive the new file.
Click the File name text field and either:
♦ Type a file name for the plate document file, or
♦ Type or scan the bar code number for the plate into the text field.
Note The SDS software does not require that the file name match the bar code of
the corresponding plate.
4
Click Save.
The software saves the plate document to the specified directory.
5
4-22 Run Setup and Basic Operation
Run the plate document and associate plate as explained on page 4-23.
Preparing and Running a Single Plate
Pre-Run Checklist The following tasks must be complete to run a plate on the 7900HT instrument.
Done
Check
See Page
A background run has been performed in the last month
7-13
A pure dye run has been performed in the 6 months
7-17
The instrument tray does not contain a plate
4-27
IMPORTANT The instrument tray must be empty to begin a run. If
the instrument tray contains a plate, eject and remove it before
continuing.
Plate Requirements See “Consumables and Disposables” on page D-3 for a complete list of ABI PRISM
consumables and ordering instructions.
Preparing the Plate To prepare the plate:
Step
1
Action
Prepare the reactions in an ABI PRISM® Optical Reaction Plate by aliquoting
reagents, enzyme, and samples to the appropriate wells of an optical plate.
IMPORTANT The arrangement of the reactions (samples and assays) on the
plate must match the configuration of the corresponding plate document.
2
Seal the ABI PRISM Optical Reaction Plate with an ABI PRISM® Optical Adhesive
Cover or ABI PRISM® Optical Flat Cap Strips.
3
Briefly centrifuge the plate to collect the reactions at the bottom of the wells and to
eliminate any air bubbles that may be present.
4
Choose from the following:
Experiment
Then…
Absolute Quantification/
Dissociation Curve Analysis
Run the plate as explained in “Running the
Plate” on page 4-24.
Allelic Discrimination
a. Load the plate onto a designated thermal
cycler and perform the PCR.
b. Briefly centrifuge the plate to draw the
reactions to the bottom of the wells and to
eliminate any air bubbles that may have
formed during thermal cycling.
c. Run the plate as explained in “Running the
Plate” on page 4-24.
Run Setup and Basic Operation 4-23
Running the Plate To begin the single plate run:
Step
1
Action
From the SDS software, click the Instrument tab of the plate document.
The software displays the Instrument tabbed page.
2
From the Real-Time or Plate-Read tab, click Open/Close.
The instrument tray rotates to the OUT position.
3
Place a plate into the instrument tray as shown below.
Before loading the plate onto the instrument tray, make sure that:
♦ The associated plate document is open in the SDS software.
♦ The plate has been sealed using an optical adhesive cover.
Well A1
PECY001DL3
GR2111
IMPORTANT The A1 position is located in the top-left side of the instrument.
4
Do one of the following:
♦ If performing a real-time run, click Start.
♦ If performing a end-point run, click Plate Read.
The instrument tray rotates to the IN position and the instrument performs the run or
plate-read.
Note Before starting the run, the instrument may pause (up to 15 minutes) to heat
the heated cover to the appropriate temperature.
Note For more information on the elements of the Real-Time and Plate-Read tabs,
click the
button and see the SDS software online help.
The following options are available during and after the completion of the run:
To…
See Page
Monitor the progress of the run
4-25
Stop the run
4-26
IMPORTANT If you must stop a run in-progress for any reason,
carefully read the instructions on page 4-26 before halting the run.
4-24 Run Setup and Basic Operation
Open the instrument tray (after the run)
4-27
Analyze the run data after the run is complete
4-27
Operating the 7900HT Instrument Using the SDS Software
Monitoring The SDS software displays instrument status and run progress in the Real-Time tab
Instrument Progress (real-time runs) or the Plate Read tab (end-point runs) of the respective plate
document. The following figure shows examples of the tabs during operation of the
7900HT instrument.
Real-Time Tab
(Real-Time Runs)
Report
Plate Read Tab
(End-Point Runs)
Displays…
Status
the condition of the 7900HT instrument
Time Remaining
the calculated time remaining in the run
Temperature group box (Real-Time Plate Documents Only)
Block
the actual temperature of the sample block module
Cover
the actual temperature of the heated cover
Sample
the calculated temperature of the samples
Cycle group box (Real-Time Plate Documents Only)
Rep
the current cycle repetition
Stage
the current stage of the thermal cycling
State
the current condition of the cycle stage
Step
the current step being run
Time
the calculated time remaining in the current step
Data Collection Stamp group box (End-Point Plate Documents Only)
Post
the date that the post-reada was performed.
a. A ‘post’ read is a plate read performed after a plate has undergone thermal cycling.
Note For more information on the elements of the Real-Time and Plate-Read tabs, click the
button and see the SDS software online help.
Run Setup and Basic Operation 4-25
Stopping the IMPORTANT Read the following directions carefully before stopping a run-in-progress.
Sequence Detector
Action
from the Run Type
From the Plate-Read tab of the plate document, click Stop.
SDS Software End-Point Runs
♦ Allelic
Discrimination
Real-Time Runs
Has the Cover reading in the Real-Time tab reached 104 °C?
♦ Absolute
Quantification
♦ NO (the heated cover temperature is below 104 °C)
♦ Melting Curve
♦ YES (the heated cover temperature has reached 104 °C)
From the Real-Time tab of the plate document, click Stop.
The instrument has begun to run the plate and is in the process of
thermal cycling. Determine a course of action from the options in
the following table:
Reason for Stopping the Run
Then…
Forgot to make a change to the plate
document such as adding a detector,
detector task, or sample name
(not including mistakes to the
temperature profile)
do not stop the run.
♦ Forgot to add a reagent to the plate
(such as enzyme or master mix)
a. From the Real-Time tab of the plate
document, click Stop.
♦ Programmed the plate document
with the wrong thermal profile
b. Determine how far into the run the instrument
has progressed.
Allow the instrument complete the run, then edit
the plate document before analyzing the data.
The software does not use detector or sample
information until the plate document is analyzed.
c. Based on the state of the run, determine
whether the plate can be re-run.
d. If necessary, eject the plate and add the
missing reaction component.
e. If desired, re-run the plate by re-creating the
plate document.
4-26 Run Setup and Basic Operation
After the Run
Analyzing the The run can be analyzed immediately following the completion of the run:
Run Data
To analyze data from a plate containing assays for…
See Page
Allelic Discrimination
5-3
Absolute Quantification
6-3
Dissociation Curve Analysis
6-17
Ejecting a Plate The instrument tray must be opened from the plate document that is connected to the
(Opening/Closing 7900HT instrument. View the instrument status icon to determine the plate document
the Instrument Tray) to use to eject the plate.
Instrument Status
Action
a. From the Window menu of the SDS software, select the
plate document connected to the instrument.
b. From the plate document, select the Instrument tab
c. Click the Plate-Read or Real-Time tab.
d. Click Open/Close.
a. From the File menu of the SDS software, select New.
b. Click OK.
c. Click the Instrument tab.
d. Click the Plate-Read or Real-Time tab.
e. Click Open/Close.
Run Setup and Basic Operation 4-27
Disconnecting the The SDS software has the ability to halt all communications with the 7900HT
Software from the instrument. The ‘disconnect’ option is designed to permit the simultaneous operation
Instrument of both the SDS software and the Automation Controller Software. Because both
programs control the ABI PRISM 7900HT Sequence Detection System, one program
must relinquish control of the 7900HT instrument before the other can be used to
operate it.
To…
Then…
disconnect the software from
the instrument
a. From the SDS software, click the Instrument tab of the
open plate document.
b. Click the Real-Time or Plate-Read tab.
c. Click Disconnect.
Note Once disconnected, the software neither monitors
nor controls the 7900HT instrument.
reconnect the software
(once disconnected)
to reconnect to an open plate document:
a. From the File menu, select Close to close the plate
document.
b. From the File menu, select Open.
c. From the Look In text field, navigate to and select the
plate document of interest.
d. Click Open,
Upon opening the plate document, the software
re-establishes the 7900HT instrument connection.
to reconnect to an new plate document, select New from
the File menu.
Upon creation of the plate document, the software
re-establishes the connection with the 7900HT instrument.
4-28 Run Setup and Basic Operation
Section: Running Multiple Plates Using the Automation Controller
In This Section This section discusses the following topics:
Topic
See Page
Adding Plate Documents to the Plate Queue for Automated Operation
4-30
Adding a Plate Document to the Plate Queue from the SDS Software
4-31
Creating Plate Documents Using the Template Batch Utility
4-32
Running Plates Using the Automation Controller Software
4-34
Loading Plates onto the Automation Module
4-36
Operating the 7900HT Instrument Using the Automation Controller Software
4-38
After the Run
4-38
Run Setup and Basic Operation 4-29
Adding Plate Documents to the Plate Queue for Automated Operation
Automation The first step in configuring the ABI PRISM 7900HT Sequence Detection System for
Operation and the automated operation, is to add plate documents to the plate queue. The plate queue is
Plate Queue a list of plate document files that the Automation Controller Software uses to identify
and run associated plates during automated operation. By adding plate documents to
the queue, they automatically become available for use with the Zymark Twister
Microplate Handler.
IMPORTANT Once a plate document has been added to the plate queue, the software locks
the file preventing any changes from being made to it until the plate document has been run or
removed from the queue.
The ABI PRISM 7900HT Sequence Detection System features several options for
adding plate documents to the plate queue. Review the options discussed in the
following table and choose the method that best suits your needs:
Option
See Page
Add a plate document to the plate queue from the SDS software.
4-31
Using the Template Batch utility, create batches of plate documents from a
template file and add them to the plate queue.
4-32
Add or remove individual or multiple plate documents to the plate queue using
the Automation Controller Software.
4-34
4-30 Run Setup and Basic Operation
Adding a Plate Document to the Plate Queue from the SDS Software
Adding the Plate IMPORTANT A plate document must contain a bar code before it can be added to the plate
Document to the queue. See page 4-19 for more information on configuring a plate document with bar code
Plate Queue information.
To add the plate document to the plate queue from the SDS software:
Step
1
Action
From the SDS software, send the plate document to the queue as follows:
a. Click the Instrument tab.
The software displays the contents of the Instrument tabbed page.
b. Click the Queue tab.
The software displays the contents of the Queue tabbed page.
2
Click Send to Queue.
If…
Then…
the plate document was
not saved previously
the Save As dialog box appears.
a. From the Look in text field, navigate to a
directory for the software to save the new file.
b. From the Files of type drop-down list, select
ABI PRISM SDS Single Plate (*.sds).
c. Click the File name text field and either:
– Type a name for the plate document file, or
– Type or scan the bar code number of the plate
into the text field.
d. Click Save.
The software saves the plate document.
the plate document was
saved previously
3
the software automatically saves the plate
document.
When prompted, click Yes to submit the document to the plate queue.
Once a plate document has been added to the plate queue, the software locks the
file preventing any changes from being made to it until the plate document has been
run or removed from the queue.
Note To release the plate document from the queue, launch the Automation
Controller Software and remove the plate document from the queue as explained
on page 4-35.
4
Click OK to close the dialog confirming that the plate document has been added to
the plate queue.
5
From the File menu, select Close.
The SDS software closes the plate document.
6
Repeat the procedures in this chapter to create and add additional plates to the
queue as needed.
7
When finished creating plate documents, run the enqueued plates as explained in
“Running Plates Using the Automation Controller Software” on page 4-34.
Run Setup and Basic Operation 4-31
Creating Plate Documents Using the Template Batch Utility
About the Template The Template Batch utility allows you to quickly create multiple plate documents from
Batch Utility a single ABI PRISM SDS Template file (*.sdt). The Template Batch utility can be a
useful time-saving device in situations where samples are run on plates with identical
assay configurations.
IMPORTANT Plate documents created by the Template Batch utility do not contain sample or
plate information. This information must be applied to each plate document individually after the
file is run.
Generating Plate Note For more information on the elements of the Template Batch dialog box or to view the
button and see the SDS software
Documents From a procedures for importing or editing Plate IDs, click the
online help.
Template
To create plate documents from a template using the Template Batch Utility:
Step
1
Action
From the SDS software, open a template file as follows:
a. From the File menu, select Open.
b. From the File Type drop-down list, select ABI PRISM SDS Template Document
(*.sdt).
c. From the Look in text field, navigate to and select the template file.
d. Click Open.
The SDS software displays the template file.
2
Send the plate document to the queue as follows:
a. Click the Instrument tab.
The software displays the contents of the Instrument tabbed page.
b. Click the Queue tab.
The software displays the contents of the Queue tabbed page.
3
Click Send to Queue.
The Template Batch dialog box appears.
4
Configure the Template Batch dialog box with Plate IDs as follows:
a. Click Add Plates.
The Add Plates dialog box appears.
b. Click the Plate ID text field, and scan the bar code of the first plate in the batch
using the hand-held bar code scanner.
! WARNING LASER HAZARD. Exposure to direct or reflected laser light can
burn the retina and leave permanent blind spots. Never look into the laser beam.
Remove jewelry and anything else that can reflect the beam into your eyes. Protect
others from exposure to the beam.
c. Repeat step b for every plate in the batch.
d. When finished, click Done.
The plate bar codes appear within the Plate ID field.
4-32 Run Setup and Basic Operation
To create plate documents from a template using the Template Batch Utility:
Step
5
(continued)
Action
Select a destination directory to store the new plate documents as follows:
a. Click Browse.
b. From the Look in text field, navigate to and select the directory you want to use
to receive the new files.
c. Click Open.
The Template Batch dialog box displays the selected destination directory in the
Plate Directory text field.
Destination
directory
6
Click Create.
The software creates plate documents for all entries listed in the Plate ID list, saves
them to the destination directory, adds them to the plate queue, and displays a
message indicating the number of plate documents it created and sent to the plate
queue.
7
Click OK to close the message box.
8
Click Done.
The Template Batch dialog box closes.
9
From the File menu, select Close.
The SDS software closes the template document.
10
Repeat the procedures in this chapter to create and add additional plates to the
queue as needed.
Note Once a plate document has been added to the plate queue, the software
locks the file preventing any changes from being made to it until the plate document
has been run or removed from the queue.
11
When finished creating and adding plate documents to the queue, run the queue as
explained in “Running Plates Using the Automation Controller Software” on
page 4-34.
Run Setup and Basic Operation 4-33
Running Plates Using the Automation Controller Software
Launching the The ABI PRISM 7900HT Sequence Detection System employs the Automation
Automation Controller Software for automated operation of the 7900HT instrument. The software
Controller Software coordinates the action of the 7900HT instrument, the bar code reader, and the plate
handler while acquiring and saving raw data during each run.
To launch the Automation Controller Software as follows:
Step
1
Action
If running the SDS software, do one of the following:
♦ From the Instrument menu, select Disconnect to discontinue communication
between the software and the instrument, or
♦ From the File menu, select Exit to close the SDS software.
2
Do one of the following:
♦ Double click the Automation Controller Software icon (
) on the desktop.
♦ From the Start menu, select Programs > SDS 2.0 > Automation Controller 2.0.
The Automation Controller Software launches and displays the main screen.
3
Verify that Plate Queue text field contains plate documents for all plates you intend
to run.
♦ To add a plate document to the plate queue, see “Adding Plates to the
Plate Queue” on page 4-35.
♦ To remove a plate document from the plate queue, see “Removing Plate
Documents from the Plate Queue” on page 4-35.
Plate Queue
(must contain plate
documents for all
plates to be run)
4
4-34 Run Setup and Basic Operation
Prepare and load the plates onto the plate handler as explained on page 4-36.
Adding Plates to the To add plate documents to the plate queue:
Plate Queue
Step
1
Action
From the File menu of the Automation Controller Software, select Add Plates.
The software displays the Open dialog box.
2
From the Look in text field, navigate to the directory containing the file or files of
interest.
3
While pressing and holding the Ctrl key, click the plate document file(s) to add to the
plate queue.
The software highlights selected files.
IMPORTANT A plate document must contain a bar code before it can be added to
the plate queue. See page 4-19 for more information on configuring a plate
document with bar code information.
4
Click Open.
The Automation Controller Software adds the plate document(s) to the Plate
Queue.
Note Once a plate document has been added to the plate queue, the software
locks the file preventing any changes from being made to it until the plate document
has been run or removed from the queue.
Removing Plate To remove plate documents from the plate queue:
Documents from the
Then…
Plate Queue To remove…
specific plate
documents from the
plate queue
a. While pressing and holding the Ctrl key, click the plate
document files to remove.
The software highlights selected files.
b. From the File menu, select Clear Selected Plate(s).
The software removes the selected plate documents from the
plate queue.
all plate documents
from the plate queue
From the File menu of the Automation Controller Software, select
Clear All Plates.
The software removes all plate documents from the plate queue.
Run Setup and Basic Operation 4-35
Loading Plates onto the Automation Module
Pre-Run Checklist The following tasks must be complete to run plates on the 7900HT instrument. See
the associated page number for details on each procedure.
Done
Check
See Page
A background run has been performed in the last month
7-13
A pure dye run has been performed in the 6 months
7-17
The plate queue contains plate documents for all plates to be run
4-6
The instrument tray does not contain a plate
4-38
IMPORTANT The instrument tray must be empty to begin a run. If
the instrument tray contains a plate, eject and remove it before
continuing.
The output stack does not contain plates.
–
Plate Requirements See “Consumables and Disposables” on page D-3 for a complete list of ABI PRISM
consumables and ordering instructions.
Guidelines Observe the following guidelines when loading plates onto the plate handler:
♦
Before loading plates onto the plate handler, make sure that for each plate:
–
the associated plate document has been added to the plate queue
–
the plate has been sealed using an optical adhesive cover.
♦
Load the plates into the plate handler stacks in any order. The software reads the
bar code of each plate before it is run and matches the plate document and
method with the plate. The Automation Controller Software can run batches of up
to 84 plates in a single session (21 plates/stack).
♦
Orient the plates within the stacks so that well A1 ( ) of each plate corresponds to
the locations shown in the illustration below.
♦
Do not place plates in the output stack (X). The Zymark arm uses the empty stack
to store used plates after they are run.
X
4
3
2
1
Bar code
Zymark Twister Microplate Handler
(top view)
4-36 Run Setup and Basic Operation
Well A1
Loading Plates To load plates onto the automation module:
Step
Action
1
Following the guidelines on page 4-36, load the sealed plates into the plate handler
stacks.
2
From the Automation Controller Software, select the check boxes for the plate
stacks containing plates.
IMPORTANT If you are not using stack 1 or the Restack option explained below,
remove all plates from stack 1 before starting the queue. Under these settings, the
plate handler will attempt to stack the run plates from stack 2 in the stack 1 position.
If stack 1 contains plates, these settings will cause the plate handler to stop the run.
Plate stack check
boxes
3
If you want to retain the location of the plates in the stacks on the plate handler,
select the Restack when finished check box.
When selected, the Restack function instructs the arm to replace a stack of used
plates to their original stack and in their original order after the stack has been run.
If the option is not selected, the arm will place each group of used plates within the
next vacant stack in clockwise order beginning with the Output stack.
Note Restacking plates adds significant operating time when running multiple
plates. Use the Restack function only when absolutely necessary.
4
Begin the plate queue as explained on page 4-38.
Run Setup and Basic Operation 4-37
Operating the 7900HT Instrument Using the Automation Controller Software
Starting the Once all plate documents have been loaded into the Plate Queue and the Instrument
Plate Queue Control options are configured you may start the plate queue.
To begin the plate queue, click Start Queue from the Plate Queue tabbed page.
The ABI PRISM 7900HT Sequence Detection System loads the first plate, scans the
bar code, and the begins the run.
Note Before starting a real-time run, the instrument may pause (up to 15 minutes) to heat the
heated cover to the appropriate temperature.
Monitoring The Automation Controller Software displays the progress of the current run in the
Instrument Progress Thermal Status tab. See page 4-25 for an explanation of the Thermal Status tab.
Stopping the To stop the plate queue, click the Stop button on the Automation Controller Software
Sequence Detector dialog at any time.
from the Automation
Then the instrument...
Controller Software If the Stop button is clicked...
while the plate handler is handling a plate
aborts the run and moves the plate handler to
the home position.
after a plate has been loaded into the
instrument, but before the run has started.
aborts the current run, ejects the plate, and
moves the plate handler to the home position.
after the 7900HT instrument has started a
run.
aborts the current run, ejects the plate, and
moves the plate handler to the home position.
IMPORTANT Stopping a run during thermal
cycling can affect the chemistry of the
reactions within the plate. Before stopping a
run, carefully read the guidelines on page 4-26
to determine the best course of action.
Ejecting a Plate To eject a plate following a halted run, click Open/Close from the Automation
(Opening/Closing Controller Software window.
the Instrument Tray)
After the Run
Analyzing the The run can be analyzed immediately following the completion of the run:
Run Data
To analyze data from a plate containing assays for…
See Page
Allelic Discrimination
5-3
Absolute Quantification
6-3
Dissociation Curve Analysis
6-17
4-38 Run Setup and Basic Operation
End-Point Analysis
5
5
In This Chapter This chapter discusses the following topics:
Topic
See Page
End-Point Runs on the 7900HT Instrument
5-2
Section: Allelic Discrimination
5-3
Overview
5-4
Before You Begin
5-7
Analysis Checklist
5-8
Analyzing a Completed Allelic Discrimination Run
5-9
Calling and Scrutinizing Allelic Discrimination Data
5-10
After the Analysis
5-15
End-Point Analysis 5-1
End-Point Runs on the 7900HT Instrument
End-Point Runs End-point is the term used to describe the category of sequence detection runs in
which the ABI PRISM® 7900HT Sequence Detection System is used to measure the
fluorescence of a biological sample after it has undergone thermal cycling. Unlike
real-time runs that can yield quantitative measurements, the focus of end-point
experiments is typically to produce a qualitative result. End-point analysis is
commonly used in combination with TaqMan® chemistry to confirm the presence or
absence of specific target nucleic acid sequence in cells, tissues, or fluid samples.
Currently, the SDS software supports one type of end-point analysis: Allelic
Discrimination.
5-2 End-Point Analysis
Section: Allelic Discrimination
In This Section This section contains the following information:
Topic
See Page
Overview
5-4
Before You Begin
5-7
Analysis Checklist
5-8
Analyzing a Completed Allelic Discrimination Run
5-9
Calling and Scrutinizing Allelic Discrimination Data
5-10
After the Analysis
5-15
End-Point Analysis 5-3
Overview
Allelic
Discrimination on
the 7900HT
Instrument
The ABI PRISM 7900HT Sequence Detection System supports allelic discrimination
using TaqMan® probes. Allelic discrimination is the process by which two variants of a
single nucleic acid sequence are detected in a prepared sample. Allelic discrimination
chemistry can be used for single-nucleotide polymorphism (SNP) detection.
Employing the Allelic discrimination on the 7900HT instrument is made possible through the use of
5´ Nuclease Assay for the fluorogenic 5´ nuclease assay (see page A-2). During the PCR, the fluorogenic
Allelic Discrimination probes anneal specifically to complementary sequences between the forward and
reverse primer sites on the template DNA. Then during extension, AmpliTaq Gold ®
DNA polymerase cleaves the probes hybridized to the matching allele sequence(s)
present in each sample. The cleavage of each matched probe separates the reporter
dye from the quencher dye, which results in increased fluorescence by the reporter.
After thermal cycling, the plate is run on the 7900HT instrument which reads the
fluorescence generated during the PCR amplification. By quantifying and comparing
the fluorescent signals using the SDS software, it is possible to determine the allelic
content of each sample on the plate.
Mismatches between a probe and target reduce the efficiency of probe hybridization.
Furthermore, AmpliTaq Gold DNA polymerase is more likely to displace the
mismatched probe than to cleave it, releasing the reporter dye. By running the
extension phase of the PCR at the optimal annealing temperature for the probes, the
lower melting temperatures (Tm) for mismatched probes minimizes their cleavage and
consequently their fluorescent contribution. The figure below illustrates results from
matches and mismatches between target and probe sequences in TaqMan® PDARs
for AD assays (Livak et al., 1995; Livak et al., 1999).
Allele
X
F
V
Probe-target sequence
match
Match
Allele
Y
Probe-target sequence
mismatch
Mismatch
(higher Tm)
V
VIC
F
FAM
Q
Quencher
V
F
Q
Q
Match
Probe-target sequence
match
Legend
Q
Q
Mismatch
Probe-target sequence
mismatch
(higher Tm)
AmpliTaq
Gold DNA
Polymerase
GR1556
The table below shows the correlation between fluorescence signals and sequences
present in the sample.
A substantial increase in…
5-4 End-Point Analysis
Indicates…
VIC™ fluorescence only
homozygosity for Allele X.
FAM™ fluorescence only
homozygosity for Allele Y.
both fluorescent signals
heterozygosity.
Algorithmic
Manipulation of
Raw Allelic
Discrimination Data
The SDS software can analyze raw data immediately upon completion of an allelic
discrimination run. The term ‘raw data’ refers to the spectral data between 500 nm to
660 nm collected by the SDS software during the plate-read. During the analysis, the
software employs several mathematical algorithms to generate from the raw data a
more direct measure of the relationship between the spectra changes in the unknown
samples.
The first mathematical algorithm involves the conversion of the raw data, expressed in
terms of Fluorescent Signal vs. Wavelength, to pure dye components using the
extracted pure dye standards. After the dye components have been identified, the
software determines the contribution of each dye in the raw data using the
multicomponent algorithm. See “Multicomponenting” on page A-5 for a complete
description of the process.
Cluster Variations The SDS software graphs the results of an allelic discrimination run on a scatter plot
contrasting reporter dye fluorescence (Allele X Rn versus Allele Y Rn). The software
represents each well of the 384-well plate as a datapoint on the plot. The clustering of
these datapoints can vary along the horizontal axis (Allele X), vertical axis (Allele Y),
or diagonal (Allele X/Allele Y). This variation is due to differences in the extent of PCR
amplification, which could result from differences in initial DNA concentration.
The example below shows the variation in clustering due to differences in the extent of
PCR amplification.
Allele Y homozygotes
Allele X/Allele Y
heterozygotes
Outliers
Allele X homozygotes
No amplification
End-Point Analysis 5-5
Genotypic Segregation of Datapoint Clusters
The figure on the previous page illustrates the concept of genotypic segregation of
samples within the allele plot. The plot contains four separate, distinct clusters which
represent the No Template Controls and the three possible genotypes (allele X
homozygous, allele Y homozygous, and heterozygous). Because of their
homogenous genetic compliment, homozygous samples exhibit increased
fluorescence along one axis of the plot (depending on the allele they contain). In
contrast, heterozygous samples appear within the center of the plot because they
contain copies of both alleles, and therefore exhibit increased fluorescence for both
reporter dyes.
About Outliers
Samples that did not cluster tightly may:
5-6 End-Point Analysis
♦
Contain rare sequence variations
♦
Contain sequence duplications
♦
Not contain a crucial reagent for amplification (the result of a pipetting error)
Before You Begin
Using SDS For specific instructions on any procedure described within this section, refer to the
Online Help online help accompanying the SDS software. To get help at any time during the
procedure, click a help button (
you are working.
) located within the dialog box or window in which
Examples in The illustrations and screenshots that appear within this chapter were created from a
This Section plate containing Pre-Developed TaqMan Assays and Reagents for Allelic
Discrimination run to screen 6 human genomic DNA samples (HD 1, 2, 3, 4, 7, 8) for 2
targets (CYP 2C9*2 and CYP 2C19*2). Each well of the plate contains 1 µL DNA, 1X
TaqMan® Universal PCR Master Mix, forward and reverse primers, and FAM and VIClabeled TaqMan probes.
The following figure illustrates the arrangement of the assays, unknown samples, and
no template control (NTC) wells on the plate.
HD-1 1
HD-1 2
HD-1 3
HD-1 4
HD-1 5
HD-1 6
HD-1 7 HD-1 8
HD-1 9 HD-1 10
HD-2 1
HD-2 2
HD-2 3
HD-2 4
HD-2 5
HD-2 6
HD-2 7 HD-2 8
HD-2 9 HD-2 10
HD-3 1
HD-3 2
HD-3 3
HD-3 4
HD-3 5
HD-3 6
HD-3 7 HD-3 8
HD-3 9 HD-3 10
HD-4 1
HD-4 2
HD-4 3
HD-4 4
HD-4 5
HD-4 6
HD-4 7 HD-4 8
HD-4 9 HD-4 10
HD-7 1
HD-7 2
HD-7 3
HD-7 4
HD-7 5
HD-7 6
HD-7 7 HD-7 8
HD-7 9 HD-7 10
HD-8 1
HD-8 2
HD-8 3
HD-8 4
HD-8 5
HD-8 6
HD-8 7 HD-8 8
HD-9 9 HD-8 10
NTC
GR2107
Not in Use
PDAR CYP 2C9*2
PDAR CYP 2C19*2
Note The probes used in the example experiment were designed using the Primer Express™
Primer Design Software and by following the guidelines explained in “Assay Development
Guidelines” on page C-2.
IMPORTANT The SDS software does not require that allelic discrimination plates contain
positive controls.
End-Point Analysis 5-7
Analysis Checklist
Where You Are in The following checklist illustrates your current position in the overall procedure:
the Procedure
Done
Step
Procedure
See Page
✓
1
Create an allelic discrimination plate document.
4-6
✓
2a
a. Create detectors for the allelic discrimination probes.
4-7
b. Create a marker for each allelic discrimination probe
pairing.
4-9
c. Copy the marker(s) to the plate document.
4-10
✓
3a
Assign detector tasks to the wells of the plate document
(NTC and Unknown).
4-11
✓
4
If you would like to perform thermal cycling of the allelic
discrimination plate on the 7900HT instrument, create a
real-time plate document for the plate and program it with
the method for the allelic discrimination run. Otherwise,
continue to step 5.
4-13
✓
5
Choose from the following:
If running…
Then…
a single plate
continue to step 7.
the first plate in a series
of plates with identical
assay configurations
Save the plate document as an ABI PRISM
SDS Template Document as explained on
page 4-17.
✓
6
Create a plate document from the template created in
step 5.
4-18
✓
7
Configure the document with sample names and plate
information.
4-19
✓
8
a. Prepare the allelic discrimination plate or plates and
perform thermal cycling on a designated thermal cycler.
4-20
b. Run the allelic discrimination plate or plates on the
7900HT instrument.
9
Analyze the run data.
5-9
10
View the results of the allelic discrimination run.
5-10
11
Call allele types for each marker.
5-11
12
Scrutinize the allele calls.
5-13
13
Choose from the following post-analysis options:
5-15
♦ Reanalyze the run data.
♦ Adjust the display settings for the plate document.
♦ Print elements of the plate document.
♦ Export the plate document results table or plots.
a. Steps 2 and 3 can be eliminated by importing the plate document setup information from a tab-delimited
text file. See “Importing Plate Document Setup Table Files” on page B-2 for more information.
5-8 End-Point Analysis
Analyzing a Completed Allelic Discrimination Run
Analyzing the Run To analyze a completed allelic discrimination run:
Step
Action
1
If not already open, launch the SDS software as explained on page 4-5.
2
Open the plate document file for analysis as follows:
a. From the File menu, select Open.
b. From the Look in text field, navigate to and select the plate document file.
c. Click Open.
The SDS software displays the plate document file.
3
Choose one of the following:
♦ From the Analysis menu, select Analyze.
♦ From the toolbar, click the Analyze button (
).
The SDS software analyzes the run data and displays the results in the Results tab.
End-Point Analysis 5-9
Calling and Scrutinizing Allelic Discrimination Data
About the Allelic The SDS software graphs the results of allelic discrimination runs on a scatter plot
Discrimination View contrasting reporter dye fluorescence. After signal normalization and multicomponent
analysis, the software graphs the normalized data from each well as a single data
point on the plot.
The following figure illustrates the components of the Allelic Discrimination plot.
1
2
3
4
The following table describes the elements of an SDS plate document:
Component
Description
1
Marker drop-down list
Determines the marker data that the software displays
within the plot.
2
Call drop-down list
When a datapoint is selected, this menu allows you to
assign an allele call to the datapoint within the scatter plot.
3
Toolbar
Contains the following tools for manipulating the plot.
Icon
Description
Selects individual data points by clicking or groups of datapoints by clicking
and dragging a box across a group of data points.
Selects groups of datapoints by encircling them with the tool.
Repositions the view within the plot by clicking and dragging the screen.
Zooms the plot by clicking the mouse button within the plot or by clicking
and dragging a section of the plot to view.
Zooms out on the plot by clicking the mouse button within the plot.
4
5-10 End-Point Analysis
Scatter plot
A scatter plot of data points from the run.
Calling Allele Types To call allele types:
Step
1
Action
Click the Results tab.
The software displays the Allelic Discrimination Plot.
2
Zoom out until all crossmarks are visible in the plot.
a. Click the (
) magnifying glass tool.
b. Click the plot to zoom out.
c. Click the (
) lasso tool.
d. Select all of the marks within the plot by clicking and dragging the mouse pointer
across all datapoints in the plot.
The software outlines all selected wells within the grid view.
e. Examine the tray pane to confirm that all wells are selected. If not all wells are
selected, repeat steps a-d until all wells are visible on the plot.
Black boarder
(surrounding selected wells)
3
Select the sample cluster exhibiting amplification of the first probe.
Allele X
homozygotes
End-Point Analysis 5-11
To call allele types:
Step
4
(continued)
Action
From the Call drop-down list, select the Allele X call.
Select Allele X
The software automatically labels the samples and wells with the Allele X call.
Allele X
homozygotes
5
Repeat steps 3 and 4 to apply calls to the rest of the samples within the plot.
Call
Symbol
Definition
Allele X
●
Homozygous for the allele displayed on the
X-axis of the Allelic Discrimination Plot.
Allele Y
●
Homozygous for the allele displayed on the
Y-axis of the Allelic Discrimination Plot.
Both
●
Heterozygous (Alleles X and Y)
NTC
■
No Template Control
Undetermined
✕
Unknown (Unlabeled)
Note You can adjust the appearance of the allelic discrimination plot or the data
points it contains using the Display Settings dialog box. See the SDS software
online help for more information.
Allele Y homozygotes
Allele X/Allele Y
heterozygotes
Allele X homozygotes
No amplification
6
If evaluating for multiple markers, do the following:
a. From the Marker drop-down list, select a different marker.
b. Repeat steps 2 to 5 for the new marker.
c. Repeat steps a and b until the alleles for each marker have been called.
5-12 End-Point Analysis
Scrutinizing the
To analyze allele types:
Allele Calls
Step
1
Action
Verify the calls for the NTC, Allele X, and Allele Y controls.
a. From the plate grid, select the wells containing the No Template Control samples.
The software highlights the datapoints within the allele plot.
b. Check that the datapoints cluster in the expected position on the plot.
c. If using positive controls, repeat steps a and b for the wells containing the
Allele X, and Allele Y controls.
Allele Y controls
should cluster here
Allele X controls
should cluster here
No Template
Controls should
cluster here
2
Designate samples that did not cluster tightly as Undetermined.
Samples that did not cluster tightly may:
♦ Contain rare sequence variations
♦ Contain sequence duplications
Undetermined
samples
End-Point Analysis 5-13
To analyze allele types:
Step
3
(continued)
Action
Screen for Unknown samples that failed to amplify:
a. From the Allelic Discrimination Plot, select the NTC cluster.
The SDS software highlights the datapoints within the allele plot and the plate
grid.
b. From the plate grid, check the wells containing Unknown samples for selected
wells that are clustered with the NTCs.
Samples that clustered with the No Template Control wells may:
♦ Contain no DNA
♦ Contain PCR inhibitors
♦ Be homozygous for a sequence deletion
NTC cluster
(selected)
No Template
Control wells
Unknown samples
clustered with the NTCs
4
Retest any samples that did not cluster tightly or clustered with NTCs to confirm the
results.
5
If evaluating for multiple markers, do the following:
a. From the Marker drop-down list, select a different marker.
b. Repeat steps 1 to 4 for the new marker.
c. Repeat steps a and b until the calls for each marker have been verified.
5-14 End-Point Analysis
After the Analysis
Changing the Before printing or exporting the analyzed data, the software allows you to reconfigure
Plate Document the appearance of several elements of the plate document including the results table,
Display Settings plate grid, and most plots (Allelic Discrimination, Raw Data, and Background plots).
To configure the display settings for the plate document:
Step
Action
1
From the View menu, select Display Settings.
2
From the Display Settings dialog box, click the help button (
instructions on modifying the display settings.
) for further
Saving the The software allows you to save any changes to the appearance of the plate
Plate Document document, however it does not save the calls made during the analysis. To save the
plate document, select Save from the File menu.
Printing a Report The SDS software can print a report of the analyzed data containing individual or
multiple elements of the plate document.
To print a report of the plate document data:
Step
Action
1
From the File menu, select Print Report.
2
From the Print Report dialog box, click the help button (
setting up, previewing, and printing the report.
) for instructions on
Exporting Plate Exporting Plate Document Data as a Tab-Delimited Text File
Document Data The SDS software can export raw or analyzed data in tab-delimited (*.txt) format for all
or a select group of wells on a plate document. The exported files are compatible with
most spreadsheet applications and programs that can read tab-delimited text.
To export run data as a tab-delimited text file, choose one of the following for further
instructions:
♦
See “Exporting Plate Document Data” on page B-9.
♦
Click the help button (
) within the table view.
Help button
Exporting Plots as Graphics
The SDS software can export most panes and plots of the plate document as JPEG
(Joint Photographic Experts Group) graphic files. The JPEG file format is compatible
with most word processing and spreadsheet applications and can be incorporated
directly into HTML documents for viewing by most web browser software.
To export a plot as a graphic file, see “Exporting Graphics” on page B-8 or click the
help button ( ) within the plot of interest for further instructions.
End-Point Analysis 5-15
Real-Time Analysis
6
6
In This Chapter This chapter discusses the following topics:
Topic
Real-Time Runs on the 7900HT Instrument
See Page
6-2
Section: Absolute Quantification
6-3
Overview
6-4
Before You Begin
6-6
Analysis Checklist
6-7
Analyzing the Run Data
6-8
Viewing Results
6-13
After the Analysis
6-15
Section: Dissociation Curve Analysis
6-17
Overview
6-18
Before You Begin
6-19
Analysis Checklist
6-20
Analyzing the Run Data
6-21
Determining Tm Values for the Analyzed Run
6-22
After the Analysis
6-24
Real-Time Analysis 6-1
Real-Time Runs on the 7900HT Instrument
Real-Time Runs Real-time is the term used to describe the category of sequence detection runs in
which the ABI PRISM® 7900HT Sequence Detection System is used to measure the
fluorescence of a biological sample during thermal cycling. In contrast to end-point
runs, real-time experiments can be used to achieve both qualitative and quantitative
measurements. Real-time analysis can be used in combination with either TaqMan®
or SYBR® Green 1 double-stranded DNA binding dye chemistry for a variety of
purposes including quantitative PCR and dissociation curve analysis.
Quantitative Quantitative RT-PCR is a method used to measure small quantities of ribonucleic acid
RT-PCR sequences isolated from biological samples. Typical biological samples include cells,
tissues, and fluids. During the RT step, reverse transcription of target RNA produces
corresponding complementary DNA (cDNA) sequences. During the subsequent PCR,
the initial concentration of target cDNA is quantified by amplifying it to a detectable
level.
There are two types of quantitative RT-PCR:
6-2 Real-Time Analysis
♦
Absolute quantification
♦
Relative quantification
Section: Absolute Quantification
In This Section This section contains the following information:
Topic
See Page
Overview
6-4
Before You Begin
6-6
Analysis Checklist
6-7
Analyzing the Run Data
6-8
Viewing Results
6-13
After the Analysis
6-15
Real-Time Analysis 6-3
Overview
About Absolute The ABI PRISM 7900HT Sequence Detection System supports real-time absolute
Quantification quantification of nucleic acids using a standard curve method. The objective of
absolute quantification is to accurately determine the absolute quantity of a single
nucleic acid target sequence within an unknown sample. The results of an absolute
quantification experiment are reported in the same unit measure of the standard used
to make them.
Employing the Absolute quantification on the 7900HT instrument is accomplished through the use of
5´ Nuclease Assay the polymerase chain reaction and the fluorogenic 5´ nuclease assay (see page A-2).
During setup, standards diluted over several orders of magnitude and unknown
samples are loaded onto an ABI PRISM® Optical Reaction Plate containing master mix
and TaqMan assays targeting a specific nucleic acid sequence. The plate is then
loaded into a 7900HT instrument which has been configured to perform a real-time
run. During the thermal cycling, the instrument records the emission resulting from the
cleavage of TaqMan® probes in the presence of the target sequence. After the run,
the SDS software processes the raw fluorescence data to produce threshold
cycle (CT) values for each sample (see page A-10). The software then computes a
standard curve from the CT values of the diluted standards and extrapolates absolute
quantities for the unknown samples based on their CT values (see below).
Note See Appendix A, “Theory of Operation,” for more information on the fluorogenic
5´ nuclease assay, real-time data collection, or the mathematical transformations of sequence
detection data.
Standard Curve Plot
28
26
CT
Unknowns
24
22
20
1.0 E+2
1.0 E+3
1.0 E+4
1.0 E+5
Quantity
(LogN initial concentration)
The figure above illustrates a standard curve generated from a standard RNase P
Installation Plate. The arrangement of the samples and standards on the plate are
shown in “Examples in This Chapter” on page 6-6.
6-4 Real-Time Analysis
Algorithmic The SDS software can analyze raw data immediately upon completion of absolute
Manipulation of quantification run. The term raw data refers to the spectral data between 500 nm to
Raw Data 660 nm collected by the Automation Controller Software during the plate-read. During
the analysis, the software automatically applies several mathematical transformations
to the raw data to generate a more direct measure of the relationship between the
spectral changes in the unknown samples.
Multicomponenting
The first mathematical transformation involves the conversion of the raw data,
expressed in terms of Fluorescent Signal vs. Wavelength, to pure dye components
using the extracted pure dye standards. After the dye components have been
identified, the software determines the contribution of each dye in the raw data using
the multicomponent algorithm. See “Multicomponenting” on page A-5 for a complete
description.
Setting the Threshold and Calling CTs
After multicomponenting, the baseline and threshold values must be set for the run
(see “Kinetic Analysis/ Quantitative PCR” on page A-7 for more information). The
results of the experiment can be visualized in the Standard Curve graph of the Results
tab. The graph consists of a scatter plot of standard and unknown samples graphed
on a linear-scale plot of Threshold Cycle (CT) versus Starting copy number.
Real-Time Analysis 6-5
Before You Begin
Using SDS For specific instructions on any procedure described within this section, refer to the
Online Help online help accompanying the SDS software. To get help at any time during the
procedure, click a help button (
you are working.
) located within the dialog box or window in which
Examples in This The illustrations and screenshots that appear within this chapter were created for a
Chapter TaqMan® RNase P Instrument Verification Plate, an experiment run during the
installation of the 7900HT instrument to verify its performance. The sealed plate is
pre-loaded with the reagents necessary for the detection and quantification of
genomic copies of the human RNase P gene (a single-copy gene encoding the moiety
of the RNase P enzyme). Each well contains pre-loaded reaction mix (1X TaqMan®
Universal PCR Master Mix, RNase P primers, and FAM™-labeled probe) and
template.
Unknown 2
10000
GR2107
Unknown 1
5000
NTC
STD 1250
STD 2500
STD 5000
STD 10000
STD 20000
The following figure illustrates the arrangement of standards and samples on the
RNase P plate. As shown below, the RNase P plate consists of 5 columns of template
standards (1250, 2500, 5000, 10,000, and 20,000 copies) and two unknown
populations (5000 and 10,000 copies).
6-6 Real-Time Analysis
Analysis Checklist
Where You Are in The following checklist illustrates your current position in the overall procedure:
the Procedure
Done
Step
✓
1
Create an absolute quantification plate document.
4-6
✓
2a
a. Create detectors for the absolute quantification probes.
4-7
✓
3a
✓
✓
4
5
Procedure
See Page
b. Copy the detectors to the plate document.
4-8
a. Configure the plate document with detector tasks
(NTC, Standard, and Unknown).
4-11
b. Assign quantities to the wells of the plate document that
contain standards.
4-12
a. Program the method for the absolute quantification run.
4-13
b. If performing an assay in which you would like to collect
dissociation data, add a temperature ramp to the thermal
profile to perform a dissociation curve analysis.
4-16
Choose from the following:
If running…
Then…
a single plate
continue to step 7.
the first plate in a series
of plates with identical
assay configurations
Save the plate document as an ABI PRISM
SDS Template Document as explained on
page 4-17.
✓
6
Create a plate document from the template created in
step 5.
4-18
✓
7
Configure the document with sample names and plate
information.
4-19
✓
8
Prepare and run the absolute quantification plate or plates.
4-20
9
Configure the analysis options for the run.
6-8
10
Analyze the run data.
6-9
11
Set the baseline and threshold values for each detector.
6-10
12
Visualize outliers and eliminate any outlying amplification
from the run data.
6-12
13
View the results of the absolute quantification run.
6-13
14
Choose from the following post-analysis options:
6-15
♦ Reanalyze the run data.
♦ Adjust the display settings for the results table, plate grid,
and plate document plots.
♦ Print elements of the plate document.
♦ Export the plate document results table or plots.
a. Steps 2 and 3 can be eliminated by importing the plate document setup information from a tab-delimited
text file. See “Importing Plate Document Setup Table Files” on page B-2 for more information.
Real-Time Analysis 6-7
Analyzing the Run Data
Configuring the Before analyzing the data collected from the complete absolute quantification run,
Analysis Options decide whether to configure the options for the software analysis. The analysis
(Optional) options allow you to pre-configure the threshold and baseline settings applied to the
plate document data during the analysis. If you choose not to configure the analysis
options, the SDS software uses the default baseline range and automatically
calculates the threshold value for the run.
To configure the analysis options for the absolute quantification run:
Step
Action
1
If not already open, launch the SDS software as explained on page 4-5.
2
Open the plate document file for analysis as follows:
a. From the File menu, select Open.
b. From the File Type drop-down list, select ABI PRISM SDS Single Plate (*.sds).
c. From the Look in text field, navigate to and select the plate document file.
d. Click Open.
The SDS software displays the plate document file.
3
From the Analysis menu, select Analysis Options.
The Analysis Options - Absolute Quantification dialog box appears.
4
If desired, click the Threshold text field, and type an initial threshold value to use for
the analysis of the plate document.
For more information about the threshold setting, see “Calculating Threshold
Cycles” on page A-10.
Note If no threshold is specified, the SDS software will automatically assign a
threshold value during the analysis.
5
If desired, set a default baseline for the analysis:
a. Click the Baseline Start text field, and type or dial an initial baseline to use for the
analysis of the plate document.
b. Click the Stop text field, and type or dial an stop baseline to use for the analysis
of the plate document.
Note If no baseline is specified, the SDS software will use the default baseline
range of cycles 3-15 for the analysis.
6
Set the baseline and threshold values for any remaining detectors present on the
plate as follows:
a. From the Detector drop-down list, select another detector.
b. Repeat steps 4 and 5 until the baseline and threshold values have been set for
each detector.
7
Click OK.
The software closes the dialog box and configures the analysis with new settings.
6-8 Real-Time Analysis
Analyzing the Run Once you have configured the analysis options, you can analyze the run data. During
the analysis, the software mathematically transforms the raw data to establish a
comparative relationship between the spectral changes in the passive reference dye
and those of the reporter dye. Based on that comparison, the software calculates a
cycle threshold (CT) for each reaction (standard and unknown). The software then
generates a standard curve for the run by plotting the standard samples on a graph of
CT versus initial copy number.
Note See Appendix A, “Theory of Operation,” for a detailed description of the SDS software
mathematical transformation of real-time run data.
To analyze the run:
Step
1
Action
Select all wells in the plate grid.
The software outlines the selected wells with a black line.
2
Choose one of the following:
♦ From the Analysis menu, select Analyze.
♦ From the toolbar, click the Analyze button (
).
The SDS software analyzes the run data and displays the results in the Results tab.
3
Set the baseline and threshold values for each detector on the plate as explained
on page 6-10.
Real-Time Analysis 6-9
Setting the Baseline Before calculating absolute quantification values, the baseline and threshold values
and Threshold must be set for all detectors present on the plate.
Values for the Run To set the baseline and threshold values for the run:
Step
1
Action
Click the Results tab.
The software displays the contents of the Results tabbed page.
2
If the Amplification Plot is not visible, click the Amplification Plot button (
).
The software displays the results of the sequence detection run in an amplification
plot of normalized reporter fluorescence (Rn) versus threshold cycle (CT).
3
From the Plot drop-down list, select Rn vs. Cycle.
The software plots the analyzed data in the graph of reporter fluorescence versus
cycle number.
4
Identify the components of the linear scale amplification plot and set the baseline so
that the amplification curve growth begins at a cycle number greater than the Stop
baseline cycle.
IMPORTANT Do not adjust the default baseline if the amplification curve growth
begins after cycle 15.
If the amplification plot looks like...
Then...
the amplification curve begins after the
maximum baseline (cycle 15).
Do not adjust the baseline.
the maximum baseline is set too high.
Decrease the Stop baseline value by
clicking and dragging the right carrot to an
earlier cycle.
the maximum baseline is set too low.
Increase the Stop baseline value by clicking
and dragging the right carrot to a later cycle.
6-10 Real-Time Analysis
To set the baseline and threshold values for the run:
Step
5
(continued)
Action
From the Plot drop-down list, select ∆Rn vs. Cycle.
The software plots the analyzed data in the graph of normalized reporter
fluorescence (∆Rn) versus cycle number.
6
Identify the components of the amplification curve and set the threshold so that it is:
♦ Above the background
♦ Below the plateaued and linear regions of the amplification curve
♦ Within in the geometric phase of the amplification curve
Plateau phase
Linear phase
Geometric phase
Threshold setting
(click and drag)
Rn
Background
Cycle
7
Baseline
Set the baseline and threshold for any remaining detectors present on the plate as
follows:
a. From the Detector drop-down list, and select another detector.
b. Repeat steps 3 to 6 until the baseline and threshold values have been set for
each detector.
8
Eliminate outliers from the analyzed run data as explained on page 6-12.
Real-Time Analysis 6-11
Eliminating Outliers For any PCR, experimental error may cause some wells to amplify insufficiently or not
at all. These wells typically produce CT values that differ significantly from the average
for the associated replicate wells. If included in the absolute quantification
calculations, these outliers can potentially result in erroneous measurements.
Visualizing Outliers
To ensure precise absolute quantification, replicate groups must be carefully
scrutinized for outlying wells. The CT vs. Well Position view of the Amplification Plot
allows you to examine each set of replicate wells for outliers.
To visualize the replicate groups for outlying amplification:
Step
1
Action
From the Plot drop-down list, select Ct vs. Well Position.
The SDS software displays the results data in a Well versus Threshold Cycle plot.
2
Verify the uniformity of each replicate population by comparing the groupings of
CT values for the wells that comprise the set.
Are outliers present?
Then...
Yes
a. Determine and record the well numbers of all
outlying wells.
b. Go to the next step.
No
3
go to the next step.
Check for remaining detectors present on the plate for outliers:
a. Click the Detector drop-down list, and select another detector.
b. Repeat step 2 until each detector has been checked for outliers.
4
If outliers are present in your data, eliminate them as explained below. Otherwise,
go on to “Viewing Results” on page 6-13.
Eliminating Wells from the Analysis
IMPORTANT If one or more wells are removed from use before a plate document has been
run, the SDS software will not collect data for those wells.
If you identified any outliers in the previous procedure, you must eliminate them from
the standard curve calculation before viewing the results.
To eliminate outliers from the calculations:
Step
1
Action
While pressing and holding the Ctrl key, click each well in the plate grid that you
identified as an outlier in the previous procedure.
The SDS software creates a black boarder around each cell as it is selected.
6-12 Real-Time Analysis
2
Click the Setup tab.
3
From the well inspector of the Setup tabbed page, uncheck the In Use check box.
4
From the Analysis menu, select Analyze.
5
Reapply the baseline and threshold values determined on page 6-10.
Viewing Results
Viewing the Displays the results of the absolute quantification calculation in the results table of the
Analysis Table plate document. The figure below shows an example of the results table containing
the data from a TaqMan RNase P Instrument Verification Plate.
Help button
Table elements:
Column
Displays
Position
The coordinate position of the well on the plate.
Sample Name
The sample name applied to the well.
Note See page 4-19 for information on applying sample names to the
plate document.
Detector
The name of the detector assigned to the well.
Note See page 4-7 for information on applying detectors to the plate
document.
Task
The task (NTC, Standard, or Unknown) assigned to the well.
Note See page 4-11 for information on applying detector tasks to the
plate document.
CT
The threshold cycle generated by the well during the PCR.
Quantity
♦ For wells containing Unknown samples, this column displays the
starting copy number for the well calculated by the software from the
standard curve.
♦ For wells containing Standard, this column displays the quantity
assigned to the well.
Note See page 4-11 for information on applying quantities to standard
wells of the plate document.
The following two columns contain data only if a well is run as part of a replicate group.
Qty Mean
The arithmetic mean for the quantity values of the replicate group
associated with the well.
Qty stddev
The standard deviation of the quantity values of the replicate group
associated with the well.
Real-Time Analysis 6-13
Viewing the The software displays the standard curve generated from the run data within the
Standard Curve Results tab of the plate document. The standard curve plot displays the unknown
samples on a graph of CT (threshold cycle) vs. initial quantity (LogN).
The following figure illustrates the components of the standard curve plot.
Help button
Detector drop-down list
Legend box
Hide Unknowns button
Standard Curve box
Standard curve plot
The following table describes the elements of an SDS plate document:
Component
Description
Help button
Launches the SDS software online help.
Detector menu
Toggles the data displayed within the plot based on detector name.
Legend box
Displays a symbol key for the datapoints appearing in the plot.
Hide Unknowns button
Toggles the presence of data from unknown samples in the plot.
Standard Curve box
Contains statistical data describing the standard curve.
Item
Definition
Slope
The slope of the standard curve.
The slope of the standard curve is useful for assessing the efficiency of the
assay. At 100% efficiency, a reaction should achieve a slope of −3.33 since
every 10-fold difference in quantity translates to a difference of 3.33 CTs.
Y Inter
The Y-axis intercept of the standard curve.
R2
The R Square value for the standard curve that describes the correlation
between threshold cycles (CT) and the log of the starting copy number for the
samples that comprise the standard curve plot. The calculation yields a value
between 1 and 0, where values closer to 1 indicate better correlation between
CT and the log of the starting copy number.
Note The software calculates the R Square value by taking the square of the
Pearson Coefficient of Correlation (also known as the r value) calculated for the
data points that comprise the plot. The software calculates the R2 value only
for the standards that make up the curve.
Standard curve plot
6-14 Real-Time Analysis
A scatterplot of datapoints from the absolute quantification run.
After the Analysis
Changing the Before printing or exporting the analyzed data, the software allows you to reconfigure
Plate Document the appearance of several elements of the plate document including the results table,
Display Settings plate grid, and most plots.
To configure the display settings for the plate document:
Step
Action
1
From the View menu, select Display Settings.
2
From the Display Settings dialog box, click the help button (
instructions on modifying the display settings.
) for further
Saving the The software allows you to save any changes made the display settings and/or
Plate Document analysis settings (baseline and threshold values) of the plate document.
To save the analyzed plate document, select Save from the File menu.
IMPORTANT The Save command saves does not save the results of the analysis, only the
analysis settings. Saved plate documents must be re-analyzed each time they are opened.
Printing a Report The SDS software can print a report of the analyzed data containing individual or
multiple elements of the plate document.
To print a report of the plate document data:
Step
Action
1
From the File menu, select Print Report.
2
From the Print Report dialog box, click the help button (
setting up, previewing, and printing the report.
) for instructions on
Exporting Plate Exporting Plate Document Data as a Tab-Delimited Text File
Document Data The SDS software can export raw or analyzed data in tab-delimited (*.txt) format for all
or a select group of wells on a plate document. The exported files are compatible with
most spreadsheet applications and programs that can read tab-delimited text.
To export run data as a tab-delimited text file, choose one of the following for further
instructions:
♦
See “Exporting Plate Document Data” on page B-9.
♦
Click the help button (
) within the table view.
Exporting Plots as Graphics
The SDS software can export most panes and plots of the plate document as JPEG
(Joint Photographic Experts Group) graphic files. The JPEG file format is compatible
with most word processing and spreadsheet applications and can be incorporated
directly into HTML documents for viewing by most web browser software.
To export a plot as a graphic file, see “Exporting Graphics” on page B-8 or click the
help button ( ) within the plot of interest for further instructions.
Real-Time Analysis 6-15
6-16 Real-Time Analysis
Section: Dissociation Curve Analysis
In This Section This section contains the following information:
Topic
See Page
Overview
6-18
Before You Begin
6-19
Analysis Checklist
6-20
Analyzing the Run Data
6-21
Determining Tm Values for the Analyzed Run
6-22
After the Analysis
6-24
Real-Time Analysis 6-17
Overview
About Dissociation The ABI PRISM 7900HT Sequence Detection System supports dissociation curve
Curve Analysis analysis of nucleic acids using SYBR® Green 1 double-stranded DNA binding dye
chemistry. The objective of dissociation curve analysis is to accurately determine the
melting temperature (Tm) of a single target nucleic acid sequence within an unknown
PCR sample. Typical uses of dissociation curves include detection of non-specific
products and primer concentration optimization.
Employing the Dissociation curve analysis on the 7900HT instrument is made possible through the
SYBR Green 1 Dye use of the fluorogenic SYBR Green 1 double-stranded DNA binding dye chemistry
(see page A-3). Dissociation curves are commonly performed following the PCR
stage of a SYBR Green experiment to screen for non-specific products. To generate
the data needed to create a curve, the 7900HT instrument performs a programmed
temperature ‘ramp’ in which it slowly elevates the temperature of the plate over
several minutes. The specific binding characteristic of the SYBR Green 1 Dye permits
the 7900HT instrument to monitor the hybridization activity of the nucleic acids
present in the sample. During the run, the instrument records the decrease in SYBR
Green fluorescence resulting from the dissociation of dsDNA.
Mathematical After the run, the SDS software processes the raw fluorescence data from the SYBR
Transformations Green 1 Dye to generate a more meaningful representation of the relationship
between spectral change and temperature for the dissociation curve run.
Multicomponenting and Normalization
The first mathematical transformation involves the conversion of the raw data,
expressed in terms of Fluorescent Signal vs. Wavelength, using the extracted pure
dye standards, to pure dye components. After the dye components have been
identified, the software determines the contribution of each dye in the normalized data
using the multicomponent algorithm (see “Multicomponenting” on page A-5 for a
complete description of the process). Finally, the software normalizes the data using
the component of the passive reference dye as shown below.
R ( SYBR )
R n = ---------------------------------------------R ( PassiveReference )
Derivation of Dissociation Curve Data
The SDS software then computes the first derivative of the normalized data (Rn) for
each reading taken by the 7900HT instrument during the temperature ramp. The
resulting derivative data (Rn´) is the rate of change in fluorescence as a function of
temperature (see below).
dR n
R n ′ = --------dT
The software plots the negative of the resulting derivative data on graph of -Rn´ versus
temperature (T) that visualizes the change in fluorescence at each temperature
interval. The Tm for the target nucleic acid can be determined from the graph by
identifying the maximum for the rate of change (displayed as a peak) for the
appropriate amplification curve.
6-18 Real-Time Analysis
Example Results The following figure illustrates a typical dissociation curve from an experiment run to
detect non-specific amplification in cDNA samples.
-6.0
Primer Dimer
Tm = 74.9 °C
-5.0
Main Product
Tm = 80.5 °C
-Rn
-4.0
-3.0
-2.0
-1.0
0.0
60
65
70
75
80
Temperature (°C)
85
90
95
The plot above displays the dual amplification peaks typical of primer-dimer formation.
The amplification from the specific product is displayed with a Tm of 80.5 °C, while the
primer-dimer product has a characteristically lower Tm of 74.9 °C.
Before You Begin
Using SDS For specific instructions on any procedure described within this section, refer to the
Online Help online help accompanying the SDS software. To get help at any time during the
procedure, click a help button (
you are working.
) located within the dialog box or window in which
Examples in This The illustrations and screenshots that appear within this chapter were created from a
Chapter plate run to determine the purity of a β-actin amplification in unknown samples. Each
well of the plate contains SYBR Green 1 dye, forward and reverse primers, and
genomic DNA known to contain complimentary binding sites.
Real-Time Analysis 6-19
Analysis Checklist
Where You Are in The following checklist illustrates your current position in the overall procedure:
the Procedure
Done
Step
✓
1
Create an absolute quantification plate document.
4-6
✓
2a
a. Create detectors for the absolute quantification probes.
4-7
✓
3a
✓
✓
4
5
Procedure
See Page
b. Copy the detectors to the plate document.
4-8
a. Configure the plate document with detector tasks
(NTC, Standard, and Unknown).
4-11
b. Assign quantities to the wells of the plate document that
contain standards.
4-12
a. Program the method for the absolute quantification run.
4-13
b. Add a temperature ramp to the thermal profile.
4-16
Choose from the following:
If running…
Then…
a single plate
continue to step 7.
the first plate in a series
of plates with identical
assay configurations
Save the plate document as an ABI PRISM
SDS Template Document as explained on
page 4-17.
✓
6
Create a plate document from the template created in
step 5.
4-18
✓
7
Configure the document with sample names and plate
information.
4-19
✓
8
Prepare and run the dissociation curve plate or plates.
4-20
9
Analyze the run data.
6-21
10
View the results of the dissociation curve analysis.
6-22
11
Determine melting temperature (Tm) values for the derivative
peaks.
6-23
12
Choose from the following post-analysis options:
6-24
♦ Reanalyze the run data.
♦ Adjust the display settings for the results table, plate grid,
and plate document plots.
♦ Print elements of the plate document.
♦ Export the plate document results table or plots.
a. Steps 2 and 3 can be eliminated by importing the plate document setup information from a tab-delimited
text file. See “Importing Plate Document Setup Table Files” on page B-2 for more information.
6-20 Real-Time Analysis
Analyzing the Run Data
Analyzing the Run The run data from a temperature ramp can be analyzed immediately following the
completion of the run. For an explanation of how the software manipulates the raw
data, see “Algorithmic Manipulation of Raw Data” on page 6-5.
To analyze the run:
Step
Action
1
If not already open, launch the SDS software as explained on page 4-5.
2
Open the plate document file for analysis as follows:
a. From the File menu, select Open.
b. From the File Type drop-down list, select ABI PRISM SDS Single Plate (*.sds).
c. From the Look in text field, navigate to and select the plate document file.
d. Click Open.
The SDS software displays the plate document file.
3
Select all wells in the plate grid.
The software outlines the selected wells with a black line.
4
Choose one of the following:
♦ From the Analysis menu, select Analyze.
♦ From the toolbar, click the Analyze button (
).
The software analyzes the run data and displays the results in the Dissociation
Curve tab.
5
Determine the Tm for the dissociation curves displayed within the Dissociation
Curve tabbed page as explained on page 6-23.
Real-Time Analysis 6-21
Determining Tm Values for the Analyzed Run
Viewing Analyzed The SDS software displays the results of the dissociation curve analysis within the
Dissociation Curve Dissociation Curve tab of the plate document. The tab displays the analyzed data in a
Data graph of the negative of the derivative (-Rn´) versus temperature (T) that visualizes the
change in fluorescence at each temperature interval during the ramp.
Note The plot displays data from the selected wells of the plate grid. If you do not see
dissociation curve data, select the wells of the plate grid containing the SYBR Green reactions.
The following figure illustrates the components of the Dissociation Plot.
Dissociation Curve tab
Dissociation Plot
Dissociation curves
Tm display and slider
Step drop-down list
Plot drop-down list
Detector drop-down list
The following table describes the elements of the Dissociation Plot:
Component
Description
Dissociation Plot
The plot displays data from the selected wells in the plate grid.
Note The properties of the Dissociation Plot are adjustable. For
more information on adjusting the appearance of the plot, click the
help button ( ) and see the SDS software online help.
Step drop-down
list
Chooses the data displayed within the plot based on the ramp.
If a plate document contains data from more than one temperature
ramp, the Step drop-down list allows you to displays the data from
each by selecting the position of the ramp in the thermal profile.
Tm display and
slider
The SDS software displays the Tm below the green slider (see above).
There are two definitions for the Tm value:
♦ The chemical definition is the temperature at which 50% of the DNA
is in a double-stranded configuration.
Tm
6-22 Real-Time Analysis
♦ The mathematical definition is the maximum value for the first
derivative curve within a specific peak.
The following table describes the elements of the Dissociation Plot:
(continued)
Component
Description
Plot drop-down list
Chooses the data displayed within the plot based on the derivative
calculation. The list offers the following selections:
♦ Raw – When selected, this option plots the normalized reporter
fluorescence data (Rn) on a graph of fluorescence vs. temperature
(see below left).
♦ Derivative – When selected, this option plots derivative data (Rn´)
on a graph of the derivative vs. temperature (see below right). The
derivative data is the negative of the rate of change in fluorescence
as a function of temperature.
The following figures show the plots accessible from the Plot drop-down list.
Raw Plot
Derivative Plot
Chooses the data displayed within the plot based on detector name.
Detector
drop-down list
Determining To determine the Tm value of a melting curve within the Dissociation Plot:
Tm Values
Step
1
Action
Move the mouse pointer over the green Tm line located on the Y-axis line of the plot.
The mouse pointer becomes a hand.
2
Click and drag the Tm line to the maximum point of the derivative plot of interest.
The SDS software displays the Tm for the curve below the Tm line.
Tm display and slider
Note The apex of the curvature of represents the maximum rate of change in
normalized fluorescence.
Real-Time Analysis 6-23
After the Analysis
Changing the Before printing or exporting the analyzed data, the software allows you to reconfigure
Plate Document the appearance of several elements of the plate document including the results table,
Display Settings plate grid, and most plots.
To configure the display settings for the plate document:
Step
Action
1
From the View menu, select Display Settings.
2
From the Display Settings dialog box, click the help button (
instructions on modifying the display settings.
) for further
Saving the The software allows you to save any changes to the appearance of the plate
Plate Document document, however it does not save the threshold or baseline values made during the
analysis. To save the plate document, select Save from the File menu.
Printing a Report The SDS software can print a report of the analyzed data containing individual or
multiple elements of the plate document.
To print a report of the plate document data:
Step
Action
1
From the File menu, select Print Report.
2
From the Print Report dialog box, click the help button (
setting up, previewing, and printing the report.
) for instructions on
Exporting Plate Exporting Plate Document Data as a Tab-Delimited Text File
Document Data The SDS software can export raw or analyzed data in tab-delimited (*.txt) format for all
or a select group of wells on a plate document. The exported files are compatible with
most spreadsheet applications and programs that can read tab-delimited text.
To export run data as a tab-delimited text file, choose one of the following for further
instructions:
♦
See “Exporting Plate Document Data” on page B-9.
♦
Click the help button (
) within the table view.
Help button
Exporting Plots as Graphics
The SDS software can export most panes and plots of the plate document as JPEG
(Joint Photographic Experts Group) graphic files. The JPEG file format is compatible
with most word processing and spreadsheet applications and can be incorporated
directly into HTML documents for viewing by most web browser software.
To export a plot as a graphic file, see “Exporting Graphics” on page B-8 or click the
help button ( ) within the plot of interest for further instructions.
6-24 Real-Time Analysis
System Maintenance
7
7
In This Chapter This chapter discusses the following topics:
Topic
See Page
Recommended Maintenance Schedule
7-2
Section: Maintaining the 7900HT Instrument
7-3
Replacing the Sample Block
7-4
Changing the 7900HT Plate Adapter
7-9
Decontaminating the Sample Block
7-11
Performing a Background Run
7-13
Performing a Pure Dye Run
7-17
Adding Custom Dyes to the Pure Dye Set
7-21
Verifying Instrument Performance Using a TaqMan RNase P Plate
7-24
Section: Maintaining the Plate Handler
7-27
Adjusting the Sensitivity of the Plate Sensor Switch
7-28
Aligning the Plate Handler
7-32
Aligning the Fixed-Position Bar Code Reader
7-40
Cleaning and Replacing Gripper Finger Pads
7-43
Section: Maintaining the Computer and SDS Software
7-45
General Computer Maintenance
7-46
Maintaining the SDS software
7-48
System Maintenance 7-1
Recommended Maintenance Schedule
Maintenance The following table includes a list of tasks that should be performed on the
Schedule ABI PRISM® 7900HT Sequence Detection System regularly.
Interval
Task
Weekly
Archive SDS Files
7-46
Perform a Background Run
7-13
Check (and if necessary replace) Gripper Finger Pads
7-43
Defragment the Computer Hard Drive
7-47
Monthly
Semi-Annually
Perform a Pure Dye
See Page
Runa
Check Applied Biosystems Web Site for Software Updates
a. Perform a background run prior to each Pure Dye Run.
7-2 System Maintenance
7-17
7-48
Section: Maintaining the 7900HT Instrument
In This Section This section contains the following information:
Topic
See Page
Replacing the Sample Block
7-4
Changing the 7900HT Plate Adapter
7-9
Decontaminating the Sample Block
7-11
Performing a Background Run
7-13
Performing a Pure Dye Run
7-17
Adding Custom Dyes to the Pure Dye Set
7-21
Verifying Instrument Performance Using a TaqMan RNase P Plate
7-24
System Maintenance 7-3
Replacing the Sample Block
When to Perform IMPORTANT Before changing the sample block, perform all required upgrades to the SDS
software and instrument firmware. Failure to update the software can render the instrument
inoperable or result in damage to instrument components.
You will need to remove the 7900HT instrument sample block, when:
♦
Decontaminating the wells of the sample block (see page 7-11)
♦
Changing sample block formats
IMPORTANT Always run a background plate after installing the sample block.
Sample Block Unless instructed to do otherwise, adhere to the following guidelines when
Installation exchanging sample block modules of different formats:
Checklist To install a sample block module:
Step
Procedure
See Page
1
Perform all required software and firmware upgrades to the ABI PRISM
7900HT Sequence Detection System.
7-48
2
Remove the existing sample block.
7-5
3
Install the new sample block.
7-7
4
Change the plate adapter.
7-9
5
Run a background plate to check the sample block for contamination.
7-13
If changing block
formatsa
or if installing a new block, also perform the following…
6
Run a pure dye plate to create the pure spectra calibration values for
the new format.
7-17
7
Run an TaqMan® RNase P Instrument Verification Plate to confirm the
proper operation of the sample block.
7-24
If using an automation accessory, also perform the following…
8
If changing consumable formatsa, adjust the plate sensor switch on
the plate handler arm for the new plates.
7-28
9
Align the Zymark® Twister™ Microplate Handler fixed-position bar
code reader for the new plate format.
7-32
Note It is necessary to align the plate handler to only the Instrument
position (Zymark position 2) as explained on pages 7-32 to 7-35.
10
Align the fixed-position bar code reader for the new plate format.
7-40
a. For example, when replacing a 384-well sample block with a 96-well block
Materials Required The procedure below requires the use of the following materials:
Material
7-4 System Maintenance
Part Number
Replacement Sample Block (if replacing the sample block)
—
5/32 inch Hex key (necessary only for certain instruments)
—
5/16 inch Hex key (some instruments may require a crescent wrench)
—
Handling the The interchangeable sample blocks are delicate pieces of equipment containing
Sample Block several fragile components that can break if handled improperly. The figure below
illustrates the correct locations for handling the interchangeable sample block module.
Circuitry and connections to
the instrument (Do Not Touch)
GR2028
Heat sinks
Hold sample block module from the sides
(Bottom of module)
Removing the To remove the sample block:
Sample Block
Step
1
Action
Launch the Automation Controller Software and perform the following tasks:
a. Click the Thermal Status tab, and confirm the function of the current module. The
module is operating normally if the software is receiving a temperature reading.
b. Click Open/Close to rotate the instrument tray to the OUT position.
2
From the File menu, select Exit to close the Automation Controller Software.
3
Turn off and unplug the 7900HT instrument.
! WARNING PHYSICAL HAZARD. The instrument must be unplugged and
turned off at all times during the following procedure. Failure to comply can result in
serious physical injury to the user or damage to the instrument.
4
Wait 20–30 min for the heated cover to cool.
! CAUTION PHYSICAL HAZARD. During instrument operation, the temperature
of the sample block can be as high as 100 °C. Before performing this procedure,
wait until the sample block reaches room temperature.
If the instrument tray is in the OUT position (outside of the instrument), push it into
the instrument to provide an open work space.
6
If using a Zymark Twister Microplate Handler remove the covers for the
fixed-position bar code reader and the underlying platform.
GR2009
5
Push the instrument tray within the instrument, and remove the thermal cycler
access cover to permit access to the sample block.
Note The thermal cycler access cover is secured to the instrument by non-locking
pins and may require force to remove it (no tools are required).
GR2023b
7
Fixed-position bar code reader
and underlying platform covers
System Maintenance 7-5
To remove the sample block:
Step
8
(continued)
Action
Using a 5/16 inch Hex key, turn the sample block locking bolt counter-clockwise
until it is very loose, but still attached to the sample block locking bar.
GR2024
Note Some instruments may require the use of an adjustable crescent wrench to
loosen the sample block locking bolt.
Sample block locking bar
Sample block locking bolt
GR2025b
Loosen the thumb screw securing the sample block locking bar to the instrument
chassis (may be a 5/32 Hex bolt on some instruments).
GR2024b
9
Thumb screw
Lift the sample block locking bar up and out of the instrument.
11
Remove the sample block from the instrument as follows:
GR2025b
10
GR202
a. Rotate the release lever at the base of the sample block 90 degrees.
GR2027
b. Being careful of the cooling fins on the bottom of the sample block, slide the
sample block out of the instrument and place it on a clean, level surface.
7-6 System Maintenance
Replacing the IMPORTANT Before changing the sample block, perform all required upgrades to the SDS
Sample Block software and instrument firmware. Failure to upgrade the software can render the instrument
inoperable or result in damage to instrument components.
To replace the sample block:
Step
1
Action
Load the sample block into the instrument compartment as follows:
a. Being careful of the heat sinks on the bottom of the sample block, rest the
sample block on the metal runners on either side of the instrument bay.
GR2027
b. Carefully slide the sample block into the instrument until the front of the block is
flush with the rear of the locking bar.
c. Once seated, firmly press on the sample block to ensure a good connection.
Replace the sample block locking bar.
3
Tighten the thumb screw (from step 9 on page 7-6) to secure the sample block
locking bar to the instrument chassis (may be a 5/32 Hex bolt).
4
Using the 5/16 Hex key, turn the sample block locking bolt clockwise until it is flush
with the locking bar.
5
Again, press on the right and left sides of the front surface of the sample block to
ensure that it is seated securely.
6
Replace the thermal cycler access cover as follows:
GR2025b
2
a. Fit the lip at the bottom of the access cover over the lower edge of the bay.
GR2023b
b. Push the cover towards the instrument until it snaps into place.
System Maintenance 7-7
To replace the sample block:
Step
Action
If using a plate handler, replace the covers for the fixed-position bar code reader
and the underlying platform (removed in step 6 on page 7-5).
GR2009
7
(continued)
Fixed-position bar code reader
and underlying platform covers
8
Plug in and turn on the 7900HT instrument.
9
Confirm the function of the installed sample block module as follows:
a. Launch the Automation Controller Software.
b. Click the Thermal Status tab.
Does the software
display temperatures?
Then…
Yes
the installation is successful.
The presence of temperature readings confirm that
the 7900HT instrument successfully established the
connection to the new sample block.
No
the 7900HT instrument is unable to establish
communication with the new sample block.
To troubleshoot the problem:
a. Turn off and unplug the 7900HT instrument.
b. Remove the thermal cycler access cover.
c. Press on the right and left sides of the front plate
of the sample block to ensure that it is seated
securely.
d. Reinstall the thermal cycler access cover.
e. Repeat step 8 until you hear a high-pitched tone
confirming communication between the
instrument and sample block.
10
Once the sample block is loaded into the instrument do the following:
a. Perform a background run (see page 7-13) to verify that the sample block:
– Is connected and working properly
– Contains no contaminants that will interfere with fluorescent detection
b. If changing sample block formats, perform any remaining tasks outlined in the
“Sample Block Installation Checklist” on page 7-4.
7-8 System Maintenance
Changing the 7900HT Plate Adapter
When to Perform Remove and replace the 7900HT instrument plate adapter after changing the sample
block module format (for example, replacing a 384-well sample block module with a
96-well version).
Note The sample block must be used with the corresponding plate adapter of the same plate
format.
Materials Required The procedure below requires the use of the following materials:
Material
Part Number
One of the following:
See page D-3
♦ 384-Well Plate Adapter
♦ 96-Well Plate Adapter
3/32 inch Hex key
—
Changing the Plate To replace the 7900HT instrument plate adapter:
Adapter
Step
1
Action
If the instrument tray is inside the 7900HT instrument, move the instrument tray to
the OUT position as follows:
a. Launch the SDS software.
b. From the File menu, select New.
The New Document dialog box appears.
c. Click OK.
The software generates a plate document.
d. Click the Instrument tab.
e. From the Real-Time tab of the Instrument tabbed page, click Open/Close.
The instrument tray rotates to the OUT position.
f. From the File menu, select Exit.
The SDS software exits.
2
Remove the four screws attaching the plate holder to the plate arm.
Unscrew
1
2
3
4
5
6
7
8
9 10 11 12 13 14 15 16 17 18 19 20 21 22 23 24
A
B
C
D
E
F
G
H
I
J
K
L
M
N
O
P
Unscrew
3
Remove the plate adapter from the instrument tray.
Note If changing sample block formats (for example, replacing a 384-well sample
block with a 96-well version), store the plate adapter with the sample block module
of the same format.
System Maintenance 7-9
To replace the 7900HT instrument plate adapter:
Step
4
(continued)
Action
Place the new plate adapter into the instrument tray with the A1 label in the rear-left
corner (see below).
IMPORTANT Make sure to install the correct version of the plate adapter (384- or
96-well) for the plate format you intend to use. The plate adapters are labeled for
the consumable format they support.
Well A1
1
2
3
4
5
6
7
8
9 10 11 12 13 14 15 16 17 18 19 20 21 22 23 24
A
B
C
D
E
F
G
H
I
J
K
L
M
N
O
P
5
Label (384- or 96-well)
Replace and tighten the four screws in the order shown below:
3
1
1
2
3
4
5
6
7
8
9 10 11 12 13 14 15 16 17 18 19 20 21 22 23 24
A
B
C
D
E
F
G
H
I
J
K
L
M
N
O
P
2
4
IMPORTANT The order in which the screws are tightened is important to ensure
proper alignment of the plate to the sample block within the 7900HT instrument.
7-10 System Maintenance
Decontaminating the Sample Block
When to Perform The following procedure describes how to decontaminate the wells of a sample block
module. The procedure will eliminate residual PCR related products, including
fluorescent labeled TaqMan® probes. Clean the sample block as often as needed.
IMPORTANT If preforming a cleaning or decontamination method other than the one in this
manual, check with Applied Biosystems first to ensure that the method will not damage the
sample block module or the 7900HT instrument.
Materials Required The cleaning procedure requires the following materials:
Material
Part Number
Cotton swabs
—
10% Sodium hypochlorite (bleach) solution
—
Isopropanol, 100 percent pure
—
5/32 in Hex key
—
! WARNING CHEMICAL HAZARD. Sodium hypochlorite (bleach) is a liquid disinfectant
that can be corrosive to the skin and can cause skin depigmentation. Please read the MSDS,
and follow the handling instructions. Wear appropriate protective eyewear, clothing, and gloves.
! WARNING CHEMICAL HAZARD. Isopropanol is a flammable liquid and vapor. It may
cause eye, skin, and upper respiratory tract irritation. Prolonged or repeated contact may dry
skin and cause irritation. It may cause central nervous system effects such as drowsiness,
dizziness, and headache, etc. Please read the MSDS, and follow the handling instructions.
Wear appropriate protective eyewear, clothing, and gloves.
System Maintenance 7-11
Cleaning the Sample To clean the sample block wells:
Block Wells
Step
1
Action
Identify the contaminated wells as follows:
a. If not already run, perform a background run as explained on page 7-13.
b. Identify the contaminated wells on the sample block by following the procedure,
“Isolating Sample Block Contamination” on page 8-8.
2
Remove the sample block from the 7900HT instrument as explained in “Removing
the Sample Block” on page 7-5.
3
Using the following figure as a guide, locate the suspected contaminated wells on
the sample block.
Circuitry and connections to
the instrument (Do Not Touch)
Warning
GR2028
Well A-1
4
Pipet the appropriate volume of 10% bleach solution into each suspected
contaminated well of the sample block module.
♦ For a 96-well sample block, pipet 150 µL bleach solution to each well.
♦ For a 384-well sample block, pipet 40 µL bleach solution to each well.
5
Allow the sample block to sit for 3-5 min.
6
Using a pipet, remove the bleach solution from the wells of the sample block.
7
Rinse (pipet and remove) each contaminated well with 3 treatments of deionized
water at the appropriate volume for the sample block.
♦ For a 96-well sample block, rinse affected wells with 150 µL deionized water.
♦ For a 384-well sample block, rinse affected wells with 40 µL deionized water.
Note
7-12 System Maintenance
Absolute isopropanol can be substituted for water in the third treatment.
8
Remove any remaining isopropanol or water from the wells of the sample block
module.
9
Replace the sample block as explained in “Replacing the Sample Block” on
page 7-7.
10
Run a background plate to confirm that the contamination has been removed.
Performing a Background Run
When to Perform Applied Biosystems recommends running a background plate weekly or as often as
necessary depending on instrument use.
Purpose of A background run measures the ambient fluorescence in a background plate
Background Runs containing deionized water. During the run, the 7900HT instrument conducts a
continuous scan of the plate for 2 minutes at 60 °C. Afterwards, the SDS software
averages the spectrum recorded during the run and is used to extract the resulting
spectral component to a calibration file. The software uses the calibration file during
subsequent runs to remove the background signal from the run data.
Because the background signal can change with instrument age, Applied Biosystems
recommends regenerating the Background component calibration every month.
Note Background runs can also be used to detect and troubleshoot sample block
contamination.
About the Fluorescence collected by the ABI PRISM 7900HT Sequence Detection System
Background includes a “background” component, a fluorescent signal that is inherent to the
Component system. The background component is a composite signal found in all spectral data
that consists of fluorescence from several sources including: the background
electronic signal, the sample block, the water within the consumable, and the plastic
consumable itself. Because the background signal can interfere with the precision of
SDS data, the 7900HT instrument has been engineered to minimize the background
signal. Additionally, the SDS software also algorithmically eliminates the background
signal from each fluorescent sample to maximize the instrument’s sensitivity (see
page A-5).
Materials Required The following materials are required to perform a background run:
Material
Part Number
One of the following:
♦ Background Plate included in a ABI PRISM Sequence Detection
Systems Spectral Calibration Kit, or
♦ Make a background plate (requires the following)
– ABI
PRISM®
See page D-4
Optical 394- or 96-Well Reaction Plate
– ABI PRISM® Optical Adhesive Cover or ABI PRISM Optical Flat Caps
– Pipettor, 100-µL (with pipet tips)
Centrifuge, with plate adapter
—
System Maintenance 7-13
Prepare a To prepare a plate document for the background run:
Background Plate
Step
Action
Document
1
Launch the SDS software.
2
From the File menu, select New.
The New Document dialog appears.
3
Configure the New Document dialog box as follows:
Drop-Down List
Select
Assay
Background
Container
<the appropriate plate format>
Template
Blank Template
4
If the background plate is labelled with a bar code, click the Barcode text field and
scan the bar code number using the hand-held bar code reader.
5
Click OK.
The software creates a plate document with the attributes for a background run.
Note Do not modify the background plate document. The method for a
Background run is hard-coded into the SDS software and consists of a single hold
at 60 °C for 2 min. Because the plate contains only deionized water, the plate
document does not require sample or detector labels.
6
Save the plate document as follows:
a. From the File menu, select Save.
The Save dialog appears.
b. Click the File name text field, and type Background_<date in MMDDYY format>.
For example, the file name for a background plate run on May 31, 2001 would
be: Background_053101
c. Click Save.
The software saves the plate document. The software is now configured for the
Background run.
7
7-14 System Maintenance
Prepare and run the plate as explained on page 7-15.
Preparing and To conduct the background run:
Running a
Step
Action
Background Plate
1
Choose from the following:
If using…
Then…
a background plate from a
Spectral Calibration Kit
Remove the plate from the freezer and allow it to
thaw to room temperature.
an ABI PRISM Optical
Reaction Plate
a. Pipet deionized water to each well of the plate.
– If using a 384-well plate, add 20 µL per well.
– If using a 96-well plate, add 50 µL per well.
b. Seal the plate using an optical adhesive cover
or optical flat caps.
2
Briefly centrifuge the background plate.
3
Load the background plate into the 7900HT instrument as follows:
a. From the plate document in the SDS software, click the Instrument tab.
b. From the lower portion tab, click the Real-Time tab.
c. From the Real-Time tab of the Instrument tabbed page, click Open/Close.
d. Place the background plate into the instrument tray as shown below.
Well A1
PECY001DL3
Note
4
Position the plate so that the
bar code faces towards the
front of the instrument
The A1 position is located in the top-left side of the instrument tray.
Click Start.
The 7900HT instrument begins the background run.
Note Before starting the run, the instrument may pause (up to 15 min) to heat the
heated cover to the appropriate temperature.
5
When the background run is complete and the Run Complete dialog box appears:
a. Click OK to close the dialog box.
b. Click Open/Close, and remove the background plate from the instrument tray.
c. Extract the background component as explained on page 7-16.
System Maintenance 7-15
Extracting the In this procedure you will extract the calibration values from the background plate
Background document. Once extracted, the SDS software stores the data as part of the calibration
file located in the Calibration subdirectory of the SDS 2.0 directory.
To extract the background component from the run data:
Step
1
Action
From the Analysis menu, select Extract Background.
The software attempts to extract the background signal and displays the success of
the extraction in a dialog box.
Dialog Box
Then...
the run is successful
The raw spectra read from
the Background plate
conform to acceptable limits.
Proceed to step 3.
the run is unsuccessful.
The software has stopped
the extraction because one
or more raw spectra exceed
2500 FSU.
Troubleshoot and decontaminate the sample block as explained in “Background Runs” on
page 8-8.
2
From the File menu, select Save.
The software saves the plate document.
3
From the File menu, select Close.
The software closes the plate document.
7-16 System Maintenance
Performing a Pure Dye Run
When to Perform Applied Biosystems recommends performing spectral calibration:
♦
Every 6 months depending on instrument use
♦
After changing sample block formats (see page 7-4)
IMPORTANT Always run a background plate before performing a Pure Dye calibration.
Purpose of Pure Dye Pure dye data is generated from the results of a pure dye run in which the SDS
Runs software collects spectral data from a set of dye standards during a 2-min hold at
60 °C. The software stores the spectral information for the pure dye standards within a
calibration file located in the SDS directory. After the run, the software extracts each
component dye spectrum from the collected data in the pure spectra run file.
IMPORTANT Because the age and use of instrument components can affect pure spectra
readings, Applied Biosystems recommends updating the pure spectra data files once or twice
annually depending on instrument use.
Components of the The ABI PRISM 7900HT Sequence Detection System monitors fluorescent signals
Pure Dye Spectra generated by several dyes FAM™, NED™, ROX™, SYBR®, TAMRA™, TET™, and
VIC™. The figure below compares the pure spectra for each dye.
1 2 3
4
5 6
7
Dye
Peak (nm)
1
FAM
2
SYBR
~520
3
TET
~540
VIC
~550
JOE
~550
5
NED
~570
6
TAMRA
~580
7
ROX
~610
4
~520
Note The 7900HT instrument supports the detection of custom pure dyes (dyes other than
those provided by Applied Biosystems). To add custom pure dyes to the Pure Dye set for your
instrument, see “Adding Custom Dyes to the Pure Dye Set” on page 7-21.
After a run, the SDS software receives run data in the form of a raw spectra signal for
each reading. To make sense of the raw data, the software must determine the
contribution of each fluorescent dye used in the sample through a process called
multicomponenting (see page A-5). The software accomplishes the separation by
comparing the raw spectra with a set of pure dye standards contained within a
calibration file. When a plate document is saved after analysis, the software stores the
pure spectra information with the collected fluorescent data for that experiment.
System Maintenance 7-17
Materials Required The following materials are required to perform a pure dye run:
Material
Part Number
Sequence Detection Systems Spectral Calibration Kit
384-Well Version
See page D-3
96-Well Version
Pure Dye Platea,b
Product
—
Insertb
—
Centrifuge, with plate adapter
—
a. The 96-Well version of the Spectral Calibration Kit contains 2 Pure Dye plates.
b. Included with the Sequence Detection Systems Spectral Calibration Kit.
Preparing a IMPORTANT A background run must be performed prior to running a pure dye plate. See
Pure Dye Plate “Performing a Background Run” on page 7-13 for more information.
Document
To prepare a plate document for the pure dye run:
Step
Action
1
Remove the pure dye plate from the freezer, place it aside to thaw to room
temperature, and return to the computer.
2
Launch the SDS software.
3
From the File menu, select New.
The New Document dialog appears.
4
Select the following options from the menus within the New Document dialog box.
From…
Select…
Assay
Pure Dyes
Container
<Select the appropriate plate format>
Template
♦ For a 384-Well Pure Dye Run, select
384 Well Pure Dyes Plate.sdt.
♦ For 96-Well Pure Dye Runs, select the template matching the
Pure Dye plate you intend to run.
– To run Plate 1 (containing FAM, JOE, NED, and ROX), select
96 Well Pure Dyes Plate 1.sdt.
– To run Plate 2 (containing SYBR, TAMRA, TET, and VIC),
select 96 Well Pure Dyes Plate 2.sdt.
Note If no templates are available, construct a Pure Dye plate
document using the product insert from the Sequence Detection
Systems Spectral Calibration Kit and the procedure on page 7-22.
5
Remove the pure dye plate from its packaging.
6
Click the Barcode text field, and scan the bar code number using the hand-held bar
code reader.
7
Click OK.
The software displays a plate document with the attributes for a pure dye run.
7-18 System Maintenance
To prepare a plate document for the pure dye run:
Step
8
(continued)
Action
Save the Pure Dye plate document as follows:
a. From the File menu, select Save.
b. From the Files of type drop-down list, select ABI PRISM SDS Single Plate (*.sds).
c. From the Save dialog, click the File name text field, and choose from the
following:
Plate Format
Type…
384-Well
PureDye_<date in MMDDYY format>
For example, the file name for a plate run on May 31, 2001
would be: PureDye_053101.
96-Well
PureDye_Plate<plate number>_<date in MMDDYY format>
For example, the file name for a Pure Dye Plate 1 run on
May 31, 2001 would be: PureDye_Plate1_053101.
d. Click Save.
The software saves the plate document.
9
Prepare and run the pure dye plate as explained below.
Preparing and IMPORTANT A background run must be performed prior to running a pure dye plate. See
Running the “Performing a Background Run” on page 7-13 for more information.
Pure Dye Plate
To prepare the pure dye run:
Step
Action
1
Briefly centrifuge the pure dye plate.
2
Load the pure dye plate into the 7900HT instrument as follows:
a. From the plate document in the SDS software, click the Instrument tab.
b. From the Real-Time tab in the Instrument tabbed page, click Open/Close.
The instrument tray rotates to the OUT position.
c. Place the pure dye plate into the instrument tray.
Note
3
The A1 position is located in the top-left side of the instrument tray.
Click Start.
The 7900HT instrument begins the pure dye run. The method for a pure dye run is
hard-coded into the software and consists of a single 2-min hold at 60 °C.
Note Before starting the run, the instrument may pause (up to 15 min) to heat the
heated cover to the appropriate temperature.
4
When the pure dye run is complete and the Run Complete dialog box appears:
a. Click OK to close the dialog box.
b. Click Open/Close, and remove the pure dye plate from the instrument tray.
c. Extract the pure dye calibration information as explained on page 7-20.
System Maintenance 7-19
Extracting Pure Dye The purpose of viewing the data in the Pure Dye Wizard is to eliminate irregular pure
Information from dye peaks from the data set. The wizard presents the spectral data from the pure dye
the Analyzed Run plate in sets of three wells, each containing the same pure dye. Because the wells
displayed by the wizard contain the pure dye at an identical concentration, the signal
peaks for the set should be identical. Occasionally, pipetting inaccuracies or
contamination can cause a well signal to shift slightly. While viewing the data, the
outlying peaks must be eliminated.
To extract the pure dye information from the run data:
Step
1
Action
From the Analysis menu, select Extract Pure Dye Wizard.
The Extract Pure Dye Wizard dialog appears.
2
Follow the instructions as explained by the Extract Pure Dye Wizard to extract the
pure dye spectra.
When presented with each screen, do the following:
a. Inspect the spectra for shifts in peak location.
Wavelength
shift
Click here
to remove it
b. If the data set contains a outlying peak, eliminate it by clicking check box of the
associated well.
Note Dye spectra are generally acceptable if they peak at the same location as
their group but diverge slightly at other wavelengths.
c. Click Next to view the next three wells.
d. Repeat steps a to c for all remaining wells until prompted with a message
reporting the extraction of the pure dyes.
The software extracts the pure spectra and stores the data as a component of the
calibration file.
3
From the File menu, select Save.
The software saves the plate document.
4
From the File menu, select Close.
The software closes the plate document.
5
7-20 System Maintenance
If performing spectral calibration of a 96-well block module, repeat the previous
procedures on pages 7-18, 7-19, and 7-20 to run the second Pure Dye plate.
Adding Custom Dyes to the Pure Dye Set
When to Perform The ABI PRISM 7900HT Sequence Detection System can be used to run assays
designed with custom dyes (dyes not manufactured by Applied Biosystems).
However, before using custom dyes with the 7900HT instrument, you must create and
run a custom pure dye plate.
Materials Required The following materials are required to perform a pure dye run:
Material
Part Number
ABI PRISM Optical 394- or 96-Well Reaction
Platea
See page D-3
ABI PRISM Optical Adhesive Cover or ABI PRISM Optical Flat Caps
Custom Dye(s)
—
Pipettor, 100-µL (with pipet tips)a
—
Centrifuge, with plate adaptor
—
a. Used to add custom dyes to the Dye Set.
Creating a Custom Note The purpose of the custom pure dye plate is identical to that of an ABI PRISM Pure Dye
Pure Dye Plate Plate. The SDS software uses the custom plate to create a spectral standard for
multicomponenting the custom dye.
To create a pure dye plate for custom dyes:
Step
Action
1
Prepare a microplate with a dilution series of the custom dye.
2
Launch the SDS software.
3
Create an allelic discrimination plate document and run the dilution series plate.
Note It is not necessary to configure detector, sample, and method information
for the dilution series plate document. The purpose of the run is to establish the
correct working concentration for the dye by viewing the intensity of the raw spectra
produced by the wells in the dilution series.
4
From the Analysis menu, select Analyze.
The software analyzes the raw run data,
5
Click the Show Raw Data Plot button (
) from the Display toolbar.
The software displays the Raw Data Plot.
6
From the raw spectra, determine the highest concentration of dye that does not
produce a saturated signal, and record it for future use.
Note Saturated signals are characterized by their high peaks that rise beyond
detectable levels (> 65,000 fluorescent units) and appear as plateaus on the Raw
Data plot.
The concentration of the custom dye that yields the highest possible signal but does
not saturate is the maximum concentration for use with the 7900HT instrument.
7
Repeat steps 1 to 6 for any additional custom dyes.
System Maintenance 7-21
To create a pure dye plate for custom dyes:
GR2107
Custom Dye 8
Custom Dye 7
Custom Dye 6
Custom Dye 5
Custom Dye 4
Custom Dye 3
Create a pure dye plate for the custom dye(s) by pipetting each custom dye to at
least three columns of an ABI PRISM® Optical Reaction Plate at the concentrations
determined in step 7.
Custom Dye 1
8
Action
Custom Dye 2
Step
(continued)
IMPORTANT The optical configuration of the 7900HT instrument requires that
each pure dye occupy at least 3 columns of the Pure Dye plate to permit adequate
data collection.
9
Seal the plate using an optical adhesive cover or optical flat caps.
10
Create a template document for the custom pure dye plate as explained below.
Constructing a To create a template for running the custom pure dye plate:
Custom Pure Dye
Step
Action
Plate Document
1
Launch
the SDS software.
Template
2
Add the new dye to the software using the Dye Manager as follows:
a. From the Tools menu, select Dye Manager.
The Dye Manager dialog box appears.
b. Click Add.
The Add Dye dialog box appears.
c. Type a name for the custom dye, and click OK.
The software adds the new dye to the Custom dye list.
d. Repeat steps 2 and 3 to add any additional custom dyes to the Dye Manager.
e. Click Done.
The SDS software makes the new dyes available to pure dye plate documents.
3
Create a custom pure dye plate document for the run as follows:
a. From the File menu, select New.
The New Document dialog box appears.
b. Configure the drop-down lists with the following options:
Drop-Down List
Select
Assay
Pure Dyes
Container
<the appropriate plate format>
Template
Blank Template
c. Click OK.
The software creates a new plate document.
7-22 System Maintenance
To create a template for running the custom pure dye plate:
Step
4
(continued)
Action
Apply pure dyes to the custom plate document as follows:
a. Select the wells containing the custom dye.
b. From the Setup tabbed page, click the Dyes drop-down list, and select the
appropriate dye.
The software applies the dye to the selected wells.
c. Repeat steps 6 and 7 to configure the plate document with any additional
custom dyes.
Dyes drop-down list
Custom dye added to selected
wells of the plate document
5
Save the custom pure dye plate document as a template file as follows:
a. From the File menu, select Save.
The Save dialog appears.
b. Navigate to Program Files > Applied Biosystems > SDS 2.0 > Templates.
The Templates directory appears within the Look in text field. By saving the
template to the Templates folder, it becomes available from the Template
drop-down list in the New Document dialog box.
c. From the Files of type drop-down list, select ABI PRISM SDS Template Document.
d. Click the File name text field, and type a name for the template document.
e. Click Save.
The software saves the plate document as a template file (*.sdt).
6
Run the custom pure dye plate as explained in “Preparing and Running the
Pure Dye Plate” on page 7-19.
System Maintenance 7-23
Verifying Instrument Performance Using a TaqMan RNase P Plate
When to Perform Applied Biosystems recommends running a TaqMan® RNase P Instrument
Verification Plate:
♦
When changing sample block formats for the first time
♦
As needed to verify the function of the 7900HT instrument
Purpose of TaqMan RNase P Instrument Verification Plate is an experiment run to verify the
RNase P Runs performance of the 7900HT instrument. The sealed plate is pre-loaded with the
reagents necessary for the detection and quantification of genomic copies of the
human RNase P gene (a single-copy gene encoding the moiety of the RNase P
enzyme). Each well contains pre-loaded reaction mix (1X TaqMan® Universal PCR
Master Mix, RNase P primers, and FAM-labeled probe) and template.
The following figures illustrate the arrangement of standards and samples on the
RNase P plate. As shown below, the RNase P plate consists of 5 columns of template
standards (1250, 2500, 5000, 10,000, and 20,000 copies) and two unknown
populations (5000 and 10,000 copies).
RNase P Plate
Sample Configuration
Unknown 2
10000
GR2107
Unknown 1
5000
NTC
STD 1250
STD 2500
STD 5000
STD 10000
STD 20000
384-Well
96-Well
Unknown 1
5000
NTC
STD 1250
STD 2500
STD 5000
STD 10000
STD 20000
Unknown 1
10000
7-24 System Maintenance
Materials Required The following materials are required to perform the RNase P run:
Material
Part Number
TaqMan RNase P Instrument Verification Plate
See page D-4
Centrifuge, with plate adaptor
Preparing a RNase P To prepare a plate document for the RNase P plate:
Plate Document
Step
Action
1
Remove the TaqMan RNase P Instrument Verification Plate from the freezer and
allow it to thaw to room temperature.
2
Launch the SDS software.
3
From the File menu, select New.
The New Document dialog appears.
4
5
Configure the New Document dialog box as follows.
Drop-Down List
Select
Assay
Absolute Quantification
Container
<the appropriate plate format>
Template
<the template file of the appropriate plate format>
If desired, enter the bar code information into the plate document as follows:
a. Click the Barcode text field.
b. Remove the RNase P plate from the packaging and scan its bar code using the
hand-held bar code reader.
6
Click OK.
The software creates a plate document.
Note Do not modify the RNase P plate document. The template is
pre-programmed with detector and method information for the run.
7
Save the plate document as follows:
a. From the File menu, select Save.
The Save dialog appears.
b. Click the Barcode text field and either:
– Type a name or bar code number for the plate, and click Save.
– Using the hand-held bar code reader, scan the bar code number.
c. From the Files of type drop-down list, select ABI PRISM SDS Single Plate (*.sds).
d. Click Save.
The software saves the plate document. The software is now configured for the
RNase P run.
8
Prepare and run the RNase P plate as explained on page 7-26.
System Maintenance 7-25
Preparing and To run the RNase P plate:
Running an
Step
Action
RNase P Plate
1
Briefly centrifuge the TaqMan RNase P Instrument Verification Plate.
2
From the plate document in the SDS software, click the Instrument tab.
The software displays the Instrument tabbed page.
3
From the lower portion of the Instrument tab, click the Real-Time tab.
The software displays the Real-Time tabbed page.
4
If the instrument tray is within the 7900HT instrument, click Open/Close.
The instrument tray rotates to the OUT position.
5
Place the RNase P plate into the instrument tray.
Note
6
The A1 position is located in the top-left corner of the instrument tray.
Click Start.
The 7900HT instrument begins the run.
Note Before starting the PCR run, the instrument may pause (up to 15 min) to heat
the heated cover to the appropriate temperature.
7
When the run is complete:
a. Analyze the run data as explained on page 6-9.
a. Set the baseline and threshold values for the analyzed data as explained on
page 6-10.
b. Verify the performance of the 7900HT instrument as explained below.
Verifying The install specification of the ABI PRISM 7900HT Sequence Detection System
Instrument demonstrates the ability to distinguish between 5,000 and 10,000 genome equivalents
Performance with a 99.7% confidence level for a subsequent sample run in a single well. The
following equation verifies the 7900HT install specifications:
[ ( CopyUnk 1 ) – 3 ( σCopyUnk1 ) ] > [ ( CopyUnk 2 ) – 3 ( σCopyUnk2 ) ]
where:
CopyUnk1a
σCopyUnk1a
= Average Copy Number of Unknown #1 (10,000 replicate population)
= Standard Deviation of Unknown #1 (10,000 replicate population)
CopyUnk1
a
= Average Copy Number of Unknown #2 (5000 replicate population)
σCopyUnk2
a
= Standard Deviation of Unknown #2 (5000 replicate population)
a. These values can easily be obtained from the experimental report window.
Note Up to 6 wells from each replicate group in a 96-well TaqMan RNase P Instrument
Verification Plate can be ignored to meet specification.
Note Up to 10 wells from each replicate group in a 384-well TaqMan RNase P Instrument
Verification Plate can be ignored to meet specification.
7-26 System Maintenance
Section: Maintaining the Plate Handler
In This Section This section contains the following information:
Topic
See Page
Adjusting the Sensitivity of the Plate Sensor Switch
7-28
Aligning the Plate Handler
7-32
Aligning the Fixed-Position Bar Code Reader
7-40
Cleaning and Replacing Gripper Finger Pads
7-46
Automation Module Refer to the figure below for the components discussed in this section.
Components
GR2014a
Adjustment
knob
Gripper
Plate-sensor switch
(cross-sectional view of the gripper)
Plate stack
Expansion stacks
Zymark Twister Microplate Handler
Fixed-position bar code reader
Plate Stack Positions The Zymark Twister Microplate Handler alignment is performed using the Zymark®
Twister Software. The software refers to the positions of the plate stacks differently
than the Automation Controller Software. The following diagram lists the positions
defined by the Zymark Twister Software and the Automation Controller equivalents.
Zymark Twister
Software
Automation
Controller
Position 0
Output
Position 1
(unused)
Position 2
Instrument
Position 3
(unused)
Position 4
Stack 1
Position 5
Stack 2
Bar code
Position 6
Stack 3
Well A1
Position 7
Stack 4
0
7
1
2
6
3
5
4
(front of instrument)
System Maintenance 7-27
Adjusting the Sensitivity of the Plate Sensor Switch
When to Perform The plate sensor switch located underneath the arm of the Zymark Twister Microplate
Handler requires adjustment under the following circumstances:
♦
When changing sample block module formats
♦
If the plate handler is having difficulty sensing plates
Materials Required The following materials are required to adjust the plate sensor switch:
Material
Part Number
ABI PRISM Optical Reaction Plate (of the current sample block format)
See page D-1
Adjusting the Switch The dimensions of different plate formats can place different requirements on how the
plate handler grips plates. To ensure smooth operation of the automation accessory,
adjust the plate sensor switch when changing consumable formats.
To adjust the plate sensor switch:
Step
1
Action
Turn off the Zymark Twister Microplate Handler.
! WARNING PHYSICAL HAZARD. The Zymark Twister Microplate Handler must
be turned off at all times during the following procedure. Failure to comply can
result in physical injury to the user or damage to the plate handler.
2
Clear the switch position by turning the thumb wheel all the way to the Up extreme
(as indicated on the side panel).
GR2014a
Thumb wheel
Plate-sensor switch
3
Begin the adjustment of the sensor switch as follows:
a. Grasp a 96- or 384-well ABI PRISM Optical Reaction Plate by the sides making
sure not to place pressure in the center of the plate to deform it.
b. Place the plate between the fingers of the gripper assembly and align it to the
middle of the centering device.
c. While holding the plate in position, slowly turn the thumb wheel to lower the
switch onto the reaction plate until the switch:
– Contacts the top of the plate, and
– Emits a soft, audible “clicking” noise
IMPORTANT The sound emitted by the sensor switch is very faint and may be
difficult to hear. To make the adjustment easier, place your ear close to the sensor
switch while making the adjustment and listen for the switch to engage.
7-28 System Maintenance
To adjust the plate sensor switch:
Step
4
(continued)
Action
Remove the plate and listen for the plate-sensor switch to disengage.
Did you hear the
switch disengage?
No
Then…
a. Move the switch Down a few steps by turning the
thumb wheel in the direction indicated on the arm.
b. Replace the plate within the gripper and listen for
the switch to engage:
– If you do not hear the switch engage, then
remove the plate and repeat steps a and b above.
– If you hear the switch engage, remove the plate
and continue to step a below.
Yes
a. Move the switch Up by turning the thumb wheel one
step in the direction indicated on the arm.
b. Replace the plate and listen for the switch to
engage:
– If you hear the switch engage, remove the plate
and repeat steps a and b.
– If you do not hear the switch engage, then you
have successfully identified the zero point of the
plate-sensor switch.
Note At the zero point, one step of the thumb wheel
in the Down direction causes the switch to engage.
5
Once the zero point is established, carefully turn the thumb wheel in the Down
direction the number of steps appropriate for your plate format as indicated below:
Plate Format
Turn the thumb wheel in the Down direction…
96-Well
20 steps
384-Well
15 steps
Note If you lose count, begin again from step 4 and identify the zero point for the
switch.
6
Test the adjustment as explained on page 7-30.
System Maintenance 7-29
Testing the To test the sensitivity of the plate sensor switch:
Adjustment
Step
Action
1
Place the reaction plate in the input stack 1 of the plate handler.
2
Turn on the 7900HT instrument, the plate handler, and the computer.
3
From the Start menu, select Programs > Zymark Twister Plate Handler > Twister.
The Zymark Twister Software launches.
4
Click Manual Control.
The software displays the Manual Control dialog box.
5
Click stack 4.
Click
The plate handler arm moves over the input stack.
6
Click Find Plate.
If the adjustment was successful, the plate handler arm will lower upon the plate
until the plate detector switch engages confirming the presence of the plate.
If plate handler arm emits a grinding sound, adjust the plate sensor switch as
follows:
a. From the Zymark Twister Software, click Vertical Home to raise the plate handler
arm.
b. Turn the thumb screw in the Down direction 10 steps.
c. Repeat step 6 until the plate handler arm successfully detects the plate.
7
Click Close Gripper, then click Vertical Home.
If the adjustment was successful, the plate handler arm will grasp the plate and
remove it from the plate stack.
If plate handler arm stops before the gripper fingers are able to contact the plate
and fails to grasp or pick up the plate, adjust the plate sensor switch as follows:
a. Turn the thumb screw in the Up direction 10 steps.
b. Grasp the plate with one hand and, from the Zymark Twister Software, click
Open Gripper to release the plate.
c. Replace the reaction plate into input stack 1 of the plate handler.
d. Repeat steps 6 and 7 until the plate handler arm successfully retrieves the plate.
8
Grasp the plate with one hand and, from the Zymark Twister Software, click Open
Gripper to release the plate.
7-30 System Maintenance
To test the sensitivity of the plate sensor switch:
Step
9
(continued)
Action
Exit the Zymark Twister Software.
a. Click Main Menu.
The software displays the main menu.
b. Click Quit Application.
The software closes.
10
Note A bug in the Zymark Twister Software can cause portions of the program to
persist in memory even after the software has been closed. Because the Zymark
Twister Software conflicts with the SDS software, the residual elements of the
software must be closed within the Windows Task Manager before continuing.
Confirm that the stack has closed by viewing the Task Manager.
a. Press the Crtl + Alt + Del keys in unison.
The Windows Security dialog box appears.
b. Click Task Manager.
The Task Manager dialog box appears.
c. Confirm that the software has closed by looking for the Zymark Twister Software
entry in the Task list. If the software is still running, click the software entry and
click Close to exit the remaining software.
d. From the File menu, select Exit.
System Maintenance 7-31
Aligning the Plate Handler
When to Perform Perform the following procedure if the ABI PRISM 7900HT Sequence Detection
System is moved or the Zymark Twister Microplate Handler becomes mis-aligned.
Symptoms that the plate handler is out of alignment include:
♦
Excessive downward movement of the plate handler arm (the arm grinds when
grasping or releasing plates)
♦
The plate handler arm collides with the plate stacks
♦
The plate handler arm releases plates above the bottom of the plate stacks
♦
Reaction plates tip or tilt when placed into the instrument tray by the arm
Preparing the To move the instrument tray to the OUT position:
Instrument for the
Step
Action
Alignment
Remove the covers for the fixed-position bar code reader and the underlying
platform.
GR2009
1
2
Fixed-position bar code reader
and underlying platform covers
Loosen the three black thumb screws on the platform connecting the 7900HT
instrument and the plate handler base.
Black thumb
screws
3
Move the instrument tray to the out position.
a. Launch the Automation Controller Software.
If an error dialog appears reading, ‘Machine calibration values are not valid.
Please refer to documentation for calibration process,’ click OK.
b. Click Open/Close (
).
The 7900HT instrument moves the instrument tray to the out position,
perpendicular to the instrument.
c. From the File menu, select Exit.
The software quits the Automation Controller Software.
4
From the Start menu, select Programs > Zymark Twister Plate Handler > Twister.
The Zymark Twister Software launches.
5
Click Manual Control.
The software displays the Manual Control dialog box.
7-32 System Maintenance
Aligning The alignment of input stack 1 (position 4 in the Zymark Twister Software) is the first
Input Stack 1 step in the alignment procedure. This alignment provides the basis for aligning all
(Zymark Position 4) subsequent stacks on the plate handler.
To align the input stack 1 (Zymark position 4):
Step
Action
1
Place an empty plate into input stack 1(Zymark position 4).
2
From the Zymark Twister Software, click position 4.
Click
The plate handler arm moves over the input stack.
3
Using the Vertical Positioning commands, lower the plate handler arm until it is just
above the stack.
The Vertical Positioning box offers four ways to move the plate handler arm:
♦ Move the slider for large increments.
♦ Click inside the slider bar to move the arm in 250 step increments.
♦ Click the lower arrow on the bar to move the arm in 50 step increments.
♦ Click the up or down arrows in the Vertical Adjustment text box to move the arm
in 1 step increments.
♦ Click the Vertical Adjustment text box, type a value, and press Enter to move the
arm into a specific location.
Slider
Slider bar (250 steps per click)
Down arrow (50 steps per click)
Text box arrows (1 step per click)
4
Check the rotary position of the plate handler arm to confirm that the gripper:
♦ is centered over the stack
♦ will not contact the sides of the stack when lowered
System Maintenance 7-33
To align the input stack 1 (Zymark position 4):
Step
5
(continued)
Action
Using the Rotary Adjustment arrows, adjust the rotational position of the gripper so
that it is centered over the input stack and will not contact the sides when lowered.
♦ To move the plate handler arm clockwise, click the up arrow.
♦ To move the plate handler arm counter-clockwise, click the down arrow.
Up arrow (moves the arm clockwise)
Down arrow (moves the arm counter-clockwise)
6
Using the Vertical Positioning commands, carefully lower the plate handler arm into
the stack. Adjust the Rotary Adjustment value as needed to center the gripper
within the stack.
7
Once the gripper is centered within the stack, click Find Plate.
The plate handler arm lowers upon the plate.
Confirm the following:
♦ the plate is in the middle of the gripper span
♦ the plate sensor switch is contacting the plate
♦ the gripper or plate do not contact the side of the stack
8
Click Close Gripper.
The gripper grips the plate between its fingers.
9
Select Vertical Home.
The plate handler raises the arm to its highest position. If the plate contacts the
sides of the stack, re-adjust the rotary position of the plate handler arm until the
plate moves freely in the stack.
Note Contact between the plate and the stack or all stacks may be unavoidable.
However, try to minimize the contact as much as possible.
10
Using the Vertical Positioning commands, raise and lower the plate handler arm
several times to check the alignment.
11
Lower the plate handler arm to the bottom of the plate stack, click Rotary Offset,
and click Yes.
The software records the rotary position for the Zymark position 4 (input stack 1).
12
Click Open Gripper.
The gripper releases the plate.
7-34 System Maintenance
Aligning the Plate The next step is to align the plate handler arm to the instrument tray (Zymark
Handler to the position 2). This alignment will ensure a smooth exchange between the plate handler
Instrument arm and the instrument tray during operation of the instrument.
Note The following procedure requires you to position the plate handler relative to the
7900HT instrument, Before moving the plate handler, loosen the three black thumb screws on
the platform connecting the 7900HT instrument and the plate handler.
To adjust the plate handler relative to the 7900HT instrument:
Step
1
Action
If not already present, place an empty plate into input stack 1(Zymark position 4)
and pick it up with the plate handler arm as follows:
a. From the Zymark Twister Software, click position 4.
b. Click Find Plate.
c. Click Close Gripper.
2
Click position 2.
Click here
The plate handler arm moves over the instrument tray.
3
Use Vertical Positioning to lower the plate handler arm until it is approximately 1 cm
above the instrument tray.
4
Using the Rotary Adjustment arrows, center the gripper and plate along the Y-axis
of the instrument tray.
1
2
3
4
5
6
7
8
9 10 11 12 13 14 15 16 17 18 19 20 21 22 23 24
A
B
C
D
E
F
Center the plate
G
H
I
J
K
L
M
N
O
P
5
Center the gripper and plate along the X-axis of the instrument tray by sliding the
plate handler and base towards or away from the 7900HT instrument.
1
2
3
4
5
6
7
8
9 10 11 12 13 14 15 16 17 18 19 20 21 22 23 24
A
B
C
D
E
F
G
H
I
J
K
L
M
N
O
Center the plate
6
GR2012
P
Again, using the software to move the plate handler arm, center the gripper and
plate along the Y-axis of the instrument tray as explained in step 4.
System Maintenance 7-35
To adjust the plate handler relative to the 7900HT instrument:
Step
(continued)
Action
7
Using the Vertical Positioning commands, carefully lower the plate handler arm onto
the instrument tray and confirm that the plate rests squarely within it.
8
Tighten the three black thumb screws on the platform connecting the 7900HT
instrument and the plate handler.
9
Release the plate from the plate handler arm.
a. Click Open Gripper.
b. Click Vertical Home.
10
Click Find Plate.
The plate handler arm lowers onto the plate.
11
Save the rotary and vertical offset information:
a. Click Rotary Offset, and click Yes.
The software records the rotary position for the plate drawer (Zymark position 2).
b. Click Vertical Offset, and click Yes.
The software records the vertical position for the plate drawer.
Re-checking the Now that the positions of the plate handler and instrument are fixed, the plate handler
Input Stack 1 stacks can be aligned and the positional values recorded.
To re-check the position of input stack 1 (Zymark position 4):
Step
Action
1
Place an empty plate into input stack 1.
2
From the Zymark Twister Software, click the icon for stack 4.
The plate handler arm moves over the input stack.
3
Using the Vertical Positioning commands, lower the plate handler arm until it is 1 cm
above the stack and verify that it is centered on the stack. If necessary, center the
stack using the Rotary Adjustment arrows.
4
Carefully lower the plate handler arm into the stack. Center the gripper as it moves
down the stack by adjusting the Rotary Adjustment arrows if needed.
5
Once the plate handler arm is centered within the stack, click Find Plate.
The plate handler arm lowers upon the plate.
Confirm the following:
♦ The plate is in the middle of the gripper span.
♦ The plate sensor switch is contacting the plate.
♦ The gripper does not contact the side of the stack.
6
Click Close Gripper.
7
Click Vertical Home.
The plate handler raises the arm to its highest position. If the plate contacts the
sides of the stack, re-adjust the rotary position of the plate handler arm until the
plate moves freely within the stack.
Note Contact between the plate and the stack or all stacks may be unavoidable.
However, try to minimize the contact as much as possible.
7-36 System Maintenance
To re-check the position of input stack 1 (Zymark position 4):
Step
8
(continued)
Action
Click Rotary Offset, and click Yes.
The software re-records the rotary position for the input stack 1(Zymark position 4).
9
While holding the plate, click Open Gripper and remove the plate.
Defining the Bottom The Automation Controller Software requires a bottom position value for all stacks.
of the Stack This value is used to prevent the plate handler arm from colliding or grinding as it
moves to the bottom of each stack.
To find the bottom of the stack:
Step
Action
1
Remove all plates from the instrument and the plate handler arm.
2
Place an empty plate into the output stack (Zymark position 0).
3
From the Zymark Twister Software, click position 0.
The plate handler arm moves over the output stack.
4
Using the Vertical Positioning commands, lower the plate handler arm until it is just
above the stack.
5
Check the rotary position of the plate handler arm to confirm that the gripper:
♦ is centered over the stack
♦ will not contact the sides of the stack when lowered
6
Using the Rotary Adjustment arrows, adjust the rotational position of the gripper so
that it is centered over the input stack and will not contact the sides when lowered.
7
Using the Vertical Positioning commands, carefully lower the plate handler arm into
the stack. Adjust the Rotary Adjustment value as needed to center the gripper
within the stack.
8
Once the gripper is centered within the stack, click Find Plate.
The plate handler arm lowers upon the plate.
Confirm the following:
♦ The plate is in the middle of the gripper span
♦ The plate sensor switch is contacting the plate
♦ The gripper does not contact the side of the stack
9
Click Close Gripper.
The gripper grips the plate between its fingers.
10
Select Vertical Home.
The plate handler raises the arm to its highest position. If the plate contacts the
sides of the stack, re-adjust the rotary position of the plate handler arm until the
plate moves freely in the stack.
Note Contact between the plate and the stack or all stacks may be unavoidable.
However, try to minimize the contact as much as possible.
11
Using the Vertical Positioning commands, raise and lower plate handler arm several
times to check the alignment.
12
Lower the plate handler arm and click Rotary Offset, and click Yes.
The software records the rotary position for position 0 (the output stack).
System Maintenance 7-37
To find the bottom of the stack:
Step
(continued)
Action
13
Click the Vertical Home.
14
While holding the plate, click Open Gripper and remove the plate.
15
Click the Vertical Adjustment text field, type –3200, and press Enter.
The plate handler lowers the arm to a position near the base of the output stack.
16
Carefully lower the plate handler arm until it is approximately 1–2 mm from the
bottom of the stack.
17
Click Vertical Offset, click Yes, and record the number in the Vertical Adjustment text
field.
The software records the vertical position for position 0 (the output stack).
18
Click Vertical Home.
The plate handler raises the plate handler arm to its highest position.
19
Click the Vertical Adjustment text field, type the Vertical Offset value determined in
step 5, and press Enter.
The plate handler lowers the plate handler arm to a Vertical Offset position.
20
If necessary, readjust the Vertical Offset value and repeat steps 6 and 7 until
satisfied with the setting.
Defining the To define the positions of the remaining stacks:
Positions of the
Step
Action
Remaining Stacks
1
Place an empty plate into input stack 2 (Zymark position 5).
2
From the Zymark Twister Software, click position 5.
The plate handler arm moves over the input stack.
3
Using the Vertical Positioning commands, lower the plate handler arm until it is
approximately 1 cm above the stack and center it using the Rotary Adjustment
arrows.
4
Carefully lower the plate handler arm into the stack. Center the gripper as it moves
down the stack by adjusting the Rotary Adjustment arrows as needed.
5
Once the plate handler arm is centered within the stack, click Find Plate.
The plate handler arm lowers upon the plate.
Confirm the following:
♦ The plate is in the middle of the gripper span.
♦ The plate sensor switch is contacting the plate.
♦ The gripper does not contact the side of the stack.
6
Click Close Gripper.
7
Click Vertical Home.
The plate handler arm raises to its highest position. If the plate contacts the sides of
the stack, re-adjust the rotary position of the plate handler arm until the plate moves
freely in the stack.
Note Contact between the plate and the stack or all stacks may be unavoidable.
However, try to minimize the contact as much as possible.
7-38 System Maintenance
To define the positions of the remaining stacks:
Step
(continued)
Action
8
Using the Vertical Positioning commands, raise and lower plate handler arm several
times to check the alignment.
9
Click Rotary Offset, and click Yes.
The software records the rotary position for the Zymark position 5 (input stack 2).
10
Repeat steps 1–8 for input stacks 3 and 4 to define Rotary Offset values for the
remaining positions 6 and 7:
Zymark position 7
(input stack 4)
Zymark position 6
(input stack 3)
11
Exit the Zymark Twister Software.
a. Click Main Menu.
The software displays the main menu.
b. Click Exit.
The software closes.
12
Note A bug in the Zymark Twister Software can cause portions of the program to
persist in memory even after the software has been closed. Because the Zymark
Twister Software conflicts with the SDS software, these residual elements must be
closed within the Windows Task Manager before continuing.
Confirm that the Zymark Twister Software has closed by viewing the Task Manager.
a. Press the Ctrl + Alt + Del keys in unison.
The Windows Security dialog box appears.
b. Click Task Manager.
The Task Manager dialog box appears.
c. Confirm that the Twister software has closed by looking for the Twister software
entry in the Task list. If the software is still running, click the software entry and
click End Task to exit the software.
d. From the File menu, select Exit to quit the Task Manager.
Replace the covers for the fixed-position bar code reader and the underlying
platform (removed in step 1 on page 7-32).
GR2009
13
Fixed-position bar code reader
and underlying platform covers
System Maintenance 7-39
Aligning the Fixed-Position Bar Code Reader
Description The fixed-position bar code reader must be set so that it automatically scans the
plate’s bar code as the plate is placed into the instrument tray by the plate handler.
Preparing the To move the instrument tray to the Out position:
Instrument for the
Step
Action
Alignment
Remove the cover for the fixed-position bar code reader.
GR2009
1
2
Turn on the computer.
3
Launch the Automation Controller Software.
4
Click Open/Close (
Fixed-position bar code
reader cover
).
The 7900HT instrument moves the instrument tray to the out position,
perpendicular to the instrument.
5
From the File menu, select Exit.
The software quits the Automation Controller Software.
Positioning the IMPORTANT The instrument tray must be in the OUT position to align the bar code reader.
Fixed-Position To position the fixed-position bar code reader:
Bar Code Reader
Step
1
Action
Place a plate with bar code onto the instrument tray.
IMPORTANT Orient the plate so that well A1 aligns to the A1 position of the
instrument tray and that the bar code faces the fixed-position bar code reader.
GR2018
Well position A1
Bar code
2
Select Start > Programs > PSC Laser Data > LDHOST.
The LDHOST software launches and displays the LDHOST window.
7-40 System Maintenance
To position the fixed-position bar code reader:
Step
3
(continued)
Action
Establish communication with the fixed-position bar code reader as follows:
a. Click the Edit button (
).
b. Click the Terminal button (
).
The software opens the Edit Configuration and Terminal dialog boxes.
c. From the Device Control dialog box, click the Connect to Device button (
).
The terminal window displays the fixed-position bar code reader response.
d. Click OK to close the Information dialog box.
The LD Host program communicates with the bar code reader and updates the
Edit Configuration dialog box with the current configuration settings.
4
Configure the software for the alignment as follows:
a. From the bottom of the Edit Configuration dialog box, locate and click the
Op. Modes tab.
Op. Modes tab
Note You may need to use the arrows located in the bottom of the dialog box to
locate the Op. Modes tab.
b. From the Operating modes selection group of the Edit Configuration dialog box,
click the arrow to the right of the Mode heading and select Test from the
drop-down list.
Mode drop-down list
c. From the Device Control dialog box, click RAM to toggle to EEPROM mode.
RAM button
d. From the Device Control dialog box, click Send.
e. From the Confirm dialog box, click YES to save to EEPROM.
The fixed-position bar code reader begins a continuous repeating scan of the bar
code. The software updates the Terminal dialog box every 0.5 sec indicating the
percentage of accurate reads completed during the 0.5 sec interval.
System Maintenance 7-41
To position the fixed-position bar code reader:
Step
5
(continued)
Action
Loosen the black positional adjustment knob on the fixed-position bar code reader,
and position the scan head of the reader as far as possible from the plate while
maintaining the orientation towards the bar code on the plate (see below)
GR2018
Scan head of the fixed-position
bar code reader
Black positional
adjustment knob
6
While watching the Terminal dialog box, slowly adjust the orientation of the
fixed-position bar code reader until the percent successful reading displays the
highest number possible.
Percent successful reads
Note It may be helpful to briefly place a sheet of white paper in front of the plate
bar code to view the area scanned by the laser.
7
When satisfied with the alignment, tighten the black positional adjustment knob on
the fixed-position bar code reader.
8
Restore the fixed-position bar code reader to normal operation:
a. From the Edit Configuration dialog box, change from Test back to Serial on Line.
Mode drop-down list
b. From the Device Control dialog box, confirm that EEPROM is still selected, and
click Send.
c. From the New Decision dialog box, click YES to save to EEPROM.
The bar code reader stops scanning the plate bar code and resumes normal
operation.
9
Click Exit (
) to quit the LDHOST window.
The LDHOST window closes.
10
7-42 System Maintenance
Replace the cover for the fixed-position bar code reader (from step 1 on
page 7-40).
Cleaning and Replacing Gripper Finger Pads
When to Perform The adhesive used to affix bar code labels to certain brands of microplates can build
up on the gripper pads of the Zymark Twister Microplate Handler. Over time, the
residue can cause the gripper pads to stick to the microplates while handling them,
causing misfeeds. To prevent buildup, inspect the gripper pads monthly and clean or
replace the pads as needed.
Materials Required The following materials are required to replace the finger pads:
Material
Part Number
Finger Pad Replacement Kit, containing 10 finger pads
4315472
Flat-blade screwdriver, small
—
Phillips head screwdriver, small
—
Isopropanol in a squeeze bottle
—
! WARNING CHEMICAL HAZARD. Isopropanol is a flammable liquid and vapor. It may
cause eye, skin, and upper respiratory tract irritation. Prolonged or repeated contact may dry
skin and cause irritation. It may cause central nervous system effects such as drowsiness,
dizziness, and headache, etc. Please read the MSDS, and follow the handling instructions.
Wear appropriate protective eyewear, clothing, and gloves.
Cleaning the To clean the finger pads, wipe each pad thoroughly with Isopropanol until the residue
Finger Pads has been resolved. If the pads appear rough or the adhesive cannot be removed,
replace the pads as described below.
Replacing the To replace the finger pad(s):
Finger Pads
Step
1
Action
Using the Phillips-head screwdriver, remove the two small Phillips-head screws
from the fingers on each side of the gripper, then remove the fingers.
Note Move the plate handler arm into any position where it is easy to access the
screws.
2
Using a small flat-blade screwdriver, pry the worn finger pads off the fingers.
Note
The manufacturer recommends replacing all finger pads at the same time.
3
Clean any residual adhesive off the fingers using isopropanol.
4
Remove a replacement finger pad from the paper backing, and place the finger pad
on the appropriate finger position.
5
Repeat for the remaining finger pads.
6
Install the fingers with the fingers pointing down and the finger pads toward the
center of the gripper.
7
Insert the screws into the fingers and tighten.
Note The screws do not automatically align the grippers. Make sure that the
finger pads are making good contact with the plate when the arm grips a plate.
System Maintenance 7-43
7-44 System Maintenance
Section: Maintaining the Computer and SDS Software
In This Section This section contains the following information:
Topic
See Page
General Computer Maintenance
7-46
Maintaining the SDS software
7-48
Note The SDS software is a multicomponent system that must be maintained to ensure
optimal operation of the ABI PRISM 7900HT Sequence Detection System. Although, most of the
maintenance will be completed by an Applied Biosystems service engineer, this section
discusses important issues that you should understand.
System Maintenance 7-45
General Computer Maintenance
Maintenance The computer connected to the 7900HT instrument requires regular maintenance to
Schedule ensure reliable operation of the ABI PRISM 7900HT Sequence Detection System
components. Applied Biosystems recommends the following tasks as part of routine
maintenance of the computer system:
Maintenance Task
Perform
Archive or Remove Old SDS Files
Weekly
Defragmenting the Hard Drive
Monthly or before fragmentation reaches 10%
Upgrading the Operating System Software
When available/advisable
Upgrading the 7900HT SDS Software
When available
Developing a Data Management Strategy
Applied Biosystems recommends developing a strategy for dealing with the files
produced by the SDS software. During a single day of real-time operation, the
ABI PRISM 7900HT Sequence Detection System can generate over 200 MB of data.
Without a strategy for distributing and archiving SDS-related files, the 7900HT
instrument can easily fill the hard drive of the computer within just a few weeks of
operation. See “Managing Sequence Detection System Data” on page 2-15 for a
discussion of management strategies.
Archiving SDS Files To conserve space on the computer hard drive, SDS files can be archived using a
data compression utility. The compression utility archives files by encoding them in a
compressed form, thereby reducing the size of a file. SDS files can be compressed
and decompressed many times.
Several commercially available compression utilities are available. PKZIP and *.arc
are archive formats common to the Microsoft Windows operating system.
7-46 System Maintenance
Defragmenting the Applied Biosystems recommends defragmenting the hard drive of the computer
Hard Drive attached to the instrument at least once every week or before fragmentation reaches
10%. As the ABI PRISM 7900HT Sequence Detection System is used and files are
deleted and created, the free space on the computer hard drive eventually is split into
increasingly smaller blocks (called “clusters”). Consequently, as the SDS software
creates new files and extends old ones, the computer cannot store each file in a single
block. Instead, the system will ‘fragment’ the files by scattering their component
pieces across different sectors of the hard drive.
The fragmentation of SDS files decreases the performance of both the SDS software
and the computer operating system. As the hard drive becomes fragmented,
programs take greater time to access files because they must perform multiple seek
operations to access the fragments.
Several commercially available software utilities are available for repairing fragmented
file systems. The software utility defragments broken files by combining their
component pieces at a single location on the hard drive, thereby optimizing system
performance.
Upgrading the Do not upgrade the operating system of the computer connected to the 7900HT
Operating System instrument unless instructed to do otherwise by an Applied Biosystems service
Software engineer. New versions of the Microsoft Windows operating system can be
incompatible with the SDS software and render it and the instrument inoperable.
The Applied Biosystems service engineer maintains the operating system software as
part of planned maintenance visits. During the visit, the engineer will update the
computer operating system as upgrades become available and are validated by
Applied Biosystems.
System Maintenance 7-47
Maintaining the SDS software
Administration IMPORTANT You must have administrator privileges on the computer to install and/or
Privileges upgrade the SDS software.
Upgrading Applied Biosystems continually develops the SDS software to provide increased
the 7900HT functionality and reliability of the ABI PRISM 7900HT Sequence Detection System. As
SDS Software updates become available, Applied Biosystems sends notifications of the upgrades to
all ABI PRISM 7900HT Sequence Detection System customers. If an upgrade is
user-installable, it can be found on the Applied Biosystems company Web site
(see Appendix F, “Contacting Technical Support,” to visit the Applied Biosystems Web
Site).
Note Applied Biosystems service engineers perform regular updates the SDS software during
planned maintenance visits.
Reinstalling the On rare occasions, when a piece of the SDS software becomes corrupt, it may be
Software necessary to re-install the software. In the event that the software must be
re-installed, observe the following guidelines to re-install or upgrade the software.
7-48 System Maintenance
♦
Unless instructed to do otherwise, remove the SDS software using the uninstall
utility. Do not delete the program folder from the Program Files directory.
♦
Install the SDS software under a user login that has administrator privileges on
the computer.
♦
Unless instructed to do otherwise, re-install the SDS software to the same
directory as the previous installation.
♦
Review all documentation accompanying the new software (such as installation
notes or user bulletin). The updated version of the software may contain new
features that require special consideration.
Troubleshooting
8
8
In This Chapter This chapter discusses the following topics:
Topic
See Page
Troubleshooting Table
8-2
Low Precision or Irreproducibility
8-4
Background Runs
8-8
Pure Dye Runs
8-10
Real-Time Runs (Quantitative PCR and Dissociation Curves)
8-11
End-Point Runs (Allelic Discrimination)
8-13
Software and 7900HT Instrument
8-14
Zymark Twister Microplate Handler and Fixed-Position Bar Code Reader
8-17
Troubleshooting 8-1
Troubleshooting Table
Overview The following table is designed to help you troubleshoot most of the problems you
may encounter while using the ABI PRISM® 7900HT Sequence Detection System.
The information in the table is arranged by category as follows:
♦
Chemistry problems
♦
Run problems
♦
Instrument and Automation Module Problems
Each category contains subcategories, followed by a brief description of the
symptoms you might encounter.
To use this table, look for the category and the symptom you are experiencing. The
page number in the right-hand column corresponds to a description of the possible
cause(s) and recommended action(s) for that particular problem.
Table 8-1
Troubleshooting Table
Category
Symptom
Page
Chemistry and Run Problems
Chemistry
Low Precision
8-4
Irreproducibility
Run Problems
Background Runs
Software will not extract background data
8-8
Background is too high (greater than 2500)
Pure Dye Runs
Software will not extract pure dye data
8-10
Raw data from pure dye run appears strange
Signals plateau (saturation)
Signal is too low (< 10,000 FSU)
More than two outliers per dye in a single row
8-2 Troubleshooting
Real-Time Runs (Quantitative PCR and Dissociation Curves)
8-11
End-Point Runs (Allelic Discrimination)
8-13
Table 8-1
Troubleshooting Table
Category
(continued)
Symptom
Page
Instrument and Automation Module Problems
Software and 7900HT
Instrument
SDS software will not launch
8-14
Software crashes/freezes the computer or
displays an error message
Communication error
Thermal cycler errors
Automation Controller Software cannot find a
plate document file
Computer and/or software displays the Run
Completed Successfully dialog box but will not
respond and appears to be frozen
Run will not start
Computer is slow when analyzing data,
opening or closing dialog boxes, and other
software processes.
The computer will not logon to the Windows
Operating System.
The computer will not boot up at all.
Zymark Twister Microplate
Handler and Fixed-Position
Bar Code Reader
Plate handler emits grinding noise when
picking up or putting down plates
8-17
Plate handler arm contacts racks when
retrieving or stacking plates
Plate handler arm releases plates awkwardly
into the plate stack
Reaction plates tip or tilt when placed into the
instrument tray by the plate handler arm
Plate handler fails to sense or grasp plates
Plates stick to the gripper fingers of the plate
handler arm
Plate handler does not restack plates in original
locations
Fixed-position bar code reader not reading
plate bar codes
Troubleshooting 8-3
Low Precision or Irreproducibility
Overview There are many reasons why an assay run with the ABI PRISM 7900HT Sequence
Detection System can have less than optimal precision. Factors that can affect
precision are described in detail below.
Factor
See Page
Improper Threshold Setting
8-4
Imprecise Pipetting
8-5
Non-Optimized Chemistry
8-5
Incomplete Mixing
8-5
Air Bubbles
8-5
Splashing PCR Reagents
8-5
Drops
8-6
Writing on the Reaction Plates
8-6
Fluorescent Contamination on the Plates
8-6
Errors
8-6
Contaminated Sample Block
8-7
Improper or Damaged Plastics
8-7
Low Copy Templates
8-7
Use of Non-Applied Biosystems PCR Reagents
8-7
Improper Threshold The key to high-precision quantitative PCR is accurate detection of the geometric
Setting phase. The ABI PRISM 7900HT Sequence Detection System typically delivers
sufficient sensitivity so that at least 3 cycles of the geometric phase are visible,
assuming reasonably optimized PCR conditions. The SDS software calculates a fixed
signal intensity, called a threshold, which each signal generated from PCR
amplification must reach before it is recognized as actual amplification. The calculated
threshold is an approximation, and should be examined and modified as needed.
Modifying the Threshold
In a real-time document of the SDS software, the threshold can be modified via the
Amplification Plot view following analysis of the run data. See “Setting the Baseline
and Threshold Values for the Run” on page 6-10 for more information.
8-4 Troubleshooting
Imprecise Pipetting The calculated quantities of target nucleic acid are directly affected by how precisely
the template volumes are added to the reaction mixes. Other individually added
reagents are also affected by pipetting precision (such as, variable magnesium affects
amplification efficiency).
Using Master Mixes
For this reason, Applied Biosystems highly recommends using a master mix. All
common components to a set of reactions should be mixed together and then
dispensed to the wells of the plate. Sub-master mixes can be used to further improve
the precision of identical replicates. For example, instead of pipetting 5 µL of the same
template into four replicate wells, pipette 20 µL of the template into a sub-master mix,
then divide the sub-master mix into four equal parts for amplification. When making
each master mix, add 5–10% additional volume to compensate for pipetting losses.
Using Pipettors
Pipetting precision is also improved by:
♦
Calibrating and servicing the pipettors regularly
♦
Pipetting larger volumes
♦
Reducing the number of pipetting steps whenever possible
♦
Increasing the consistency of the pipetting method
Consult the manufacturer about the correct method of dispensing liquid volumes
accurately from the pipettor. For example, some pipettors are designed to deliver the
designated volume at the first plunger stop, so ‘blowing out’ the residue may cause
error. Also, before using a new pipettor tip to serially dispense a master mix, wet the
tip once by drawing up some of the master mix and dispensing it back into the mix
again.
Non-Optimized Chemistries that have not been optimized may be susceptible to inconsistencies. To
Chemistry maximize precision and reaction efficiency, optimize the primer and probe
concentrations of each individual assay used. Refer to the TaqMan Universal PCR
Master Mix Protocol (P/N 4304449) for specific information about optimizing probe
and primer concentrations for TaqMan-related chemistries.
Incomplete Mixing For maximum precision, the PCR master mix must be mixed to uniformity. Once all
reaction components are added to master mix, it should be vortexed for 4–5 seconds
before aliquotting it to the wells of the plate. Any dilutions performed during the assay
should also be vortexed.
Air Bubbles Air bubbles in the wells can refract and distort the fluorescent signals. Ideally, the
reagents would be applied to the wells using a pipetting technique that does not form
air bubbles. However, if a plate does contain air bubbles, they can usually be removed
by swinging, tapping, or briefly centrifuging the reaction plate.
Splashing PCR If PCR reagents splash the undersides of the optical adhesive covers, the heat from
Reagents the lid may bake the liquid to the cover and may distort the signal. If splashing occurs,
briefly centrifuge the reaction plate to remove all traces of liquid from the caps.
Troubleshooting 8-5
Drops Drops of reagents that cling to the sides of the wells may not contact the thermal
cycler sample block and consequently may not amplify. If the drop slides into the mix
during PCR, then the amplified products will become diluted and the final result will be
less than replicate wells that did not have drops. Therefore, carefully monitor the
reaction plate as it is being transferred into the thermal cycler or 7900HT instrument. If
you observe any drops, take steps to remove them, such as centrifugation.
Writing on the Do not write on any surface of the Optical 384/96-Well Reaction Plates or the Optical
Reaction Plates Adhesive Covers. The fluorescent properties of the ink can potentially affect the
fluorescence emission from the plate and alter the results. Instead, note the contents
of each well on a sheet of paper, or on a printout of the sample setup.
Fluorescent Many compounds found in laboratories are fluorescent. If they come in contact with
Contamination on certain optical surfaces, such as the optical adhesive covers, the fluorescent results
the Plates may be affected. For example, it has been noted that the powder used to lubricate the
insides of plastic gloves often contains fluorescent compounds. Use only powder-free
gloves and do not needlessly touch the reaction plates or optical adhesive seals.
Errors Human errors from time to time are inevitable, such as pipetting into the wrong well, or
making a dilution mistake.
Human error can be reduced in the following ways:
8-6 Troubleshooting
♦
Perform the assay in a systematic fashion. For example, the pattern of sample
positions should be simple (such as avoid putting gaps in the rows).
♦
When pipetting the master mix, look directly down into the reaction plate so that
you can verify the transfer of the solution.
♦
If adding a small-volume reagent, such as template, place the drop of liquid on the
side of the well. Briefly tap or centrifuge the plate afterwards to bring the droplet
down into the well.
♦
After all pipetting is complete, visually inspect all the wells to confirm the presence
of the reagent drops. Tapping or centrifuging the reaction plate will cause all the
drops to slide down into the wells simultaneously.
♦
When making serial dilutions, be sure to change the pipet tip after each dilution
step.
♦
Visually inspect the liquid volumes being pipetted to verify that the volume is
approximately correct. A common mistake is using the wrong pipettor volume
setting (such as setting 20 µL instead of 2.0 µL).
♦
Visually inspect the volumes of the completed reactions, looking for any wells that
have volumes that do not match those of the other wells.
Contaminated Any material contaminating the sample block can affect the results. For example,
Sample Block mineral oil reduces thermal transfer. Residue from writing on reaction plates darkens
the wells, absorbing light.
The sample blocks should be periodically inspected for cleanliness. Sample block
contamination can be visualized by running a background plate and inspecting the
resulting background signal for aberrant peaks above 2500 FSU (see page 7-13). See
page 7-11 for instructions on decontaminating the sample block.
Improper or Only ABI PRISM optical grade reaction plates, optical adhesive covers, and
Damaged Plastics ABI PRISM® optical flat caps should be used with the ABI PRISM 7900HT Sequence
Detection System. The plastics that comprise the optical parts undergo special testing
for the absence of fluorescent impurities. Optical reaction plates are frosted to
improve the degree and precision of light reflection. Bent, creased, or damaged
plastics may adversely affect the transmission of fluorescent signal or prevent proper
sealing of a well resulting in evaporation, change in sample volume, and altered PCR
chemistry. Make sure to use the correct plastics and visually inspect each reaction
plate before use.
Note See Appendix D, “Kits, Reagents and Consumables,” for a list of compatible
consumables and reagents.
Low Copy Templates When amplifying samples that contain very low quantities of nucleic acid (generally
less than 100 molecules), expect lowered precision due to the Poisson distribution
and biochemical effects related to binding probabilities. Low copy templates are also
more susceptible to losses due to non-specific adhesion to plastic wells, pipettor tips,
etc. The addition of carrier to the sample, such as yeast tRNA or glycogen, can help
prevent these losses, increasing the precision and sensitivity of the assay.
Use of Non-Applied The Applied Biosystems buffer contains an internal passive reference molecule
Biosystems PCR (ROX™), which acts as a normalization factor for fluorescent emissions detected in
Reagents the samples (see page A-6).
IMPORTANT Non-Applied Biosystems PCR buffers may not contain the ROX passive
reference. If running non-Applied Biosystems chemistry, be sure to set the passive reference for
your experiment as explained on “Setting the Passive Reference” on page 4-12.
Troubleshooting 8-7
Background Runs
Background
Troubleshooting
Table
Observation
Possible Cause
Recommended Action
Software will not extract
background data
During setup, the wrong
plate type was assigned to
the plate document
Run a new background plate
document with the proper
plate type setting.
Background is too high
(≥ 2500 FSUa)
See below.
Sample block contamination
a. Construct and run a new
background plate.
Background is too high
(=>2500)
Background plate
contamination
b. See “Isolating Sample Block
Contamination” below.
a. Fluorescent standard units – The measure of amplitude displayed along the Y-axis of the Background Plot.
Isolating Signals exceeding 2500 FSU are considered outside the limit of normal background
Sample Block fluorescence and indicates that the either the background plate or the sample block
Contamination module may be contaminated.
To determine the location of the contamination on the sample block:
Step
Action
1
If not already open, open the plate document for the background run.
2
From the toolbar, click the Hide/Show System Raw Data Pane button (
).
The SDS software displays the raw data pane for the background run.
3
Select all wells in the plate document.
4
Inspect the raw background data for an aberrant spectral peak or peaks.
Wells producing raw spectra that exceed 2500 FSU are considered irregular and
could be contaminated. The following figure illustrates the raw data produced by a
run on a sample block module containing a contaminated well.
Contamination
5
Identify the location(s) of the contaminated well(s) on the sample block by selecting
increasingly smaller regions of the plate document (see below).
a. The raw data from
the selected wells
contains the peak.
The contaminated
well must be in
columns 7-12.
8-8 Troubleshooting
To determine the location of the contamination on the sample block:
Step
(continued)
Action
Example: (continued)
b. The raw data from
the selected wells
does not contain
the peak.
The contaminated
well must be in the
last four wells of
columns 7-12.
c. The raw data from
the selected wells
contains the peak.
The contaminated
well must be in
the last four wells
of columns 10-12.
d. The raw data from
the selected wells
contains the peak.
The contaminated
well must be in
the last two wells
of columns 10-12.
e. By selecting each
of the wells from
the last two wells
of columns 10-12,
the location of the
contaminated
well (G10) is
determined.
6
Repeat step 4 until you identify the location of each contaminated well.
7
Decontaminate the sample block as explained in “Decontaminating the Sample
Block” on page 7-11.
8
Run a background plate to confirm that the contaminants have been removed.
If the contamination is present after running the background plate for a second time,
the background plate is likely to be the source of contamination.
Troubleshooting 8-9
Pure Dye Runs
Pure Dye
Troubleshooting
Table
Observation
Possible Cause
Recommended Action
Software will not extract
pure dye data
During plate setup, the
wrong plate type was
assigned to the plate
document
Create and run a new pure
dye plate document with the
proper plate type setting
A background plate was not
run before the pure dye
plate
Run a background plate,
then run the pure dye plate
again
Pure dye plate was loaded
backwards
a. Verify the pure dye
wavelengths are as
expected.
Raw data from pure dye run
appears strange (see below)
b. Rerun the pure dye plate.
Signals plateau (saturation)
Intensity is set too high/low
Call Applied Biosystems
Technical Support.
♦ Evaporation
Rerun the pure dye plate.
♦ Contamination
If the problem persists,
discard the pure dye plate
and run a new one.
Signal is too low
(< 10,000 FSU)
More than two outliers per
dye in a single row
8-10 Troubleshooting
Real-Time Runs (Quantitative PCR and Dissociation Curves)
Troubleshooting When faced with irregular data, you can use the SDS software to diagnose some
Analyzed Data from chemistry- and instrument-related problems. The following table contains a summary
a Real-Time Run of checks for verifying the integrity of your run data and to help you begin
troubleshooting potential problems.
Troubleshooting Analyzed Real-Time Run Data
Analysis View/Description
What to look for...
Raw Data Plot
Signal tightness and uniformity – Do the raw spectra signals
from replicate groups and controls exhibit similar spectral
‘profiles’? If not, the plate or sample block could be
contaminated.
Displays the raw reporter
fluorescence signal
(not normalized) for the
selected wells during each
cycle of the real-time PCR.
Characteristic signal shape – Do the samples peak at the
expected wavelengths? For example, samples containing
only FAM™- labeled TaqMan® probes should not produce
raw fluorescence in the wavelength of a VIC™ dye
component. A signal present in wells that do not contain the
dye could indicate that the sample, master mix, or well
contains contaminants.
Characteristic signal growth – As you drag the bar through
the PCR cycles, do you observe growth as expected?
Absent growth curves may indicate a pipetting error (well
lacks template).
Signal Plateaus – Do any of the signals plateau? Signal
plateaus or saturation can be an indication that a well
contains too much template or fluorescent signal.
Multicomponent Plot
Displays a plot of normalized
multicomponent data from a
single well of a real-time run.
The plot displays the
component dye signals that
contribute to the composite
signal for the well.
Correct dyes displayed – Does the plot display all dyes as
expected? The presence of an unexpected dye may be the
result of an error in detector setup, such as assigning the
wrong reporter or quencher dye.
ROX fluorescence level – Does the ROX signal fluoresce
below the reporter dyes? If not, the lack of reporter
fluorescence may be caused by an absence of probe in the
well (a pipetting error).
Background fluorescence – Do all dyes fluoresce above the
background? The Background signal is a measure of
ambient fluorescence. If a dye fails to fluoresce above the
background, it is a strong indication that the well is missing
probes labeled with the dye (well does not contain probe,
PCR master mix, or both).
MSE Level – The MSE (mean squared error) is a
mathematical representation of how accurately the
multicomponented data fits the raw data. The higher the
MSE value, the greater the deviation between the
multicomponented data and the raw data.
Troubleshooting 8-11
Troubleshooting Analyzed Real-Time Run Data
(continued)
Analysis View/Description
What to look for...
Amplification Plot
Correct baseline and threshold settings – Are the baseline
and threshold values set correctly?
Displays data from real-time
runs after signal
normalization and
Multicomponent analysis. It
contains the tools for setting
the baseline and threshold
cycle (CT) values for the run.
Identify the components of the amplification curve and set
the baseline so that the amplification curve growth begins at
a cycle number that is greater than the highest baseline
number.
IMPORTANT Do not adjust the default baseline if the
amplification curve growth begins after cycle 15.
Identify the components of the amplification curve and set
the threshold so that it is:
♦ Above the background
♦ Below the plateaued and linear regions
♦ Within in the geometric phase of the amplification curve
Irregular amplification – Do all samples appear to have
amplified normally? The three phases of the amplification
curve should be clearly visible in each signal.
Outlying amplification – When the run data is viewed in the
CT vs. Well Position plot, do replicate wells amplify
comparably? Wells producing CT values that differ
significantly from the average for the associated replicate
wells may be considered outliers.
If a plate produces non-uniformity between replicates, some
samples on the plate could have evaporated. Check the seal
of the optical adhesive cover for leaks.
8-12 Troubleshooting
End-Point Runs (Allelic Discrimination)
Troubleshooting When faced with irregular data, you can use the SDS software to diagnose some
Analyzed Data from chemistry- and instrument-related problems. The following table contains a summary
an End-Point Run of checks for verifying the integrity of your run data and to help you begin
troubleshooting potential problems.
Troubleshooting Analyzed End-Point Run Data
Analysis View/Description
What to look for...
Raw Data
♦ Signal tightness and uniformity – Do the raw spectra
signals from replicate groups and controls exhibit similar
spectral ‘profiles’? If not, the plate or sample block could
be contaminated.
Displays the raw reporter
fluorescence signal (not
normalized) for the selected
wells during each cycle of
the PCR.
♦ Characteristic signal shape – Do the samples peak at the
expected wavelengths? For example, samples containing
only FAM- labeled TaqMan probes should not produce
raw fluorescence in the peak wavelength of the VIC dye
component. A signal present in wells that do not contain
the dye could indicate that the sample, master mix, or
well contains contaminants.
♦ Signal Plateaus – Do any of the signals plateau? Signal
plateaus or saturation can be an indication that a well
contains too much template or fluorescent signal.
Troubleshooting 8-13
Software and 7900HT Instrument
Troubleshooting Troubleshooting Software and Computer Problems
Software and
Possible Cause
Computer Problems Observation
SDS software will not launch
The software crashes/freezes
the computer or displays an
error message
♦ Incorrect start-up
sequence
♦ Corrupted software
Recommended Action
Follow the solutions listed until
the symptom goes away.
1
♦ Computer hardware
failure
a. Turn off the 7900HT
instrument.
♦ Operating System
(OS) corruption
b. Check cable connections.
♦ Loose bar code
reader cable
c. Restart the computer and
logon to the computer.
d. Turn on the 7900HT
instrument.
e. Launch the SDS software.
2
a. Restart the computer and
logon to your computer.
b. Reinstall the SDS software.
c. Launch the SDS software.
3
Contact Applied Biosystems
Service for OS problems or if
the computer will not boot up at
all. You may have to reload the
OS from the CDs.
4
Contact Dell for troubleshooting
the computer hardware.
8-14 Troubleshooting
Communication error
Cables are connected
incorrectly
Check cable connections and
COM port setup. See
“Instrument Connections” on
page 2-11.
Thermal cycler errors
Sample block module
not fully engaged
Reseat the sample block
module as explained “Replacing
the Sample Block” on page 7-4.
Automation Controller
Software cannot find a plate
document file
File not in correct
location
Remove file entry from plate
queue and add the file to the
plate queue again.
Dialog box does not respond
to mouse clicks or key strokes
Java Runtime Error
Click the close box of the dialog
box to close it.
Troubleshooting Software and Computer Problems
(continued)
Observation
Possible Cause
Recommended Action
Run will not start
No calibration file
Perform background and pure
dye runs.
No background data in
calibration file
(background run has
not been performed)
No pure dye data in
calibration file
(pure dye run has not
been performed)
See “Performing a Background
Run” on page 7-13 and
“Performing a Pure Dye Run”
on page 7-17.
Calibration file does
not contain pure dye
data for a dye used on
the plate document
Calibration file was
created on another
instrument
Disk drive containing
the plate document
has less than 50 MB of
free space
Check the capacity of the
destination drive. If less than
50 MB of free space remains,
remove or archive existing data
files (see page 7-46).
Heated cover cannot
reach running
temperature because
no plate loaded
Open the instrument tray and
check that the instrument
contains a plate.
Instrument tray
contains a plate
Output stack contains
a plate or plates
Remove all plates from the
output stack of the plate handler
before starting the queue.
Computer is slow when
analyzing data, opening or
closing dialog boxes, and other
software processes
Hard drive is
fragmented
Defragment the hard drive as
explained on “Defragmenting
the Hard Drive” on page 7-47.
Hard drive is almost
full
Remove or archive existing data
files as explained on “Archiving
SDS Files” on page 7-46.
The computer will not logon to
the Windows Operating
System
Logon window does
not appear
Restart the computer and logon
to your computer.
You are not logged on
as the Administrator
a. Logoff of your computer.
After the above
solutions have been
tried, the problem is
still not fixed
Contact Dell for troubleshooting
the computer hardware or OS.
b. Logon again as the
Administrator.
Troubleshooting 8-15
Troubleshooting Software and Computer Problems
(continued)
Observation
Possible Cause
Recommended Action
The computer will not boot up
at all
Cables are not
connected or are not
seated properly
Check the cables.
The boot disk is corrupted.
a. Boot directly off of the NT
Installation CD.
b. Boot off of the emergency
disk.
c. Reload the Windows NT
Operating System from the
CD.
After the above
solution has been
tried, the problem is
still not fixed
8-16 Troubleshooting
Contact Dell for troubleshooting
the computer hardware.
Zymark Twister Microplate Handler and Fixed-Position Bar Code Reader
Automation
Accessory
Troubleshooting
Table
Observation
Possible Cause
Recommended Action
Plate handler emits grinding
noise when picking up or
putting down plates
Vertical offset too low
Plate detector switch set too
high
Plate handler arm contacts
racks when retrieving or
stacking plates
Plate handler rotary offset is
incorrect or vertical offset is
too low
Re-align the plate handler as
explained in “Aligning the
Plate Handler” on
page 7-32.
The plate handler arm
releases plates awkwardly
into the plate racks
Reaction plates tip or tilt
when placed into the
instrument tray by the plate
handler arm
Plate handler fails to sense
or grasp plates
Plate sensor switch not
adjusted properly
Adjust the plate sensor
switch as explained in
“Adjusting the Sensitivity of
the Plate Sensor Switch” on
page 7-28.
Gripper pads on the fingers
of the plate handler arm are
worn or dirty
Change the gripper pads as
explained in “Cleaning and
Replacing Gripper Finger
Pads” on page 7-43.
Plates stick to the gripper
fingers of the plate handler
arm
Gripper pads are worn or
dirty
Change the gripper pads as
explained in “Cleaning and
Replacing Gripper Finger
Pads” on page 7-43.
Plate handler does not
restack plates in original
locations
Restack when finished
Configure the Automation
Controller Software to
restack the plates as
explained in page 4-37.
Fixed-position bar code
reader not reading plate bar
codes
Bar code reader is
mis-aligned
option not selected
Bar code reader is broken
Re-align the fixed-position
bar code reader as
explained in “Aligning the
Fixed-Position Bar Code
Reader” on page 7-40.
Troubleshooting 8-17
User Bulletins
9
9
About This Chapter A user bulletin is an advisory issued by Applied Biosystems. User bulletins contain
new information, advances, or procedures that may immediately influence your use of
Applied Biosystems instruments.
This section of the user guide is intended as a storage space for any user bulletins you
may receive regarding your ABI PRISM® 7900HT Sequence Detection System.
User Bulletins 9-1
Theory of Operation
A
A
In This Appendix This appendix discusses the following topics:
Topic
See Page
Fluorescent-Based Chemistries
A-2
Fluorescence Detection and Data Collection
A-4
Mathematical Transformations
A-5
Real-Time Data Analysis
A-7
Theory of Operation A-1
Fluorescent-Based Chemistries
Fundamentals of the The PCR reaction exploits the 5´ nuclease activity of AmpliTaq Gold® DNA
5´ Nuclease Assay Polymerase to cleave a TaqMan® probe during PCR. The TaqMan probe contains a
reporter dye at the 5´ end of the probe and a quencher dye at the 3´ end of the probe.
During the reaction, cleavage of the probe separates the reporter dye and the
quencher dye, which results in increased fluorescence of the reporter. Accumulation
of PCR products is detected directly by monitoring the increase in fluorescence of the
reporter dye. The figure below shows the forklike-structure-dependent,
polymerization-associated 5´–3´ nuclease activity of AmpliTaq Gold DNA Polymerase
during PCR.
Polymerization
5'
3'
5'
R
Foward
Primer
Probe
Q
3'
5'
Strand displacement
Reverse
Primer
R
Probe
5'
3'
5'
Cleavage
R = Reporter
Q = Quencher
Q
3'
5'
3'
5'
R
Probe
5'
3'
5'
Q
3'
5'
3'
5'
Polymerization completed
R
5'
3'
5'
3'
5'
Probe
Q
3'
5'
3'
5'
When the probe is intact, the proximity of the reporter dye to the quencher dye results
in suppression of the reporter fluorescence primarily by Förster-type energy transfer
(Förster, 1948; Lakowicz, 1983). During PCR, if the target of interest is present, the
probe specifically anneals between the forward and reverse primer sites.
The 5´–3´ nucleolytic activity of the AmpliTaq Gold DNA Polymerase cleaves the
probe between the reporter and the quencher only if the probe hybridizes to the target.
The probe fragments are then displaced from the target, and polymerization of the
strand continues. The 3´ end of the probe is blocked to prevent extension of the probe
during PCR. This process occurs in every cycle and does not interfere with the
exponential accumulation of product.
The increase in fluorescence signal is detected only if the target sequence is
complementary to the probe and is amplified during PCR. Because of these
requirements, any nonspecific amplification is not detected.
A-2 Theory of Operation
Basics of SYBR The SYBR® Green 1 Double-Stranded Binding Dye is used for the fluorescent
Green Chemistry detection of double-stranded DNA (dsDNA) generated during PCR. The SYBR Green
1 Dye binds non-specifically to dsDNA and generates an excitation-emission profile
similar to that of the FAM™ reporter dye. When used in combination with a passive
reference, the SYBR Green 1 Dye can be employed to perform several SDS-related
experiments including quantitative PCR and dissociation cure analysis. The following
figure illustrates the action of the SYBR Green 1 dye during a single cycle of a PCR.
5´
3´
3´
5´
When added to the reaction, the SYBR Green 1 Dye binds non-specifically to
the hybridized dsDNA and fluoresces
Dissociation
3´
5´
5´
3´
Denaturation complete, the SYBR Green 1 Dye dissociates from the strand,
resulting in decreased fluorescence
Polymerization
5´
3´
Forward
Primer
5´
5´
Reverse
Primer
3´
5´
During the extension phase, the SYBR Green 1 Dye begins binding to the
PCR product
Polymerization Complete
3´
5´
5´
3´
3´
5´
5´
3´
Polymerization is complete and SYBR Green 1 Dye is completely bound,
resulting in a net increase in fluorescence
Theory of Operation A-3
Fluorescence Detection and Data Collection
Fluorescent During PCR, light from an argon ion laser is sequentially directed to each well on the
Sequence Detection microplate. The light passes through the ABI PRISM™ Optical Adhesive Cover and the
laser excites the fluorescent dyes present in each well of the consumable. The
resulting fluorescence emission between 500 nm and 660 nm is collected from each
well, with a complete collection of data from all wells approximately once every
7–10 seconds.
A system of lenses, filters, and a dichroic mirror focus the fluorescence emission into
a grating. The grating separates the light (based on wavelength) into a predictably
spaced pattern across a charge-coupled device (CCD) camera. The SDS software
collects the fluorescent signals from the CCD camera and applies data analysis
algorithms.
Charged coupled
device array
Camera lens
Grating
Emission filter
Beam splitter
Laser source
Fresnel
GR2103
Lens
(within Lensplate)
384/96-Well
optical plate
Side View
A-4 Theory of Operation
Front View
Mathematical Transformations
Overview The SDS software performs a series of mathematical transformations on the raw data
during an analysis of all end-point and real-time runs. The term raw data refers to the
spectral data between 500 nm to 660 nm collected by the SDS software during the
sequence detection run. The following section describes the fundamental analysis of
raw run data performed on both real-time and end-point run by the SDS software.
Multicomponenting Multicomponenting is the term used for distinguishing the contribution each individual
dye and background component makes to the fluorescent spectra detected by the
7900HT instrument. During the multicomponent transformation, the SDS software
employs several algorithms to separate the composite spectra from the raw spectrum
and then to determine the contribution of each dye in the raw data.
First, the algorithm eliminates the contribution of background fluorescence in the raw
data, by subtracting the background component stored within the background
calibration file (see page 7-13). Next, the software employs the extracted pure dye
standards (see page 7-17) to express the composite spectrum in terms of the pure
dye components. The figure below shows one composite spectrum that represents a
fluorescent reading from a single well that contains the passive reference and two
fluorogenic probes, labeled with the FAM and VIC™ reporter dyes and a
non-fluorescent quencher. The example spectra demonstrate how the overlapping
component dye spectra contribute to the composite spectrum. The SDS software
multicomponenting algorithm applies matrix calculations to determine the
contributions of each component dye spectra.
FAM
Composite spectrum
(FAM + VIC + ROX +
Background + MSE)
ROX
VIC
Pure Dye components
500
550
600
Wavelength
650
Background
(from background
calibration run)
Theory of Operation A-5
The software uses the pure dye spectra, generated as part of instrument calibration
(see page 7-17), to solve for coefficients a, b, and c in the following equation:
Measured spectrum = a ( FAM ) + b ( VIC ) + c ( ROX ) + d ( Background ) + MSE
where the coefficients a, b, and c represent each dye component’s contribution to the
composite spectrum.
Note The example calculation above assumes that pure dye components exist for three dyes
(FAM, VIC, and ROX™) and for the instrument background.
After solving for a, b, c, and d, the algorithm calculates the mean squared error (MSE),
which measures how closely the collective multicomponent spectrum conforms to the
raw spectra. The figure below shows a typical display of the contribution of each
component spectra for one well.
Multicomponent Plot
Temperature
Fluorescence
FAM component
12000
8000
VIC component
4000
ROX component
0
93
Background
component
83
MSE
73
63
53
0:10
0:30
0:50 6978 1:10
Time
1:30
Normalization of While multicomponenting illustrates absolute change in emission intensity, the SDS
Reporter Signals software displays cycle-by-cycle changes in normalized reporter signal (Rn). The SDS
software normalizes each reporter signal by dividing it by the fluorescent signal of the
passive reference dye. Because the passive reference is a component of the PCR
master mix, it is present at the same concentration in all wells of the plate. By
normalizing the data using the passive reference, the software can account for minor
variations in signal strength caused by pipetting inaccuracies and make better
well-to-well comparisons of reporter dye signal.
Note For the example above, the resulting data from the normalizing is displayed as FAM Rn
and VIC Rn.
A-6 Theory of Operation
Real-Time Data Analysis
Kinetic Analysis/ The 7900HT instrument can be used to determine the absolute or relative quantity of a
Quantitative PCR target nucleic acid sequence in a test sample by analyzing the cycle-to-cycle change
in fluorescence signal as a result of amplification during a PCR. This form of
quantitative PCR analysis, called “kinetic analysis,” was first described using a
non-sequence-specific fluorescent dye, ethidium bromide, to detect PCR product
(Higuchi et al., 1992; Higuchi et al., 1993). The use of TaqMan probes and reagents
further enhances the method by providing sequence-specific amplification of multiple
targets for ‘comparative’ or ‘relative’ quantification. The fewer cycles it takes to reach a
detectable level of fluorescence, the greater the initial copy number of the target
nucleic acid.
Amplification Plot
8.0
Phase 3, plateau
2.0
1.0
Phase 2, linear
Rn
Phase 1, geometric
0.0
0
10
20
30
40
Cycle Number
When graphed in real-time on a linear scale, normal amplification of PCR product
generates a curve similar to the one shown in the figure above. This ‘amplification’
curve consists of three distinct regions that characterize the progression of the PCR.
Phase 1: Geometric (Exponential)
Detection of the high-precision geometric phase is the key to high-precision
quantitative PCR. The geometric phase is a cycle range of high precision during which
is characterized by a high and constant amplification efficiency. It occurs between the
first detectable rise in fluorescence and before the beginning of the Linear phase.
When plotted on a log scale of DNA vs. cycle number, the curve generated by the
geometric phase should approximate a straight line with a slope. The 7900HT
instrument typically delivers sufficient sensitivity to detect at least 3 cycles in the
geometric phase, assuming reasonably optimized PCR conditions.
Theory of Operation A-7
Phase 2: Linear
The linear phase is characterized by a leveling effect where the slope of the
amplification curve decreases steadily. At this point, one or more components have
fallen below a critical concentration and the amplification efficiency has begun to
decrease. This phase is termed linear, because amplification approximates an
arithmetic progression, rather than a geometric increase. Because the amplification
efficiency is continually decreasing during the Linear phase, it exhibits low precision.
Phase 3: Plateau
Finally, the amplification curve achieves the plateau phase at which time the PCR
stops and the Rn signal remains relatively constant.
Determining Initial
Template
Concentration and
Cycle Number
At any given cycle within the geometric phase of PCR, the amount of product is
proportional to the initial number of template copies. When one template is diluted
several times, as with the RNase P target in the TaqMan® RNase P Instrument
Verification Plate (see Appendix D), the ratio of template concentration to detectable
signal is preserved within the exponential phase for all dilutions (see below). This
relationship appears to change as rate of amplification approaches a plateau.
8.0
2.0
1.0
Rn
20000
10000
5000
2500
1250
0.0
0
10
20
Cycle Number
A-8 Theory of Operation
30
40
Fluorescence vs. When using TaqMan fluorogenic probes with the 7900HT instrument, fluorescence
Amplified Product emission increases in direct proportion to the amount of specific amplified product. As
the figure on page A-8 demonstrates, the graph of normalized reporter (Rn) vs. cycle
number during PCR appears to have three stages. Initially, Rn appears as a flat line
because the fluorescent signal is below the detection limit of the Sequence Detector.
In the second stage, the signal can be detected as it continues to increase in direct
proportion to the increase in the products of PCR. As PCR product continues to
increase, the ratio of AmpliTaq Gold polymerase to PCR product decreases. When
template concentration reaches 10-8 M, PCR product ceases to grow exponentially.
This signals the third stage of Rn change, which is roughly linear and finally reaches a
plateau at about 10-7 M (Martens and Naes, 1989).
The progressive cleavage of TaqMan fluorescent probes during the PCR makes
possible the correlation between initial template concentration and the rise in
fluorescence. As the concentration of amplified product increases in a sample, so
does the Rn value. During the exponential growth stage (the geometric phase), the
relationship of amplified PCR product to initial template can be shown in the following
equation:
Nc = N( 1 + E )c
where Nc is the concentration of amplified product at any cycle, N is the initial
concentration of target template, E is the efficiency of the system, and c is the cycle
number.
Theory of Operation A-9
Calculating The ABI PRISM 7900HT Sequence Detection System creates quantifiable
Threshold Cycles relationships between test samples based on the number of cycles elapsed before
achieving detectable levels of fluorescence. Test samples containing a greater initial
template number cross the detection threshold at a lower cycle than samples
containing lower initial template. The SDS software uses a Threshold setting to define
the level of detectable fluorescence.
The threshold cycle (CT) for a given amplification curve occurs at the point that the
fluorescent signal grows beyond the value of the threshold setting. The CT represents
a detection threshold for the 7900HT instrument and is dependent on two factors:
♦
Starting template copy number
♦
Efficiency of DNA amplification the PCR system
How the SDS Software Determines CTs
To determine the CT for an amplification plot, the SDS software uses data collected
data from a predefined range of PCR cycles called the ‘baseline’ (the default baseline
occurs between cycles 3 and 15). First, the software calculates a mathematical trend
based on the baseline cycles’ Rn values to generate a baseline subtracted
amplification plot of ∆Rn versus cycle number. Next, an algorithm searches for the
point on the amplification plot at which the ∆Rn value crosses the threshold setting
(the default threshold setting is 0.2). The fractional cycle at which the intersection
occurs is defined as the threshold cycle (CT) for the plot.
Note It may be necessary to adjust the baseline and threshold settings to obtain accurate and
precise data. For further information on resetting the baseline and threshold settings, see
“Setting the Baseline and Threshold Values for the Run” on page 6-10.
8.0
2.0
1.0
1250
Rn
Threshold setting
0.0
0
10
20
Cycle Number
A-10 Theory of Operation
30
40
Threshold cycle (CT)
for the 1250 copy well
Significance of Beginning with the equation describing the exponential amplification of the PCR:
Threshold Cycles
X n = Xm ( 1 + EX )
n–m
where:
Xn
=
number of target molecules at cycle n (so that n ≥ m)
Xm
=
number of target molecules at cycle m (so that m ″ n)
EX
=
efficiency of target amplification (between 0–1)
n-m
=
number of cycles elapsed between cycle m and cycle n
Amplicons designed and optimized according to Applied Biosystems guidelines
(amplicon size <150 bp) have amplification efficiencies that approach 100 percent.
Therefore EX=1 so that:
X n = Xm ( 1 + 1 )
= Xm ( 2 )
n–m
n–m
To define the significance in amplified product of one thermal cycle, set n - m = 1 so
that:
X 1 = X0 ( 2 )
1
= 2X 0
Therefore, each cycle in the PCR reaction corresponds to a two-fold increase in
product. Likewise, a change in threshold cycle number of one must equate to a
two-fold difference in initial template concentration.
Theory of Operation A-11
Importing and Exporting
Plate Document Data B
B
In This Appendix This appendix discusses the following topics:
Topic
Importing Plate Document Setup Table Files
See Page
B-2
Setup Table File Format
B-4
Exporting Graphics
B-8
Exporting Plate Document Data
B-9
Importing and Exporting Plate Document Data B-1
Importing Plate Document Setup Table Files
About the Import The SDS software features the ability to import setup table information (detector,
Function detector task, marker, and sample name layouts) into a plate document from a
tab-delimited text file. The import feature is designed to be a time-saving device that
facilitates the exchange of setup information between other programs and the SDS
software. Instead of setting up plate documents individually, a third-party program can
be used to construct setup table files which can then be imported into plate
documents for use.
To guarantee a successful incorporation of setup information from a text file to the
plate document, the file must:
♦
Be saved in a tab-delimited text format
♦
Conform to the setup table file formats described on page B-4
Creating and Importation of setup table data into a plate document is accomplished in three major
Importing Setup steps.
Table Data into a
Plate Document Creating an Empty Setup Table File
The first step in the procedure is to export a setup table file from a blank plate
document.
Note The blank setup table file can be created using a secondary application (such as
Microsoft Excel or a text editor) so long as it is saved in tab-delimited format and is configured
according to the file structure explained on page B-4.
To export a blank setup table file using the SDS software:
Step
1
Action
Launch the SDS software.
2
From the File menu, select New.
3
Configure the New Document dialog box with the correct assay type and plate
format for your experiment, and click OK.
4
From the File menu, select Export.
5
From the Look In text field of the Export dialog box, navigate to the directory you
would like to receive the exported file.
6
From the Export drop-down list, select Setup Table.
7
Select the All Wells radio button.
8
Click the File name text box, and type a name for the file.
9
Click Export.
The software exports the setup table data for the empty plate document as a
tab-delimited text file.
10
Configure the setup table file with plate document information (detector, task,
marker, and sample data) as explained on page B-3.
B-2 Importing and Exporting Plate Document Data
Configuring the Setup Table File with Plate Document Information
The second step in the procedure is to import the setup table file into a secondary
application, configure it with sample and detector information, and then save the
completed setup table file in tab-delimited format.
To configure the setup table file with information:
Step
Action
1
Launch the application that you want to use to edit the setup table file.
2
Import the setup table file from the previous procedure as tab-delimited text.
If using a spreadsheet application to edit the setup table file, the application
automatically parses the tab-delimited information into the cells of a spreadsheet.
3
Configure the setup table file with sample and detector information according to the
file structure explained on page B-5.
4
Save the setup table file in tab-delimited format.
5
Import the completed setup table file into an empty plate document as explained
below.
Importing the Completed Setup Table File into a Plate Document
The final step in the procedure is to import the completed setup table tab-delimited file
into an empty plate document.
To import setup information from a tab-delimited text file to a plate document:
Step
1
Action
If the plate document created in “Creating an Empty Setup Table File” on page B-2
is still open in the SDS software, continue to step 3. Otherwise, create a plate
document to receive the setup table data as follows:
a. Launch the SDS software.
b. Create or open a plate document to receive the information from the text file.
2
Choose one of the following options:
♦ From the toolbar, click the Import button (
).
♦ From the File menu, select Import.
3
From the Look In text field of the Import dialog box, navigate to and select the
completed tab-delimited setup table file from step 4 in the previous procedure.
4
Click Import.
The software imports the setup table information from the text file and automatically
configures the plate document plate grid and setup table with detector, detector
task, marker, and sample data.
Importing and Exporting Plate Document Data B-3
Setup Table File Format
Example Setup To guarantee a successful importation of setup table data into a plate document, the
Table Files imported setup table file must be configured in the correct format for the assay type.
The following figures illustrate the orientation of information in tab-delimited setup
table files as viewed in a Microsoft® Excel spreadsheet document. The numbered
elements of the setup table files are explained on page B-5.
Example Setup Table File from an Allelic Discrimination Run
1
2
3
4
5
6
7
8
Example Setup Table File from an Absolute Quantification Run
1
2
3
4
5
6
7
8
B-4 Importing and Exporting Plate Document Data
About the Setup This section explains the elements of setup table files shown on the previous page.
Table File Format
The following table describes the conventions used in the rest of this section.
Format/Symbol
Definition
Text appearing in bolded courier font must be applied to a setup
table file exactly as appears in this document.
courier
Text appearing in italic courier font must be substituted with
custom values when applied to a setup table file.
italic
[ required text ]
Text appearing between brackets is required information in setup
table files. All information within the brackets must be present in
the setup table file for the SDS software to import it.
{ required text }
Text appearing between braces is optional in setup table files.
The tab character (the equivalent of pressing the Tab key)
<tab>
The carriage-return character (the equivalent of pressing the
<cr>
Enter key)
IMPORTANT To guarantee a successful importation of the setup table file into a plate
document, the file can must contain all of the sections in the following table in the order that they
appear in this document.
Setup Table Elements
Number
1
Contents
Description
File Version
This line defines the version of SDS Assay Plate File format used to generate the document.
Format:
[ *** SDS Setup File Version <tab> version number <cr> ]
Example:
*** SDS Setup File Version 2
2
Plate Size
This line defines the number of wells in the plate modeled by the file (384 or 96).
Format:
[ *** Output Plate Size <tab> number of wells <cr> ]
Example:
*** Output Plate Size
3
Plate ID
384
This line defines the ID of the Assay Plate. Normally this will be a bar code that is printed on
the plate.
Format:
[ *** Output Plate ID <tab> plate id <cr> ]
Example:
*** Output Plate ID
384N75822034
Importing and Exporting Plate Document Data B-5
Setup Table Elements
Number
(continued)
Contents
Detector Definitions
4
Number of
Detectors
Description
Element numbers 4 to 6 define the detectors that will appear in the well descriptions that
follow in a later section. The detector definition consists of three sections: the declaration of
the number of detectors, the detector list header, and the detector list.
This line defines the total number of detectors on the plate.
Format:
[ *** Number of Detectors <tab> number of detectors <cr> ]
Example:
*** Number of Detectors
5
Detectors
List Header
5
This line contains the column headings for the Detector Definitions section of the setup table
file that make the file easier to edit using a program such as Microsoft Excel.
Format:
[ Detector <tab> Reporter <tab> Quencher <tab> Description <tab> Comments <tab>
Sequence <cr> ]
Example:
Detector
6
Detectors
List
ReporterQuencher
Description
Comments
Sequence
The detector list consists of one or more lines displaying the information for each detector
used on the plate document.
♦ The Detectors List section must contain one line (or definition) for each detector present
on the plate.
♦ The number of lines in the Detectors List section must be equal to the number defined in
the Number of Detectors section (see number 4 above).
♦ Leave blank the Quencher Dye entry for detectors created for the SYBR Green I Dye or
probes labeled with a non-fluorescent quencher.
♦ The Sequence text value contains the name of the Allelic Discrimination marker
associated with the detector. Because markers are used exclusively in allelic
discrimination plate documents, assign Sequence text values to detector definitions of
allelic discrimination setup table files only.
Format for a single detector:
[ detector name <tab> reporter dye <tab> quencher dye <tab> description <tab>
comments <tab> sequence <cr> ]
Example for an allelic discrimination setup table file:
CYP 2C9*2.1
FAM
PDAR CYP 2C9*2 Allele 1Example ProbeCYP 2C9*2
CYP 2C9*2.2
VIC
PDAR CYP 2C9*2 Allele 2Example ProbeCYP 2C9*2
Example for an absolute quantification setup table file:
GAPDH
VIC
GAPDH Probe
Example Probe
SYBR Green
SYBR
SYBR Green I
Example Probe
RNase P
FAM
RNase P Probe
Example Probe
TAMRA
B-6 Importing and Exporting Plate Document Data
Setup Table Elements
Number
Contents
Assay Plate Wells
7
(continued)
Description
Element numbers 7 and 8 define the contents of the wells on the plate. The Assay Plate
Wells definition consists of two sections: the Well List Header and the Well Definition List.
Well List
Header
This line contains the column headings for the Assay Plate Wells section of the setup table
file that make the file easier to edit using a program such as Microsoft Excel.
Format:
[ Well <tab> Sample Name <tab> Detector <tab> Task <tab> Quantity ] { ... <tab>
Detector <tab> Task <tab> Quantity } [ <cr> ]
Example:
Well
8
Sample Name
Well
Definition
List
Detector
Task
Quantity ...Detector Task
Quantity
This section defines the contents of the plate wells. The setup table file must contain a
definition for each well used on the plate. Each well definition list consists of one string of
characters terminated by a <cr>. The definition can be of three main functional divisions:
♦ Well number – The first tab-delimited text block defines the number of the well on the
plate. Well numbers start at 1 for well A-1 (upper-left corner of the plate) and increases
from left to right and from top to bottom. The wells must be listed in order (1,2,3,…).
♦ Sample name – The second tab-delimited text block defines the name of the sample
assigned to the well.
♦ Detector assignments – The remaining tab-delimited text blocks for the well definition
define the detectors assigned to the well. Each detector is represented by three text
blocks that define the following information:
– The name of the detector
– The task assignment of the detector for the well (UNKN - Unknown, STND - Standard,
NTC - No Template Control)
– The quantity assignment of the detector for the well (For wells containing standards,
assign the quantity for the standard sample in initial copy number. For all other wells,
assign the quantity value as 0.)
To assign more than one detector to a well, then repeat the detector definition text blocks for
each detector. There is no limit to the number of detectors that can appear in a well.
IMPORTANT All detectors that appear in this section must have been previously defined in
the Detector Definitions section (elements 4–6).
Format for a single Well:
[ Well number <tab> SDS Sample Name <tab> Detector name <tab> Detector task <tab>
Detector quantity ] { <tab> Detector name <tab> Detector task <tab> Detector
quantity … <tab> Detector name <tab> Detector task <tab> Detector quantity } [ <cr> ]
Example for allelic discrimination setup table files:
1
2
3
Sample 1
Sample 2
...
CYP 2C9*2.1
CYP 2C9*2.1
UNKN
UNKN
0
0
CYP 2C9*2.2 UNKN
CYP 2C9*2.2 UNKN
0
0
Example for absolute quantification setup table files:
1
2
3
4
5
Sample
Sample
Sample
Sample
Sample
1
2
3
4
5
GAPDH
GAPDH
GAPDH
GAPDH
GAPDH
UNKN
UNKN
STND
STND
NTC
0
0
20000
15000
0
Importing and Exporting Plate Document Data B-7
Exporting Graphics
Exporting a Plot as a The SDS software can export most panes and plots of the plate document as JPEG
JPEG Graphic File (Joint Photographic Experts Group) graphic files. The JPEG file format is compatible
with most word processing and spreadsheet applications and can be incorporated
directly into HTML documents for viewing by most web browser software.
To export an element of a plate document as a graphic:
Step
Action
1
Click the plot or grid you want to export.
2
Choose from the following:
♦ If exporting a plot, adjust its dimensions (length and width) as you want them to
appear in the exported graphic file. The exported graphic file retains the
dimensions of the original screen element.
♦ If exporting the plate grid, do not adjust the size of the wells. The software
captures the whole grid regardless of the size of the view.
3
Right-click the plot or grid, and select Save Plot/Grid to Image File from the
contextual menu.
Note If a pane cannot be exported as a graphic, the contextual menu will not
contain the Save Plot/Grid to Image File option.
4
From the Save As dialog box, navigate to the directory you want to receive the
exported graphic file.
5
Click the File name text field, and type a name for the new file.
6
Click Save.
The software saves the plot or grid as a JPEG graphic in the designated directory.
B-8 Importing and Exporting Plate Document Data
Exporting Plate Document Data
Exporting Data from The SDS software can export raw or analyzed data in tab-delimited (*.txt) format for all
a Plate Document or a select group of wells on a plate document. The exported files are compatible with
most spreadsheet applications.
To export an element of a plate document:
Step
1
Action
Click the plate document to select it.
Note
The plate document must be the top-most object in the workspace.
2
From the File menu, select Export.
3
Navigate to the directory you would like to receive the exported file(s).
4
Click the Export drop-down list, and select the type of data you would like the
software to export.
Data Type
The exported file contains…
Background
Spectra
Fluorescence readings for each well from the background component
used to analyze the run
Clipped
Average Rn and ∆Rn of the last three data points collected during the
extension phase of each cycle repetition for each well
Dissociation
Curve
♦ Temperature Data – For each well in use on the plate, the file
displays the calculated temperature of the wells during each data
collection reading of the temperature ramp.
♦ Raw Data – For each well in use on the plate, the file displays the
Rn of the well during each data collection reading of the
temperature ramp.
♦ Derivative Data – For each well in use on the plate, the file displays
the first derivative data during each data collection reading of the
temperature ramp.
Multicomponent
♦ Calculated amounts the dye components in a single well throughout
all stages of the PCR that were labeled with data collection icons
♦ Pure spectra component data
♦ Calculated inverse matrix
♦ Singular values of the inverse matrix
Pure Spectra
Fluorescence readings for each well from the pure spectra calibration
component used to analyze the run
Raw Spectra
Unmodified fluorescence readings taken for each spectral bin during
the course of the run
When exported, the software creates a directory and saves each the
raw spectra data for each well in a separate *.txt file.
Results Table
The contents of the results table of an analyzed plate document
Note The contents of the exported data varies depending on the
type of plate document.
Setup Table
The contents of the results table of a plate document prior to analysis
The contents of the exported data varies depending on the type of
plate document used to produce it. See page B-4 for a detailed
description of the Setup Table file.
Importing and Exporting Plate Document Data B-9
To export an element of a plate document:
Step
5
(continued)
Action
Select the appropriate well radio button as follows:
To export data from…
Select the…
all wells on the plate document
All Wells radio button
selected wells of the plate grid only
Selected Wells radio button
6
From the files of type drop-down list, select the appropriate format for the exported
data.
7
Click the File name text box, and type a name for the exported file.
8
Click Export.
The software saves the exported data to the designated location.
B-10 Importing and Exporting Plate Document Data
Designing TaqMan
Assays
C
C
In This Appendix This appendix discusses the following topics:
Topic
Assay Development Guidelines
See Page
C-2
Design Tips for Allelic Discrimination Assays
C-5
Design Tips for Quantitative PCR Assays
C-6
Designing TaqMan Assays C-1
Assay Development Guidelines
TaqMan Assay To develop custom TaqMan 5´ nuclease assays:
Development
Step
Action
Program
See Page
1
Identify target sequence(s).
C-2
2
Design the TaqMan® probes and the forward and reverse primers.
C-3
3
Order reagents.
C-4
4
Quantitate the concentrations of the probes and primers.
C-4
5
Prepare the master mix.
C-4
6
Optimize the primer concentrations.
C-4
7
Run the assay.
C-4
Identify Target A target template is a DNA, cDNA, RNA, or plasmid containing the nucleotide
Sequence(s) sequence of interest. For optimal results, the target template should meet the
following requirements:
♦
The target nucleotide sequence must contain binding sites for both primers
(forward and reverse) and the fluorogenic probe.
♦
Short amplicons work best. Amplicons ranging from 50–150 bp typically yield the
most consistent results.
♦
If designing assays for quantitative PCR, see “Design Tips for Quantitative PCR
Assays” on page C-6 for additional recommendations.
C-2 Designing TaqMan Assays
Design Probes and The following sections contain general guidelines for designing primers and probes.
Primers For specific design tips, refer to the appropriate section: for Allelic Discrimination see
page C-5 and for Quantitative PCR see page C-6.
Design Probe(s) for the Assay
Adhere to the following guidelines when designing TaqMan probes:
♦
Keep the G-C content in the range of 30–80%.
♦
Avoid runs of an identical nucleotide (especially guanine, where runs of four or
more Gs should be avoided).
♦
No G on 5´ end.
♦
Keep the melting temperature (Tm) in the range of 68-70 °C for quantitative PCR
and 65-67 °C for allelic discrimination (using the Primer Express™ software).
♦
Select the strand that gives the probe with more Cs than Gs.
♦
For allelic discrimination (see page C-5):
♦
–
Adjust probe length so that both probes have the same Tm.
–
Position the polymorphism site approximately in the center of each probe.
For multiplex PCR applications (involving multiple probes), design the probes with
different fluorescent reporter dyes as explained below:
Reporter Dyea
Application
Allelic Discrimination
First Probe
Second Probe
FAM™
VIC™
a. The use of the FAM and VIC reporter dyes for multiplex applications provides the greatest degree of
spectral separation.
Design Primers for the Assay
Adhere to the following guidelines when designing primers for 5´-nuclease assays:
♦
Keep the G-C content in the range of 30–80%.
♦
Avoid runs of an identical nucleotide (especially guanine, where runs of four or
more bases should be avoided).
♦
Keep the Tm in the range of 58-60 °C (using the Primer Express™ software).
♦
Limit the G and/or C bases on the 3´ end. The five nucleotides at the 3´ end
should have no more than two G and/or C bases.
♦
Place the forward and reverse primers as close as possible to the probe without
overlapping the it.
♦
Use an annealing temperature of 60 °C for quantitative PCR, and 62 °C for allelic
discrimination (except for TaqMan® PDARs for Allelic Discrimination).
Designing TaqMan Assays C-3
Order Reagents Note Because part numbers can change as new and improved products are introduced.
Contact your Applied Biosystems sales representative for specific ordering information.
You will need the following reagents and equipment to create your own applications:
♦
Custom Synthesized TaqMan Probes
♦
Sequence Detection Primers
♦
TaqMan® Universal PCR Master Mix (optimized for TaqMan reactions containing
AmpliTaq® Gold DNA Polymerase, AmpErase® UNG, dNTPs with dUTP, ROX™
Passive Reference I, and optimized buffer components)
IMPORTANT PCR master mix used with the 7900HT instrument must contain a passive
reference dye. The SDS software uses the signal from the passive reference to normalize the
reporter fluorescence making well-to-well comparisons possible. All Applied Biosystems master
mix products contain an optimal concentration of the Passive Reference I.
♦
ABI Prism® Optical Reaction Plates
♦
ABI Prism® Optical Adhesive Covers or ABI PRISM® Optical Flat Cap Strips
♦
TaqMan Spectral Calibration Reagents
♦
Centrifuge with 384- or 96-well plate adapter
♦
Deionized water or Tris-EDTA buffer (10 mM Tris-HCl, 1 mM EDTA, pH 8.0)
♦
Disposable Gloves
Quantitate the Use a spectrophotometric method to determine the concentrations of the probes and
Probes and Primers primers received. See the TaqMan Universal PCR Master Mix Protocol (P/N 4304449)
for specific information about primer and probe quantification.
Prepare Master Mix Refer to the TaqMan Universal PCR Master Mix Protocol (P/N 4304449) for specific
information about preparing the master mix for use.
IMPORTANT PCR master mix used with the 7900HT instrument must contain a passive
reference dye. The SDS software uses the signal from the passive reference to normalize the
reporter fluorescence making well-to-well comparisons possible. All Applied Biosystems master
mix products contain an optimal concentration of the ROX passive reference dye.
Note Applied Biosystems protocols are available on the Applied Biosystems Company Web
Site, see Appendix F, “Contacting Technical Support,” for more information.
Optimize Refer to the TaqMan Universal PCR Master Mix Protocol (P/N 4304449) for specific
Primer/Probe information about preparing the master mix for use.
Concentrations Note Applied Biosystems protocols are available on the Applied Biosystems Company Web
Site, see Appendix F, “Contacting Technical Support,” for more information.
Run Your Custom Run your experiment.
Assay Note If conducting a quantitative PCR experiment, consider the use of replicate assays to
enhance the precision of you data.
C-4 Designing TaqMan Assays
Design Tips for Allelic Discrimination Assays
Discrimination by By using different reporter dyes, cleavage of multiple probes can be detected in a
Multiple Probes single PCR. One application of this multi-probe capability is to use allele-specific
probes to distinguish genetic polymorphisms (Bloch, 1991, Lee et al., 1993). Probes
that differ by as little as a single nucleotide will exhibit allele-specific cleavage. This is
true even for probes with a reporter on the 5' end and the non-fluorescent quencher
on the 3´ end (Bloch, 1991).
TaqMan Probe IMPORTANT When designing probes, it is important to consider probes from both strands.
Design Guidelines
Follow the guidelines in the table below for designing TaqMan MGB probes:
Priority
1
Guideline
Avoid probes with a guanine residue at the 5´ end of the probe.
A guanine residue adjacent to the reporter dye will quench the reporter
fluorescence, even after cleavage.
2
Select probes with a Primer Express software–estimated Tm of 65–67 °C.
3
Make the TaqMan MGB probes as short as possible, but no fewer than
13 nucleotides in length.
4
Avoid runs of an identical nucleotide.
This is especially true for guanine, where runs of four or more should be
avoided.
5
Position the polymorphic site in the central third of the probe.
Note The polymorphic site can be shifted toward the 3´ end to meet the
above guidelines, however, the site must be located more than two nucleotides
upstream from the 3´ terminus.
The following figure illustrates the placement of a polymorphism in an example
probe (N = Nucleotide).
First, try to position the polymorphic
site in the central third of the probe.
Do not place
it here.
5´
3´
N N N N N N N N N N N N N N N N N N N N N
Polymorphism
If necessary, place the
polymorphism here.
Designing TaqMan Assays C-5
Design Tips for Quantitative PCR Assays
Selecting an
Amplicon Site for
Gene Expression
Assays
Selecting a good amplicon site ensures amplification of the target mRNA without
co-amplifying the genomic sequence, pseudogenes, and related genes.
Applied Biosystems recommends the following guidelines when selecting an amplicon
site for quantification assays:
♦
Primers and probes must be designed following the “Assay Development
Guidelines” on page C-2.
♦
The amplicon should span one or more introns to avoid amplification of the target
gene in genomic DNA.
♦
The primer pair has to be specific to the target gene and does not amplify
pseudogenes or other related genes.
♦
Test amplicons and select those that have the highest signal-to-noise ratio (such
as those yielding low CTs with cDNA and no amplification with no template control
or genomic DNA).
♦
If no good sequence is found, it may be necessary to examine the sequence and
redesign the amplicon or simply screen for more sites.
If the gene you are studying does not have introns, then you cannot design an
amplicon that will amplify the mRNA sequence without amplifying the genomic
sequence. In this case, it may be necessary to run RT minus controls.
Selecting and
Preparing Standards
for Absolute
Quantification
To ensure accurate results, the standards used for absolute quantification must be
carefully engineered, validated, and quantified before use. Consider the following
critical points for the proper use of absolute standard curves:
♦
The DNA or RNA used must be a single, pure species. For example, plasmid DNA
prepared from E. coli often is contaminated with RNA, which increases the A260
measurement and inflates the copy number determined for the plasmid.
♦
In general, DNA cannot be used as a standard for absolute quantification of RNA
because there is no control for the efficiency of the reverse transcription step.
♦
Absolute quantities of the standard must be known by some independent means.
Plasmid DNA or in vitro transcribed RNA are commonly used to prepare absolute
standards. Concentration is measured by A260 and converted to the number of
copies using the molecular weight of the DNA or RNA.
♦
Consider the stability of the diluted standards, especially for RNA. Divide diluted
standards into small aliquots, store at -80 °C, and thaw only once before use. An
example of the effort required to generate trustworthy standards is provided by
Collins et al. (Anal. Biochem. 226:120-129, 1995), who reported on the steps they
used in developing an absolute RNA standard for viral quantification.
♦
Pipetting must be accurate because the standards must be diluted over several
orders of magnitude. Plasmid DNA or in vitro transcribed RNA must be
concentrated in order to measure an accurate A260 value. The concentrated DNA
or RNA must then be diluted 106 –1012 -fold to be at a concentration similar to the
target in biological samples.
C-6 Designing TaqMan Assays
Kits, Reagents and
Consumables
D
D
In This Appendix This appendix discusses the following topics:
Topic
Interchangeable Sample Block Modules and Accessories
See Page
D-2
Consumables and Disposables
D-3
Instrument Maintenance and Verification
D-4
TaqMan Pre-Developed Assays and Reagents
D-5
Custom Oligonucleotide Synthesis
D-5
Note Part numbers listed within this appendix are for customers within the United States.
Contact your Regional Sales Office for local Part numbers and prices (see Appendix F,
“Contacting Technical Support,” for a list of telephone and Fax numbers).
Kits, Reagents and Consumables D-1
Interchangeable
Sample Block
Modules and
Accessories
The 7900HT instrument features a Peltier-based, interchangeable sample block
module based on the technology established in the GeneAmp ® PCR System 9700
thermal cycler.
The use of an interchangeable sample block module:
♦
Reduces instrument downtime by allowing immediate replacement of the block.
♦
Permits easy access to the sample block for troubleshooting and maintenance
(see page 7-11).
♦
Supports multiple consumable formats.
♦
Provides several different modes of operation (including Max mode and
programmable temperature ramps).
Part No.
a
Description
Quantity
384-Well Interchangeable Sample Block Module for the
ABI PRISM® 7900HT Sequence Detection System
1 kit
Includes a 384-Well Sample Block Module, a 384-well plate
adapter, and a Sequence Detection Systems 384-Well
Spectral Calibration Kit (P/N 4323977)
a
96-Well Interchangeable Sample Block Module for the
ABI PRISM® 7900HT Sequence Detection System
Includes a 96-Well Sample Block Module, a 96-well plate
adapter, and an ABI PRISM™ 7900HT Sequence Detection
Systems 96-Well Spectral Calibration Kit (P/N 4328639)
a. contact your local Applied Biosystems Sales and Service Office for information.
D-2 Kits, Reagents and Consumables
1 kit
Consumables and The ABI PRISM 7900HT Sequence Detection System can run both:
Disposables ♦ ABI PRISM™ Optical 384-Well Reaction Plates sealed with ABI PRISM™ Optical
Adhesive Covers
♦
ABI PRISM™ 96-Well Reaction Plates sealed with ABI PRISM Optical Adhesive
Covers or ABI PRISM® Optical Caps (flat cap strips only)
IMPORTANT Do not use MicroAmp® Optical Caps or MicroAmp® Optical Tubes with the
7900HT instrument. The instrument is not designed to run MicroAmp consumables which may
damage its internal components if used.
Note ABI PRISM Optical Reaction Plates are designed specifically for fluorescence-based
PCR chemistries and are frosted to minimize external fluorescent contamination. Before
running prepared ABI PRISM Optical Reaction Plates on the 7900HT instrument, each plate
must be sealed with an ABI PRISM Optical Adhesive Cover. Applied Biosystems’ optical
adhesive covers are specifically designed to permit the transmission of light to and from the
wells of the optical plate.
Part No.
Description
Quantity
ABI PRISM™ Optical Adhesive Covers
4313663
ABI PRISM™ Optical Adhesive Cover Starter Kit
20 Covers
Includes 20 ABI PRISM Optical Adhesive Covers, an
Applicator, and a ABI PRISM Optical Cover Compression Pad.
4311971
4323032
ABI PRISM™ Optical Adhesive Covers
100 Covers
ABI PRISM™ Optical Caps, 8 Caps/Strip
300 Strips/
Pkg
2400 Caps/
Pkg
384-Well Optical Reaction Plates
4309849
ABI PRISM™ 384-Well Clear Optical Reaction Plate with
Barcode (code 128)
50 Plates
4326270
10-Pack, ABI PRISM™ 384-Well Clear Optical Reaction Plate
with Barcode (code 128)
500 Plates
Includes 10 ABI PRISM 384-Well Clear Optical Reaction
Plate with Barcode (P/N 4309849).
96-Well Optical Reaction Plates
4306737
ABI PRISM™ 96-Well Optical Reaction Plate with Barcode
(code 128)
20 Plates
4326659
25-Pack, ABI PRISM™ 96-Well Optical Reaction Plate with
Barcode (code 128)
500 Plates
Includes 25 ABI PRISM 96-Well Optical Reaction Plate with
Barcode (P/N 4306737).
4314320
ABI PRISM™ 96-Well Optical Reaction Plate with Barcode
(code 128) and ABI PRISM™ Optical Adhesive Covers
100 Plates
100 Covers
Includes 100 ABI PRISM Optical Adhesive Covers
(P/N 4311971) and 5 ABI PRISM 96-Well Optical Reaction
Plate with Barcode packages (P/N 4306737).
Miscellaneous
4312063
MicroAmp® Splash Free Support Base for 96-Well Reaction
Plates
10 Bases
Kits, Reagents and Consumables D-3
Instrument The following sequence detection kits and reagents are used to perform routine
Maintenance and maintenance on and verify the function of the ABI PRISM 7900HT Sequence Detection
Verification System. For more information about the use of the kits below, see Chapter 7, “System
Maintenance.”
Part Number
Description
Quantity
Sequence Detection Systems Spectral Calibration Kits
4328639
ABI PRISM™ 7900HT Sequence Detection Systems
96-Well Spectral Calibration Kit
3 x 96-Well
Plates
Includes three ABI PRISM Optical 384-Well Reaction
Plates: one preloaded and sealed Background plate, and
two preloaded and sealed Spectral Calibration plates
containing eight separate dye standards (FAM™, JOE™,
NED™, ROX™, SYBR® Green, TAMRA™, TET™,
VIC™).
4323977
Sequence Detection Systems 384-Well Spectral
Calibration Kit
2 x 384-Well
Plates
Includes two ABI PRISM Optical 384-Well Reaction Plates:
one preloaded and sealed Background plate, and one
preloaded and sealed Spectral Calibration plate
containing eight separate dye standards (FAM, JOE, NED,
ROX, SYBR Green, TAMRA, TET, VIC).
TaqMan RNase P Instrument Verification Plates
4310982
TaqMan® RNase P Instrument Verification Plate
Includes one ABI PRISM Optical 96-well Reaction Plate
pre-loaded and sealed with Sequence Detection primers
and TaqMan® probe to detect and quantitate genomic
copies of the human RNase P gene.
4323306
TaqMan® RNase P 384-Well Instrument Verification Plate
Includes one ABI PRISM Optical 384-well Reaction Plate
preloaded and sealed with complete Sequence Detection
primers and TaqMan® probe to detect and quantitate
genomic copies of the human RNase P gene.
D-4 Kits, Reagents and Consumables
1 x 96-Well
Plate
1 x 384-Well
Plate
TaqMan For the latest information on TaqMan PDARs covering gene expression quantification
Pre-Developed and allelic discrimination, visit the TaqMan PDAR list on the Applied Biosystems web
Assays and Reagents site at:
♦
www.appliedbiosystems.com/pdarlist
Custom To order custom oligonucleotides:
Oligonucleotide ♦ Visit the Applied Biosystems Online Store (http://store.appliedbiosystems.com), or
Synthesis
♦
Email Applied Biosystems with your order ([email protected])
Part Number
Description
TaqMan® MGB Probes (5’-Fluorescent label: 6-FAM, VIC or TET)
4316034
5,000-6,000 pmols
4316033
15,000-25,000 pmols
4316032
50,000-100,000 pmols
TaqMan® Probes (5’-Fluorescent label: 6-FAM, VIC or TET; 3’-label: TAMRA)
450025
5,000-6,000 pmols
450024
15,000-25,000 pmols
450003
50,000-100,000 pmols
Sequence Detection Primers
4304970
Minimum 4,000 pmols purified for sequence detection
4304971
Minimum 40,000 pmols purified for sequence detection
4304972
Minimum 130,000 pmols purified for sequence detection
Kits, Reagents and Consumables D-5
References
E
E
Bloch, W. 1991. A biochemical perspective of the polymerase chain reaction.
Biochemistry 30:2735–2747.
Förster, V. Th., 1948, Zwischenmolekulare Energie-wanderung und Fluoreszenz.
Annals of Physics (Leipzig) 2: 55-75.
Higuchi, R., Dollinger, G., Walsh, P.S., and Griffith, R. 1992. Simultaneous
amplification and detection of specific DNA sequences. BioTechnology 10:413-417.
Higuchi, R., Fockler, C., Dollinger, G. and Watson, R. 1993. Kinetic PCR analysis:
Real-time monitoring of DNA amplification reactions. BioTechnology 11:1026-1030.
Lakowicz, J.R. 1983. Chapter 10. Energy Transfer. In: Principles of Fluorescent
Spectroscopy, Plenum Press, N.Y. pp, 303-339.
Lee, L.G., Connell, C.R., and Bloch, W. 1993. Allelic discrimination by nick-translation
PCR with fluorogenic probes. Nucl. Acids Res. 21: 3761-3766.
Livak, K.J., Flood, S.J.A., Marmaro, J., and Mullah, K.B., inventors; Applied
Biosystems (Foster City, CA), assignee. 2 Mar. 1999. Hybridization assay using
self-quenching fluorescence probe. United States patent 5,876,930.
Livak, K.J., Marmaro, J., and Todd, J.A. 1995. Towards fully automated genome-wide
polymorphism screening [letter]. Nat. Genet. 9:341–342.
Martens, H. and Naes, T., 1989. In: Multivariate Calibration, John Wiley & Sons,
Chichester.
References E-1
Contacting
Technical Support
F
F
Services and Support
Applied Biosystems To access the Applied Biosystems Web site, go to:
Web Site
http://www.appliedbiosystems.com
At the Applied Biosystems Web site, you can:
♦
Search through frequently asked questions (FAQs)
♦
Submit a question directly to Technical Support
♦
Order Applied Biosystems user documents, MSDSs, certificates of analysis, and
other related documents
♦
Download PDF documents
♦
Obtain information about customer training
♦
Download software updates and patches
In addition, the Applied Biosystems Web site provides a list of telephone and fax
numbers that can be used to contact Technical Support.
Contacting Technical Support F-1
Limited Warranty
Statement
G
G
Warranty Statement PE Corporation (NY), through its Applied Biosystems Group (“Applied Biosystems“)
warrants to the customer that, for a period ending on the earlier of one year from the
completion of installation or fifteen (15) months from the date of shipment to the
customer (the “Warranty Period”), the ABI PRISM ® 7900 HT Sequence Detection
System purchased by the customer (the “Instrument”) will be free from defects in
material and workmanship, and will perform in accordance with the installation
specifications set forth in the system specifications sheet which accompanies the
instrument or which is otherwise available from an Applied Biosystems sales
representative.
During the Warranty Period, if the Instrument's hardware becomes damaged or
contaminated or if the Instrument otherwise fails to meet the Specifications,
Applied Biosystems will repair or replace the Instrument so that it meets the
Specifications, at Applied Biosystems' expense. However, if the thermal cycling
module becomes damaged or contaminated, or if the chemical performance of the
Instrument otherwise deteriorates due to solvents and/or reagents other than those
supplied or expressly recommended by Applied Biosystems, Applied Biosystems will
return the Instrument to Specification at the customer's request and at the customer's
expense. After this service is performed, coverage of the parts repaired or replaced
will be restored thereafter for the remainder of the original Warranty Period.
This Warranty does not extend to any Instrument or part which has been (a) the
subject of an accident, misuse, or neglect, (b) modified or repaired by a party other
than Applied Biosystems, or (c) used in a manner not in accordance with the
instructions contained in the Instrument User's Manual. This Warranty does not cover
the customer-installable accessories or customer-installable consumable parts for the
Instrument that are listed in the Instrument User's Manual. Those items are covered
by their own warranties.
Applied Biosystems' obligation under this Warranty is limited to repairs or
replacements that Applied Biosystems deems necessary to correct those failures of
the Instrument to meet the Specifications of which Applied Biosystems is notified prior
to expiration of the Warranty Period. All repairs and replacements under this Warranty
will be performed by Applied Biosystems on site at the Customer's location at
Applied Biosystems's sole expense.
Limited Warranty Statement G-1
No agent, employee, or representative of Applied Biosystems has any authority to
bind Applied Biosystems to any affirmation, representation, or warranty concerning
the Instrument that is not contained in Applied Biosystems's printed product literature
or this Warranty Statement. Any such affirmation, representation or warranty made by
any agent, employee, or representative of Applied Biosystems will not be binding on
Applied Biosystems.
Applied Biosystems shall not be liable for any incidental, special, or consequential
loss, damage or expense directly or indirectly arising from the purchase or use of the
Instrument. Applied Biosystems makes no warranty whatsoever with regard to
products or parts furnished by third parties.
This Warranty is limited to the original location of installation and is not transferable.
THIS WARRANTY IS THE SOLE AND EXCLUSIVE WARRANTY AS TO THE
INSTRUMENT AND IS IN LIEU OF ANY OTHER EXPRESS OR IMPLIED
WARRANTIES, INCLUDING, WITHOUT LIMITATION, ANY IMPLIED WARRANTY
OF MERCHANTABILITY OR FITNESS FOR A PARTICULAR PURPOSE AND IS IN
LIEU OF ANY OTHER OBLIGATION ON THE PART OF APPLIED BIOSYSTEMS.
G-2 Limited Warranty Statement
Index
Symbols
> symbol
3-4
Numerics
7900HT instrument, See instrument
9600 emulation mode 4-14
A
ABI Prism 7700 Sequence Detection System,
emulating 4-14
ABI PRISM SDS Single Plate (*.sds) files
See plate documents
ABI PRISM SDS Template Document (*.sdt) files
See templates
absolute quantification
about 6-4 to 6-5
analyzing data 6-7 to 6-14
assay development guidelines C-6
procedure checklist 6-7
selecting and preparing standards C-6
setting up (procedure checklist) 4-3
troubleshooting 8-11
adding
bar code to a plate document 3-19, 4-19
custom dyes to the pure dye set 7-21
detector tasks to a plate document 4-11
detectors to a plate document 4-8
markers to a plate document 4-10
plate documents to the plate queue 4-31, 4-35
sample names to a plate document 4-19
adjusting
analysis options for absolute quantification 6-8
display settings 4-17
method step parameters 4-15
plate-sensor switch 7-28 to 7-31
adjustment knob 7-27
air bubbles 8-5
aligning
fixed-position bar code reader 7-40 to 7-42
plate handler 7-32 to 7-39
allele calls
about 5-12
calling 5-11
scrutinizing 5-13
DRAFT December 11, 2001 8:32 pm
4317596IX.fm
allelic discrimination
about 5-4 to 5-6
analyzing run data 5-8 to 5-15
assay development guidelines C-5
maximizing throughput 4-2
procedure checklist 5-8
setting up (procedure checklist) 4-4
thermal cycling on the 7900HT instrument
troubleshooting 8-13
Allelic Discrimination Plot
about 5-10
calling alleles 5-11
datapoint cluster variations 5-5
exporting as a graphic file B-8
exporting data as a text file B-9
genotypic segregation 5-6
outliers 5-6
scrutinizing allele calls 5-13
amplification curve
about A-7
Geometric (Exponential) Phase A-7
Linear Phase A-8
Plateau Phase A-8
Amplification Plot
exporting as a graphic file B-8
exporting data as a text file B-9
setting the baseline 6-10
setting the threshold 6-11
visualizing outliers 6-12
analyzing
absolute quantification data 6-7 to 6-14
allelic discrimination data 5-8 to 5-15
background data 7-16
dissociation curve data 6-20 to 6-24
pure dye data 7-20
applying
detector tasks 4-11
detectors to a plate document 4-8
markers to a plate document 4-10
sample names 4-19
archiving SDS files 7-46
assay development guidelines
absolute quantification C-2 to C-4, C-6
allelic discrimination C-2 to C-5
attention words, definitions 1-2
automation accessory
components 7-27
fixed-position bar code reader
See fixed-position bar code reader
plate handler, See plate handler
4-14
Index-1
A(continued)
Automation Controller software
about 2-14, 4-34
adding plates to the plate queue 4-35
configuring for operation 4-37
ejecting a plate 4-38
launching 4-34
monitoring instrument progress 4-38
removing plates from the plate queue 4-35
starting the plate queue 4-38
stopping the plate queue 4-38
B
background run 7-13 to 7-16
about 7-13
constructing a background plate 7-15
creating a plate document 7-14
extracting 7-16
preparing a background plate 7-15
troubleshooting 8-8
when to perform 7-13
bar code information
entering into a plate document 3-19, 4-19
bar code readers
fixed position, See fixed-position bar code reader
hand held, See hand-held bar code reader
baseline
about A-10
configuring value for automatic analysis 6-8
setting manually 6-10
beam splitter
See instrument, optics system
Block readout (from the Real Time tab) 4-25
bold text, convention 3-4
C
calibrating the 7900HT instrument
adjusting the plate-sensor switch 7-28
aligning the fixed-position bar code reader
aligning the plate handler 7-32
performing background run 7-13
performing pure dye (spectral) run 7-17
CAUTION attention word, definition 1-2
changing
gripper finger pads 7-43
pane, view, and plot sizes 3-15
sample block module 7-4
charged coupled device array
See instrument, optics system
checklists
absolute quantification 6-7
allelic discrimination 5-8
dissociation curve 6-20
plate document setup
absolute quantification 4-3
allelic discrimination 4-4
dissociation curve 4-4
chemical safety 1-3
Index-2
7-40
chemistry
non-optimized 8-5
SYBR Green A-3
TaqMan A-2
troubleshooting 8-4 to 8-7
cleaning
gripper finger pads 7-43
sample block wells 7-12
closing
instrument tray
from the Automation Controller software 4-38
from the SDS software 4-27
plate documents 3-14
Zymark Twister software 7-39
comments
adding to a detector 4-7
adding to a plate document 4-19
computer
about 2-7
hard drive partitions 2-7
maintaining 7-46
minimum system requirements 2-7
troubleshooting 8-14
turning ON 3-5
configuring the 7900 instrument for 9600 emulation 4-14
consumables
384-Well Optical Reaction Plates D-3
96-Well Optical Reaction Plates D-3
improper or damaged plastics 8-7
Optical Adhesive Covers D-3
Optical Cap Strips D-3
writing on reaction plates 8-6
contamination
decontaminating the sample block 7-11
fluorescent, common sources 8-6
isolating on the sample block module 8-8
contextual menus, using 3-20
copying
detectors to a plate document 4-8
markers to a plate document 4-10
Cover readout (from the Real Time tab) 4-25
creating
detectors 4-7
markers 4-9
plate documents 3-12, 4-6
for running background plates 7-14
for running custom pure dyes 7-22
for running pure dye plates 7-18
from a template 4-18, 4-32
CT, See threshold cycle
custom pure dyes
adding to the pure dye set 7-21 to 7-23
creating a custom pure dye plate 7-21
customer support, See technical support
cycle set, adding to a method 4-15
D
DANGER attention word, definition 1-2
data collection A-5
data type definitions (exportable) B-9
decontaminating the sample block module 7-11 to 7-12
defragmenting the hard drive 7-47
deleting, steps from a method 4-15
detector tasks
about 4-11
applying 4-11
importing into a plate document B-2
detectors
about 4-7
applying to a plate document 4-8
copying to a plate document 4-8
creating 4-7
importing into a plate document B-2
tasks, See detector tasks
determining melting temperatures 6-23
disconnecting the SDS software 4-28
display settings, adjusting 4-17
dissociation curve
about 6-18
analyzing 6-20 to 6-24
definitions of the Tm value 6-22
procedure checklist 6-20
programming a temperature ramp 4-16
setting up (procedure checklist) 4-4
Dissociation Plot
about 6-22
exporting as a graphic file B-8
exporting data as a text file B-9
E
ejecting a plate from the 7900HT instrument 4-27, 4-38
eliminating
outliers 6-12
wells from use 6-12
emission filter
See instrument, optics system
end-point runs
about 5-2
allelic discrimination, See allelic discrimination
entering
bar code information 3-19, 4-19
using the Template Batch utility 4-32
comments
into a detector 4-7
into a plate document 4-19
sample names into a plate document 4-19
exportable data type definitions B-9
exporting
data from a plate document 3-13, B-9
plots and views as graphic files B-8
F
finger pads
cleaning 7-43
replacing 7-43
fixed-position bar code reader
aligning 7-40 to 7-42
connections 2-11
location 2-8
specification 2-8
fluorescent
contamination 8-6
detection system 2-11, A-4
fluorogenic probe
about A-2
designing C-2 to C-3
G
genotypic segregation of datapoints
(Allelic Discrimination Plot) 5-6
Geometric (Exponential) Phase A-7
grating, See instrument, optics system
grey dividing line, using 3-15
grid, See plate grid
gripper 7-27
guidelines
assay development
absolute quantification C-6
allelic discrimination C-5
loading the plate handler 4-36
setting the baseline 6-10
setting the threshold 6-11
TaqMan probe design C-2 to C-3
H
hand-held bar code reader
connections 2-11
location 2-8
specification 2-8
using 3-19
hard drive
defragmenting 7-47
partitions 2-7
heated clamp 2-4
help
background information 3-3
using the SDS Online Help 3-3
hold, adding to a method 4-15
hotkey combinations, using 3-20
I
Important attention word, definition 1-2
importing setup table data 3-14, B-2
imprecise pipetting 8-5
improper threshold setting 8-4
Index-3
I(continued)
M
installing
plate adapter 7-9
sample block module 7-4
SDS software 7-48
the operating system software 7-47
instrument 2-4
about 2-2 to 2-11
external components 2-3
firmware 2-14
internal components 2-4
loading plates 4-24
maintaining 7-2
optics system 2-6, A-4
safety labels 1-2
status lights 3-6
supported runs and chemistries 2-2
troubleshooting 8-14
turning ON 3-5
instrument tray 4-38
opening and closing
from the Automation Controller software 4-38
from the SDS software 4-27
replacing the plate adapter 7-9
irreproducibility
causes 8-4 to 8-7
J
Java Runtime Environment, about
2-14
K
keyboard shortcuts, using
3-20
L
labels 1-2
laser source, See instrument, optics system
launching
Automation Controller software 4-34
SDS software 3-7
LAVA software
about 2-14
aligning the fixed-position bar code reader
7-40 to 7-42
launching 7-40
LDHost software, See LAVA software
learning to use the SDS software 3-11
lights, See instrument, status lights
limited warranty statement G-1
Linear Phase of the amplification curve A-8
loading plates
into the instrument 4-24
into the plate handler stacks 4-37
low copy templates 8-7
Index-4
maintenance schedule 7-2
manual, See user guide
marker inspector 3-22
markers
about 4-9
applying to a plate document 4-10
copying to a plate document 4-10
creating 4-9
importing into a plate document
B-2
master mixes
preparing C-4
using 8-5
maximizing, instrument throughput 4-2
maximizing/minimizing panes, views, and plots
melting temperature
definition 6-22
determining 6-23
methods
about 4-13 to 4-16
adding
a hold, cycle set, or step 4-15
temperature ramp 4-16
adjusting step parameters 4-15
configuring data collection options 4-15
programming 4-14 to 4-16
removing a step 4-15
setting the sample volume 4-15
multicomponenting A-5
3-15
N
no template control (NTC)
detector task
applying 4-11
NTC calls
applying 5-12
verifying 5-13
normalization
of reporter signals A-6
normalized reporter signal A-6
Note attention word, definition 1-2
O
opening
instrument tray
from the Automation Controller software 4-38
from the SDS software 4-27
plate documents 3-13
operating system
supported 2-7
upgrading 7-47
operating the 7900HT instrument
power switch 3-5
optimizing primer and probe concentrations C-4
outliers
absolute quantification 6-12
allelic discrimination 5-6
P
panes
hiding 3-16
maximizing/minimizing 3-15
resizing 3-15
showing 3-16
passive reference
setting 4-12
use in multicomponent analysis A-5
PCR
5´ Nuclease Assay A-2
Geometric (Exponential) Phase A-7
kinetic analysis of A-7
Linear Phase A-8
Plateau Phase A-8
SYBR Green Chemistry A-3
pipetting errors 8-5
pipettors, using 8-5
plate adapter, changing 7-9
plate document information
applying to a plate document 4-19
plate documents 4-6
about 3-11
adding to the plate queue 4-31, 4-35
applying detector tasks 4-11
applying sample names 4-19
assigning standard quantities 4-12
closing 3-14
configuring document information 4-19
copying detectors 4-8
copying markers 4-10
creating 3-12, 4-6
from a template 4-18, 4-32
exporting 3-13
importing setup data 3-14, B-2
methods, See methods
opening 3-13
programming methods 4-13
removing from the plate queue 4-35
running
in batches 4-34
individually 4-20
saving 3-12
as a single plate file 4-22
as a template file 4-17
setting Sample Volume 4-15
setting the passive reference 4-12
plate grid
about 3-21
eliminating wells from use 6-12
selecting wells 3-17
viewing well information 3-16
zooming 3-18
plate handler 2-9, 7-27
aligning 7-32 to 7-39
arm
adjustment knob 7-27
gripper 7-27
plate-sensor switch 7-27
cleaning the finger pads 7-43
plate stack positions 7-27
replacing the finger pads 7-43
turning ON 3-5
plate queue
adding plate documents
from the Automation Controller software 4-35
from the SDS software 4-31
using the Template Batch utility 4-32
removing plate documents 4-35
starting 4-38
stopping 4-38
plate stacks
loading plates 4-36, 4-37
placing in use 4-37
positions 7-27
Plateau Phase of the amplification curve A-8
plates
running
batches 4-34
individually 4-23
types, See consumables
plate-sensor switch 7-27
adjusting 7-28 to 7-31
plots
hiding 3-16
maximizing/minimizing 3-15
resizing 3-15
showing 3-16
Post readout (from the Plate Read tab) 4-25
precision
causes of low precision 8-4 to 8-7
preparing
master mixes C-4
plate for a run 4-23
primer and probe concentrations
optimizing C-4
programming
methods
for absolute quantification 4-14
for allelic discrimination 4-14
for dissociation curve analysis 4-16
temperature ramp 4-16
pure dye plate
constructing for custom dyes 7-21
preparing for use 7-19
pure dye run
about 7-17
creating a plate document 7-18
extracting data 7-20
performing 7-19
troubleshooting 8-10
when to perform 7-17
Index-5
Q
quantifying
probes and primers C-4
standards for absolute quantification C-6
quantitative RT-PCR
about 6-2
absolute, See absolute quantification
types of 6-2
quantities, applying to a plate document 4-12
R
R2 readout (from the Standard Curve Plot) 6-14
reagents
custom oligonucleotides D-5
non-Applied Biosystems PCR reagents 8-7
TaqMan Pre-Developed Assays and Reagents D-5
TaqMan RNase P Instrument Verification Plates D-4
re-connecting the SDS software 4-28
removing
outliers 6-12
plate documents from the plate queue 4-35
steps from a method 4-15
wells from use 6-12
Rep readout (from the Real Time tab) 4-25
replacing
gripper finger pads 7-43
sample block module 7-4
reporter signal
normalization A-6
resizing panes, views, and plots 3-15
restacking plates 4-37
Rn, See normalized reporter signal
running
batches of plates 4-34
single plate 4-23
S
safety
chemical hazards 1-3
chemical waste 1-3
labels, safety 1-2
laser exposure 1-2
waste disposal 1-4
waste profiles 1-4
sample block locking bar 7-6
sample block locking bolt 7-6
sample block module
about 2-5
cleaning sample block module wells 7-12
contamination 8-7
replacing 7-4
sample names
adding to a plate document 4-19
importing into a plate document B-2
Sample readout (from the Real Time tab) 4-25
sample volume setting 4-15
saturation, signal 7-21
saving
Index-6
plate documents 3-12, 4-22
as template files 4-17
scrutinizing allele calls 5-13
SDS software
about 2-14
disconnecting 4-28
installing 7-48
launching 3-7
learning to use the software 3-11
re-connecting 4-28
upgrading 7-48
selecting
wells from the plate grid 3-17
setting
baseline values 6-10
threshold value 6-11
setup table file
about B-4
example files B-4
exporting B-9
importing into a plate document B-2
structure B-5
signal saturation 7-21
Slope readout (from the Standard Curve Plot) 6-14
spectral calibration, See pure dye runs
Stage readout (from the Real Time tab) 4-25
Standard Curve Plot
about 6-14
exporting as a graphic file B-8
exporting data as a text file B-9
standards
quantifying for absolute quantification C-6
selecting for absolute quantification C-6
starting
plate queue 4-38
run from the SDS software 4-24
State readout (from the Real Time tab) 4-25
Status readout (from the Real Time tab) 4-25
step
adding to a method 4-15
Step readout (from the Real Time tab) 4-25
stopping
plate queue 4-38
run from the SDS software 4-26
Support F-1
SYBR Green 1 Dye
about A-3
T
table pane
about 3-21
exporting B-9
TaqMan fluorogenic probe
about A-2
designing C-2 to C-3
outliers 6-12
T(continued)
TaqMan RNase P Instrument Verification Plates
about 7-24
analyzing 7-26
kits D-4
preparing a plate document 7-25
running 7-24, 7-26
tasks, See detector tasks
technical support F-1
templates
about 3-11
creating a single plate document 4-18
creating multiple plate documents 4-32
saving as 4-17
thermal cycler block, See sample block module
thermal cycling protocol, See methods
threshold
about A-10
configuring for automatic analysis 6-8
improper setting 8-4
setting manually 6-11
threshold cycle
calculation A-10
relationship to PCR product A-11
Time readout (from the Real Time tab) 4-25
Time Remaining readout (from the Real Time tab) 4-25
Tm, See melting temperature
troubleshooting 8-2 to 8-17
7900HT Instrument 8-14
background runs 8-8
chemistry problems 8-4 to 8-7
computer 8-14
end-point runs 8-13
fixed-position bar code reader 8-17
pure dye runs 8-10
real-time runs 8-11
SDS software 8-14
Zymark Twister Microplate Handler 8-17
turning ON the ABI PRISM 7900HT Sequence Detection
System 3-5
W
WARNING attention word, definition
warranty statement G-1
well inspector 3-22
1-2
Y
Y Inter readout (from the Standard Curve Plot) 6-14
Z
zooming
allelic discrimination plot 5-11
plate grid wells 3-18
Zymark Twister Microplate Handler
See plate handler
Zymark Twister software
about 2-14
aligning the plate handler 7-32 to 7-39
closing 7-39
launching 7-32
testing the plate sensor switch 7-30
U
upgrading
operating system software
SDS software 7-48
user guide
conventions 3-4
organization of
terminology 3-3
7-47
V
viewing, well information 3-16
views
hiding 3-16
maximizing/minimizing 3-15
resizing 3-15
showing 3-16
visualizing
Index-7
Headquarters
850 Lincoln Centre Drive
Foster City, CA 94404 USA
Phone: +1 650.638.5800
Toll Free (In North America): +1 800.345.5224
Fax: +1 650.638.5884
Worldwide Sales and Support
Applied Biosystems vast distribution and
service network, composed of highly trained
support and applications personnel, reaches
into 150 countries on six continents. For sales
office locations and technical support, please
call our local office or refer to our web site at
www.appliedbiosystems.com or to the
Technical Support and Training appendix in this
document.
www.appliedbiosystems.com
Applera Corporation is committed to providing
the world’s leading technology and information
for life scientists. Applera Corporation consists of
the Applied Biosystems and Celera Genomics
businesses.
Printed in the USA, 12/2001
Part Number 4317596 Rev. A4
ABI PRISM® 7900HT Sequence Detection System
User Guide