1
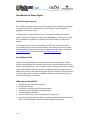
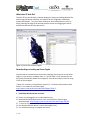
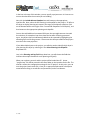
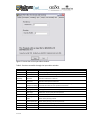
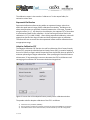
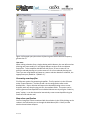
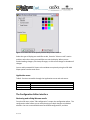
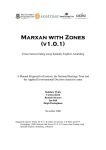
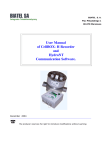
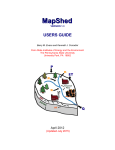
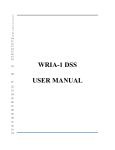
Using the Zonae Cogito Decision Support
System
A manual prepared by
Applied Environmental Decision Analysis Centre
Matt Watts, Romola Stewart, Dan Segan, and Lindsay Kircher
The Ecology Centre, University Of Queensland
March 2011
1 of 35
Introduction
This software was written by Matthew Watts and Romola Stewart from The Ecology
Centre, University of Queensland.
Zonae Cogito comes from the Latin 'Zonae', meaning zones, and 'Cogito', meaning to
think or reflect on. In other words, the title means to think about zones. Within this
manual we will refer to Zonae Cogito as ZC.
The purpose of the software is to act as a decision support system and database
management system for the family of Marxan software. It incorporates open source
GIS software components, and is a freely available software package.
2 of 35
Table of Contents
Introduction to Zonae Cogito........................................................................................ 4
Decision Support System .......................................................................................................................4
Free Software Tools ...............................................................................................................................4
What can you do with ZC? .....................................................................................................................4
What does ZC look like?.........................................................................................................................5
Downloading and setting up Zonae Cogito............................................................................................5
Launching ZC ..........................................................................................................................................8
Creating a new ZC project......................................................................................................................8
Opening an existing ZC project file ......................................................................................................11
Arranging the GIS and Marxan windows .............................................................................................11
The Marxan Interface..................................................................................................11
Editing Marxan files and parameters...................................................................................................11
Advanced parameter editing ...............................................................................................................15
Calibrating Marxan parameters...........................................................................................................15
Using the ZC Calibration Tools.............................................................................................................16
Steps in using parameter calibration ...................................................................................................16
Exponential Calibration........................................................................................................................17
Adaptive Calibration FPF......................................................................................................................17
Detailed Calibration Information.........................................................................................................18
View Calibration Summary Report.......................................................................................................19
Do Cluster Analysis...............................................................................................................................19
The Marxan Dashboard........................................................................................................................20
The GIS Interface .........................................................................................................21
Viewing Marxan results in the GIS display...........................................................................................22
Query Engine........................................................................................................................................23
Generating new shapefiles ..................................................................................................................24
Map color specification........................................................................................................................24
Application menu.................................................................................................................................25
The Configuration Editor Interface.............................................................................25
Reviewing and editing Marxan results.................................................................................................25
Creating a new configuration...............................................................................................................26
Making changes to a configuration......................................................................................................26
Generating Reports from configurations.............................................................................................28
Table Processing ..........................................................................................................30
Convert data menu ..............................................................................................................................30
Text Table menu...................................................................................................................................31
Graphing in ZC......................................................................................................................................31
Using the C-Plan software...........................................................................................33
Downloading and installing C-Plan ......................................................................................................33
Starting the C-Plan dataset with Zonae Cogito....................................................................................33
Selecting and posting sites...................................................................................................................33
Key C-Plan Functionality ......................................................................................................................34
Troubleshooting ..........................................................................................................35
References ...................................................................................................................35
Acknowledgements.....................................................................................................35
3 of 35
Introduction to Zonae Cogito
Decision Support System
ZC is a decision support system written in the object Pascal programming language.
It features an interface to the Marxan family of software, and an integrated
geographic information system.
It is designed as a simple and robust way to run Marxan analyses and view the
results. Due to the integration of open source GIS software, it eliminates the need
for an individual or organisation to purchase costly GIS software in order to use
Marxan.
The Ecology Centre is continuing development on ZC, and new features will be
incorporated into later versions of the software. We encourage you to assist with
this development process by emailing your suggestions to the authors Matt Watts;
[email protected] or Romola Stewart [email protected]
Free Software Tools
Marxan is the world leading systematic conservation planning software, and we
present a methodology for performing state of the art conservation planning using
entirely free software tools. The one proviso of this is that users must have a copy of
a Microsoft Windows operating system or compatible software emulator (such as
WINE that runs in the Linux operating system) to run the software. A future version
of Zonae Cogito may have native compatibility with the Linux operating system to
eliminate the need for an emulator.
What can you do with ZC?
•
•
•
•
•
•
•
Edit Marxan parameters and input files
Run Marxan analyses
Interactively view the results of Marxan analyses
Interactively make changes to Marxan solutions
Calibrate Marxan parameters
Use it as a GIS for the C-Plan Conservation Planning System
Run the full range of Marxan software (including standard Marxan, Marxan with
Zones, Threat Probability, and cluster analysis of Marxan solutions)
4 of 35
What does ZC look like?
The base ZC has two windows, a Marxan display for viewing and editing Marxan files
and running the Marxan software, and another for the Geographic Information
System (GIS) display. The size of each window can be customized by the user, by
simply selecting the edge of the window with the mouse and dragging the mouse
until the window reaches the desired size.
Figure 1: Screen shot of Zonae Cogito.
Downloading and setting up Zonae Cogito
You will need to complete these steps when preparing your computer to use Zonae
Cogito. It is necessary to complete steps 1, 2, and 6. Steps 3-5 are optional and are
for specific functionality within Zonae Cogito (3-4 for cluster analysis, and 5 for using
C-Plan in Zonae Cogito).
**Note: it is necessary to have Marxan version 2.1.1 or above and/or Marxan with
Zones 1.0.1 or above to use Zonae Cogito.
http://www.uq.edu.au/marxan/index.html?page=77064 **
1. Install Map Window Active X control
Ensure you are logged in as an administrative user,
Download the Map Window Active X 4.5 control from the Zonae Cogito
download page: http://www.uq.edu.au/marxan/index.html?page=106746
**You must use version 4.5**
Run the Map Window Active X control executable (.exe),
Use all default settings to complete the install.
5 of 35
It may also be necessary to issue the following command in a startup script to
register the Map Window active X component: regsvr32 "C:\Program
Files\Common Files\MapWindow\MapWinGIS.ocx"
If during the installation you get an Error message similar to "Unable to register
OCX MapWinGIS.ocx", please select the "Ignore" option.
2. Install Zonae Cogito
Ensure you are logged in as an administrative user,
Download Zonae Cogito from the Zonae Cogito download page:
http://www.uq.edu.au/marxan/index.html?page=106746
Run the Zonae Cogito setup executable (.exe)
Use all default settings to complete the install.
3. Install R if you do not already have it on your computer (to use cluster analysis
function)
Ensure you are logged in as an administrative user,
Download R from: http://www.r-project.org/
Run the R setup executable (.exe),
Use all default settings to complete the install.
4. Install R packages (to use cluster analysis function)
Ensure you are logged in as an administrative user,
Download the correct packages (labdsv, rgl, tkrgl and vegan) from:
http://cran.ms.unimelb.edu.au/ (or, if you are not in Australia, from your closest
CRAN page- find this by clicking on CRAN under Download, Packages on the main
R website page)
Save the packages locally as zip files,
Launch the R application from the start menu,
Within the R application, from the "Packages" menu, click "Install package(s)
from local zip files...",
Browse to the folder where you saved the zip files,
Select the 4 zip files (you might have different versions), "labdsv_1.3-1.zip",
"rgl_0.81.zip", "tkrgl_0.6.zip" and "vegan_1.15-0.zip"
Click "Open",
The 4 packages will now be installed
5. Install C-Plan (to use C-Plan within Zonae Cogito)
It is not necessary to install C-Plan if you are only using Marxan,
Ensure you are logged in as an administrative user,
Download C-Plan version 4 from:
http://www.uq.edu.au/ecology/index.html?page=106842
6 of 35
Run the C-Plan setup executable (.exe),
Use all default settings to complete the install.
6. Finalising the Install
We perform the following steps in order to register the MapWindow ActiveX
control.
Reboot the computer so all the application installed are ready for use,
Ensure you log in as an administrative user,
Run Zonae Cogito with the administrative login (Start menu>All programs>Zonae
Cogito),
When running Zonae Cogito, ensure you load an existing project with a map
(shapefile), or create a new project that displays a map (details in Creating a New
ZC Project in the next section of this manual),
This is so that the MapWindow ActiveX component will load and execute at least
once with the administrative login. If this does not happen, when a non-admin
user attempts to use the MapWindow ActiveX component, it will fail to initialise
and Zonae Cogito will not function.
7. Windows 7 and Vista User Access Control
If you are using Windows7 or Vista, you may need to temporarily disable UAC (User
Access Control) in to register the Map Window ActiveX control. This will be necessary
if step 6 above does not register the map control on your system. This may be
apparent as very slow performance of the map control, or as a runtime error when
attempting to use the map control.
Ensure you log in as an administrative user,
Disable UAC with the registry editor;
1. Run the registry editor (RegEdit) by typing regedit at command prompt or
at startmenu->run
2. Locate following registry key:
HKEY_LOCAL_MACHINE\Software\Microsoft\Windows\CurrentVersion\Policies\Syst
em
3. Locate the following REG_DWORD value:
EnableLUA
4. Set the value of EnableLUA to 0.
5. Reboot the computer
Register the active X control;
On a 64 bit OS;
regsvr32.exe "c:\Program Files (x86)\Common
Files\MapWindow\MapWinGIS.ocx"
On a 32 bit OS;
regsvr32.exe "c:\Program Files\Common Files\MapWindow\MapWinGIS.ocx"
7 of 35
Enable UAC by setting EnableLUA to 1 with the registry editor,
Reboot the computer.
You have now completed the install of Zonae Cogito and support software, and it is
ready to use.
Launching ZC
ZC can be launched either by clicking directly on the executable file
(ZonaeCogito.exe) or by navigating to ZC through the start menu.
Creating a new ZC project
After you have created a Marxan database, you will need to make a new Zonae
Cogito project file (*.zcp) to load the database into ZC. This file loads the appropriate
planning unit GIS file and the input.dat file from the Marxan database, along with
any other GIS layers that you want to be able to view with the Marxan solutions.
From the ZC main menu, choose File > New Project and the following window will
appear:
Figure 2: Screen shot of create a new ZC project window.
8 of 35
In the box at the top of this window, you can specify a project name. It is best to use
a name that describes the scenario you are building.
Next, tick the Include Marxan Database box and browse to the appropriate
input.dat file. Next, select the GIS Planning Unit shapefile for the project. ZC will use
this layer to display planning unit status in the maps of the Marxan solutions. Click
on the Browse button to the right of the “Locate ESRI Shapefiles for GIS display”, and
then browse to the appropriate planning unit shapefile.
You can also add additional contextual GIS layers that you might want to view with
the solutions, for example a layer that shows the location of existing protected
areas. Any layers that are inadvertently added can be removed by highlighting the
offending layer and clicking remove. Please note that all layers added to the project
must be in the same projection.
If you add multiple layers to the project, you will also need to identify which layer is
your planning unit layer by selecting it in the Select Planning Unit Shapefile
dropdown box.
Last, in the Planning unit key field drop down box, you will choose the field that
indicates the unique identifier for each planning unit (puid).
When you are done, press ok and the project will be loaded into ZC. A new
“project1.zcp” file will be created in the same folder as the input.dat for the file. The
new file contains the configuration settings for the ZC project. At this point, you can
save the project (main menu File > Save) in an appropriate place with a descriptive
name before moving on to edit files and parameters, and to run Marxan.
9 of 35
Figure 3: New ZC project prior to running Marxan
If you are opening a creating a new project that has not been run in ZC before, the
GIS display will initially appear blank (See figure 3). After running Marxan for the
first time, the GIS display will be populated with the planning units and the results
from the Marxan runs (see Figure 4).
Figure 4: New ZC project after running Marxan
10 of 35
Opening an existing ZC project file
To open a previously created ZC project file (.zcp), select File > Open from the ZC
main menu. Both the GIS and the Marxan windows will automatically open. If you
cannot see the map in the GIS window, go to the main menu and choose GIS > Zoom
> Layer.
Table 1: Summary of the functions accessible through the File menu and sub-menus.
Menu
Sub Menu
Purpose
New Project
Create new ZC projects
New Window
Launches a second instance of ZC
Open
Open an existing ZC project
Recent Files
Allows you to browse to recently used ZC projects
Save
Saves the current project
Exit
Closes ZC
Arranging the GIS and Marxan windows
To arrange the GIS and Marxan windows in ZC, select Windows > Arrange from the
Main Menu. Choose vertical, horizontal, or cascade as the arrangement type, and
press ok to apply the change. The window functions can help you to locate a
window that may have been inadvertently ‘lost’ when viewing another window.
The Marxan Interface
Editing Marxan files and parameters
In the Marxan window (pictured below), you can review and edit your input files and
the most commonly used Marxan Parameters. To edit a file or parameter, choose
the appropriate selection from the ‘Marxan Parameter to Edit’ drop down menu.
11 of 35
Figure 5: Marxan window in ZC
To edit one value, click on it, and then change the value in the Edit value box. If you
would like to edit an entire field, click on one of the values in that field, then tick the
‘Edit All Rows’ box, and change the value in the Edit Value box (but remember to untick this box when you are finished to avoid accidentally changing entire columns of
other data). If you would like to edit several values at a time, highlight the cells
(using the ‘shift’ key, or clicking and dragging with the mouse) and change the cell
value in the Edit Value box.
When you finish editing a file or parameter, press the ‘Save Parameter’ button. If you
forget to save your edits, ZC will prompt you to save them when you attempt change
to a different Marxan parameter or run Marxan.
To run Marxan, press the ‘Run’ button, and Marxan will start. After the Marxan run is
complete, the GIS display will be refreshed with the results of the new Marxan run.
Marxan Menu
The Marxan menu in ZC provides access to additional functionality that is not
available through the Marxan window of ZC.
Table 2: A summary of functions accessible through the Marxan menu and submenus.
12 of 35
Menu
Sub Menu
Purpose
Run Marxan
Method for starting Marxan
Save Run
Saves a copy of the Marxan database
Load Run
Restore a copy of the Marxan database that has been saved
Calibration
Adaptive
Calibration FPF
Allows you to use an assisted calibration tool for key Marxan parameters
View Output
Input Editor
Hide Marxan
console
Do Cluster
Analysis
Browse
Annealing
Output
Allows you to use an assisted calibration tool for the Marxan FPF parameter
Calibration Report
If you have run an assisted calibration, this opens the report for viewing
Summary Report
Best solution
features
After a Marxan run, you can view the summary report (sum.txt file)
After a Marxan run, you can view the best solution features report (mvbest.txt file)
Allows you to edit the input parameter file using the classic Marxan InEdit interface
Allows you to view the progress of classic Marxan interface as it runs or to hide it.
Turns on and off the cluster analysis feature for solutions (requires R and R
packages to be installed)
Allows you to view the annealing process spatially and the impact on the score,
cost, connectivity and penalty.
Save Run
Makes a copy of the existing Marxan database, including all output files and any
changes you have made to the input files. Files are saved into a scenarios folder
inside the existing Marxan database. If this is the first scenario you have saved, the
scenarios folder will be generated for you.
Input Editor
It is important to recognize that not all parameters in Marxan can be edited through
the Marxan window of ZC. The additional parameters that are not editable through
the main Marxan window of ZC can be accessed through the classic Marxan InEdit
interface window or can be directly edited in the input.dat. To launch the input
editor window, select Input editor from the Marxan menu (see below). Additional
documentation for parameters in the input editor is available in the Marxan manuals
on the Marxan website (www.uq.edu.au/marxan).
13 of 35
Figure 6: Screen shot of the input editor window.
Table 3: Functions accessible through the Input editor window.
Tab
Problem
Item
Repeat runs
Boundary Modifier
Run Options
Annealing
Input
Output
14 of 35
Number of
iterations
Temperature
Decreases
Adaptive annealing
Initial Temperature
Cooling Factor
Set cooling from
final Temp
Species File name
Planning unit file
name
Planning unit
versus species file
Boundary Length
Input directory
Save each Run
Purpose
Number of repetitions, runs or solutions generated.
Boundary Length Modifier
Allows selection of different algorithms
Number of iterations in each run
Number of temperature decreases
When check the annealing schedule will be set adaptively, when unchecked the
schedule will follow the user specified values below.
Initial temperature
Cooling factor to be used at the temperature decreases.
Allows the user to specify final temperature
Name of the species file
Name of the planning unit file
Name of the planning unit versus species file
Name of the boundary length file
Specifies the location of the input files
If checked, will save each run
Cost Threshold
Misc
MarZone
Save overall Best
Save Summary
Save Scenario
Details
Save Missing
values info
ArcView format
ArcView format
(.csv type)
Save Summed
Solution
Species missing if
proportion of
target lower than
Save file name
Output directory
Threshold enabled
Threshold
Penalty Factor A
Penalty Factor B
Starting Prop
Enable MarZone
Zones
Zone target
Costs
Zone cost
Planning unit Zone
Zone Cost
Boundary
If checked, will save the overall best run
If checked, will save summary information for all runs
If checked, will save save scenario details
If checked, will save the missing values information for each conservation feature
ArcView format
ArcView format (.csv type)
If checked, will save the summed solution file
Species the percentage of target achievement at which the feature will be
considered to have missed its target in the summary reports. A value of 1 means
that a feature has to achieve 100% of the target.
Name to be appended to the beginning of each output file for the scenario
Folder in which the output will be placed
Checked specifies use of the threshold, unchecked the threshold will not be used
Actual threshold value
Multip lier for cost threshold penalty A
Multip lier for cost threshold penalty B
Proportion of planning units to start in the protected zone
Checked turns on Marxan with Zones, unchecked runs Marxan.
Input file for zones
Input file for zone targets
Input file for costs
Input file for zone costs
Input file for planning unit zones (not required)
Input file for zone boundary costs (not required)
Advanced parameter editing
Advanced users of Marxan will recognize that not all parameters are editable
through the ZC user interface. We have tried to make ZC user friendly to all levels of
user, and have thus chosen not to reveal functionality that is only utilized by a small
subset of advanced users. Please note that no functionality has been removed, and
all parameters are still editable by directly editing the input files.
Calibrating Marxan parameters
Calibration is the process of achieving the desired output (e.g. minimum cost) by
varying the input parameters. In Marxan the BLM is often varied to explore different
levels of compactness. Too little compactness and reserves are highly fragmented
(and unmanageable). Too much compactness and the reserves may become large
and costly to other uses. You can use the ZC Calibration tool to find an efficient range
of BLM values- and the tool automates the calibration process for a variety of other
Marxan parameters as well.
15 of 35
Using the ZC Calibration Tools
Note that before you open the calibration tool, the number of repetitions (runs) that
you have set in the input.dat file or through the Marxan Parameter to edit NUMREPS
file will be the number of repetitions that are run within your calibration. Make sure
this number is sufficiently high to run a meaningful calibration.
To start calibration, select calibration from the Marxan menu. A new window called
Parameter calibration will appear (see below).
Figure 7: Screen shot of the parameter calibration window.
Steps in using parameter calibration
Set 1. Choose input parameter to calibrate (i.e. BLM)
Set 2. Choose number of values to test (i.e. 9)
Set 3. Choose range of values (i.e. a Minimum of 0 and a Maximum of 0.1)
Next enter Run Calibration
The “Choose number of Values” field allows the user to specify the number of
intervals to be used in the calibration. The “Choose range of values” allows the user
to specify the range of values to be used in the calibration. For example, if you
specify 4 in the number of values field, and a range from 1 -10, the parameter will be
calculated at 4 intervals between 1 & 10 (1, 4, 7, 10). The parameter will always be
calculated for both the minimum and maximum value specified in the range.
Running this calibration may take a few minutes, but the GIS display will be updated
with the different configurations as the runs progress. Once calibration is complete,
the Calibration Summary Report will automatically appear. The calibration report can
also be viewed by going to the main menu and choosing Marxan> View Output >
Calibration Report.
16 of 35
The calibration report is also saved as “calibrate.csv” in the output folder, for
retrieval at a later date.
Exponential Calibration
Exponential calibration allows testing within an exponential range, rather than
within the equal interval range of base calibration functionality. Building on the
above example where we specified 4 intervals between the 1-10 range, instead of
using the values (1, 4, 7, 10) directly in the calibration, the exponent (e x) of that value
is calculated and used for the calibration. So the final range of values used in the
calibration is (2.7, 54, 1096, 22026). After clicking exponential calibration, a box will
appear that specifies the range of values and their exponents prior to calibration.
This allows the user to ensure that the exponential values used for calibration have
an appropriate range.
Adaptive Calibration FPF
The adaptive Calibration FPF function is a tool for calibration of the Feature Penalty
Factor (FPF), previously called the Species Penalty Factor (SPF). Instead of requiring
the user to specify a range in which the penalty factor should fall, the user specifies a
minimum percentage of target achievement. After specifying this level of minimum
achievement, ZC incrementally increases or decreases the FPF for all features until
converging on an efficient FPF that meets the desired target level.
Figure 8: Screen shot of the adaptive feature penalty factor calibration window.
The pseudo code for adaptive calibration of the FPF is as follows:
1) Start with a very small FPF (0.00001).
2) Run the system and view the minimum proportion of targets met (MPM) for all solutions.
3) If the MPM is less than the desired amount, increase the FPF by an order of magnitude.
17 of 35
4)
5)
6)
7)
8)
9)
Run the system and view the MPM for all solutions.
Repeat steps 3 and 4 until MPM exceeds the desired amount.
Reduce the FPF value to that used in the previous run of the system.
Increase the FPF by a very small number (0.00001).
Run the system and view the MPM for all solutions.
If the MPM is less that the desired amount, increase the FPF by an amount one order of
magnitude greater than the increase used in previous run of the system, then go to step 10.
If the MPM is greater than the target amount, go to step 6.
10) Run the system and view the MPM for all solutions.
11) Go to step 9.
Users should note that adaptive calibration FPF can be quite slow for large datasets.
With Marxan, it only works for scenarios where all target objectives are achievable,
whereas for Marxan with Zones, it only works for scenarios where all target
objectives are simultaneously achievable. The graph below illustrates how the
adaptive calibration algorithm systematically searches from low values of FPF to
higher ones, then progressively narrows its search until converging to the most
efficient FPF value that ensures that the user specified % of targets for all our
features are met.
Figure 9: Fluctuations of FPF during the course of adaptive calibration.
Detailed Calibration Information
Each calibration run is saved individually in the scenarios folder inside the project. In
the above example, 9 different intervals are used for BLM calibration; the result will
be 9 folders inside the scenarios folder, titled Scenario1, Scenario2 etc. Within each
folder will be the input.dat and Input/Output folders used for that calibration. These
files can be used to more closely inspect results from each calibration run, or to
restore a specific scenario on request with the Marxan > Load Run function.
18 of 35
View Calibration Summary Report
The Calibration Summary Report reports on the performance of the reserve system
at different parameter values.
Do Cluster Analysis
How to use the cluster analysis function
The cluster analysis function is located in the main menu under Marxan> Do Cluster
Analysis. This feature is automatic if Do Cluster Analysis is ticked and you have
installed R and the appropriate R packages (details in the Downloading and setting
up Zonae Cogito section at the beginning of this manual).
What is the cluster analysis function used for?
The purpose of including the cluster analysis function is to make it easy to identify
dissimilar solutions from your Marxan runs in order to compare the full range of
spatial configuration in your solutions. Some Marxan users in the past have
performed cluster analysis of Marxan solutions by manually creating the solutions
matrix and using it with statistical analysis software (Airamé 2005), and ZC
automates this process making the ability to perform a cluster analysis on Marxan
solutions available to more Marxan users.
Outputs from cluster analysis
The outputs include a 3-dimensional plot of the solution space (this appears in a popup), a 2 dimensional plot of the solution space, and a dendrogram showing the
dissimilarity of the Marxan solutions (these are automatically placed in the output
folder after a Marxan run finishes).
Figure 10: Example 3-D plot
19 of 35
Figure 11: Example 2-D plot
Figure 12: Example dendrogram
The Marxan Dashboard
20 of 35
The Marxan Dashboard is located at Marxan>Browse Annealing Output. This feature
allows you to view the annealing process for one solution along with the impact of
the changes in the process on the score, cost, connectivity, and penalty. If you set
the NUMITNS to 1000 and NUMREPS to 1, you can view each individual step in the
annealing process- the planning unit being considered for a change in status is
highlighted in yellow. You can speed up or slow down the process by using the slide
bar.
The GIS Interface
ZC uses the MapWinGIS ActiveX component, which is an application programming
interface for MapWindow GIS. It allows developers to embed the MapWindow
software within their own application, and directly access the GIS objects in an
efficient way from their choice of programming languages (Ames 2007).
The MapWindow ActiveX component is directly embedded into ZC, allowing direct
access to some GIS capabilities, facilitating custom high performance GIS processing
and display.
MapWindow is a powerful and user friendly open source GIS package. It can be
downloaded from the MapWindow web site (MapWindow.org).
There are a number of GIS functions accessible through the "GIS" menu item on the
main window. These functions represent a subset of the MapWindow functions that
are useful for working with Marxan. See Table 4 for a list of these functions.
21 of 35
Table 4: Functions accessible through the GIS menu and sub-menus.
Menu
Zoom
Cursor Mode
Select Mode
Select With
Selection
Colour
Add Shape
Remove All
Shapes
Export Map
Shape Outlines
Edit
configurations
Report
Configurations
Sub Menu
Extent
Layer
Previous
Set Zoom
Percentage
Zoom to Layer on
Resize
Zoom In
Zoom Out
Pan
Select
Intersection
Inclusion
Mouse
Query
Use Selected
Planning Units
Clear Selection
Invert Selection
Post DDE
Export Selection
Purpose
Zooms to full extent of all shapefiles
Zooms to full extent of selected shapefile
Zooms to previous extent
Set the percentage for zoom in and out cursor modes
Zoom to planning unit layer when the window is resized
Click and drag on map will zoom in
Click and drag on map will zoom out
Click and drag on map will pan map in the direction of the drag
Click and drag on map will select shapes
For select mode, all shapes intersecting with selected area will be selected
For select mode, all shapes included within selected area will be selected
Click and drag on map will select shapes
Formulate SQL query on shape table to select shapes
Database lookup of selection, Mark selection as “Not Selected”, or Place selected
planning units into nominated zone, (for use only when dynamically linked to Cplan)
Clears the current map selection
Inverts the current map selection
Post to C-plan when dynamically linked.
Exports the selected planning units into a new ESRI compatible shapefile.
Select colours for map display and selection
Add a shape to the map
Remove all shapes from the map
Allows you to save the current map as a bitmap file
Adds or removes the outlines of your planning units
Opens the configuration editor
Opens the configuration reporting editor
Viewing Marxan results in the GIS display
The GIS display allows you to view maps of your Marxan solutions. After running
Marxan through the Marxan display window, review the solutions using the drop
down menu in the GIS display. The outputs that you can view are:
• Selection frequency (when using standard Marxan, reserve zone refers to
planning units included in Marxan solutions, while available zone refers to
planning units that are not included in Marxan solutions)
• Best Solution
• Each individual solution
22 of 35
Figure 13: Screen shot of the GIS toolbar.
Table 5: Guide to functionality of map tools
Menu
Purpose
Zoom to full exten t
Zoom to layer extent
Zoom to extent of selected features
Return view to previous extent
Zoom in
Zoom out
Pan
Select tool
Post selection to C-plan
Query Engine
The query engine can be launched from the GIS menu, by choosing select with query.
From the query window you can build queries that will select planning units based
on any attribute in the planning unit shapefile. This includes selection based on
selection frequency in Marxan.
After highlighting the field you would like to base the selection on, the unique values
from that field can be populated in the values field by clicking the check box next to
load values (this can take some time if you are using a large number of planning
units). After you have highlighted a “field,” and operator (eg. “=”, “>”) and a “value”
the query can be generated by clicking “add.” After a query is added it will appear in
the query box. To execute the query, and replace the currently selected planning
units, click “New Selection.” If you would like to add the query results to the existing
selection set, click “Add to Selection.”
23 of 35
Figure 14: Example query that selects all planning units with a selection frequency
greater than 75
User note:
When making selections from a single solution within Marxan, the user will note that
planning unit status used by ZC are slightly different to those of the raw Marxan
output files. To be compliant with Marxan with Zones, ZC uses a status of 2 to
specify a selected planning unit, and a status of 1 for a non-selected planning unit.
Thus if you are using Marxan and want to create a selection based on solution 8, the
appropriate query would be: “(SOLN8 = 2)”
Generating new shapefiles
ZC offers two options for generating shapefiles. The first option is in the GIS menu
under “Export Selection,” and the second is in the configuration editor and is
detailed later. Export selection will export the selected planning units to a new
shapefile, with only the planning unit id in the attribute table. The option can be
used to generate new shapefiles from individual Marxan runs by using the “select by
query” option. It can also be used to interactively create a new shapefile using the
interactive GIS selection tool.
Map coluor specification
You can change the colours associated with the solutions in the GIS by clicking on the
colours in the left-hand menu or through the Main Menu (GIS > Colour) and the
window shown below will open:
24 of 35
Figure 15: Screen shot of the Specify Marxan Map Colours window.
Select the type of display you would like to edit, from the “Colour to edit” section
and then select the colour you would like to use in the display. When you are
finished making changes, click Accept Changes, or click cancel changes to abandon all
changes.
You can add contextual GIS layers to the window at anytime by using the GIS >Add
Shape option from the main menu.
Application menu
Table 6: Functions accessible through the Applications menu and sub-menus.
Menu
Validate Marxan
R
Run R scripts
Purpose
Validation of Marxan family of software and input files
Starts preferred R GUI
Runs the R scripts that perform cluster analysis.
The Configuration Editor Interface
Reviewing and editing Marxan results
From the GIS menu, select “Edit configuration” to open the configuration editor. The
configuration editor allows you to make planning unit level changes to individual
solutions. You can save and edit these user defined configurations, and then
25 of 35
generate reports based on target achievement in them. It can also be used to
interactively design new starting points for Marxan analysis.
Creating a new configuration
If this is the first time you have accessed the configuration editor in the project, you
will be prompted to create a new configuration (see window below). To create a
new configuration, first enter a name, and then select a seed configuration. The
seed configuration specifies the status of planning units to be used in the
configuration. The status can be loaded from any previously generated Marxan
solution or any previously generated configuration. You can also start with a blank
slate by selecting “Blank configuration” as seed.
Figure 16: New configuration window
Making changes to a configuration
Once a configuration is open, changes to the configuration can be made either
though the clicking on the interactive GIS display, or by a query of specific attributes.
If you have created multiple configurations, ensure you highlight the correct
configuration when you wish to edit that configuration.
Table 7: Functions accessible through the configuration editor window.
Button
New
Report
Action
Creates a new configuration
Starts the reporting editor
Sends the current user defined configuration to Marxan, so you
Send to Marxan can run Marxan with these planning units locked in or out
Stop Editing
Closes the configuration editor window
Saves the specified changes to the current user defined
Save
configuration
26 of 35
Figure 17: Configuration editor window
From the configuration editor window, you can select an existing configuration to
edit, or create a new configuration. To edit an existing configuration, simply
highlight the configuration from the list. To create a new configuration, simply click
new, and the new configuration window will be opened (above). When going
through the new configuration window with a previously existing scenario, you will
notice that you have the option to seed the new configuration with any of the
previously generated configurations. This feature is particularly useful when
multiple different branches of changes are being considered.
Once you have selected the configuration to edit from the configuration list, changes
can be made either through the GIS or through the query engine.
Making changes using the interactive GIS
From the GIS menu select Cursor Mode > Select. The map is now in select mode,
clicking holding down while dragging the cursor over the map will highlight the
selected planning units. Multiple non-contiguous sets of planning units can be
selected by holding down the shift key between selections. If the shift key is not
held down each new selection will replace the previous.
Making changes using queries
From the Planning unit configuration window click, “select by query” to launch the
query engine. The query engine allows you to make changes to a configuration by
specifically targeting Marxan results or another attribute of the shapefile.
User suggestion:
27 of 35
Prior to editing any configurations we suggest that you make a back-up copy of your
Marxan database so you don’t lose information. To do so, simply select Marxan >
Save Run from the main menu, and then name the current run. Save Run will copy
the current Input/Output files and input parameter file into the scenarios folder for
the project. Then if you decide that you would like to abandon all changes you’ve
made during configuration editing, you can still copy a clean version of the input files
back into the project folder.
Generating Reports from configurations
Clicking “Report” from the configuration window will open the reporting window.
Figure 18: Reporting window
To generate a report, highlight the configuration you wish to report on, and select
the reports you would like to generate. Note here that multiple reports for the same
configuration can be generated at the same time. After selecting the appropriate
configuration and reports, click “OK” to generate the reports.
After a report is generated it will appear in ZC, and will also be saved as a .csv file in
the main project folder.
Table 8: Three different types of reports are available from within the reporting tool.
Report
Summary detail
Planning unit detail
Target achievement
28 of 35
Explanation
Summary statistics about the configuration
Individual status of each planning unit in the configuration
Detailed information on the representation of each
conservation feature
Planning unit detail report:
Table 9: Fields in the Planning unit detail report.
Field
Planning unit
“Configuration Name”*
Explanation
Planning unit ID
Displays the status of each planning unit
in the configuration
*Note the name of this field is dynamic. The name will be the name you have given
the configuration.
Summary detail report:
Table 10: Fields in the Summary detail report.
Field
Explanation
Summary
Configuration name
Cost
Total cost of the configuration
Connectivity
Boundary Length
Shortfall
Summed representation shortfall for all conservation features
Target achievement report:
Table 11: Fields in the Target achievement report.
Field
Explanation
Feature Name
Feature name
Feature Key
Feature Id as entered in “spec” file
Initial Reserve
Amount of feature locked into the reserved zone at the
beginning of the scenario.
Total in region
Total amount of the feature in the region (same units as
puvsp file).
Target %
Percent of feature targeted for protection.
Target amount
Feature target amount (same units as puvsp file).
% Target in MPA
(Target Amount /Amount in MPA)
Amount in MPA
Amount of feature in MPA (same units as puvsp)
Missed Target %
(Target Amount – Amount in MPA) / Target Amount
Missed Target Amount Target Amount – Amount in MPA (same units as puvsp)
Sharing results:
29 of 35
In addition to generating reports the configuration tool can also be used to generate
ESRI compatible shapefiles to share results or perform additional processing. To
generate a shapefile from a configuration, click on the check box next to “planning
unit shapefile” in the reporting window. When this option is selected, shapefile of
the configuration will be exported to the main project folder when the reports are
generated. The shapefile name will be given the same name as the configuration.
Table Processing
Convert data menu
The convert data menu provides a couple of tools for the manipulation of data tables
that can be useful when preparing input files or reviewing Marxan output.
Table 12: Functions accessible through the Convert data menu and submenus.
Menu
Tables
Tables
Tables
Sub Menu
Transpose CSV
Transpose “anneal
zones” table
Join DBF tables
puvspr
Purpose
Transposes the active table
Transposes the anneal zones output table. Anneal zones is an optional output of
Marxan with zones.
Join dbf tables to generate a puvspr file for Marxan.
Join DBF tables puvspr:
The join table function can assist with the creation of new Marxan databases. The
function allows the user to specify a folder which contains a set of .dbf tables that
contain species information summarized by planning units. These files can be
generated by running the zonal statistics or tabulate area function in ArcGIS.
Figure 19: Table joining tool.
To run the tool, select the folder that contains the .dbf files detailing conservation
feature abundance in planning units. The folder should only contain .dbf tables for
conservation features to be included in the analysis, as all .dbfs in the folder will be
30 of 35
added. The tool automatically generates the puvspr.dat file, and provides the user
with the option to select other input files that should also be generated. If all files
are selected, the tool will create the Marxan data structure with input and output
folders. The input files generating will include placeholder values for target, spf,
planning unit cost, and other key parameters. After generating the input files, these
values should be updated manually. The tool also provides the user with the option
of converting from m 2 to hectares (dividing by 10,000).
Feature index type
Two options are available in the join .dbf tool for how conservation features should
be named in the spec.dat and puvspr.dat files.
1. Assign Unique Index- will assign a unique id to each of the column header.
2. Use Column names from files- will use the unique id in each of the column
headers. For example, if the column name is “Value_243” the conservation
feature id will be 243.
Text Table menu
When a table is highlighted in ZC (for example after a report is generated) the text
table menu will appear in the main ZC menu.
Table 13: Functions accessible through the Text Table menu and submenus.
Menu
Auto fit
Save non zero rows
and columns
Graph Table
Compact Marxan
Matrix
Sub Menu
Entire Table
Selection
Purpose
Adjusts the column size of the entire table
Adjusts the column size for the selected columns of the table
Saves only those rows and columns that contain some non-zero values (rows or
columns populated only with zeros will not be saved.)
Opens up the graphing editor
Removes zero value column
Graphing in ZC
ZC provides the user with a simple graphical interface for creating graphs that can be
useful with assisted parameter calibration. Navigate to the Text Table in the Marxan
main menu (this option appears after a table is open, such as when assisted
calibration is run). Select Graph table to automatically graph the calibration results.
Two fields are shown, the X axis field and the Y axis field. Choose the X axis and Y
axis fields you would like to graph from the drop down boxes. See Figure 15 below
for an example of a BLM calibration.
31 of 35
Figure 20: Example graph of BLM calibration.
Graphing functionality use notes:
The size of the squares plotted on the graph can be adjusted using the “square size”
field, or removed altogether by un-ticking the “Draw squares” box. “Save to file”
function allows you to save the graph to an image file (.bmp format). “Close” will
close the graphing tool.
32 of 35
Using the C-Plan software
In addition to using Marxan with ZC, you can also use C-Plan. This is a prototype
version of ZC for use with C-Plan and changes may be made to update the interface.
Downloading and installing C-Plan
You will need to obtain the install set for C-Plan version 4:
- Email Matt Watts [email protected] to obtain this software OR
- http://www.uq.edu.au/ecology/index.html?page=101951 OR
- http://www.uq.edu.au/~uqmwatts/cplan.html
Unzip the file CPlan4.zip. To install C-Plan, run the SETUP.EXE program from the
CPlan4 folder that was created when unzipping the zip file.
Starting the C-Plan dataset with Zonae Cogito
1) Launch Zonae Cogito, but don't open and files or projects.
• Click on the "Start" menu, click "Programs", click “Zonae Cogito”, then "Zonae
Cogito".
2) Launch C-Plan with the required dataset.
• Click on the "Start" menu, click "Programs", then "C-Plan".
• Click “Locate Database”, then browse to your cplan.ini file and click “Open”.
• Click on your cplan.ini to select and highlight the database, then click "Start CPlan".
The GIS window will open in ZC and the systems will be dynamically linked. If you
experience problems, shut down both systems and restart them.
Selecting and posting sites
When the systems are launched and dynamically linked;
1) Click on the " Select Cursor Mode" button
, or select "GIS>Cursor
Mode>Select" from the menu system.
2) Select the required sites by clicking and dragging on the GIS.
3) Post the selected sites to C-Plan by clicking on the "Post DDE Selection" button, or
selecting "GIS>Selection>Post Select DDE" from the menu system.
The selected planning units will be posted to C-Plan, and the selected "Click Action"
will be executed with those planning units.
33 of 35
Key C-Plan Functionality
Selecting Areas to be Reserved
To select areas to be reserved, switch to the C-Plan interface and in the "Click
Action" box, click on "Negotiated".
After setting the click action in C-Plan, we need to select some areas in ZC, and post
them to C-Plan to have their status updated to reserved.
Switch to the ZC interface, select some sites, and post them to C-Plan using the
instructions above for “Selecting and posting sites”.
Selecting Areas to be not Reserved
To select areas to be available (or not reserved), switch to the C-Plan interface and in
the "Click Action" box, click on "Excluded".
After setting the click action in C-Plan, we need to select some areas in ZC, and post
them to C-Plan to have their status updated to not reserved. We do this in the same
way as for "Selecting Areas to be Reserved" above.
Querying Site Data
To select areas (or sites) to query fishing and conservation indices, switch to the CPlan interface and in the "Click Action" box, click on "Lookup".
After setting the click action in C-Plan, we need to select some areas in ZC, and post
them to C-Plan to query their indices. We do this in the same way as for "Selecting
Areas to be Reserved" above.
Querying Feature Data
To select areas to query feature irreplaceability, switch to the C-Plan interface and in
the "Click Action" box, click on "Features".
After setting the click action in C-Plan, we need to select some areas in ZC, and post
them to C-Plan to have their status updated to reserved or not reserved. We do this
in the same way as for "Selecting Areas to be Reserved" above.
To see the proportion of each feature target that has been met, switch to the C-Plan
interface and click on the "Show" menu, then click the "Features To Target" menu
item. A form is displayed that lists features in the dataset, the proportion of each
feature target that has been met. You can use the "Sort Order" and "Sort Field"
controls to change the way this information is displayed.
Saving and Loading Scenarios
To save a scenario, switch to the C-Plan interface and click on the "File" menu, then
click on the "Save Selections" menu item. Enter a name for your scenario and click
"Save".
34 of 35
To load a previously saved scenario, switch to the C-Plan interface and click on the
"File" menu, then click on the "Open Selections" menu item. Click on a scenario you
want to load and click "Open".
Troubleshooting
If you experience problems running ZC functions;
- Notify the author so that a bug fix may be provided in a future version,
- Ensure you are using the default names for your Marxan and Marxan with
Zones input files, such as spec.dat and pu.dat. This may help to alleviate any
difficulties.
- Ensure the Marxan dataset runs correctly using the Marxan.exe program.
References
Ames, D.P. (2007). MapWinGIS Reference Manual: A function guide for the free
MapWindow GIS ActiveX map component. 194 pages. Idaho State Univ., Idaho Falls,
ID.
Ball, I. R. and H. P. Possingham (2000) MARXAN (V1.8.2). Marine Reserve Design
Using Spatially Explicit Annealing, a Manual
Possingham, H. P., I. R. Ball and S. Andelman (2000) Mathematical methods for
identifying representative reserve networks. In: S. Ferson and M. Burgman (eds)
Quantitative methods for conservation biology. Springer-Verlag, New York, pp. 291305.
Acknowledgements
This research and development project was generously supported by the Applied
Environmental Decision Analysis Centre, and through a grant awarded by the Natural
Heritage Trust National Competitive Component. Continuing work on the project is
generously supported by the Australian Research Council funded Centre of
Excellence for Environmental Decisions (CEED), the National Environmental Research
Program (NERP) funded Terrestrial Hub 1, and The Nature Conservancy.
We thank Trevor Ward who assisted with software evaluation and development.
35 of 35