1
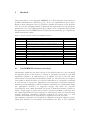
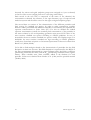
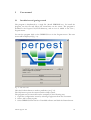
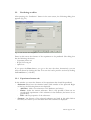
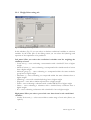
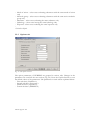
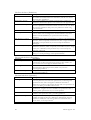
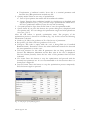
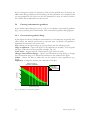
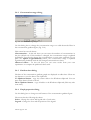
PERPEST version 1.0,
manual and technical description
a model that Predicts the Ecological Risks of PESTicides
in freshwater ecosystems
Egbert H. van Nes and Paul J. van den Brink
Alterra-rapport 787, ISSN 1566-7197
wageningenur
PERPEST version 1.0, manual and technical description
The research reported in this report was financed by the Dutch Ministry of Agriculture, Nature Management
and Fisheries, within the framework of programme 359 and 416.
PERPEST version 1.0, manual and technical description
A model that Predicts the Ecological Risks of PESTicides in freshwater
ecosystems
E.H. van Nes1
P.J. van den Brink2
1
2
Wageningen University, Department of Aquatic Ecology and Water Quality
Management, Wageningen University and Research centre, P.O. Box 8080,
6700 DD Wageningen, The Netherlands
Alterra Green World Research, Wageningen University and Research centre,
P.O. Box 47, 6700 AA Wageningen, The Netherlands
Alterra-rapport 787
Alterra, Green World Research, Wageningen, 2003
ABSTRACT
Nes, E.H. van & P.J. van den Brink, 2003. PERPEST version1.0, manual and technical description; a
model that Predicts the Ecological Risks of PESTicides in freshwatrer ecosystems. Wageningen, Alterra,
Green World Research. Alterra-rapport 787. 46 pp.; 11 figs.; 1 tables; 22 refs.
This report is a technical description and a user-manual of the PERPEST model, able to
Predicts the Ecological Risks of PESTicides in freshwater ecosystems. This system predicts the
effects of a particular concentration of a pesticide on various (community) endpoints, based on
empirical data extracted from the literature. The method that it uses solves new problems (e.g.,
what is the effect of pesticide A?) by using past experience (e.g., published microcosm
experiments). The database containing the “past experience” has been constructed by
performing a review of freshwater model ecosystem studies evaluating the effects of pesticides.
The PERPEST model searches for situations in the database which resemble the question case,
based on relevant (toxicity) characteristics of the compound.The model is described in the
scientific paper written by Van den Brink et al. (2002) and available via the enclosed CD-ROM
and the website www.perpest.alterra.nl.
Keywords: Effect model, Aquatic community, Ecological risk assessment, Pesticides, CaseBased Reasoning
ISSN 1566-7197
This report can be ordered by paying € 18,- into bank account number 36 70 54 612 in the
name of Alterra, Wageningen, the Netherlands, with reference to rapport 787. This amount is
inclusive of VAT and postage.
© 2003 Alterra, Green World Research,
P.O. Box 47, NL-6700 AA Wageningen (The Netherlands).
Phone: +31 317 474700; fax: +31 317 419000; e-mail: [email protected]
No part of this publication may be reproduced or published in any form or by any means, or stored
in a data base or retrieval system, without the written permission of Alterra.
Alterra assumes no liability for any losses resulting from the use of this document.
Projectnummer 230048
[Alterra-rapport 787/HM/08-2003]
Contents
Preface
7
Summary
9
1
Introduction
1.1 What is PERPEST?
1.2 Case-based reasoning
11
11
12
2
Methods
2.1 The PERPEST database (case base)
2.2 How to find similar cases?
2.2.1 Defining question case
2.2.2 Filter the database
2.2.3 Select conditional and response variables
2.2.4 Transformation, standardization and weighing of variables
2.2.5 Calculate dissimilarities
2.3 How to predict a response variable?
2.4 How accurate is the prediction?
2.5 Optimization of the prediction
15
15
18
18
18
19
19
20
20
21
21
3
User manual
3.1 Installation and getting started
3.2 Predicting an effect
3.2.1 Experiment features tab
3.2.1.1 Add new substance
3.2.1.2 Search Internet
3.2.2 Weigh/Select using tab
3.2.3 Options tab
3.2.4 Predicted effects
3.2.5 Browse analogous cases
3.3 Optimizing the prediction
3.4 Creating concentration gradients
3.4.1 Concentration gradient dialog
3.4.2 Concentration range dialog
3.4.3 Gradient data dialog
3.4.4 Graph properties dialog
23
23
24
24
25
25
26
27
29
30
31
34
34
35
35
35
References
Appendices
I
II
III
IV
Supported transformations
Supported standardization methods
Supported dissimilarity measures
Supported validation measures
Alterra-rapport 787
37
39
41
43
45
5
Preface
We would like to thank Rene van Wijngaarden, Joost Lahr, Theo Brock and Gerben
van Geest for their help in reviewing the literature on the ecological effects of
pesticides in freshwater ecosystems, Marten Scheffer, Jan Roelsma and Theo Brock
for their help developing the model and Mechteld ter Horst for testing the model.
Alterra-rapport 787
7
8
Alterra-rapport 787
Summary
This report is a technical description and a user-manual of the model PERPEST, a
model that Predicts the Ecological Risks of PESTicides in freshwater ecosystems.
This system predicts the effects of a particular concentration of a pesticide on
various (community) endpoints, based on empirical data extracted from the literature.
The method that it uses is called Case-Based Reasoning (CBR), a technique that
solves new problems (e.g., what is the effect of pesticide A?) by using past experience
(e.g., published microcosm experiments). The database containing the “past
experience” has been constructed by performing a review of freshwater model
ecosystem studies evaluating the effects of pesticides. This review assessed the effects
on various endpoints (e.g. community metabolism, phytoplankton, macroinvertebrates) and classified them according to their magnitude and duration. The
PERPEST model searches for situations in the database which resemble the question
case, based on relevant (toxicity) characteristics of the compound. This allows the
model to predict effects of pesticides for which no evaluation on a semi-field scale
have been published. PERPEST results in a prediction showing the probability of
classes of effects (no, slight or clear effects, plus an optional indication of recovery)
on the various grouped endpoints. The model is described in the scientific paper
written by Van den Brink et al. (2002). and available via the enclosed CD-ROM and
the website www.perpest.alterra.nl.
Alterra-rapport 787
9
10
Alterra-rapport 787
1
Introduction
1.1
What is PERPEST?
The tiered ecological risk assessment of pesticides consists of a conservative first tier
and more realistic higher tiers. These higher tiers can include the use of laboratory
tests using more realistic exposure regimes, testing of indigenous species, the use of a
variety of models (population, food-web, landscape) and conducting experiments in
model ecosystems (Campbell et al. 1999). To this end many experiments performed
with microcosms and mesocosms are performed during the last 20 years and
published in the open literature. Brock et al. (2000a; 2000b) reviewed the open
literature for microcosm and mesocosm experiments on the effects of herbicides and
insecticides. This review was performed to establish ecological threshold values for
pesticides in surface waters and to evaluate current standard setting methodologies.
In order to predict effects of pesticides on aquatic communities and ecosystems,
large simulation models like for instance food-web models can be used (Koelmans et
al. 2001; Traas et al. 1998). Ecological models, however, are either incomplete or
have many uncertain parameters, so experts may predict effects of toxicants better.
Anderson (1983) has shown that people use past cases as models when learning to
solve new problems. Also experts solve problems by analogy, i.e. using analogous
cases from memory to solve new problems. For instance if one asks an expert what
the effect of 1 µg/L of the insecticide chlorpyrifos will be on the ecology of a
freshwater ecosystem, he or she will look for analogous cases; i.e. experiment he or
she has conducted or evaluated in the past. Obvious the type of experimental
ecosystem, test design, assessed endpoints etc. are different between the experiments
so the expert has to make some nuance also. In the field of artificial intelligence this
process is called Case-Based Reasoning (CBR) (Kolodner 1993; Leake 1996). The
basics of CBR is that it retrieves similar experience (cases) about similar situations
from the memory (a database that is called the case base) and reuses this experience
in the context of a new situation for a prediction.
The PERPEST model (Van den Brink et al. 2002) is based on Case-Based Reasoning.
In this model the prediction of the effects of a certain concentration of a pesticide on
a defined aquatic ecosystem is based on published information on effects of
pesticides on the structure and function of aquatic ecosystems as observed in semifield experiments. This CBR system consists of the database containing this
information and a search routine named Weighted Analogies Prediction (WAP) (Van
Nes and Scheffer 1993). The rationale behind WAP is that based on a few
characteristics of the questioned case (e.g. pesticide characteristics, exposure
concentration, type of exposure) analogous cases are identified in the database. These
analogous cases can be weighted and summarised in a prediction. This means that
although for certain pesticides no microcosm or mesocosm experiment is published,
one is able to predict its effect on a semi-field scale using the results of experiments
Alterra-rapport 787
11
performed with other pesticides that have a similar toxicological mode of action
(TMoA) and fate characteristics.
The PERPEST model can be used in the ecological risk assessment when
uncertainties are large and data availability is small, e.g. in the case of a new pesticide.
Using PERPEST an idea can be obtained in which direction uncertainties are likely
to be large, so in which direction data must be gathered for a refined risk assessment
(e.g. endpoints and exposure concentrations of interest). Output of PERPEST can
also be used to translate spatially and temporal distributed concentration data into
effect concentrations, i.e. to use it as a risk indicator. In this report the methods
incorporated in PERPEST are described and a manual of the graphical user interface
(GUI) of the model is included.
1.2
Case-based reasoning
Case-based reasoning (CBR) is a way of solving problems that is able to utilize the
specific knowledge of previously experienced, concrete analogous situations (cases)
for solving new problems. CBR is an approach that enables incremental, sustained
learning since new experience is retained, making it immediately available for future
problems (Aamodt and Plaza 1994). The first system that might be called a casebased was the system of Kolodner (1993), a question answering system with
knowledge on the various travels and meetings of the former US secretary of State
Cyrus Vance. Since then the study of CBR is driven by two primary motivations:
firstly to model human reasoning and learning and secondly to make Artificial
Intelligence (AI) systems more effective (Leake 1996).
Early applications of CBR are, among others, in diagnosis setting (clinical audiology,
heart failure, building defects, aircraft fault diagnosis and repair), legal reasoning
(criminal sentencing, patent law, injuries to workers, building regulations), arbitration
(dispute resolution), design (landscape, mechanical design, conceptual design) and
planning (warfare planning, manufacturing planning problems, (Watson and Marir
1994)). Examples of interpretive CBR are law application and diagnosis setting. A
well known application of CBR in medicine is to help medical personnel to assess
patient status, assist in making a diagnosis, and facilitate the selection of a course of
therapy (Frize and Walker 2000). In this example a case is defined as a set of variable
values or features collected from a patient collected during a consult or visit. This
case can be compared to earlier collected cases (patients) incorporated in a case base
(Montani et al. 2000). From this case base the most similar cases can be extracted by
applying for instance the nearest neighbor technique. From these similar cases some
useful statistics like similarity in diagnosis and successful therapy between the cases
can be calculated, and used for decision making. Although CBR is popular in various
scientific areas, there have been described only very few applications in ecology
(grasshopper pest control, Branting et al. 1997) and ecotoxicology (ecological risks of
pesticides, Van den Brink et al. 2002).
12
Alterra-rapport 787
Some of the advantages of the CBR technique are:
1. No prior information or assumptions about the nature of relations between
variables are needed.
2. It is easy to find and browse through all available information of the most
analogous cases.
3. The system can improve by adding new cases to the case-base. This learning
possibility is an important feature of CBR systems.
4. It is the starting point of the LABDA approach (Largely Analogous But
Differences Also) (Scheffer 1991).
The LABDA approach is a way of predicting the response of a case.
It involves two steps:
A. Rough estimations using analogous cases (Largely Analogous)
B. Fine tuning of the prediction by quantitative models that predict only the
differences of the question case from the analogous cases (But Differences
Also)
Alterra-rapport 787
13
14
Alterra-rapport 787
2
Methods
The main purpose of the program PERPEST is to find analogous cases based on
available information in a data base (§ 2.1). In § 2.2 is explained how this is done.
Based on these analogous cases it is possible to predict the response of the question
case. In § 2.3 the averaging method is explained. The next question is how good this
prediction is. In § 2.4 is explained how the goodness-of-fit is evaluated. The methods
and parameters used by PERPEST can be optimized automatically. § 2.5 explains by
which method this is done.
Table 2.1. The most important variables in the PERPEST database
Variable
Description
DT50
Field dissipation DT50 (days)
EC50
geometric mean acute EC50 value of the most sensitive
standard test species according to OECD guidelines (µg/L)
FullName
Name of the substance
Henry
Partitioning coefficient air-water (Pa m3/mol)
Kom
Partitioning coefficient water-organic matter Kom (L/kg)
Mode of action Mode of action
Molecule group Molecule group
Type_sub
Type of substance
Conc
Concentration of substance (µg/l)
Expos
Exposure
Hydrology
Hydrology during experiment
Reference
Full reference
ToxUnit
Concentration as toxic unit
2.1
Type of variable
Float
Float
Memo
Float
Float
String
String
String
Float
String
String
Memo
Calculated:
Conc/EC50
The PERPEST database (case base)
The database (called the case base) consist of two different data sets, one containing
the updated results of the review on effects of pesticides observed in semi-field
experiments (Brock et al. 2000a; Brock et al. 2000b) and one on fate and effect
characteristics of insecticides and herbicides (Table 2.1). The first data set comprises
case studies in which the effect of a certain concentration of a pesticide is evaluated
in a microcosm or mesocosm. Experiments were selected for evaluation when the
model ecosystem simulated a realistic freshwater community, the experimental design
was appropriate (ANOVA or regression design), and when the exposure
concentrations were clearly described. We made a distinction between systems to
which a single (single or pulse) and to which a repeated (multiple or chronic) dose
was applied and between lentic (stagnant or recirculating) and lotic (flow-through)
systems. Evaluated experiments normally comprised of several cases, i.e. each
evaluated concentration in an experiment is a separate case in the case base.
The endpoints evaluated were classified in 8 different ecological endpoint groups,
which were different for insecticides and herbicides (see Box 1). The responses
Alterra-rapport 787
15
observed for various ecological endpoint groups were assigned to 0 (not evaluated)
or the five effect scores (ranging from no to clear long-term effects).
Each record in the case base is composed of the name of the chemical, the
concentration evaluated, the reference to the open literature, type of exposure and
model ecosystem and the effect scores for the eight ecological endpoint groups.
The second data set consists of fate characteristics of the different pesticides and
their toxicity for standard test species. In order to make comparisons possible
between studies performed with different herbicides or insecticides, we expressed the
exposure concentrations as Toxic Units (TU). For this we divided the studied
exposure concentration (usually the nominal peak concentration of the pesticide in
the water column) by the corresponding geometric mean acute EC50 value of the
most sensitive standard test species according to OECD guidelines. In case of
insecticides the most sensitive standard test species usually was Daphnia magna. For
herbicides the most sensitive standard test alga according to OECD guidelines
usually were Scenedesmus subspicatus or Selenastrum capricornutum. Values were taken from
Brock et al. (2000a; 2000b).
To be able to find analogies related to fate characteristics of pesticides also the field
dissipation is taken into account. This field dissipation is represented by the DT50 of
the water compartment determined in a water sediment study, the Henry coefficient
(partitioning coefficient air-water) and the Kom (partitioning coefficient water-organic
matter). These variables were, when available, added to the database for each
pesticide. Values were obtained from Linders et al. (1994) and the pesticide manual
(Tomlin, 2000).
16
Alterra-rapport 787
BOX 1. The grouped endpoints and five effect classes used in PERPEST
The grouped endpoints are:
Herbicides
Community metabolism
Phytoplankton
Periphyton
Macrophytes
Zooplankton
Macrocrustaceans & Insects
Other macro-invertebrates
Vertebrates
Insecticides
Community metabolism
Algae and macrophytes
Microcrustacea
Rotifers
Macrocrustacea
Insects
Other macro-invertebrates
Vertebrates
The five effect classes are:
- 0. blank .Endpoint not evaluated in the study.
- 1. No effects demonstrated: No consistent adverse effects are observed as a result of the
treatment. Observed differences between treated test systems and controls do not show a clear
causality.
- 2. Slight effects: Confined responses of sensitive endpoints (e.g., partial reduction in abundance).
Effects observed on individual sampling dates only and/or of a very short duration directly after
treatment.
- 3. Clear short-term effects, lasting < 8 weeks: Convincing reductions in sensitive endpoints.
Recovery, however, takes place within eight weeks. Effects observed on a sequence of sampling
dates.
- 4. Clear effects, recovery not studied: Clear effects (e.g., severe reductions of sensitive taxa over
a sequence of sampling dates) are demonstrated, but duration of the study is too short to
demonstrate complete recovery within eight weeks after the last treatment.
- 5. Clear long-term effects, lasting > 8 weeks: Convincing reductions in sensitive endpoints and
complete recovery of these endpoints later than 8 weeks after the last treatment. Negative effects
reported over a sequence of sampling dates.
Alterra-rapport 787
17
2.2
How to find similar cases?
Define question
case
Filter the data base
Select conditional
and response
variables
Transformation,
standardization
and weighing of
variables
Calculate
dissimilarities
Select the N
nearest cases
Calculate the mean
value for the
response variables
of the N cases
Prediction
Fig. 2.1. The used method of case-based reasoning.
The steps to be taken to find analogies are summarized in Fig. 2.1. Each step is
explained below.
2.2.1
Defining question case
The first step in case based reasoning is defining the question case, i.e. which
circumstance do you want to predict? In PERPEST the minimum information for a
question case is the pesticide name and its concentration. If the pesticide is not yet
available in the fate and effects characteristics database also its CAS number, mode
of action, molecule group, type of substance and lowest EC50 for standard test
organisms must be entered (see also § 3.2).
2.2.2 Filter the database
The first (optional) step in the finding the similar cases, is to select a part of the
database on the basis of a logical equation. Examples of such equation are: 'TU<3' or
'Exposure=multiple/constant'. These conditions can be combined in complex
equations including several functions (see: calculated variables). Note that the result
of the equation should be a logical value (True or False, the result of comparison and
logical functions like: > < = and or).
18
Alterra-rapport 787
There is one special kind of selection that is the relative selection. In this case the
selected cases may differ from the problem case only with a certain relative value.
For instance ((TU<M/2) and (TU>M*2)) in which M is the toxic unit of the
problem case. The advantage of this relative selection is that this condition can be
updated in the cross-validation, and therefore the relative factor (2 in the example)
can be optimized (see § 2.4 and 2.5).
2.2.3 Select conditional and response variables
The next step in CBR is to select variables that are to be used in the analysis.
There are two kinds of variables:
1. Conditional variables
Conditional variables are called independent variables in regression analysis. They
'explain' the effect of a substance. Examples of these variables in PERPEST are
the “Mode of action” and the concentration of a substance.
2. Response variables
Response variables are variables that express the effects of a substance. In
regression these variables are called dependent variables. In PERPEST all effect
classes of herbicides or insecticides are automatically selected as response
variables.
Nominal variables are used as conditional variables, all cases that equal the question
case get a value 1 and all other cases get value 0 assigned. When nominal variables are
used as response variables, the variable is translated into binary dummy variables.
Each class is one variable that can take two values: true (1) or false (0). For ordinary
variables these restrictions are not made.
2.2.4 Transformation, standardization and weighing of variables
Before standardization, a non-linear transformation can be used to shrink certain
parts and to stretch other parts of the scale of the variable. The most commonly used
transformation is the logarithmic transformation.
The available transformations are listed in Appendix I.
The different variables need to be standardized to give equal weight to different
scaled variables. There are three options implemented (see details in Appendix II):
1. Normalization – The variable is scaled to be a normal distribution with a mean of
1 and a standard deviation of 1.
2. MinMax standardization – By this method the variables are scaled between one
and zero.
3. No transformation - Use unstandardized data. Use this option only if the data are
already standardized.
Alterra-rapport 787
19
The variables are weighted by multiplying their values with weights that are entered
by the user. The purpose of this weighting is to give important variables more
weight. The weights also can be optimized by the computer (see § 2.5).
2.2.5 Calculate dissimilarities
The distance between the 'question case' and all other cases is calculated by a
dissimilarity index. Appendix III gives a list of the supported indices. At default the
Euclidian distance index is used.
Optionally the dissimilarity coefficients can be scaled between the minimum and
maximum dissimilarity, which is especially useful with noisy data:
*
D = MinDist +
2.3
D − MIN ( D )
MAX ( D ) − MIN ( D )
(MaxDist − MinDist )
How to predict a response variable?
After calculation of the dissimilarities of all cases with the question case, the cases in
the database are ranked according to the obtained values. The N nearest cases are
used to make a prediction of the selected response variables (we call N the number of
nearest points). The default number for N is 25. With the response variables of these
points, the prediction is made. The following methods are implemented:
1. Inverse distance
The response variables of these cases are weighted so that the influence of the
cases declines with the dissimilarity from the case being estimated.
N
p
*
∑ ( y ki Di )
* i=1
P =
N
p
∑ Di
i=1
in which:
P*
= Prediction of the transformed response variable (needs to be transformed
back by using the inverse of the transformation)
N
= Number of nearest points
yki
= Transformed (not standardized) response variable k of case i
Di
= Dissimilarity of case i with the question case
P
= Distance weighting power (is always negative !)
The more negative the distance weighting power, the faster the decline in influence
and the less the effect of points further out will have on the interpolation.
2. Moving averages
The response variables of the N nearest cases are averaged without weighing.
20
Alterra-rapport 787
3. Local multiple regression
The response variables of the N nearest cases are estimated by multiple regression
of the nearest points with the conditional variables. This method is suitable for
noisy and irregular spaced data.
4. Global multiple regression
The response variables are estimated by multiple regression with the conditional
variables.
A bootstrapping procedure calculates the confidence intervals for the different effect
classes and endpoints (Manly, 1997). In this resampling technique many (default 500)
random data sets are generated by selecting cases at random with replacement. To be
conservative we selected a smaller amount of cases than in the original database
(default 75%). With each data set a prediction is made. The generated distribution of
predictions serves as an estimate of the uncertainty. The 2.5 and 97.5% percentiles
from this bootstrap distribution serve as the 95% confidence interval.
2.4
How accurate is the prediction?
The performance of the prediction method is evaluated using leave-one-out crossvalidation (Stone, 1974). With this technique one case is removed from the database.
Subsequently, the response variables of this case is predicted, using the remaining
cases. The prediction is compared with the removed case. This procedure is repeated
for all cases and a goodness-of-fit measure is calculated. In case of binary results
(such as the effect classes in PERPEST) only the log(likelihood) and the percentage
correctly predicted are suited.
Four indices of the fit were implemented:
1. The mean adjusted R2 of the response variables (= percentage of variance
explained by the model)
2. The minimal adj. R2 of the response variables.
3. The sum of the log(likelihood) of the response variables. This measure is only
suited for binary variables (Boolean, String, Calculated string).
4. The percentage correctly predicted. This simple measure also is only suited for
binary variables.
Details about these options are given in Appendix IV.
2.5
Optimization of the prediction
The CBR method implies many subjective choices of methods and weights. We used
the controlled random search procedure (Price, 1979) to optimize these choices
mathematically.
The following parameters used by the prediction method can be optimized automatically:
- Weights of conditional variables
- Distance weighting power
- Number of nearest points
Alterra-rapport 787
21
The parameters are optimized iteratively, by use of the Controlled Random Search (CRS)
algorithm (Price, 1979). This algorithm is an improvement of pure random search, an
algorithm searching the best set of parameters by trying at random. After each
iteration the goodness of fit (adjusted R2) is calculated by cross validation (see § 2.4).
The CRS algorithm first selects N sets of model parameters uniformly distributed
over prior parameter ranges, calculates the goodness-of-fit for each and puts them in
a vase.
It then selects m+1 points at random from the vase and mirrors the last point over
the average (centroid) of the first m. The mirrored point is the new trial point. The
goodness-of-fit (R2) is calculated. If the R2 better than the worst set of parameters in
the vase, the worst element of the vase is replaced by this new guess. This process
continues until a convergence criterion is reached.
22
Alterra-rapport 787
3
User manual
3.1
Installation and getting started
The program is distributed as a single file (Install PERPEST.exe). To install the
program, run this file and follow the instructions on the screen. The program is
installed in the Program Files/WUR directory, and an icon is added to the Start |
Programs menu.
To start the program click on the PERPEST icon in the Programs menu. The start
screen will be displayed (Fig. 3.1).
Fig. 3.1. The Start screen.
Click the Prediction button to make a prediction (see § 3.2).
The Help button opens the context sensitive Help system.
The program can be removed from the computer in the following way:
1. Open the configuration screen by selecting Configuration from the Start menu.
2. Select Add or remove programs
3. Select PERPEST from the list of installed software and click the Remove button.
Alterra-rapport 787
23
3.2
Predicting an effect
After pressing the “Prediction” button in the start screen, the following dialog box
appears (Fig 3.2).
Fig. 3.2. The substance data dialog box.
Enter in this screen the features of the experiment to be predicted. The dialog box
has the following tab sheets:
- Experiment features tab
- Weigh/Select using tab
- Options tab
If you press the Next button, you go to the next tab sheet, alternatively you can
select tab sheets by clicking the tabs. You can also load a previous session by clicking
the Load button. (*.lab file).
3.2.1
Experiment features tab
In this window you enter the features of the experiment that should be predicted.
- Substance Select here the chemical name/CAS number of the pesticide. Right
of this list, the following buttons are displayed.
- Add New - Add a new substance to the database (see below).
- Delete - delete the current substance. This is only possible if there are no
records with experiments of this substance in the database (the button is not
grayed then).
- Edit - edit the properties of the substance.
- Features - the features of the selected substance are listed in this table. Below
the table, the Number of cases with data about this substance is displayed.
24
Alterra-rapport 787
-
Concentration (µg/l) - type here the concentration of the substance. As you
type, the toxic unit of the currently selected substance is displayed.
Number of effect classes - choose either 3 or 5 effect classes. In case of three
effect classes, the original classes 3, 4 and 5 are fused to one “clear effects” class.
Reset button. - resets the selections.
3.2.1.1 Add new substance
This form appears if you press the New button in the Experiment features tab of the
substance data form (see above). Fill this form to enter a new substance or for
editing the features of an existing substance. The following fields should be filled:
- CAS registry number (required). Fill here the international CAS registry
number of the substance.
- Search on Internet button. Use this button to find information about pesticides
on a number of selected websites.
- Chemical name (required). The name of the substance.
- Type of substance (required). Select the type of substance (herbicide or
insecticide) here.
- Mode of action. The mode of action (e.g. photosynthesis inhibitor) is filled here.
- Molecule group The active molecule group (e.g. triazin(on)e).
- DT50 (days). The half-life of the chemical in water as determined in a watersediment system,
- EC50 (µg/l) (required). LC50 or EC50 of most susceptible standard test
species.
- Henry coefficient (Pa m3/mol) The partitioning coefficient air-water.
- Kom (l/kg) The partitioning coefficient between water and organic matter.
3.2.1.2 Search Internet
This dialog box may help to find information about substances on internet (CAS
number, LC50, DT50 etc.).
Select a title of an internet site in the upper list. The URL and a short description is
displayed. If you press OK, the default internet browser should be started with the
URL in the edit box.
If nothing happens, you may not have registered the extension *.html in the
Windows Explorer.
Alterra-rapport 787
25
3.2.2 Weigh/Select using tab
Fig. 3.3. The Weight/Select using tab sheet.
In this tabsheet (Fig 3.3) you can select or deselect conditional variables or selection
variables. In the lower part of the dialog screen you can select the hydrology and
exposure of the experiment to be predicted.
Left panel: Here you select the conditional variables used for weighing the
similarity of cases:
- Toxic unit (*) – cases evaluating a concentration with a similar TU have a higher
weight
- Mode of action (*) – cases evaluating a a compound with a similar mode of action
have a higher weight
- Molecule group (*) – cases evaluating a a compound within the same molecule
group have a higher weight
- Substance (*) –cases evaluating a a compound within the same substance have a
higher weight
- Hydrology – cases with a similar hydrology have a higher weight
- Exposure – cases with a similar exposure have a higher weight
- DT50 – cases evaluating a substance with a similar DT50 have a higher weight
- Henry – cases evaluating a substance with a similar Henry coefficient have a
higher weight
- Kom – cases evaluating a substance with a similar Kom have a higher weight
Right panel: Here you select a part of the case base based on the conditional
variables:
- Nearby Toxic unit (*) - select cases within a certain range of toxic unit (factor, see
options)
26
Alterra-rapport 787
- Mode of action – select cases evaluating substances with the same mode of action
only
- Molecule group – select cases evaluating substances with the same active molecule
group only
- Substance – select cases evaluating the same substance only
- Hydrology – select cases having the same hydrology only
- Exposure– select cases evaluating the same exposure only
* Selected as default
3.2.3 Options tab
Fig. 3.4. The Options tab sheet
The option parameters of PERPEST are grouped in various tabs. Changes in the
parameters are saved till the next session (Fig 3.4). Press the Defaults button to reset
the default values of the parameters. The parameters in each tab are explained below:
- First tab sheet (‘Prediction’):
- Second tab sheet (‘Bootstrap’):
- Third tab sheet (‘Optimize’):
- Fourth tab sheet (‘PERPEST’)
Alterra-rapport 787
27
The first tab sheet (Prediction):
parameter
Standardization method
Dissimilarity measure
Number of nearest points
Prediction method
Distance power
Min. distance (or NAN)
Max. distance (or NAN)
Critical dissimilarity (%)
description
This parameter defines the standardization method used to standardize
the conditional variables before the dissimilarity with all cases can be
calculated. See Appendix II.
This parameter defines the similarity method used to calculate the
dissimilarity between the question case and all cases. See Appendix III.
For all CRS prediction methods the N most similar cases are used to
calculate a prediction. The default number of nearest for N is 25. With
the response variables of these points, the prediction is made using
various methods.
Use this parameter to select the method for the prediction. See § 2.3
With the inverse distance prediction method, the response variables of
N most similar cases are weighted so that the influence of the cases
declines with the dissimilarity to a power from the case being
estimated.
The Min. distance defines the minimum of a scaling of the dissimilarity
measures, which is especially useful with noisy data. Assign NAN (Not
A Number) to this parameter if you want to keep the minimum
unchanged.
The Max. distance defines the maximum of a scaling of the
dissimilarity measures, which is especially useful with noisy data. Assign
NAN (Not A Number) to this parameter if you want to keep the
minimum unchanged.
Optionally, the user may limit the cases that are displayed in the Cases
Dialog to a certain percentage of the optimal similarity.
The second tab sheet (Bootstrap):
parameter
N Bootstrap
Bootstrapped fraction
Confidence limits p
description
N Bootstrap defines the number of random data sets that are
generated for the Bootstrap technique. The larger this number, the
more accurate the bootstrapped confidence limits are.
To be conservative we selected a smaller amount of cases than in the
original database (Bootstrap fraction, default 75%) for each
bootstrapped prediction.
This parameter sets the probability of the confidence limits of the
bootstrapped predictions.
The third tab sheet (Optimize):
parameter
Convergence criterion
“Vase” size
Goodness of fit
Stop criterion stepwise
Range for optimizing:
28
description
The convergence criterion is a stop criterion for the optimization. The
lower this parameter, the better the optimization, but the longer the
optimization takes. The convergence is defined as the relative
difference in goodness-of-fit between the best and worst parameter set
in the ‘vase’ during controlled random search.
This parameter sets the size of the vase in controlled random search
optimization. A higher vase size is needed if the optimization fails to
find the global optimum but stays in a local optimum.
This parameter sets the used goodness of fit criterion for cross
validation and optimization. See § 2.4 and Appendix IV.
In a step forward analysis (optimization or prediction), the conditional
variable that yields the best fit is added first. Subsequently, the next
parameter is added, but only if the goodness of fit increases with a
certain factor, i.e the stop criterion.
During optimization several parameters are changed within certain
Alterra-rapport 787
Weights of vars.
Range for optimizing:
Ranges of vars.
Range for optimizing:
Distance power
Range for optimizing:
Num. of nearest points
ranges. This parameter defines the minimal and maximal weights of
variables.
During optimization several parameters are changed within certain
ranges. This parameter defines the minimal and maximal relative ranges
of variables
During optimization several parameters are changed within certain
ranges. This parameter defines the minimal and maximal distance
power.
During optimization several parameters are changed within certain
ranges. This parameter defines the minimal and maximal number of
nearest points.
The fourth tab sheet (Perpest):
parameter
CAS
ToxUnit
Mode of Action
Molecule Group
Hydrology
Expos
DT50
Henry
Kom
Max allowable difference
(toxic unit), factor
description
Set the default weight and (optionally) the transformation used for the
CAS (substance code).
Set the default weight and (optionally) the transformation used for the
concentration of the substance expressed as toxic unit (Conc/EC50).
Set the default weight and (optionally) the transformation used for the
mode of action of the pesticide.
Set the default weight and (optionally) the transformation used for the
active molecule group.
Set the default weight and (optionally) the transformation used for the
hydrology during the experiment (“Flow through” or
“Stagnant/recirculating”).
Set the default weight and (optionally) the transformation used for the
exposure to the substance in the experiment (“multiple/constant” or
“single/pulse”).
Set the default weight and (optionally) the transformation used for the
field dissipation DT50 (days).
Set the default weight and (optionally) the transformation used for the
Partitioning coefficient air-water (Pa m3/mol).
Set the default weight and (optionally) the transformation used for the
Partitioning coefficient water-organic matter Kom (L/kg).
At default the system selects only experiments that differ by a certain
factor with the question experiment. You can set that factor here.
3.2.4 Predicted effects
After evaluating all the options and pressing the “next” button, the “predicted
effects” screen appears.
In this screen, a summary of the results is given as pie charts (see Fig. 3.5). Each pie
gives the predicted effect classes for that response variable. By pressing the right
mouse button, a menu pops up with the following items:
- Copy - copy the figure as in wmf format to the clipboard. Pasting it in Microsoft
Word, yields a sharp scalable picture.
- Change Font - change the font of the pie charts.
- Update Figure – updates the figure using the latest settings.
Alterra-rapport 787
29
Fig. 3.5. The predicted effects screen.
Below the figure, the following items are visible:
- Log(likelihood) – loglikelihood is a goodness-of-fit measure that is determined
by cross-validation (may take some time to appear).
- Gradient button – Here you can create a plot of the effects of a concentration
gradient.
- Optimize button - click this button to optimize the method of prediction. See
also: CRS dialog box.
- Confidence limits button - view the prediction dialog box, in which the results
are presented as table and a bootstrap estimate of the confidence limits is given
here.
3.2.5 Browse analogous cases
After pressing the “next” button, the “Brows cases analogous with …” screen
appears (Fig 3.6).
30
Alterra-rapport 787
Fig. 3.6. The Brows cases analogous with (question case) screen
This dialog box makes it possible to view the details of the 10 most similar
experiments. The cases are sorted in order of similarity. The first case (order number
1) is the most similar case. The left panel shows the conditional variables of that
experiment and the right panel the values of the response variables.
Press the > button to view the next case and the < button to move backwards.
Pressing the >| button moves to the last most dissimilar case. The |< button
restores the first case.
Press Finish to close the dialog box. Before you return to the first screen, you get the
opportunity to save your session (all settings are saved to a file that you can load in
the Substance data dialog box (§ 3.2)
3.3
Optimizing the prediction
With this option, the weights and some of the parameters can be optimized. To start
optimization click on the Optimize button in the Predicted effects dialog box (see: §
3.2.4). The next dialog box appears (Fig. 3.7):
Alterra-rapport 787
31
Fig. 3.7. The controlled Random Search dialog box. Use this screen to select the way of optimization and the
parameters that must be optimized.
This dialog box has the following components:
1. Optimize: Use this box to select which parameters should be optimized. The
following items can be (de)selected:
• Weights of conditional variables. This item should be checked to optimize the
weights of conditional variables. If there is only one conditional variable,
changing the weight is useless. Therefore, then this item is disabled.
• Range of conditions. If there is a filter with relative ranges defined, the relative
range can be optimized. If there is no relative range, this option is useless and
disabled.
• Number of nearest points. Check this option to optimize the number of nearest
points.
• Distance power. When using the inverse distance prediction method, the distance
power is an important parameter, which determines how the influence of the
cases declines with the dissimilarity. This parameter can be optimized. When
using other prediction methods, this option is grayed.
• Min, and max. distance When using the inverse distance prediction method, the
minimum and maximum distance are important parameters, that may prevent
that nearby cases are weighted too strongly. Both parameter are optimized if
this option is checked. When using other prediction methods, this option is
grayed.
• Prediction method. Use this option to find the optimal prediction method. Note:
this is a nominal parameter and therefore the CRS optimization method may
fail; it is probably better to optimize the different methods separately.
• Distance measure. Use this option to optimize the distance measure. Note: this is
a nominal parameter and therefore the CRS optimization method may fail; it is
probably better to optimize models with different measures separately.
• Standardization method. Note: this is a nominal parameter and therefore the CRS
optimization method may fail.
32
Alterra-rapport 787
• Transformations of conditional variables. Note: this is a nominal parameter and
therefore the CRS optimization method may fail.
2. Optimize method: There are two ways of optimization:
• Enter all. Just optimize the model with all conditional variables.
• Stepwise. Enter the best conditional variable in a similar way as described with
stepwise prediction (see: § 3.2.3), but each step is optimized first. While this is
the ‘best’ optimization method, it may be very time consuming.
3. Save optimized model to: Type here the file name to save the optimized model.
4. Options button: If you press this button, the options dialog box is displayed (with
the optimize tab). You can change the optimization ranges and other parameters
here (see: § 3.2.3)
After the OK button is pressed, optimization starts. The progress of the
optimization process is showed in a window (Fig. 3.8). In this screen the following
information is showed:
• Goodness of fit. This is the goodness-of-fit of the last set of parameters.
• Best goodness of fit. This is the best goodness-of-fit so far.
• Convergence. This value is empty while the ‘vase’ is being filled (see Controlled
Random Search). Thereafter it shows the relative difference between the best and
the worst parameter set in the ‘vase’.
• Table with parameters. In this table all parameters that are being optimized are
showed. The Minimum, Maximum and the Best value in the ‘vase’ is displayed.
The last column (Current) shows the last value of this parameter that has been
evaluated.
• Close button. Press this button to stop the optimization and proceed with the
currently best parameter set. It is not recommended to do this because there is a
chance that it might fail.
• Stop CRS button. Press this button to stop the optimization process temporarily.
Press the button again to proceed.
Fig. 3.8. The progress of the optimizing process.
Alterra-rapport 787
33
If the convergence criterion is reached or if the user has pushed the Close button, the
CRS results dialog is displayed. In this dialog, the best parameter set is displayed, and
you are prompted if you want to use the new parameter set now. It is always saved to
the *.lab file that is indicated in the first screen.
3.4
Creating concentration gradients
In the Predicted effects dialog box (see: § 3.2.4) you can predict concentration gradients
(Fig. 3.9) by pressing the Gradient button. The concentration gradient dialog appears.
3.4.1
Concentration gradient dialog
In this figure the effects of different concentrations on all endpoints are plotted. The
effect classes are stacked and shown as coloured areas. At default the gradient is
logarithmic from 0.0125 to 6.4 toxic units.
Right-clicking on the figure brings up a popup-menu with the following items:
Copy to clipboard – Copies the figure to the clipboard (as metafile). You can paste
the figure in Word or another program (example: Fig. 3.9).
Toxic units – Toggles between concentrations (µg/l) and toxic units.
Change Concentration Range – Opens the concentration range dialog to change
the concentration range or to add observed effects in new studies in the figure.
Tables – Shows the data as tables that can be copied to other applications (e.g.
Excel).
Properties – Change the colours, axes and titles of the plot.
1
Effect of 2,4-D on
Community metabolism
no effect
slight effect
clear effect
not enough data
Probability
0.8
0.6
0.4
0.2
50
100150
200
Concentration (mg/l)
Fig. 3.9. Example of a concentration gradient.
34
Alterra-rapport 787
3.4.2 Concentration range dialog
Fig. 3.10. The concentration range dialogue.
Use this dialog box to change the concentration range or to add observed effects in
the concentration gradient figure (Fig. 3.10).
This screen has two tab sheets:
Concentrations – In this tab sheet you can enter the number of concentrations in
the plot (default 10). If this number is changed, the concentration range is updated
logarithmic. You can also change the concentrations or toxic units separately. If you
press the Update Logarithmically button, the concentration range is updated
logarithmically (doubled) with the last changed concentration as basis.
Observed effects – In this tab sheet you can enter results from your own
experiments to compare the predicted values with.
3.4.3 Gradient data dialog
The data of the concentration gradient graphs are displayed as tables here. There are
two buttons to save the data to the clipboard:
To Clipboard button – copy the current table to the Windows clipboard. You can
paste these data in Excel or Word.
All to Clipboard button – copy all tables to the Windows clipboard (This may take
some time).
3.4.4 Graph properties dialog
Use this dialog box to change several features of the concentration gradient figure.
The screen has the following tab sheets:
Series – Change the colour and legend title of each series.
Legend – Change the font and the position of the legend.
Alterra-rapport 787
35
Axes – Select on the left-hand side the axis that you want to adjust. On the right
side, you can edit the title, font and scaling of each axis.
Titles – Edit the graph title and font here.
36
Alterra-rapport 787
References
Aamodt, A., and E. Plaza. 1994. Case-Based Reasoning: foundational issues,
methodological variations, and system approaches. AI Communications 7:39-59.
Anderson, J. R. 1983, The architecture of cognition. Cambridge, Mass., Harvard
University Press, UK.
Branting, L. K., J. D. Hastings, and J. A. Lockwood. 1997. Integrating cases and
models for prediction in biological systems. AI Applications 11:29-48.
Brock, T. C. M., J. Lahr, and P. J. Van den Brink. 2000a. Ecological risks of
pesticides in freshwater ecosystems. Part 1: Herbicides. Report 088, Alterra Green
World Research, Wageningen, The Netherlands.
Brock, T. C. M., R. P. A. Van Wijngaarden, and G. J. Van Geest. 2000b. Ecological
risks of pesticides in freshwater ecosystems. Part 2: Insecticides. Report 089, Alterra
Green World Research, Wageningen, The Netherlands.
Campbell, P. J., D. J. S. Arnold, T. C. M. Brock, N. J. Grandy, W. Heger, F.
Heimbach, S. J. Maund et al. 1999, Guidance document on Higher tier Aquatic Risk
Assessment for Pesticides (HARAP) , SETAC-Europe Brussels, Belgium.
Frize, M., and R. Walker. 2000. Clinical decision-support systems for intensive care
units using case-based reasoning. Medical Engineering And Physics 22:671-677.
Koelmans, A. A., A. Van der Heijde, L. M. Knijff, and R. H. Aalderink. 2001.
Integrated modelling of eutrophication and organic contaminant fate & effects in
aquatic ecosystems. A review. Water Research 35:3517-3536.
Jongman, R. G. H., C. J. F. Ter Braak and O. F. R. Van Tongeren (Eds). 1995, Data
Analysis in Community and Landscape Ecology, Cambridge University Press,
Cambridge, UK.
Kolodner, J. L. 1993, Case-based reasoning. San Mateo, USA., Morgan Kaufmann
Publishers, San Mateo, CA, USA.
Leake, B. D. 1996. Case-based reasoning. Experiences, Lessons & Future Directions.
Menlo Park, California, USA., AAAI Press, Menlo Park, CA, USA.
Linders, J. B. H. J., J. W. Jansma, B. J. W. G. Mensink and K. Otermann. 1994.
Pesticides: Benefaction or Pandora's box? A synopsis of the environmental aspects
of 243 pesticides. Report 679101014, RIVM, Bilthoven, The Netherlands.
Alterra-rapport 787
37
Manly, B.F.J. 1997. Randomization, bootstrap and Monte Carlo methods in biology.
Chapman & Hall, London, UK.
Montani, S., R. Bellazzi, L. Portinale, G. d'Annunzio, S. Fiocchi, and M. Stefanelli.
2000. Diabetic patients management exploiting case-based reasoning techniques.
Computer Methods And Programs In Biomedicine 62:205-218.
Price WL. 1977. A controlled random procedure for global optimisation. The
computer journal 20:367-370.
Scheffer, M. 1991. On the predictability of aquatic vegetation in shallow lakes.
Memorie dell'Istituto Italiano di Idrobiologia 48:207-217.
Stone M. 1974. Cross-validatory choice and assessment of statistical predictions,
Journal of the Royal Statistical Society B 36:111-147.
Tomlin, C.D.S. 2000. The pesticide manual. Twelfth edition. British Crop Protection
Council, Farnham, UK.
Traas, T. P., J. H. Janse, T. Aldenberg, and T. C. M. Brock. 1998. A food web model
for fate, direct and indirect effects of Dursban 4E (a.i. chlorpyrifos) in freshwater
microcosms. Aquatic Ecology 32:179-190.
Van den Brink, P. J., J. Roelsma, E. H. Van Nes, M. Scheffer, and T. C. M. Brock.
2002. PERPEST model, a case-based reasoning approach to Predict the Ecological
Risks of PESTicides. Environmental Toxicology and Chemistry 21:2500-2506.
Van Nes, E. H., and M. Scheffer. 1993. Best Analogous Situations Information
System. User's guide for BASIS version 1.0. Final report 93.044. Institute for Inland
Water Management and Waste Water Treatment (RIZA), Lelystad, The Netherlands.
Watson, I., and F. Marir. 1994. Case-based reasoning: a review. The Knowledge
Engineering Review 9:355-381.
38
Alterra-rapport 787
Appendix I Supported transformations
Before standardization, a non-linear transformation can be used to shrink certain
parts of the scale and to stretch other parts. The following transformations are
available:
1. Logarithmic transformation
Commonly used transformation to change a log-normally-distributed variable into
a normal distribution or to give less weight to large quantities.
*
y ki = ln( y ki )
2. Log(x+1) transformation
Like logarithmic transformation but scaled for variables that can be zero.
*
y ki = ln( y ki + 1)
3. Log(x/(100-x)) transformation
Special transformation to bring data of percentages as close as possible to a
normal distribution.
y ki
*
)
y ki = ln(
100 - y ki
4. Square root transformation
Square root transformation, applied when analyzing Poisson-distributed variables.
*
y ki = y ki
5. Inverse transformation
Used, e.g., to make the relation between Secchi depth and extinction
approximately linear:
1
*
y ki =
y ki
6. Inverse (x+1) transformation
Like the inverse transformation but scaled for variables that can be zero.
1
*
y ki =
y ki + 1
7. Angular Percentages transformation
Special transformation to bring data of percentages as close as possible to a
normal distribution. Alternative for Log(x/(100-x)) transformation.
y
*
)
y ki = arcsin( ki
100
8. Angular transformation
Special transformation to bring data of fractions as close as possible to a normal
distribution.
*
y ki = arcsin( y ki )
Alterra-rapport 787
39
9. No transformation
Use unchanged data.
Symbols:
yki
= value of the variable k in case i
y*ki
= transformed value of the variable k in case i
40
Alterra-rapport 787
Appendix II
Supported standardization methods
The different variables need to be standardized to give equal weight to different
scaled variables.
4. Normalization
By this method the relative position of an observation within a distribution is
described. The normalized value (also called standard or Z score) shows how many
times the standard deviation an observation deviates from the mean of the
population. The mean of the normalized values is 0 and the standard deviation is
1. It is obtained by subtracting the mean from a value and dividing this difference
by the standard deviation.
y -y
*
y ki = ki k
s.d.
5. MinMax standardization
By this method the variables are scaled between the minimum and maximum
values in the database. The minimum gets value 0 and the maximum gets value 1.
*
y ki =
y ki - MINi ( y ki )
MAXi ( y ki ) - MINi ( y ki )
6. No standarization
Do not change data. Use this option only if the data are already standardized.
Symbols:
y*ki
yki
MINi(yki)
MAXi(yki)
yk
s.d.
n
transformed value of the variable k in case i
value of the variable k in case i
minimal value of the variable k in the database
maximal value of the variable k in the database
mean of variable k in the database
standard deviation of variable k in the database
number of variables
Alterra-rapport 787
41
42
Alterra-rapport 787
Appendix III
Supported dissimilarity measures
The distance between the 'question case' and all other cases is calculated by a
dissimilarity index. The following gives a list of the supported indices.
1. Euclidean distance (default). The Euclidean Distance (ED) is the most frequently
used index. It is the distance in the n-dimensional space constrained by the
conditional variables (Each variable is one dimension of the space).
n
ED =
2
∑ ( y ki - y kj )
k=1
2. City Block distance (also called the Manhattan Distance). The City Block Distance
(CB) is the sum of the differences between all variables. It weights the variables
that are far out stronger than the Euclidean Distance does.
n
CB = ∑ | y ki - y kj |
k=1
3. Cord Distance. The Cord Distance (CD) is geometrically represented by the
distance between points where the sample vectors intersect a unit sphere (see:
Jongman et al., 1995). It gives more weight to qualitative aspects than the other
indices of the program.
n
CD =
y ki
n
∑ [
k=1
2
∑ y ki
k=1
-
y kj
n
]
2
2
∑ y kj
k=1
4. Chebychev Distance. The Chebychev Distance (ChD) is the maximum difference
between variables. It weights one variable that is far out even stronger than the
City Block Distance.
ChD =MAX k | y ki - y kj |
Symbols:
transformed and standardized value of the variable k in case i multiplied
yki
with the weight of the variable (default weights are 1).
n
number of variables
The properties of the Euclidean Distance and the Cord Distance are discussed by
Jongman, et al., (1995). Optionally the dissimilarity coefficients can be scaled between
the minimum and maximum dissimilarity, which is especially useful with noisy data:
*
D = MinDist +
D − MIN ( D )
MAX ( D ) − MIN ( D )
Alterra-rapport 787
(MaxDist − MinDist )
43
44
Alterra-rapport 787
Appendix IV
Supported validation measures
The following indices are used as goodness-of-fit measures. In case of a model with
more than one response variables, these measures are combined in a single value
(see: § 2.4)
Adjusted R2
R2 (sometimes called coefficient of determination) is the same statistic that is
commonly used in linear regression. The sample R2 usually is an optimistic estimate
of how well the model fits the reality. The statistic adjusted R2 attempts to correct R2
to reflect more closely the goodness of fit of the model in the population.
Formula:
adj. R 2 = 1 -
residual sum of squares / (N - p - 1)
total sum of squares / (N - 1)
N = sample size, p = number of parameters.
If the adjusted R2 equals 1, the model fits perfectly, if the adjusted R2 is negative, the
mean value of the response variables is a better prediction than the model.
Log(likelihood)
For binary data the adjusted R2 is not suitable. For these data two other measures are
implemented: The likelihood is the probability that the observed data occur if the
model is correct. As this is usually an extremely low probability, the logarithm of this
value is taken, resulting in a negative number. In our case the log likelihood (L) is
calculated as follows:
L=
∑ ln(1 − p ) + ∑ ln( p )
obs =0
obs =1
Symbols:
p
Prediction
∑
Sum of the cases where the observed conditional variable equals 0
obs =0
Percentage correctly predicted
This simple measure is less accurate as the log(likelihood), but is also suited for
binary variables only. It simply gives the percentage of the responses that is predicted
correctly.
Alterra-rapport 787
45
46
Alterra-rapport 787