1
ENG460: Engineering
Thesis
Measurement of Induction Motor Parameters
Using the Voltech PM6000 Power Analyser
Ashley Van Niekerk
Supervisor: Dr Sujeewa Hettiwatte
Co-supervisor: Assoc. Prof. Graeme Cole
22/12/2014
Acknowledgements
I’d like to thank Dr Sujeewa Hettiwatte, Mr Iafeta Laava and Mr John Boulton for their ongoing
support throughout this project.
1
Table of Contents
Tables ...................................................................................................................................................... 4
Figures ..................................................................................................................................................... 4
1
2
3
4
Introduction .................................................................................................................................... 5
1.1
Overview ................................................................................................................................. 5
1.2
Approach ................................................................................................................................. 6
Induction Motors ............................................................................................................................ 7
2.1
Operation ................................................................................................................................ 7
2.2
Squirrel Cage vs. Wound Rotor Design ................................................................................... 8
2.3
Equivalent Circuit .................................................................................................................... 8
Test Procedure .............................................................................................................................. 10
3.1
DC test ................................................................................................................................... 10
3.2
No Load Test ......................................................................................................................... 10
3.3
Locked Rotor test .................................................................................................................. 12
System Components ..................................................................................................................... 15
4.1
PM6000 Power Analyser ....................................................................................................... 15
4.1.1
Operation ...................................................................................................................... 15
4.1.2
Menu Items ................................................................................................................... 15
4.1.3
Input .............................................................................................................................. 16
4.1.4
Setup ............................................................................................................................. 17
4.1.5
Display ........................................................................................................................... 18
4.1.6
Establishing a connection to a Computer ..................................................................... 18
4.1.7
Specifications ................................................................................................................ 19
4.2
Variable Frequency Drive ...................................................................................................... 20
4.2.1
Operation ...................................................................................................................... 20
4.2.2
Specifications ................................................................................................................ 23
4.3
Toshiba Motor....................................................................................................................... 24
4.3.1
4.4
Leroy Somer Motor ............................................................................................................... 25
4.4.1
5
6
Specifications ................................................................................................................ 24
Specifications ................................................................................................................ 25
System Design ............................................................................................................................... 27
5.1
System Schematics ................................................................................................................ 27
5.2
Australian Wiring Standards ................................................................................................. 30
Results ........................................................................................................................................... 33
2
6.1
Toshiba Motor....................................................................................................................... 33
6.1.1
Calculations ................................................................................................................... 35
6.1.2
Torque speed characteristics ........................................................................................ 38
6.2
Leroy Somer Motor ............................................................................................................... 38
6.2.1
Calculations ................................................................................................................... 40
6.2.2
Torque speed characteristics ........................................................................................ 42
7
Conclusion ..................................................................................................................................... 43
8
Future Work .................................................................................................................................. 44
8.1
Low Pass Filter....................................................................................................................... 44
8.2
Calibration of the Power Analyser ........................................................................................ 46
8.3
Dynamometer ....................................................................................................................... 46
9
Appendices .................................................................................................................................... 47
9.1
Appendix 1 - Matlab Program for Torque Speed Characteristic Curve ................................ 47
9.2
Appendix 2 - Matlab Program for Frequency Response of Proposed RC Filter .................... 48
9.3
Appendix 3 - Matlab Program for PWM Output of the Variable Frequency Drive ............... 49
9.4
Appendix 4 - Test Methods Recommended by IEEE ............................................................. 50
10
9.4.1
The No Load test ........................................................................................................... 50
9.4.2
Method 1....................................................................................................................... 50
9.4.3
Method 2....................................................................................................................... 52
9.4.4
Method 3....................................................................................................................... 52
9.4.5
Method 4....................................................................................................................... 54
Bibliography .............................................................................................................................. 55
3
Tables
Table 1 - Rules of thumb for separating the stator and rotor circuit reactances ................................. 14
Table 2 - Menu and submenu items which can be accessed via the keypad ....................................... 16
Table 3 - Maximum voltage and current that can be measured continuously and over one second .. 19
Table 4 - Maximum and minimum ratings for power that can be supplied to PM6000 ...................... 19
Table 5 - Dielectric strength of inputs and outputs .............................................................................. 19
Table 6 - Electrical and temperature specifications for the Movitrac 07 unit ...................................... 24
Table 7 - Nameplate information for the Toshiba motor ..................................................................... 24
Table 8 - Nameplate information for the Leroy Somer motor ............................................................. 25
Table 9 - Data from the locked rotor test performed using the 50Hz Lab-Volt power supply ............. 33
Table 10 - Data from the locked rotor test performed at reduced frequency using the VFD .............. 33
Table 11 - No load test data .................................................................................................................. 34
Table 12 - DC test data .......................................................................................................................... 35
Table 13 - Data from the locked rotor test performed using the 50Hz Lab-Volt power supply ........... 39
Table 14 - Data from the locked rotor test performed at reduced frequency using the VFD .............. 39
Table 15 - No load test data .................................................................................................................. 39
Table 16 - DC test data .......................................................................................................................... 39
Figures
Figure 1 - Per-phase equivalent circuit ................................................................................................... 9
Figure 2 - Approximation of the equivalent circuit under no load conditions ..................................... 11
Figure 3 - Approximation of the equivalent circuit for the locked rotor test ....................................... 12
Figure 4 - Rear view showing connections to Lab-Volt equipment ...................................................... 15
Figure 5 - Front view showing digital display ........................................................................................ 16
Figure 6 - Diagram showing triangle and sine waves placed through a comparator ........................... 21
Figure 7 - Circuit diagram for a PWM VFD ............................................................................................ 22
Figure 8 - Block diagram for a typical Variable Frequency Drive .......................................................... 23
Figure 9 - Isometric view of the unit which is rated for 0.37kW AC machines ..................................... 23
Figure 10 - Wiring Configuration for DC test ........................................................................................ 28
Figure 11 - Wiring Configuration for no load test ................................................................................. 28
Figure 12 - Wiring Configuration for the locked rotor test ................................................................... 29
Figure 13 - Connections to Power Analyser .......................................................................................... 29
Figure 14 - Circuit diagram showing parallel branches combined........................................................ 36
Figure 15 - Simulated torque-speed curve for the Toshiba induction motor ....................................... 38
Figure 16 - Simulated torque-speed curve for the Leroy Somer induction motor ............................... 42
Figure 17 - Circuit diagram for a first order low pass RC filter ............................................................. 44
Figure 18 - Schematic for the proposed three phase RC filter ............................................................. 45
Figure 19 - Frequency response of the proposed first-order low pass filter ........................................ 46
Figure 20 - The total reactance from the no load test .......................................................................... 53
4
1 Introduction
1.1 Overview
The aim of this project was to configure the Voltech PM6000 Power Analyser to measure the
voltages, currents and power in two different induction motors under various test conditions. These
measurements were then used to determine the parameters of each motor’s equivalent circuit. The
equivalent circuit is a per-phase representation of a three phase induction motor that can be used to
model a real-world machine.
Parameters that were determined include the stator and rotor impedances and the magnetising
reactance of the motors. Also, the stator copper losses and rotational losses were found. The
resistance RC corresponding to core loss was not considered in the analysis. Core losses include
hysteresis and eddy current losses which, during normal operation, are very small and thus have
been ignored.
The calculated parameter values were used to generate torque speed curves in Matlab. By
measuring the torque of the motors directly and by comparing various points in the stable region of
the motors’ actual torque speed curves with the curves that were generated in Matlab, it is possible
to verify that the calculated circuit parameters are correct.
The Voltech PM6000 is a versatile measurement tool with six configurable channels for AC and DC
analysis. It can be used in a variety of applications ranging from power supplies operating in standby
mode to high frequency power converters. Its accuracy and bandwidth allows it to take
measurements of all power quantities on any piece of electrical equipment (Voltech Instruments Inc.
2009). Another advantage of using this unit is that it eliminates the problem of needing several
multimeters to take readings on multiple phases. This report provides an introduction to the setup
and operation of the Power Analyser, specifically for the types of experiments that have been
undertaken during this project.
In Section 5 a series of wiring configurations have been proposed that future students could use as a
guide for performing each of the three parameter tests, which are discussed in Section 3. In addition,
alternative tests methods recommended by the IEEE Power Engineering Society are given in
Appendix 4. These are provided for information purposes only and were not directly used at any
stage during this project, however they should yield similar results to the methods that have been
used.
For the benefit of the reader some background theory has also been given on the design and
operation of induction motors as well as the other equipment that has been used throughout this
project. Also clauses from the AS/NZ 3000 Wiring Rules have been listed which provide important
information about safety, wiring and operation of electrical systems which should be taken into
consideration when using the equipment.
An analysis of results has been provided which includes the theoretical calculations that were
performed and a discussion of the reliability of the measured data. Some recommendations have
been made to further improve the project in Section 8.
5
1.2 Approach
This project began with preliminary research into the principles of operation of induction motors
and the recommended test procedures. After this, a review of the Australian wiring standards was
conducted and a series of circuit diagrams were developed for each parameter test. Once these
were approved, the relevant equipment was acquired.
Some of the equipment that was used had to be modified. In particular, the motor shafts had to be
fitted with detachable plates that were used to the lock the rotors in position for one of the tests.
Also, some of the leads were not compatible. Terminal boxes were made which replaced the three
phase plugs that were fitted to the motors. This allowed connections to be made to the Power
Analyser. After the modifications were completed, testing could begin.
6
2 Induction Motors
Section 2 summarises the design and operation of induction motors. It also highlights the differences
between squirrel cage and wound rotor designs and compares each rotor type in terms of their
performance characteristics. The final part of this chapter introduces the equivalent circuit which is a
single phase representation of a three phase induction motor which can be used to model a real
world machine if its parameters are known.
2.1 Operation
Induction motors work by supplying a balanced three phase voltage to the stator windings. The
current flowing through the windings produces a magnetic field which rotates at synchronous speed
(Ns) (Indian Institute of Technology 2006).
The flux lines of the magnetic field cut through the rotor, which is stationary at start. An
electromotive force (EMF) is then induced in the rotor at the supply frequency. This causes current
to flow in the rotor creating a magnetic field. The rotor magnetic field interacts with the stator field
to produce a turning force. This torque causes the rotor to turn in the same direction as the rotating
magnetic field and the relative speed between the two decreases (Indian Institute of Technology
2006).
The rotor speed (Nr) will however never reach the speed of the magnetic field (synchronous speed)
because torque which is proportional to Ns - Nr is needed to keep the rotor spinning. At synchronous
speed, the induced EMF and the current in the rotor would reduce to zero and there would be no
torque produced. For this reason, the rotor speed will always be less than Ns. The rotor speed will
vary depending on the size of the mechanical load connected to the shaft and the rotor losses, which
comprises mainly of copper losses (Indian Institute of Technology 2006).
The difference between synchronous speed and the rotor speed is termed as the slip of the motor
and is usually expressed by the following ratio:
𝑠=
𝑁𝑠 −𝑁𝑟
𝑁𝑠
(1)
Where 𝑁𝑠 and 𝑁𝑟 are the synchronous and rotor speeds in rpm
(Indian Institute of Technology 2006)
If the rotor speed is equal to the synchronous speed then the slip is zero. With the rotor at rest the
slip is equal to one. With the torque varied from the no load to the full load value, the slip is
proportional to the torque. At full load the slip will increase with the size of the motor (usually
between 1% and 5%).
As discussed before, the frequency fr of the EMF and also the current induced in the rotor at start-up
are equal to the supply frequency f. The rotor frequency is a function of the slip where:
𝑓𝑟 = 𝑝 × (𝑁𝑠 − 𝑁𝑟 ) = 𝑠 × 𝑓
(2)
where 𝑁𝑠 and 𝑁𝑟 are given in rev/s, and 𝑝 is the number of magnetic poles
7
As the slip is generally small during normal operation fr will only be a small fraction of the 50Hz
supply frequency. When stationary, the Nr is equal to zero and fr will be equal to f (Indian Institute of
Technology 2006).
2.2 Squirrel Cage vs. Wound Rotor Design
Induction motors with squirrel cage rotors are robust in design and are used more commonly in
industry than induction motors with wound rotors. Squirrel cage rotors are made from a laminated
core with parallel slits that support conductors. The conductors are riveted to a short-circuiting ring
at each end to give the appearance of a cage (The Institution of Electrical Engineers 1997). They are
slightly skewed to prevent the rotor from locking and to increase the effective transformation ratio
between the rotor and the stator. Also the increased length of the conductors increases the
resistance of the rotor which can improve the starting torque and the acceleration time (Daware
n.d.).
An advantage of the squirrel cage design is that there are no slip rings so sparking will not occur and
the cost of these motors is relatively low since less conductive material is needed. On the downside
they have a lower starting torque, a high starting current and are quite sensitive to supply voltage
fluctuations (Teja, Squirrel Cage Induction Motors: Advantages, Disadvantages and Applications
2011).
Wound rotor motors have a group of coils forming windings which are carried by the rotor. As a
result they are more expensive to build but have the advantage of being able to develop a higher
starting torque and lesser starting current as compared to a squirrel cage motor. Also the total
resistance of these motors is not constant, but can be varied by adjusting the external resistors
connected to the rotor circuit at start-up. A fair amount of the heat generated during start-up is
dissipated in the resistors (The Institution of Electrical Engineers 1997).
2.3 Equivalent Circuit
For an induction motor to work it relies upon the induction of voltages and currents in the rotor
circuit from the stator circuit. Since the induction of voltages and currents in the rotor circuit is
basically a transformer operation, the equivalent circuit of the motor ends up looking like a
transformer equivalent circuit (Chapman 2003).
The equivalent circuit is a useful tool for determining the response of an induction motor to changes
in load. If the circuit is to be used to model a real machine the parameters of the model need to be
determined. These parameters are derived from test data measured during the three tests described
in Section 3. The equivalent circuit, as shown in Figure 1, is a single phase representation of a three
phase wye connected motor, but can be also be used to represent a delta-connected machine
(Chapman 2003). In order to simplify the analysis of the circuit the impedances on the rotor side are
all referred to the stator side so that the effective turns ratio between the stator and rotor windings
does not need to be taken into consideration. As a result, the calculated impedances are not the
true impedance values of the motor, but can be used throughout this report where rotor parameters
have been specified. Figure 1 has been adapted from the circuit diagram provided in Section 5.9 of
the IEEE Standard 112 (IEEE Power Engineering Society 2004).
8
Figure 1 - Per-phase equivalent circuit
With reference to Figure 1, the quantities that are associated with the equivalent circuit and the
equations which are used in Section 3 are described below:
V1 - input phase voltage (V)
V2 - rotor phase voltage, referred to the stator (V)
I1 - stator current (A)
I2 - rotor current, referred to the stator (A)
IM - magnetizing current (A)
IC - core loss current, referred to the stator (A)
R1 - stator resistance (Ω)
R2 - rotor resistance, referred to the stator (Ω)
RC – core loss resistance, referred to the stator (Ω)
X1 - stator leakage reactance (Ω)
X2 - rotor leakage reactance, referred to the stator (Ω)
XM - magnetizing reactance (Ω)
Z1 - the total stator impedance per phase (Ω)
Z2 - the rotor impedance per phase, referred to the stator (Ω)
s - the slip in p.u.
9
3 Test Procedure
The circuit parameters of a three phase induction motor, as described in the previous section, can be
found by performing a series of tests that are analogous to the short circuit and open circuit tests on
a transformer. These tests must be performed under precisely controlled conditions as the operating
temperature will affect the internal resistance of the motor and the rotor resistance will also vary
with the rotor frequency. If these effects are not taken into account this can lead to misleading
results and a set of parameter values that do not accurately represent the motor circuit under
normal operating conditions. The precise details of how each induction motor test must be
performed to achieve accurate results are described in IEEE Standard 112: Test Procedure for
Polyphase Induction Motors and Generators (see Appendix 4). Although the details of these tests are
quite complex, a simplified approach can be undertaken and is described below.
Note that RC is not included in these tests. RC is added to the equivalent circuit model to account for
hysteresis and eddy current losses in the motor. However, because these losses are a function of the
rotor frequency, the term is only an approximation (Missouri University of Science and Technology
n.d.). In addition, if the supply frequency is 50Hz, the slip of the motor will be small, hence the rotor
frequency will be quite low and core losses will be negligible.
3.1 DC test
The DC test is performed so that the stator per phase resistance R1 can be determined (see Figure 1).
It can be completed using the system proposed in Section 5 (see Figure 10). With the variable DC
source from the Lab-Volt power supply connected to the motor, the supply voltage is gradually
increased from zero to the point where the measured stator current is equal to the motor’s rated
current. The purpose of this test is to heat the windings to the normal operating temperature, since
resistance is a function of temperature. Since the current flowing through the stator is DC, no
voltage will be induced in the rotor circuit, and so no current will flow in the rotor. As a result, if RC is
ignored, the only parameter limiting current flow is the resistance in the stator windings. Since the
DC source is connected to two of the three stator terminals (see Figure 10), the current only flows
through two of the windings, so the total resistance path is equal to 2R1. Hence, R1, the per-phase
stator resistance can be found:
2𝑅1 =
𝑉𝐷𝐶
𝐼𝐷𝐶
𝑉
𝑅1 = 2𝐼𝐷𝐶
𝐷𝐶
(3)
(4)
The downside with this test is that it does not take into account the skin effect, which is a tendency
for AC current to flow mainly around the outer surface of a conductor. This causes the effective
stator resistance to be higher when AC power is supplied, particularly at high frequencies (Kothari
and Nagrath 2003). Another issue is the effect of temperature. Temperature corrections should be
made to correct the calculated resistance value from the test temperature to the temperature the
motor would be at during normal operation, and this is not possible unless a thermal sensor can be
placed inside the motor.
3.2 No Load Test
The no load test provides information about rotational losses and the magnetisation current of the
motor. The motor is connected to a variable AC supply as per Figure 11 (see Section 5) and is allowed
10
to spin freely. The only loads on the motor are the windage and frictional losses, so all the power
consumed by the motor is converted to mechanical losses in the form of heat. The slip of the motor
ends up being very small (perhaps less than 0.001). As a result, R2(1-s)/s, the resistance
corresponding to the power that is converted is much larger than R2, the resistance corresponding to
the rotor copper losses, and much larger than the rotor reactance X2. Hence, X2 and R2 can be
ignored, and the equivalent circuit reduces approximately to Figure 2. Under these conditions, the
impedance of the motor is essentially a series combination of R1, jX1 and jXM as shown in Figure 2
(Chapman 2003).
Figure 2 - Approximation of the equivalent circuit under no load conditions
Under no load conditions the power supplied to the motor is equal to the sum of the motor’s
individual losses. Rotor copper losses are negligible since the rotor current I2 is extremely small, and
can be ignored. Hence, the input power Pin is equal to:
𝑃𝑖𝑛 = 𝑃𝑆𝐶𝐿 + 𝑃𝑐𝑜𝑟𝑒 + 𝑃𝐹&𝑊 + 𝑃𝑚𝑖𝑠𝑐
(5)
where 𝑃𝑆𝐶𝐿 is the stator copper losses, 𝑃𝑐𝑜𝑟𝑒 is the core losses, 𝑃𝐹&𝑊 represents the friction and
windage losses and 𝑃𝑚𝑖𝑠𝑐 is the miscellaneous losses (Chapman 2003). Copper losses occur due to
the current flowing through the stator and rotor windings, core losses occur due to hysteresis and
eddy currents and frictional losses occur primarily in wound rotor motors when the rotor speed
changes. Miscellaneous losses can be caused by a non-uniform current distribution in the motor, and
can also include additional core losses developed due to a distortion in the magnetic flux caused by
the load current, as well as losses due to harmonic fields (Gonen 2011).
The stator copper losses are given by:
𝑃𝑆𝐶𝐿 = 3𝐼12 𝑅1
(6)
The rotational losses are given by:
𝑃𝑟𝑜𝑡 = 𝑃𝑐𝑜𝑟𝑒 + 𝑃𝐹&𝑊 + 𝑃𝑚𝑖𝑠𝑐
(7)
Hence:
11
𝑃𝑖𝑛 = 3𝐼12 𝑅1 + 𝑃𝑟𝑜𝑡
(8)
(Chapman 2003)
The current needed to establish a magnetic field in an induction motor is large because of the air
gap, so the magnetizing reactance XM will be much smaller than the resistances in parallel and the
power factor will also be small. Since the current is lagging, most of the voltage drop will be across
the inductive components of the motor and the equivalent impedance will be approximately equal
to:
|𝑍𝑒𝑞 | = 𝐼
𝑉1
1,𝑛𝑙
≈ 𝑋1 + 𝑋𝑀
(9)
(Chapman 2003)
3.3 Locked Rotor test
Combining the results from the previous two tests with the data from a locked rotor test, shortly to
be explained, allows X1, X2, R2 and XM to be found. The locked rotor test corresponds to a shortcircuit test on a transformer. To perform it the motor is connected as per Figure 12 (see Section 5).
Then, the rotor is locked so that rotation is not possible and an AC voltage is supplied to the motor.
The voltage is increased until the current reaches the full load value. Then, resulting values for
power, phase current and phase voltage are quickly measured using the power analyser, taking care
not to overheat the windings. Generally this is not an issue for small motors such as the ones used in
this project since the current drawn isn’t large enough to cause a significant temperature rise
(Chapman 2003).
Since the rotor is stationary, the slip is equal to one, so the resistance in the rotor becomes close to
R2, which happens to be quite small. Since R2 and X2 are small most of the current will flow through
them rather than the magnetizing reactance XM which is much larger in comparison. Under this
condition the equivalent circuit can be approximated by a series combination of R1, X1, R2 and X2 as
shown in Figure 3 (Chapman 2003).
Figure 3 - Approximation of the equivalent circuit for the locked rotor test
12
When the rotor is stationary the rotor frequency fr is equal to the supply frequency. However, during
normal operation the slip of the motor is quite small. Typically for most motors it is between 2% and
4% (for the Toshiba and Leroy Somer motors their slip at full rated speed is 6% and 8.33%
respectively). Therefore, the resulting rotor frequency is much less than the supply frequency (1 to
3Hz). For this reason it is important to conduct the experiment at a reduced frequency (typically 25%
or less of the rated value) in order to get accurate results, since the effective rotor resistance is a
strong function of fr. This can be achieved using a variable frequency drive (VFD) (Chapman 2003).
This procedure is generally acceptable for motors with a constant rotor resistance (design Classes A
and D), however it could give misleading results when trying to find the resistance of a variableresistance rotor. As such special care should be taken when obtaining measurements from these
tests. After performing the test the machine’s impedance values are calculated as follows (Chapman
2003).
The per-phase input power is given by:
𝑃𝑖𝑛 = 𝑉1 × 𝐼1 cos(𝜃)
(10)
Where 𝑉1 and 𝐼1 are the average phase voltage and current respectively, and 𝜃 is the power (PF)
angle.
Rearranging, the locked rotor power factor is equal to:
𝑃
𝑖𝑛
𝑃𝐹 = 𝑉 ×𝐼
(11)
∴ 𝜃 = 𝑐𝑜𝑠 −1 (𝑃𝐹)
(12)
1
1
The magnitude of the per-phase impedance of the motor during this test is given by:
|𝑍𝐿𝑅 | =
𝑉1
𝐼1
(13)
𝑍𝐿𝑅 consists of both resistive and reactive components which can be found using trigonometry,
where:
𝑍𝐿𝑅 = 𝑅𝐿𝑅 + 𝑗𝑋′𝐿𝑅
(14)
𝑍𝐿𝑅 = |𝑍𝐿𝑅 | × cos(𝜃) + 𝑗|𝑍𝐿𝑅 | × sin(𝜃)
(15)
∴ 𝑅𝐿𝑅 = |𝑍𝐿𝑅 | × cos(𝜃)
(16)
∴ 𝑋′𝐿𝑅 = |𝑍𝐿𝑅 | × sin(𝜃)
(17)
The locked rotor resistance RLR is equal to:
𝑅𝐿𝑅 = 𝑅1 + 𝑅2
(18)
Hence, the rotor resistance can be found as:
𝑅2 = 𝑅𝐿𝑅 − 𝑅1
(19)
13
Where R1 was determined in the DC test.
The locked rotor reactance X’LR at the test frequency ftest is equal to the sum of the rotor and the
stator reactances:
𝑋′𝐿𝑅 = 𝑋′1 + 𝑋′2
(20)
Since the reactance and the frequency are proportional to each other, the total equivalent reactance
at the normal operating frequency frated is equal to:
𝑋𝐿𝑅 =
𝑓𝑟𝑎𝑡𝑒𝑑 ′
𝑋𝐿𝑅
𝑓𝑡𝑒𝑠𝑡
= 𝑋1 + 𝑋2
(21)
In order to separate the contributions of the rotor and stator reactances from each other Table 1 can
be used. This table specifies the proportions between X1 and X2 for different rotor designs which are
defined in NEMA-MG-1, a standard published by the National Electrical Manufacturers Association
(NEMA) in the United States (Chapman 2003).
Table 1 - Rules of thumb for separating the stator and rotor circuit reactances
Rotor Design
Wound Rotor
Design A
Design B
Design C
Design D
X1 and X2 as functions of XLR
X1
X2
0.5 XLR
0.5 XLR
0.5 XLR
0.5 XLR
0.4 XLR
0.6 XLR
0.3 XLR
0.7 XLR
0.5 XLR
0.5 XLR
Note: In clause 5.5.1 of IEEE Standard 112 it is recommended that the machine is run for some time
before taking measurements to ensure the input power to the motor is stable, especially if the
motor has grease lubricated bearings. The reason for this is that the friction losses in the motor will
change and will not stabilise until there is no excess grease on the moving parts. Stability is
considered to have been reached when the input power under no load conditions does not change
by more than 3% between two consecutive readings taken half an hour apart at the same voltage
level (IEEE Power Engineering Society 2004).
14
4 System Components
4.1 PM6000 Power Analyser
The Voltech PM6000 is a versatile measurement tool with six configurable channels for AC and DC
analysis. It can be used in a variety of applications ranging from power supplies operating in standby
mode to high frequency power converters. Its accuracy and bandwidth allows it to take
measurements of all power quantities on any piece of electrical equipment (Voltech Instruments Inc.
2009).
4.1.1 Operation
As specified in Table 3, a maximum voltage of 2000 V peak can be measured, that can be connected
directly into the yellow and black safety sockets at each channel (refer to Figure 4).
With the Voltech shunts fitted currents of up to 30A can be measured. These shunts can be mounted
directly onto the measurement channels without the need for additional wiring as shown in Figure 4.
30A Voltech shunts which plug directly
into the measurement channels
Yellow and black safety sockets which
allow banana plugs to be connected
Figure 4 - Rear view showing connections to Lab-Volt equipment. 30A current shunts are fitted to each channel.
4.1.2 Menu Items
In order to configure the Power Analyser for AC and DC measurements the appropriate settings
must be selected via the men using the front panel display of the unit (see Figure 5). Menu items
are organised as per Table 2 (Voltech Instruments Inc. 2009).
15
Table 2 - Menu and submenu items which can be accessed via the keypad
Input
Setup
Display
System
Menus
Wiring
Range
Coupling
Scaling
Filter
Frequency
Curve
Mode
Integrator
Datalog
Measurement
Format
Graph
Config
Interface
Printing
Data
Trigger
Self Test
Menu
Help
User
Menu 1
Menu 2
Menu 3
4.1.3
Other
Functions
Hold
Reset/Clear
Integ Run
Data Pump
Print
Input
Wiring
The Power Analyser works by assigning channels to groups. For three phase measurements Channel
1, Channel 2 and Channel 3 can be assigned to a single group for precise measurement of each
phase. Using this setting Channel 1 becomes the reference phase for the other two phases. A wiring
configuration is also selected for the system being analysed. Since there is a neutral wire in our
system (see Section 5) the Three Phase, Four Wire mode is selected. For the DC measurement the
Single Phase, Two Wire mode can be selected. Only Channel 1 is required and can be assigned to its
own group if desired (Voltech Instruments Inc. 2009).
Figure 5 - Front view showing digital display with green and red sine waves indicating channel 1 current and voltage
respectively
Range
Range settings are also applied to each group. A range is determined by the highest signal that can
be measured. For instance, with a voltage range of 200V, a maximum voltage of +/- 200V can be
measured. The range selected will depend on the type of shunt fitted. With Voltech shunts
16
connected the Power Analyser will select the correct setting automatically when switched on
(Voltech Instruments Inc. 2009).
Coupling
By default the PM6000 is set to AC + DC coupling, allowing it to measure both AC and DC signals
simultaneously. An AC only mode can be selected but is not necessary for this project since we are
interested in performing both alternating and direct current measurements (Voltech Instruments
Inc. 2009).
Scaling
Scaling is applied to measurements to change the scaled output of transducers so that the true
measured currents are shown on the screen of the PM6000. Since Voltech shunts are being used in
this project a scaling factor of 12.5 is automatically applied to the measured current (Voltech
Instruments Inc. 2009).
Filter
By default a 2MHz filter is applied to each channel in the group which prevents signals with a higher
frequency from being measured. A smaller bandwidth could be selected to help reduce noise in the
measurements. As a guideline the user manual suggests a filter setting of 10 times the frequency of
interest. 2kHz is the minimum setting available and because we are interested primarily in the
fundamental frequency of the currents and voltages that are being measured this is the setting that
was chosen (Voltech Instruments Inc. 2009).
Frequency
For the Power Analyser to accurately measure the RMS current, RMS voltage, power and so forth it
needs to determine the fundamental frequency of the signal being measured. This eliminates the
problem of noise being included in the measurements. By default, ‘Volts’ is the selected frequency
source since the voltage waveform is not usually distorted during normal operation (Voltech
Instruments Inc. 2009).
The ‘Amps’ setting can be chosen if the voltage waveforms are heavily distorted and the current
waveforms are not. This could be the case if a pulse width modulated (PWM) motor drive is used for
speed control due to the harmonic content produced by the drive, particularly at low rpms (Voltech
Instruments Inc. 2009). This was found to be the case in this project when using a variable frequency
drive (VFD) to control the motor under locked rotor conditions.
4.1.4
Setup
Mode
This menu allows the user to select the best operating mode for the waveform being measured. The
default ‘Normal’ mode is suitable for most measurement applications. The Voltech continuously
tries to detect the fundamental frequency of the voltage being supplied to the motor. The ‘PWM
Output’ setting can also be chosen to analyse the output from motor drives when there is a fair
amount of harmonic content. Using this mode, the data is sampled at high speed and the frequency
of the motor is detected every few seconds using the voltage waveform. The analysis of the
harmonics will take longer at lower motor frequencies. The PM6000 will analyse all of the requested
harmonics before detecting the motor frequency. Hence, detection will be less frequent if the
maximum number of harmonics to be analysed is increased. Once completed, the PM6000 will
17
attempt to show the modulated current and voltage waveforms at the motor frequency (Voltech
Instruments Inc. 2009).
Integrator
The integrator feature can be used to determine the characteristics of a machine over time, such as
an appliance which would draw a varying amount of power. This feature is not useful for this project
and will not be needed (Voltech Instruments Inc. 2009).
Datalog
Data logging allows the user to record a set of results to the Power Analyser. 6MB of non-volatile
flash memory is available for this and floppy disks can be inserted for additional storage. The user
should take into consideration the amount of data they wish to store and also the rate at which
measurements are taken (Voltech Instruments Inc. 2009).
4.1.5 Display
Features in the ‘Display’ menu allow the user to display certain information on the screen which by
default isn’t shown, such as peak voltage and current values, and the total harmonic distortion on a
particular signal (Voltech Instruments Inc. 2009).
Using the Math feature measured parameters can also be used and manipulated to create new
measurements. This is achieved by selecting the required measurements and using the ‘Edit
Function’ option to create a new equation using the available operators. For more information on
this feature refer to the user manual (Voltech Instruments Inc. 2009).
4.1.6 Establishing a connection to a Computer
Using the data logging capability measurements can be saved and accessed either using the menu or
by establishing a connection with a computer or a network and downloading the data using Internet
Explorer. An Ethernet connection can also be used for maintenance activities such as firmware
upgrades (Voltech Instruments Inc. 2009).
Connecting directly to a PC as opposed to the local network should avoid conflicts with the IT
department. A crossover cable can be used for making this connection. Steps are given below:
1. The cord should be plugged in to the correct socket and the Power Analyser should then be
turned on.
2. A DOS window must then be opened on the PC.
3. After the DOS prompt appears type ‘ipconfig /release’ and then wait for it to return. Once
the DOS prompt comes back the IP address displayed should be 0.0.0.0.
4. Next, type ‘ipconfig /renew’ and again wait for the DOS prompt to appear.
5. To view the connection simply type ‘ipconfig’ and the computer’s IP address will appear. Add
a value of one to the fourth number of the address unless the last number is 255. If this is
the case then subtract one from the number. This new address will become the IP address of
the Power Analyser.
6. Take note of the subnet mask, which in most cases is 255.255.0.0.
7. Using the Power Analyser’s interface, navigate to the Ethernet menu and select ‘Fix
Settings’.
18
8. After this, enter the ‘Fix Settings’ submenu and set the IP address to the Power Analyser’s
new IP address determined in step 5. Also ensure that the subnet mask is the same as the
computer’s subnet mask (for example 255.255.0.0).
9. After this, leave the menu. If necessary turn off the computer’s firewall to allow file transfer.
10. An Ethernet connection between the PC and the Power Analyser should now be established.
To test this type ‘ping’ followed by the designated IP address at a DOS prompt. You should
get several responses.
11. To open files and directories, simply open an internet browser and type the designated IP
address in the address bar and then press enter.
12. If an Ethernet port was used that is usually used to connect to the local network, the user
should connect to the network, open a new DOS prompt and type ‘ipconfig /renew’. After
this you should be back on the University network.
(Voltech Instruments Inc. 2009)
4.1.7 Specifications
The following tables contain information about the electrical ratings of the Power Analyser. In
particular the maximum voltages and currents that can be measured directly by the unit are given
(Table 3) as well as the voltage, frequency and magnitude of the power that must be supplied to the
unit in order for it to properly function (Table 4). In addition, information is given about the dielectric
strength of the inlets and outlets to the PM6000 (Table 5).
Electrical
Table 3 - Maximum voltage and current that can be measured continuously and over one second (Voltech Instruments
Inc. 2009)
Measurement
Channel
Voltage
Connections
Current
Connections
Max. Voltage
for Continuous
Measurements
(V)
2000
Max. voltage
for 1 Second
Measurements
(V)
4000
Max.
Frequency
(MHz)
2.5
50
10
10
Table 4 - Maximum and minimum ratings for power that can be supplied to PM6000 (Voltech Instruments Inc. 2009)
Line Input
Min
Voltage
90
(VAC)
Frequency 47
Hz
Power
170
(VA)
Max
264
63
170
Table 5 - Dielectric strength of inputs and outputs (Voltech Instruments Inc. 2009)
Dielectric Strength
Mains Supply Inlet
(Live + neutral to
Voltage
2.9kV DC
19
earth)
Voltage
Measurement
2kVpk
Current
Measurement
2kVpk
Isolated supplies
30A Shunt
2kVpk
2kVpk
4.1.7.1 Measurement Accuracy
The user manual lists formulas for calculating the error in each measurement. The relevant formulas
can be found in Section 8.6 of the User Manual (Voltech Instruments Inc. 2009).
4.2 Variable Frequency Drive
This chapter contains information about the design and operation of variable frequency drives
(VFDs) and how they can be used for motor control. Also included are the electrical specifications for
the VFD that has been used in this project during the locked rotor test described in Section 3.3.
4.2.1 Operation
Essentially, a variable frequency drive (VFD) is a motor controller that drives an AC machine by
changing the frequency f of the current that is supplied to the motor (Energy Management
Corporation 2014). The synchronous speed Ns of the machine is directly proportional to f as per the
following equation:
𝑁𝑠 = 120𝑓/𝑝
(22)
Where𝑁𝑠 is in rpm and p is the number of poles in the stator winding.
Also known as frequency inverters, or variable speed drives (VSDs), VFDs generally work by first
rectifying the incoming AC voltage into DC and then generating a series of pulses from the DC
voltage to simulate a sinusoidal waveform at the desired frequency (see Figure 6). The most
common method for doing this is to run a sine wave and a triangle wave through a comparator,
generating a pulse when the value of the triangle wave is less than the value of the sine wave. This is
achieved by using insulated gate bipolar transistors (IGBTs), however silicon controlled rectifiers
(SCRs) can be used as well (Novak 2009).
20
Message Signal
Amplitude
5
0
-5
0
0.1
0.2
0.3
0.4
0.5
0.6
Time
PWM Signal
0
0.1
0.2
0.3
0.4
0.7
0.8
0.9
1
0.7
0.8
0.9
1
Amplitude
2
1
0
-1
-2
0.5
Time
0.6
Figure 6 - Diagram showing triangle and sine waves placed through a comparator to generate the pulse width modulated
output signal
The VFD also increases the output voltage in proportion to the supply frequency in order to maintain
a fixed voltage to frequency (V/f) ratio. It is necessary to do this so that the motor can produce
enough torque to keep running. Voltage control is achieved by varying the duty cycle of the
modulated voltage waveform (Natural Resources Canada 2014).
The frequency conversion process is not 100% efficient as 2% to 3% of the input power is converted
to heat inside the VFD. Furthermore, the process can cause overvoltage spikes and harmonic
distortion in the current (Energy Management Corporation 2014). These distortions are significantly
increased when operating from a single phase supply and particularly so on single wire earth return
systems. Fortunately there are several things that can be done to eliminate this problem. The easiest
method is to place a filter either side of the drive. Another method is to connect capacitors to a
common bus which act as a short circuit, causing the harmonics to travel through the capacitors to
ground. If the harmonics are not removed on the line side of the drive, overheating and crosstalk can
occur, where the distortion in one circuit interferes with other circuitry (Energy Management
Corporation 2014)
Pulse width modulated VFDs are widely used in industry since they have a high input power factor
due to a fixed DC bus voltage, there is no motor cogging (magnetic locking between the stator and
the rotor) and they are generally very efficient and low cost. The other two major types are voltage
source inversion (VSI) drives and current source inversion drives (CSI) which are known to cause
motor cogging below 6Hz (Energy Management Corporation 2014).
21
As shown in Figure 7, a simple topology for a VFD includes a diode bridge converter, a smoothing
capacitor, a filter and an inverter, as well as additional control circuitry for achieving the desired
frequency (Polka 2001).
L
+
+
+
+
PH1
PH2
C
MOTOR
PH3
-
-
-
Input Converter
(Diode Bridge)
DC Bus
(Filter)
Output Converter
(IGBTs)
Figure 7 - Circuit diagram for a PWM VFD
The convertor consists of six diodes connected in a full-wave bridge configuration, allowing current
flow in one direction after the rectification. When phase 1’s voltage is higher than the voltage on
phases 2 and 3, the corresponding diode conducts a current. When phase 2 becomes more positive
than phase 1, then phase 1’s diode does not conduct. This is also the case for the diodes on the
negative side of the bus. This results in a series of pulses as each diode opens and closes (Amick,
Avery and Amer 2010).
In order to smoothen the voltage waveform from the converter so that it is as close as possible to a
DC voltage, a capacitor is placed in parallel with the converter. Typically this reduces the ripple to
less than 3V, but it can be affected by factors such as the voltage level of the AC line feeding into the
drive, any unbalance on the three input phases, filters on the drive and so on (Amick, Avery and
Amer 2010).
The third and final primary section of the main power circuit is the inverter. This section is comprised
of the IGBTs which are triggered to switch on and off in such a way that the output phases are
lagging each other by 120 degrees. The rate at which the transistors are gated or turned on usually
ranges between 2 to 15kHz. Higher carrier frequencies yield smoother current waveforms but also
greater VFD losses (Amick, Avery and Amer 2010).
It should be noted that there is a phase shift between current and voltage waveforms due to the
inductance in the connected motor. Harmonic distortion in the current is reduced using a line
reactor/inductor, which is essentially a conductor coiled around a magnetic core. When current
flows through the core a magnetic field is established and sudden changes in current amplitude or
direction are opposed by the magnetic field which could be caused by the harmonic content. The
22
inductance in the attached system is what causes the current to appear sinusoidal in nature due to
its power filtering characteristics (Amick, Avery and Amer 2010).
Figure 8 shows additional features such as the V/f control circuitry and a speed reference. In most
cases the ‘speed reference’ is just a set point. In more complex situations, the ‘speed reference’
might come from a process controller, such as a tachometer or a PLC (Amick, Avery and Amer 2010).
AC
Line
Diode
Bridge
Rectifier
Filter
Inverter
Motor
Speed
Reference
Voltage & Frequency
Control
Figure 8 - Block diagram for a typical Variable Frequency Drive
4.2.2 Specifications
The motor drive used in this project was developed by SEW Eurodrive and is a 0S model from the
Movitrac 07 series (see Figure 9). 0S indicates the size of this unit in terms of its power rating, and is
one of the smallest available.
Figure 9 - Isometric view of the unit which is rated for 0.37kW AC machines
Table 6 contains information about the operating specifications of the VFD. Most importantly, it
gives the voltage, current and frequency of the power that must be supplied to the drive in order for
23
it to properly function. Also given in this table is the voltage, current and power produced by the
unit.
Table 6 - Electrical and temperature specifications for the Movitrac 07 unit (SEW Eurodrive 2003)
Model
Input
(Single Phase)
Output
(Three Phase)
IP Rating
Temp (°C)
Voltage (V)
Current (A)
Frequency (Hz)
Voltage (V)
Current (A)
Power (kW)
20
10 – 50
MC07A004-2B1-4-00
200 – 240
6.1
50 – 60
0 - Vin
2.5
0.37
4.3 Toshiba Motor
This section contains technical information about the Toshiba motor, in particular, its electrical
specifications and other important design information. Also provided are notes on what the
numbers and letters on the motor’s nameplate actually mean and what these indicate about its
performance characteristics.
4.3.1
Specifications
Nameplate Data.
Table 7 - Nameplate information for the Toshiba motor (Toshiba International Corporation n.d.)
The following information was taken directly from the induction motor itself. Because of the age of
this particular model it was not possible to find further technical details in the catalogue available on
Toshiba’s website.
Rated Power (kW)
Rated Voltage (V)
Rated Current (A)
Power Factor (100% Load)
Frequency
No. of Poles
Stator Connection
Rated Speed (rpm)
0.37kW
415
1.1
0.65
50Hz
4
Wye
1410
Model
Compliance
Design Class
Insulation Class
Frame
IP Rating
Duty Cycle Rating
Mass (kg)
TSH01
AS1359
N
F
D71
56
S1
16
Notes on Specifications
Design Class
The performance characteristics of a motor will depend on the motor windings and the rotor design.
The International Electrotechnical Commission (IEC) and the National Electrical Manufacturers
Association (NEMA) have designated specific designs of general purpose motors using letters. IEC
Design Class N is equivalent to NEMA Design Class B and is the most common industrial motor
design. These motors have normal starting torques and low starting currents. They have adequate
locked rotor torque to start in a number of different industrial applications (Bhatia n.d.).
24
Insulation Class
The Insulation Class is an industry standard that refers to the thermal tolerance of a motor’s
windings. It is based on adding the operational heat and the ambient temperature of the motor
together. Class F indicates the motor has an operating life of approximately 20,000 hours at 155°C
(Bhatia n.d.).
Frame
Most motor dimensions are standardized and are usually associated with a specific number and
letter designation. The letter usually indicates the type of mounting and the number is the height
from the centre of the shaft to the base of the motor. The motor’s dimensions can be found by
looking up the number/letter designation from an IEC/NEMA motor dimensions chart (Pontiac
Electric Motors and Drives n.d.). For example, using the IEC system, D71 indicates a flange mount
with a shaft height of 71mm (Bhatia n.d.).
IEC uses IP Ratings to indicate the level of protection provided by the motor’s enclosure. An IP56
rating indicates complete protection from dust and flooding of water (Bhatia n.d.).
Duty Cycle Rating
The IEC uses eight duty cycle designations to describe the operating conditions of an electrical
motor. S1 refers to ‘Continuous duty’, which means the motor operates at a fixed load, long enough
for it to reach temperature equilibrium (The Engineering Toolbox 2014).
4.4 Leroy Somer Motor
This section contains technical information about the Leroy Somer motor used in this project. In
particular, its electrical specifications and other important design information is given.
4.4.1
Specifications
Table 8 - Nameplate information for the Leroy Somer motor (Leroy Somer n.d.)
From Table’s 7 and 8 we find that the electrical characteristics of both motors are quite similar in
comparison. In particular both have a power and voltage rating of 0.37kW and 415V respectively, a
similar rated current and rated speed, and both feature a wye connected stator.
Rated Power (kW)
Rated Voltage (V)
Rated Current (A)
Power Factor (100% Load)
Frequency
No. of Poles
Stator Connection
Rated Speed (rpm)
0.37
415
1.02
0.75
50Hz
4
Wye
1375
Model
Compliance
Design Class
Insulation Class
IK Rating
IP Rating
Duty Cycle Rating
Mass (kg)
Mot3 AS712-4
AS1359
A
F
08
55
S1
6.4
Notes on Specifications
IK Rating
The IK rating comes from the European standard EN62262. It defines the type of protection that is
provided by enclosures of electrical equipment against dust, moisture, solid objects and other
25
external mechanical impacts. Specifically, an IK rating of 08 indicates the motor enclosure is made of
steel, has a mass of approximately 0.5kg and has undergone a variety of impact tests.
(British Standards Institution 1995).
26
5 System Design
Section 5 contains wiring diagrams for each of the three parameter tests conducted. These wiring
configurations allow any wye or delta connected motor to be attached to the system, provided it
operates within the specified ratings of the other connected equipment. Note that where HI and LO
are written these points correspond to the input and output terminals of each channel on the back
of the Voltech PM6000.
5.1 System Schematics
Figures 10 to 12 indicate where leads are connected between each piece of equipment and Figure
13 provides a close up view of the connections that are made to and from the Power Analyser so
that phase currents, voltages and power drawn by the motor of interest can be measured. Internal
circuitry of the equipment itself has not been provided but can be found in the relevant user
manuals if necessary.
27
DC Analysis
Wye-connected
stator
VoltechPM6000 Power Analyser
DC
CH1
HI
A
+
LO
R1
HI
R1
V
CH1
LO
R1
-
Figure 10 - Wiring Configuration for DC test
Voltech PM6000 Power Analyser
AC
PH1
HI
A
LO
PH1
A
LO
PH2
A
LO
PH3
CH1
PH2
HI
CH2
PH3
HI
MOTOR
CH3
Neutral
PE
HI
V
CH1
LO
HI
V
CH1
LO
HI
V
CH3
LO
LabVolt 3-Phase Power Supply
(0-415V)
Figure 11 - Wiring Configuration for no load test
28
Mains Connection
Power Analyser Connection
Voltech PM6000 Power Analyser
AC
HI
W
Line
L
Earth
PE
HI
V
LO
PH1
A
LO
PH2
A
LO
PH3
CH2
Internal Circuitry
HI
U
MOTOR
CH3
N
Neutral
A
CH1
MOVITRAC 07
PE
PE
HI
PE
+R
HI
V
-R
HI
V
CH1
LO
CH1
LO
V
CH3
LO
Single Phase Power Supply (240V)
Braking Resistor Connection
(Not Used)
Banana plugs are needed for
inputs and outputs of Voltech
Figure 12 - Wiring Configuration for the locked rotor test
CH1
HI
V
CH2
LO
HI
V
CH3
LO
HI
V
LO
HI
A
LO
Voltech Back Panel
HI
A
LO
HI
A
LO
PE
PE
To VFD
To Motor
PE
PE
L1
L1
L1
L1
L2
L2
L2
L2
L3
L3
L3
L3
Terminal Box
Terminal Box
Figure 13 - Connections to Power Analyser
29
5.2 Australian Wiring Standards
When building and testing the system proposed in this report it is important that the equipment and
wiring conforms to the guidelines laid out in AS/NZS 3000 Wiring Rules – 2007, Electrical
Installations. Appropriate safety measures should be in place to protect persons working on or near
the equipment at all times (Standards Australia 2007). The following information is a paraphrased
summary of some of the key wiring and safety information provided in this particular standard,
which can be accessed via the SAI Global Database.
AS/NZS 3000: 1.5.3 Protection against Electric Shock
The system must be provided with protection against electric shock which may arise from touching
parts that become live during fault conditions (indirect contact) or parts that are live during normal
operation (direct contact).
In section 1.5.4.2 of the Wiring Rules it is stated that methods of protection against electric shock
arising from direct contact may include:
-
Insulation, as per Section 1.5.4.3.
Barriers or enclosures, as per Section 1.5.4.4.
Obstacles, as per Section 1.5.4.5.
Placing live parts out of reach, as per Section 1.5.4.6.
Protection against electric shock arising from indirect contact may include:
-
Devices that automatically disconnect the power supply when a fault occurs that is likely to
cause a current flow through a person touching exposed conductive parts
Devices that limit the amount of fault current that can pass through a person to a level that
is safe
(Standards Australia 2007)
AS/NZS 3000: 1.5.6 Residual Current Devices (RCDs)
RCDs are designed to switch off the supply when current leaking to earth is detected at harmful
levels and offer protection against electric shock. Note that by themselves they are not recognized
as an adequate method of protection against live parts but can be used in addition to the methods
listed above. RCDs should be installed in order to protect circuits, power outlets, lighting, hand held
equipment and other electrical installations as specified in AS/NZS 3001, AS/NZS 3002, AS/NZS 3003,
AS/NZS 3004, AS/NZS 3012 and AS/NZS 4249 (Standards Australia 2007).
AS/NZS 3000: 1.5.8 Protection against Thermal Effects
The electrical equipment used must be installed and operated so that the temperature
characteristics of the equipment do not cause damage to the installation or any other installation,
either electrical or otherwise. In particular, equipment should not be operated outside its specified
operating region, unless advised otherwise, to prevent overheating. Where heat is generated during
normal operation, equipment should be adequately ventilated in order to maintain an operating
temperature below the specified or rated limit of the equipment (Standards Australia 2007).
30
AS/NZS 3000: 1.5.9 Protection against Overcurrent
Overcurrent protection must be in place which either disconnects the supply before the overcurrent
reaches a dangerous value, or which limits the maximum overcurrent to a safe value and duration
(Standards Australia 2007).
AS/NZS 3000: 1.5.10 Protection against Earth Faults
Parts of the system intended to carry an earth fault current (such as protective earthing conductors)
must be capable of carrying the current without overheating (Standards Australia 2007).
AS/NZS 3000: 1.5.11 Protection against abnormal voltages
Protection must be provided against harmful voltages which may arise from a fault between live
parts of circuits and so on (Standards Australia 2007).
AS/NZS 3000: 1.5.13 Protection against injury from moving mechanical parts
Protection must be provided against injury from mechanical movement of electrically actuated
equipment (for example, motors should be fully enclosed so that fingers cannot be caught inside the
rotor etc.) (Standards Australia 2007).
AS/NZS 3000: 1.5.14 Protection against external influences
All parts of the system should be sufficiently protected against damage that could arise from
environmental and other external influences that the system could be exposed to during normal
operation (Standards Australia 2007).
AS/NZS 3000: 1.6 Design of an Electrical Installation
Characteristics of the electrical installation shall be determined as per Section 1.6 of AS/NZ 3000
(Standards Australia 2007).
AS/NZS 3000: 1.7 Selection and Installation of Electrical Equipment
Electrical equipment which forms part of the system must be selected and installed to:
-
-
Operate safely during normal operating conditions; and
Not cause a danger from electric shock, physical injury, high temperature or fire in the event
of reasonably expected conditions of abnormal operation, overload, fault or external
influences that may apply in the electrical installation; and
Be installed in accordance with the manufacturer’s instructions
(Standards Australia 2007)
Further information on the General Arrangement of Electrical Equipment, Control and Protection
AS/NZS 3000: 2.2.1.2 Common Neutral
31
Each three phase and single phase part of the system which requires a neutral conductor in order to
operate must have one. A neutral conductor can be used for multiple circuits originating from the
same supply subject to the following conditions:
-
The continuity of the common neutral conductor must not depend on connections at the
terminals of electrical equipment, including control switches.
Sub-circuits that have a common neutral must be controlled and protected by linked
switches or linked circuit breakers.
The neutral conductor must be marked at switchboards to identify the associated active
conductors.
(Standards Australia 2007)
AS/NZS 3000: 2.2.3 Selection and installation of conductors
AS/NZS 3000: 2.2.4.2 Voltage
The voltage rating of electrical equipment must be adequate for the nominal voltage of the system
to which it is connected (Standards Australia 2007).
AS/NZS 3000: 2.2.4.3 Current
Each item of electrical equipment must be selected and installed to be suitable for:
-
The design current, taking into consideration any inductive, capacitive and harmonic effects;
and
The current likely to flow through the system during abnormal conditions for such periods of
time as are determined by the characteristics of the protective devices concerned.
(Standards Australia 2007)
AS/NZS 3000: 2.2.4.4 Frequency
If frequency has an effect on the characteristics of electrical equipment, the rated frequency of
electrical equipment must correspond to the nominal frequency of the power supply to which the
system is connected (Standards Australia 2007).
AS/NZS 3000: 2.2.4.5 Power
Each item of electrical equipment selected on the basis of its power characteristics shall be suitable
for the duty demanded of the electrical equipment (Standards Australia 2007).
AS/NZS 3000: 2.2.4.6 Effects on operator or other equipment
Each item of electrical equipment shall be selected and installed so that, providing it is maintained, it
will not cause harm to an operator or harmful effects to other equipment or impair the supply
during normal service including switching operations (Standards Australia 2007).
32
6 Results
This section discusses the results from the three tests performed on each induction motor as per
Section 3. From this data the motor parameters were determined and then used to generate a
torque speed curve in Matlab, which can then be compared with measured torque values to verify
that the calculated motor parameters are correct.
It should be noted that these results cannot be 100% accurate. Certain factors which could influence
the accuracy of the data can include calibration error of the instruments, in particular the Power
Analyser, and also the internal resistance of the cables was not taken into consideration, although
this was thought to be negligible and thus shouldn’t have a significant impact on the end results.
Something which may have a more noticeable impact on the end results is a temperature increase in
the motor windings, although care was taken to run the motor for as short a time as possible, and to
allow it to cool down to the ambient temperature before performing another test.
6.1 Toshiba Motor
The locked rotor test has been performed at full rated frequency and at a reduced frequency
because of certain issues that arose when the VFD was used. These issues are described in detail
below. All currents and voltages are RMS values unless otherwise specified.
The data in Table 9 is for the locked rotor test performed at the full rated frequency. The measured
values look fairly consistent across all phases. The total harmonic distortion (THD) in the current and
voltage waveforms is well within the 5% limit recommended by IEEE in Section 3.1.2 of Standard
112. The power drawn by the motor is quite low, much lower than the 370W rating, so there is little
chance that the windings would overheat during the experiment.
Table 9 - Data from the locked rotor test performed using the 50Hz Lab-Volt power supply
Locked Rotor Test – Trial 1
Vrms (V)
Arms (A)
Real Power (W)
Complex Power (VA)
Frequency (Hz)
Power Factor
VTHD (%)
ATHD (%)
Ch1
59.709
1.1067
40.298
66.082
49.969
0.6098
1.8770
1.6080
Ch2
59.828
1.1333
41.174
67.802
49.969
0.6073
1.7413
1.4015
Ch3
58.179
1.1240
40.511
65.395
49.969
0.6195
1.6668
1.5921
Average
59.23867
1.121333
40.661
66.42633
49.969
0.6122
1.7617
1.533867
When performing the test at the reduced rotor frequency the amount of reactive power drawn by
the motor is significantly higher than before since the inductive reactance is lower. This is because XL
is proportional to f. In this case, the harmonic distortion on the current waveforms exceeds the
recommended 5% maximum, but the distortion on the voltage waveforms is exceptionally large
(greater than 100%), as shown in Table 10.
Table 10 - Data from the locked rotor test performed at reduced frequency using the VFD
Locked Rotor Test – Trial 2
Vrms (V)
Arms (A)
Ch1
216.84
1.0948
Ch2
216.38
1.0643
Ch3
216.80
1.0794
Average
216.6733
1.0795
33
Real Power (W)
Complex Power (VA)
Frequency (Hz)
Power Factor
VTHD (%)
ATHD (%)
31.317
237.39
4.8228
0.1318
100.18
15.986
29.459
230.29
4.8228
0.1279
105.02
15.988
30.320
234.01
4.8228
0.1295
106.76
17.357
30.36533
233.8967
4.8228
0.129733
103.9867
16.44367
At first glance the large %THD does not make much sense but it is likely that this value is determined
by comparing the voltage and current signals using current as a reference phasor. Since the voltage
is not sinusoidal in nature like the current but instead exhibits square wave properties the Power
Analyser decides that the voltage is highly distorted. Conversely, using the voltage as the reference
phasor VTHD becomes quite small and ATHD exceeds 100%. The results suggest that the quality of the
power coming from the motor drive is quite poor and a filter might be needed to clean up the
waveforms.
Another cause for concern is that the voltages recorded in Table 10 are different from the voltages
that were measured using a UNI-T Multimeter, and yet both the Power Analyser and the multimeter
were measuring the same RMS values. When the output voltage of the VFD was increased to the
maximum possible value using the speed control knob on the unit, the reading given by the
multimeter was 240V (the rated value of the drive) and the reading given by the PM6000 was less
than this. This might suggest the PM6000 has difficulty measuring the PWM signal from the motor
drive because if a sinusoidal power supply is used instead of the VFD the measurements from both
devices match exactly.
In conclusion, the data in Table 10 is probably not reliable. When the motor parameters were
calculated using this data the magnetizing reactance XM was negative. Because of this, and based on
the observations above, it is likely that the voltages measured by the Power Analyser were in error.
Table 11 shows that when the motor was run unloaded the power factor on the first phase was
about 30% lower than the power factor on the other two phases, suggesting that the inductance was
higher on the first phase and that perhaps the rotor is not uniformly wound. If necessary, capacitors
could be used to correct this and improve the overall efficiency of the machine. The only cause for
concern would be if the voltages on each phase were unbalanced which could cause overheating
and affect performance characteristics such as the locked rotor torque.
Table 11 - No load test data
No Load Test
Vrms (V)
Arms (A)
Real Power (W)
Complex Power (VA)
Frequency (Hz)
Power Factor
Channel 1
240.42
0.694
13.648
166.82
50.020
0.0818
Channel 2
241.79
0.689
20.591
166.70
50.020
0.1235
Channel 3
240.22
0.714
18.023
171.58
50.020
0.1050
Average
240.81
0.699
17.42067
168.3667
50.02
0.103433
In Table 12 the readings from Channel 1 and Channel 2 are quite similar. One of the disadvantages of
doing the DC analysis across only two stator terminals is that we ignore the stator resistance on
phase three, so if the test had been done on the third stator terminal as well this would have led to a
34
slightly more accurate approximation of the average per-phase stator resistance. One of the
limitations of the test is that unless we can pull apart the motor and measure the stator test
temperature it is not possible to correct R1 to what it would be during normal operation.
Table 12 - DC test data
DC Test
Vrms (V)
Arms (A)
Real Power (W)
Complex Power (VA)
Frequency (Hz)
Power Factor
Channel 1
15.234
1.1293
16.779
17.218
0.0000
0.9745
Channel 2
15.088
1.1326
16.768
17.104
0.0000
0.9803
Average
15.161
1.13095
16.7735
17.161
0.0000
0.9774
It seems a little odd that the measured power factor is not exactly one, because a DC voltage does
not vary with time, so there can be no phase displacement in the current waveform and therefore
the current could not be lagging the voltage. This suggests that there must still be some AC signal
flowing through the system which is very small and will not have much of an effect on the results.
6.1.1 Calculations
Note that the calculation procedure used below differs from the method presented in Section 3. This
procedure has been used instead of the method proposed in Chapman 2003 because it assumes that
the locked rotor test was performed at 50Hz and not at a reduced operating frequency, although
both approaches yield similar results. The calculations below follow the procedure provided in Chan
and Shi 2011.
DC Test
2𝑅1 =
𝑉𝐷𝐶
𝐼𝐷𝐶
(23)
𝑉
∴ 𝑅1 = 2𝐼𝐷𝐶
𝐷𝐶
15.161
∴ 𝑅1 = 2×1.13095
∴ 𝑅1 = 8.573𝛺
No Load Test
𝑄1 = √(𝑉1 𝐼1 )2 − 𝑃12
(24)
𝑄𝜙 = √(240.81 × 0.699)2 − 17.4212
𝑄𝜙 = 167.422𝑉𝐴𝑟
𝑋𝑛𝑙 =
𝑄1
𝐼12
(25)
35
𝑋𝑛 =
167.422
0.6992
𝑋𝑛 = 342.656𝛺
Because 𝑠 ≈ 0,
𝑋𝑛𝑙 ≈ 𝑋1 + 𝑋𝑀
(26)
Determining Losses
𝑃𝑖𝑛 = 𝑃𝑆𝐶𝐿 + 𝑃𝑐𝑜𝑟𝑒 + 𝑃𝑚𝑖𝑠𝑐
(27)
𝑃𝑖𝑛 = 3𝐼12 𝑅1 + 𝑃𝑟𝑜𝑡
3 × 17.421 = 3 × 0.6992 × 8.573 + 𝑃𝑟𝑜𝑡
52.263 = 12.566 + 𝑃𝑟𝑜𝑡
∴ 𝑃𝑟𝑜𝑡 = 39.697𝑊
Locked Rotor Test Performed at 50Hz
Here two new quantities are introduced which were not mentioned previously in Section 3.3,
namely RX and XX. In Section 3.3, the calculations assume that under locked rotor conditions the
equivalent circuit is essentially a series combination of R1, X1, R2 and X2, and RC and XM are ignored. In
the following calculation procedure XM is taken into consideration and the two parallel branches in
the circuit containing jXM, and R2 + jX2 respectively are combined, producing RX and XX as shown in
Figure 14.
Figure 14 - Circuit diagram showing parallel branches combined to produce a simplified series circuit
𝑄1 = √(𝑉1 𝐼1 )2 − 𝑃12
(28)
𝑄𝜙 = √(59.239 × 1.121)2 − 40.6612
𝑄𝜙 = 52.503𝑉𝐴𝑟
𝑋𝐿𝑅 =
𝑄1
𝐼12
𝑋𝐿𝑅 =
52.503
1.1212
(29)
36
𝑋𝐿𝑅 = 41.780𝛺
For a Class B motor,
𝑋1 ′ = 0.4𝑋𝐿𝑅
(30)
𝑋1 = 0.4 × 41.780
𝑋1 = 16.712𝛺
𝑋2 ′ = 0.6𝑋𝐿𝑅
(31)
𝑋1 = 0.6 × 41.780
𝑋1 = 25.068𝛺
From the no load test,
𝑋𝑛𝑙 = 342.656𝛺
Hence,
𝑋𝑀 = 𝑋𝑛𝑙 − 𝑋1
(32)
𝑋𝑀 = 342.656 − 16.712
𝑋𝑀 = 325.944𝛺
𝑅=
𝑃1
𝐼12
𝑅𝐿𝑅 =
(33)
40.661
1.1212
𝑅𝐿𝑅 = 32.357𝛺
𝑅𝑋 = 𝑅 − 𝑅1
(34)
𝑅2 = 32.357 − 8.573
𝑅2 = 23.784𝛺
(𝑅 +𝑗𝑋 ′)×𝑗𝑋
𝑅𝑋 + 𝑗𝑋𝑋 = (𝑅2 +𝑗𝑋2 ′)×𝑗𝑋𝑀
2
2
𝑀
2
𝑅2 ×𝑗𝑋𝑀
2 +𝑗𝑋2 ′)×𝑗𝑋𝑀
𝑅𝑋 ≈ (𝑅
𝑋2 ′+𝑋𝑀 2
)
𝑋𝑀
𝑅2 = 𝑅𝑋 × (
(35)
(36)
(37)
25.068 + 325.944 2
𝑅2 = 23.784 × (
)
325.944
𝑅2 = 27.582𝛺
37
In Summary, the per phase resistance and reactance in the motor is
𝑋𝑀 = 325.944𝛺
𝑋1 = 16.712𝛺
𝑋2 = 25.068𝛺
𝑅1 = 8.573𝛺
𝑅2 = 27.582𝛺
6.1.2 Torque speed characteristics
Figure 15 was generated using a Matlab script (see Appendix) 1 and is based on the calculated
parameter values. One of the limitations of the program is that it does not take into account the
mechanical losses of the motor. Taking these losses into account the maximum rotor speed would
be marginally lower than 1500rpm (i.e. closer to the value stated on the motor’s nameplate). The
shape of this curve is typical of a motor with a high stator resistance.
Induction Motor Torque-Speed Characteristic
10
9
8
7
ind
6
5
4
3
2
1
0
0
500
1000
1500
nm
Figure 15 - Simulated torque-speed curve for the Toshiba induction motor
6.2 Leroy Somer Motor
Again, a locked rotor test was performed at full rated frequency (see Table 13) and at a reduced
frequency and the same problem arose where the calculated value for XM was negative when values
from Trial 2 (see Table 14) were used. As such, this data in this table is probably not reliable.
Table 13 shows that by using the Lab-Volt equipment to power the motor the harmonic distortions
in the voltage and current waveforms are well below the 5% limit specified by IEEE. There does not
seem to be any anomalies in the data.
38
Table 13 - Data from the locked rotor test performed using the 50Hz Lab-Volt power supply
Locked Rotor Test – Trial 1
Vrms (V)
Arms (A)
Real Power (W)
Complex Power (VA)
Frequency (Hz)
Power Factor
VTHD (%)
ATHD (%)
Channel 1
61.940
1.0422
48.165
64.553
49.982
0.7461
1.7649
0.4901
Channel 2
60.172
1.0018
44.739
60.279
49.982
0.7422
1.7542
0.4725
Channel 3
61.615
1.0231
45.454
63.035
49.982
0.7211
2.0272
0.5522
Average
61.24233
1.022367
46.11933
62.62233
49.982
0.736467
1.848767
0.504933
The data in Table 14 is for a locked rotor test performed at a reduced frequency using the VFD. Again
we find that the power factor decreases and the reactive power drawn by the motor increases
substantially compared to when the 50Hz Lab-Volt supplies is used.
Table 14 - Data from the locked rotor test performed at reduced frequency using the VFD
Locked Rotor Test – Trial 2
Vrms (V)
Arms (A)
Real Power (W)
Complex Power (VA)
Frequency (Hz)
Power Factor
VTHD (%)
ATHD (%)
Channel 1
216.45
1.0945
45.902
236.89
6.5010
0.1937
190.75
0.8773
Channel 2
216.04
1.0934
45.640
236.23
6.5010
0.1932
167.26
0.8875
Channel 3
216.40
1.0922
45.818
236.36
6.5010
0.1938
144.77
0.7962
Average
216.2967
1.093367
45.78667
236.4933
6.501
0.193567
167.5933
0.853667
In Table 15 it can be seen that even when the motor is run unloaded a large amount of current is
drawn. The real power drawn on the first phase (Channel 1) is also less than that of the other two
phases resulting in a slightly smaller power factor on phase one.
Table 15 - No load test data
No Load Test
Vrms (V)
Arms (A)
Real Power (W)
Complex Power (VA)
Frequency (Hz)
Power Factor
Channel 1
240.78
0.899
40.268
216.58
50.000
0.1859
Channel 2
239.56
0.882
43.015
211.28
50.000
0.2036
Channel 3
238.71
0.906
45.256
216.27
50.000
0.2093
Average
239.6833
0.895667
42.84633
214.71
50.000
0.1996
Again, for the Leroy Somer Motor, the DC Test was performed across only two stator terminals,
which would have marginally affected the accuracy of the calculated theoretical stator resistance.
Table 16 - DC test data
DC Test
Vrms (V)
Arms (A)
Channel 1
25.182
1.023
Channel 2
25.214
1.019
Average
25.198
1.021
39
Real Power (W)
Complex Power (VA)
Frequency (Hz)
Power Factor
25.374
25.752
0.000
0.9853
25.421
25.700
0.000
0.9822
25.3975
25.726
0.000
0.98375
6.2.1 Calculations
Again, the calculations are based on the method described in Chan and Shi 2011.
DC Test
𝑉
2𝑅1 = 𝐷𝐶
𝐼𝐷𝐶
(38)
𝑉
∴ 𝑅1 = 2𝐼𝐷𝐶
𝐷𝐶
∴ 𝑅1 =
25.198
2 × 1.021
∴ 𝑅1 = 12.340𝛺
No Load Test
𝑄1 = √(𝑉1 𝐼1 )2 − 𝑃12
(39)
𝑄𝜙 = √(239.683 × 0.896)2 − 42.8462
𝑄𝜙 = 210.438𝑉𝐴𝑟
𝑋𝑛𝑙 =
𝑋𝑛 =
𝑄1
𝐼12
(40)
210.438
0.8962
𝑋𝑛 = 262.125𝛺
Because 𝑠 ≈ 0,
𝑋𝑛𝑙 ≈ 𝑋1 + 𝑋𝑀
(41)
Determining Losses
𝑃𝑖𝑛 = 𝑃𝑆𝐶𝐿 + 𝑃𝑐𝑜𝑟𝑒 + 𝑃𝑚𝑖𝑠𝑐
(42)
𝑃𝑖𝑛 = 3𝐼12 𝑅1 + 𝑃𝑟𝑜𝑡
(43)
3 × 42.846 = 3 × 0.8962 × 12.340
128.538 = 29.720 + 𝑃𝑟𝑜𝑡
∴ 𝑃𝑟𝑜𝑡 = 98.818𝑊
Locked Rotor Test Performed at 50Hz
𝑄𝜙 = √(𝑉1 𝐼1 )2 − 𝑃12
(44)
40
𝑄𝜙 = √(61.2433 × 1.022)2 − 46.1192
𝑄𝜙 = 42.316𝑉𝐴𝑟
𝑋𝐿𝑅 =
𝑄1
𝐼12
𝑋𝐿𝑅 =
42.316
1.0222
(45)
𝑋𝐿𝑅 = 50.514𝛺
For a Class B motor,
𝑋1 ′ = 0.4𝑋𝐿𝑅
(46)
𝑋1 = 0.4 × 50.514
𝑋1 = 20.206𝛺
𝑋2 ′ = 0.6𝑋𝐿𝑅
(47)
𝑋1 = 0.6 × 50.514
𝑋1 = 30.308𝛺
From the no load test,
𝑋𝑛𝑙 = 262.125𝛺
Hence
𝑋𝑀 = 𝑋𝑛𝑙 − 𝑋1
(48)
𝑋𝑀 = 262.125 − 20.206
𝑋𝑀 = 241.919
𝑅=
𝑃1
𝐼12
𝑅𝐿𝑅 =
(49)
46.119
1.0222
𝑅𝐿𝑅 = 44.155𝛺
𝑅𝑋 = 𝑅 − 𝑅1
(50)
𝑅2 = 44.155 − 12.340
𝑅2 = 31.815𝛺
(𝑅 +𝑗𝑋2 ′)×𝑗𝑋𝑀
2 +𝑗𝑋2 ′)×𝑗𝑋𝑀
𝑅𝑋 + 𝑗𝑋𝑋 = (𝑅2
(51)
41
2
𝑅2 ×𝑗𝑋𝑀
2 +𝑗𝑋2 ′)×𝑗𝑋𝑀
𝑅𝑋 ≈ (𝑅
(52)
𝑋2 ′+𝑋𝑀 2
)
𝑋𝑀
𝑅2 = 𝑅𝑋 × (
𝑅2 = 31.815 × (
(53)
30.308 + 241.919 2
)
241.919
𝑅2 = 40.286𝛺
In Summary, the per phase resistance and reactance in the motor is
𝑋𝑀 = 241.919𝛺
𝑋1 = 20.206𝛺
𝑋2 = 30.308𝛺
𝑅1 = 12.340𝛺
𝑅2 = 40.286𝛺
6.2.2 Torque speed characteristics
Figure 16 is indicative of a squirrel cage motor that has a high rotor resistance. The starting torque
and breakdown torque appear to be quite similar at around 7.5Nm.
Induction Motor Torque-Speed Characteristic
8
7
6
ind
5
4
3
2
1
0
0
500
1000
1500
nm
Figure 16 - Simulated torque-speed curve for the Leroy Somer induction motor
42
7 Conclusion
This project involved measuring the input currents and voltages of three phase induction motors
under different operating conditions. The measurements were taken using the Voltech PM6000
Power Analyser which was configured to take readings on all three phases of the motor stator
simultaneously. The data taken from this analysis was used to calculate circuit parameters so that
the motors could be approximated by a per-phase equivalent circuit which further enables their
performance characteristics to be investigated.
A system design was proposed which allows any similar motor to be connected so that its
parameters can also be calculated, providing the system can provide sufficient power to the motor
in question and that it operates within the specified ratings of the connected equipment. Special
care should be taken when analysing motors with a wound rotor design because the impedance of
the rotor can vary depending on its position relative to the stator. This is not the case with squirrel
cage designs.
Most of the data that was gathered during this project was assumed to be reliable because the tests
that were conducted could be replicated easily and with each trial there was minimal variation in the
results. This was not the case when the locked rotor test conducted at a reduced frequency because
of the significant amount of noise present in the power being supplied to the motor.
One of the drawbacks of this investigation is that it did not take into account the effects of
resistance changes due to temperature increases and variations in the impedance due to the skin
effect which means the calculated parameter values may not be a completely accurate
representation of the motors under normal operating conditions. Regardless, the equivalent circuit
is still only an approximation due to various assumptions that are made in the calculation procedure.
The only way to properly verify that the calculations are correct would be through further
investigation and by implementing the suggested recommendations in the following section of this
report entitled Future Work.
43
8 Future Work
It is advised that a permanent setup is built with equipment placed on a rack or housed inside an
insulated box. The VFD and the terminal boxes should be mounted inside the box so that the
proposed system can be easily reconfigured for each of the tests. This setup should be built in
accordance with clauses referred to in Section 5.2 and other relevant guidelines from AS/NZS 3000.
In addition to this the following recommendations have been made.
8.1 Low Pass Filter
A passive RC filter is recommended for removing the harmonic content from the VFD’s output. The
main reason for having this is because, based on the observations in Section 6.1, the Power Analyser
may have trouble taking accurate RMS measurements due to the large amount of distortion in the
voltage waveform coming from the VFD. Noise can also have a negative effect on the performance
of the induction motor by increasing core losses, increasing the skin effect, causing electromagnetic
interference (EMI) and a deviation from the motor’s torque-speed characteristics (Teja, Harmonic
Effects on Induction Motors 2012).
The RC filter works by only allowing currents through that are below a given cut-off frequency fC,
which depends on the size of the capacitor and the resistor that are used in the filter circuit, where:
1
𝑓𝐶 = 2𝜋𝑅𝐶
(54)
At low frequencies, the capacitive reactance XC becomes much larger than the resistance so most of
the current does not flow through the capacitor. XC is inversely proportional to f as per the following
equation:
𝑋𝐶 =
1
2𝜋𝑓𝐶
(55)
R
I
Vin
C
Vout
Figure 17 - Circuit diagram for a first order low pass RC filter
As the frequency is increased XC becomes much smaller than R so most of the current flow is through
the capacitor. Consequently the voltage drop across the output terminals becomes quite low (Storr
2014).
Depending on the values of R and XC there will also be a certain voltage drop across the entire filter.
In order to minimize this voltage drop components must be selected such that the output/input
voltage ratio is close to one, where:
44
𝑉𝑜𝑢𝑡
𝑉𝑖𝑛
=
𝑋𝐶
(56)
√𝑅2 +𝑋𝐶2
(Storr 2014)
For this project a filter that allows anything with a frequency equal to or below the maximum 12.5Hz
needed for the locked rotor test would be desirable since the circuit would not be used for other
tests where the motor is required to operate at the 50Hz line frequency. A cut-off frequency of
12.6Hz could be achieved with 200Ω resistors and 63µH capacitors connected on each phase as per
Figure 18. Using these components there would be a voltage drop of around 28.9% when fsupply is
equal to 12.6Hz, which is quite significant. Using these resistance values the VFD can supply 1.2A of
phase current to the motor at 240V.
PH1
200Ω
63µH
PH2
200Ω
63µH
PH3
200Ω
63µH
Figure 18 - Schematic for the proposed three phase RC filter
A higher order filter could be used instead if a first order RC circuit is not sufficient. One of the
benefits of a higher order filter though is the narrower roll-off region which prevents frequencies
slightly larger than fc from passing through the circuit.
Figure 19 is a bode plot which demonstrates that the proposed filter could potentially allow a fair bit
of noise through because the roll-off region is wide.
45
Figure 19 - Frequency response of the proposed first-order low pass filter
Increasing the cut-off frequency to 15Hz by using a 53µH capacitor instead would reduce the voltage
drop to 23.2%. It should be noted that the cut-off of the filter does not need to match up exactly
with the frequency of interest because at 12.5Hz the supply will likely produce harmonics of that
frequency, and these higher harmonics are the waveforms we are interested in removing.
8.2 Calibration of the Power Analyser
It appears as though the PM6000 has not been calibrated since 2009. It is recommended that the
instrument is recalibrated to ensure any future measurements taken are as accurate as possible.
8.3 Dynamometer
A dynamometer should be used to take torque measurements. This will allow students to compare
the measured torque at various test points with a simulated torque speed curve based on their
calculated motor parameters. If the data points match up well with the simulated curve this should
be a good indication that the calculated parameters are correct. Dynamometers from the Lab-Volt
equipment could be used for this however they are designed to operate together with less powerful
machines and may not be suitable for the motors used in this project. Either they would have to be
removed from the Lab-Volt system or the motors would have to be housed inside the system. The
shaft of each motor would have to be modified so that a belt can be attached and the height of the
dynamometers would need to be adjusted to match up with the shaft height of the motors, which is
not ideal. Hence, a permanent solution should be found.
46
9 Appendices
The following appendices include Matlab scripts for generating the torque speed characteristic curve
of the motors used in this project, the frequency response of an RC filter and also the PWM output
of a VFD. Also included are the alternative calculation methods recommended by IEEE for accurately
determining the equivalent circuit parameters of a polyphase induction motor.
9.1 Appendix 1 - Matlab Program for Torque Speed Characteristic Curve
The following code has been adapted from the Matlab script provided by Chapman in his textbook
Electric Machinery Fundamentals, 4th Edition. (Chapman 2003).
% M-file: torque_speed_curve.m
% M-file create a plot of the torque-speed curve of the
%
induction motor of Example 7-5.
% First, values needed in this program are initialised.
r1 = 12.340;
% Stator resistance
x1 = 20.206;
% Stator reactance
r2 = 40.286;
% Rotor resistance
x2 = 30.308;
% Rotor reactance
xm = 241.919;
% Magnetization branch reactance
v_phase = 415 / sqrt(3);
% Phase voltage
n_sync = 1500;
% Synchronous speed (r/min)
w_sync = 157.08;
% Synchronous speed (rad/s)
% Thevenin voltages and impedances are calculated
v_th = v_phase * ( xm / sqrt(r1^2 + (x1 + xm)^2) );
z_th = ((j*xm) * (r1 + j*x1)) / (r1 + j*(x1 + xm));
r_th = real(z_th);
x_th = imag(z_th);
% Now the torque-speed characteristic for many slips between
% 0 and 1 are calculated. Note that the first slip value
% is set to 0.001 instead of exactly 0 to avoid divide% by-zero problems.
s = (0:1:50) / 50;
% Slip
s(1) = 0.001;
nm = (1 - s) * n_sync;
% Mechanical speed
% The torque for the original rotor resistance is calculated
for ii = 1:51
t_ind1(ii) = (3 * v_th^2 * r2 / s(ii)) / ...
(w_sync * ((r_th + r2/s(ii))^2 + (x_th + x2)^2) );
end
% Plot the torque-speed curve
plot(nm,t_ind1,'Color','k','LineWidth',2.0);
hold on;
xlabel('\itn_{m}','Fontweight','Bold');
ylabel('\tau_{ind}','Fontweight','Bold');
title ('Induction Motor Torque-Speed
Characteristic','Fontweight','Bold');
grid on;
hold off;
47
9.2 Appendix 2 - Matlab Program for Frequency Response of Proposed RC
Filter
%First need to define filter parameters for the single phase
equivalent circuit
R = 200;
C = 6.3*10^-5;
RC = R*C;
fc = 1/(2*pi*RC);
%Creating the transfer function for the Bode plot
num = 1/RC;
den = [1 1/RC];
sys = tf(num, den);
%Generates the curves for Magnitude vs. Frequency and Phase Angle
vs.
%Frequency
bode(sys)
%Converts the x-axis units from rad/s to Hz
[Mag, Phase, W] = bode(sys);
Freq_Hz = W(:)/2/pi;
Mag_dB = 20*log10(Mag(:));
%Creates a label for the data point at the cutt-off frequency
labels = ['fc=', num2str(fc), 'Hz'];
%Adds labels to the first curve
subplot(2,1,1)
semilogx(Freq_Hz, Mag_dB)
title('Bode Diagram')
xlabel('Frequency (Hz)')
ylabel('Magnitude (dB)')
hold on
plot(fc,-3, 'rx');
text(fc,-3, labels, 'VerticalAlignment','top', ...
'HorizontalAlignment','right')
hold off
%Adds labels to the second curve
subplot(2,1,2)
semilogx(Freq_Hz,Phase(:))
xlabel('Frequency (Hz)')
ylabel('Phase (deg)')
hold on
plot(fc,-45, 'rx');
text(fc,-45, labels, 'VerticalAlignment','top', ...
'HorizontalAlignment','right')
hold off
48
9.3 Appendix 3 - Matlab Program for PWM Output of the Variable
Frequency Drive
clc;
clear all;
t = 0:0.000001:1;
fc = 15.5;
%sawtooth frequency
fm = 1;
%reference sine wave frequency
a = 5;
%sawtooth amplitude
b = 4;
%reference sine wave amplitude
c = 1;
%PWM output amplitude
%Defines sine wave and sawtooth signals being compared inside the
%comparator
vc = a.*sawtooth(2*pi*fc*t,0.5);
vm = b.*sin(2*pi*fm*t);
%Creates the pulse width modulated output voltage by generating a
pulse
%when the absolute value of vm is equal or greater than the absolute
value
%of vc.
%The pusle is negative when vc is negative.
n = length(vc);
for i = 1:n
if (vm(i)*vm(i)/(abs(vm(i)))>=vc(i)*vm(i)/(abs(vm(i))))
pwm(i) = c*vm(i)/(abs(vm(i)));
else
pwm(i) = 0;
end
end
%Creates subplot for comparator waveforms
subplot(2,1,1);
plot(t,vm,t,vc);
xlabel('Time');
ylabel('Amplitude');
title('Message Signal');
grid on;
%Creates subplot for PWM waveform
subplot(2,1,2);
plot(t,pwm);
xlabel('Time');
ylabel('Amplitude');
title('PWM Signal');
axis([0 1 -(2*c) 2*c]);
grid on;
49
9.4 Appendix 4 - Test Methods Recommended by IEEE
IEEE recommends a number of different methods for finding the parameters of an induction
machine in Standard 112: Test Procedure for Polyphase Induction Motors and Generators. All of
these methods are similar in nature to the method described in Section 3 and should yield the same,
if not more accurate results. They are summarised below.
9.4.1 The No Load test
The no load test is performed by running the motor at the rated voltage and frequency with no
connected load. It can be used to find individual losses in the machine which can be useful to know
when looking at how well the machine converts electricity into mechanical energy. To do this IEEE
recommends running the test at 125% of the rated voltage down to the point where a further
reduction in voltage increases the current.
For determining windage and frictional losses, the stator I2R losses are subtracted from the total no
load loss (the measured input power) at each test point and the resulting values are graphed against
the voltage, with the curve extending down to zero voltage. The intercept with the zero voltage axis
is the winding and friction loss.
The core loss is obtained by subtracting the friction and windage loss and the stator losses from the
input power. A plot can then be constructed for finding the core loss at any desired voltage.
9.4.2
Method 1
Summary:
The first method involves the no load test described above and a three phase locked rotor test
performed at no more than 25% of the rated frequency that can be supplied to the motor. During
the locked rotor test, several readings of the voltage, the current and the input power are taken on
all phases, at different levels of voltage. The voltage on each phase should be balanced. The stator
winding resistance or temperature is also recorded quickly so that the windings do not overheat. The
temperature can be equalized by taking the higher readings first and then the lower readings (IEEE
Power Engineering Society 2004).
It should be noted that a wound-rotor’s impedance will change with the position of the rotor relative
to the stator. As a result, it is necessary to know the position of the rotor that results in an average
impedance when performing this test. This issue does not apply to squirrel cage motors as their
impedance is always the same regardless of the position of the rotor (IEEE Power Engineering
Society 2004).
After completing the locked rotor test IV and PV curves are plotted and values of voltage and input
power are derived from the curves in order to find the resistance and reactance of the machine at
the desired level of current. These values are calculated using the procedure described below. The
calculations assume a relationship between X1 and X2 based on the rotor design. For example:
𝑋1
𝑋2
= 1.0 for Type A, Type D motors and wound rotor induction motors
𝑋1
𝑋2
= 0.67 for Type B motors
50
𝑋1
𝑋2
= 0.43 for Type C motors
(IEEE Power Engineering Society 2004)
These values can be derived from Table 1.
Calculation Procedure:
Using the test data from the locked rotor test described above, the reactive power QL is determined
as a function of the phase voltage 𝑉1,𝐿 , the phase current 𝐼1,𝐿 and the input power 𝑃𝐿 is given by:
𝑄𝐿 = √(𝑚𝑉1,𝐿 𝐼1,𝐿 )2 − 𝑃𝐿2
(57)
Where 𝑚 is the number of phases.
Then using results gathered from the no load test, the reactive power Q0 is calculated under no load
conditions as a function of the phase voltage 𝑉1,0 , phase current 𝐼1,0 and the input power 𝑃0 using
the following equation:
𝑄0 = √(𝑚𝑉1,0 𝐼1,0 )2 − 𝑃02
(58)
The magnetizing reactance XM and the stator reactance X1 can then be calculated using an iterative
procedure where:
𝑚𝑉02
2
0 −𝑚𝐼1,0 𝑋1
𝑋𝑀 = 𝑄
𝑋1,𝐿 =
× ((1+𝑋
1
1 /𝑋𝑀 )
𝑄𝐿
2 (1+𝑋 /𝑋 +𝑋 /𝑋 )
𝑚𝐼1,𝐿
1 2
1 𝑀
2
)
× (𝑋1 /𝑋2 + 𝑋1 /𝑋𝑀 )
(59)
(60)
Where 𝑋1,𝐿 is the stator reactance at the locked rotor test frequency.
The stator reactance at the rated frequency is given by:
𝑓
𝑋1 = 𝑓 × 𝑋1,𝐿
𝐿
(61)
Where 𝑓 is equal to 50Hz and 𝑓𝐿 is the reduced locked rotor test frequency.
Firstly, 𝑋𝑀 is estimated by assuming values for 𝑋1 /𝑋𝑀 and 𝑋1 .
𝑋1,𝐿 is estimated using the same value of 𝑋1 /𝑋𝑀 . The value for 𝑋1 /𝑋2 is selected based on the motor
design as explained in the previous section.
Using the value obtained for 𝑋1,𝐿 the value for 𝑋1 at the rated frequency is calculated.
Values obtained for X1 and XM are then used to calculate new values for X1 and XM. The process is
repeated until XM and X1 are within 0.1% of their previous iterations. Then, using the selected X1/X2
ratio X2 is calculated at the rated frequency. If convergence is not reached after 10 iterations, it is
likely that the initial guesses for the parameters are not good approximations of the final values and
new values should be chosen.
51
The final stage of this method involves determining the core loss resistance 𝑅𝐶 and the resistance of
the rotor 𝑅2 , referred to the stator side. 𝑅𝐶 is defined in the standard as the inverse of the core loss
conductance 𝐺𝐶 , which is a function of the total core loss Ph (described in Section 5.5.5 of the
standard), the no load phase voltage V1,0 and the X1/XM ratio. It can be calculated based on the
following equation:
𝑃
𝑋
2
𝐺𝐶 = 𝑚𝑉ℎ2 × (1 + 𝑋 1 )
(62)
𝑀
1,0
Hence:
1
𝑅𝐶 = 𝐺
(63)
𝐶
To find 𝑅2 , 𝑅2,𝐿 is first calculated at the locked rotor test frequency:
𝑃
𝑋
2
𝑋
2
2
𝑅2,𝐿 = (𝑚𝐼𝐿2 − 𝑅1,𝐿 ) × (1 + 𝑋 2 ) − (𝑋2 ) × (𝑋1,𝐿
𝐺𝐶 )
1,𝐿
𝑀
1
(64)
𝑅1,𝐿 is equal to half of the line to line stator resistance at the test temperature. 𝑅1,𝐿 and 𝑅2,𝐿 are
then corrected to the required temperature as per Section 5.2.1 of the standard.
(IEEE Power Engineering Society 2004)
9.4.3
Method 2
Summary:
The second method involves performing a no load test and then a locked rotor test at multiple
frequencies. The first one is performed at the rated frequency, the second at 50% rated frequency
and the third one at 25% of the rated frequency. All locked rotor tests are conducted at the rated
current (IEEE Power Engineering Society 2004).
Calculation Procedure:
The same calculation procedure used in Method 1 is used to determine the total leakage reactance
𝑋1,𝐿 + 𝑋2,𝐿 and the rotor resistance 𝑅2,𝐿 , at each test point. Curves of rotor resistance vs. frequency
and total leakage reactance vs. frequency are then plotted in order to determine these resistance
and reactance values at the required reduced frequency. These values are then used to find the
other parameters in the motor’s equivalent circuit, as per Method 1 (IEEE Power Engineering Society
2004).
9.4.4
Method 3
Summary
The third method involves performing an impedance test at a slip speed approximating the desired
reduced rotor frequency. The motor is allowed to run unloaded or with a reduced load and the
voltage is reduced to give the full load slip point (IEEE Power Engineering Society 2004).
Calculation Procedure:
From the reduced voltage slip test the rotor resistance 𝑅2 and the leakage reactance 𝑋2 are
obtained at a reduced frequency. A no load saturation test described in Section 5.5 of the IEEE
Standard is also performed. Using the measurements from this test, the reactance 𝑋 on each phase
52
Total reactance (X) per phase
is determined at each test point and a plot of reactance vs. phase voltage is created (see Figure 20).
The highest point on the curve gives the total no load reactance for each phase, 𝑋1 + 𝑋𝑀 , which is
used in the calculations for the reduced voltage slip test (IEEE Power Engineering Society 2004).
F
D
G
C
E
B
A
Volts per phase
Figure 20 - The total reactance from the no load test (see text for description of labels)
In relation to Figure 20:
A is the rated voltage
B is the voltage measured during the reduced voltage slip test
CDE is the total no load reactance determined from the no load test points
F is the reactance which corresponds to D, the highest point on the curve (CDE). This value is used in
calculations for the reduced voltage slip test as the total reactance 𝑋1 + 𝑋𝑀 .
G is the total reactance 𝑋1 + 𝑋𝑀 which is used for calculating 𝑋𝑀 in the per phase equivalent circuit
after 𝑋1 , 𝑋2 and 𝑅2 are found from the reduced voltage slip test.
(IEEE Power Engineering Society 2004)
Using the data obtained from the reduced voltage slip test, the total impedance per phase 𝑍 can be
determined, and then power factor can be calculated. Using the power factor the phase angle of the
input current can be calculated where:
𝜃1 = −𝑎𝑟𝑐𝑐𝑜𝑠(𝑃𝐹)
(65)
The total apparent reactance per phase 𝑋 and the total apparent resistance per phase 𝑅 can then
calculated since both are a function of the impedance 𝑍 and the input current phase angle.
𝑋 = 𝑍 × 𝑠𝑖𝑛(−𝜃1 )
(66)
𝑅 = 𝑍 × 𝑐𝑜𝑠(−𝜃1 )
(67)
53
The value for 𝑋 calculated is used as an initial estimate for the sum of the rotor and stator
reactances 𝑋1 + 𝑋2 . A value for
𝑋1
𝑋2
is determined based on the motor design. Then, the stator
reactance can then be found as follows:
𝑋1 /𝑋2
)
1+𝑋1 /𝑋2
𝑋1 = 𝑋 (
(68)
Using the value for 𝑋1 + 𝑋𝑀 obtained from Figure 20, the magnetizing reactance 𝑋𝑀 is
approximated by:
𝑋𝑀 = (𝑋1 + 𝑋𝑀 ) − 𝑋1
(69)
Using the reduced voltage slip test data, the induced rotor voltage 𝑉2 and current 𝐼2 referred to the
stator are calculated and 𝑋2 is found. Then:
𝑋 = 𝑋1 + 𝑋2
(70)
Using the new value for 𝑋 and the 𝑋1 /𝑋2 ratio that was previously determined the calculation
process is repeated until 𝑋1 and 𝑋2 are within 0.1% of their previous iterations. Then:
𝑍2 = 𝑉2 /𝐼2
(71)
𝑅2 = 𝑠√𝑍22 − 𝑋22
(72)
Using the value for total no load reactance (𝑋1 + 𝑋𝑀 ) obtained from the no load test point 𝐶, the
magnetizing reactance 𝑋𝑀 is then determined by subtracting 𝑋1 from 𝑋1 + 𝑋𝑀 . The rotor and
stator resistances are corrected to the normal operating temperature (IEEE Power Engineering
Society 2004).
9.4.5 Method 4
If no other method is practical a full load slip test can be used to determine 𝑅2 followed by a no load
and locked rotor test to determine the remaining impedances as per Method 1 (IEEE Power
Engineering Society 2004).
54
10 Bibliography
Amick, Christopher, Paul Avery, and Yaskawa Amer. Machine Design. 1 December 2010.
http://machinedesign.com/motorsdrives/abcs-and-1-2-3s-variable-frequency-drives
(accessed November 2, 2014).
Bhatia, A. Understanding Motor Nameplate Information: NEMA v/s IEC Standards. Fairfax, Virginia,
n.d.
British Standards Institution. Degrees of Protection Provided by Enclosures for Electrical Equipment
Against Mechanical Impacts (IK Code). 15 October 1995.
Chan, Tze Fun, and Keli Shi. “Appendix H Experiment 1: Measuring the Electrical Parameters of
Motor 3.” In Applied Intelligent Control of Induction Motor Drives, by Tze Fun Chan and Keli
Shi, 397-401. John Wiley & Sons Pte Ltd., 2011.
Chapman, Stephen. Electric Machinery Fundamentals. New York: McGraw-Hill, 2003.
Daware, Kiran. Three Phase Induction Motors. n.d. http://www.electricaleasy.com/2014/02/threephase-induction-motor.html (accessed October 17, 2014).
Energy Management Corporation. VFDs.com. 20 March 2014. http://www.vfds.com (accessed
October 11, 2014).
Gonen, Turan. Electrical Machines with MATLAB, Second Edition. London: CRC Press, 2011.
IEEE Power Engineering Society. IEEE Standard Test Procedure for Polyphase Induction Motors and
Generators. New York, 4 November 2004.
Indian Institute of Technology. Lesson 30 - Construction and Operation of Induction Motors.
Kharagpur, 25 August 2006.
Kothari, D.P, and I.J. Nagrath. Modern Power System Analysis. New Dehli: McGraw Hill, 2003.
Leroy Somer. “Nameplate Data for 3 Phase Induction Motor.” n.d.
Missouri University of Science and Technology. “Induction Motor Parameter Measurement.”
Electrical and Computer Engineering. n.d.
http://ece.mst.edu/media/academic/ece/documents/classexp/ee208labs/09__Induction_Motor_Parameter_Measurement.pdf (accessed December 22, 2014).
Natural Resources Canada. Principles of Operation - AC VFD Drives. 6 June 2014.
http://www.nrcan.gc.ca/energy/products/reference/15433 (accessed October 3, 2014).
Novak, Peter. EC&M Electrical Construction and Maintenence. 1 May 2009.
http://ecmweb.com/power-quality/basics-variable-frequency-drives (accessed October 25,
2014).
Polka, Dave. Variable Speed Drives and Controls. 2001.
http://www.joliettech.com/what_is_a_variable_frequency_drive-how_vfd_works.htm
(accessed October 16, 2014).
55
Pontiac Electric Motors and Drives. Metric Dimensions Charts. n.d. http://www.electric-motorworks.com/store/metric-dimensions-charts.php (accessed September 19, 2014).
SEW Eurodrive. Movitrac 07 System Manual. Bruchsal, Germany, February 2003.
Standards Australia. AS/NZS 3000:2007 Wiring Rules. Sydney, 2007.
Storr, Wayne. Passive Low Pass Filter. 2014. http://www.electronics-tutorials.ws/filter/filter_2.html
(accessed November 24, 2014).
Teja, Dharma. Harmonic Effects on Induction Motors. 12 January 2012.
http://electricalquestionsguide.blogspot.com.au/2012/01/harmonics-effect-inductionmotor-impact.html (accessed October 26, 2014).
—. Squirrel Cage Induction Motors: Advantages, Disadvantages and Applications. 15 November
2011. http://electricalquestionsguide.blogspot.com.au/2011/11/squirrel-cage-inductionmotor.html (accessed November 13, 2014).
The Engineering Toolbox. IEC Duty Cycles. 2014. http://www.engineeringtoolbox.com/iec-dutycucles-d_739.html (accessed October 20, 2014).
The Institution of Electrical Engineers. Power System Protection 3: Application. London: The
Institution of Electrical Engineers, 1997.
Toshiba International Corporation. “Nameplate Data for 3 Phase Induction Motor.” n.d.
Voltech Instruments Inc. Voltech PM6000 User Manual Issue 19. Fort Myers, FL., 21 January 2009.
56


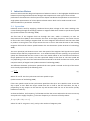

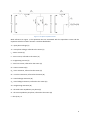
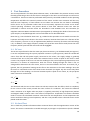
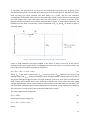
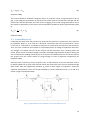
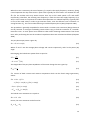
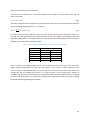
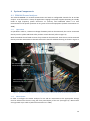
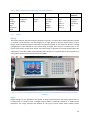


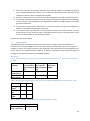

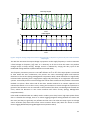
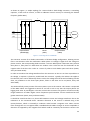
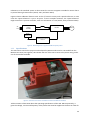
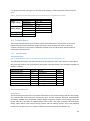


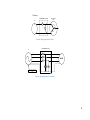


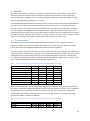
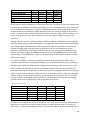

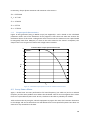
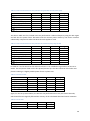
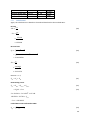
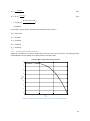

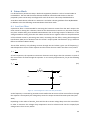
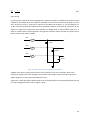
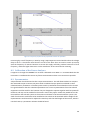


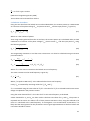
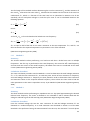
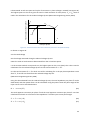
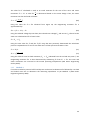
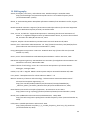
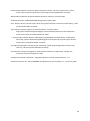


![Independence IDX 4000 IG User Manual [excerpts].](http://vs1.manualzilla.com/store/data/005651088_1-0e858df88d62387a8afea47c031c0cce-150x150.png)