1
SpiraTest®, SpiraPlan®, SpiraTeam® User Manual
Version 4.0
Inflectra Corporation
Date: December 18th, 2012
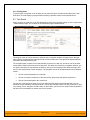
5.10. Automation Host Details
Contents
1. Introduction
2
1.1. Quality Assurance
2
1.2. Project Management
2
2. Functionality Overview
3
2.1. Requirements Management
3
2.2. Test Case Management
3
2.3. Release Planning
4
2.4. Iteration Planning
4
2.5. Incident Tracking
4
2.6. Task Management
91
6. Incident Tracking
94
6.1. Incident List
94
6.2. Incident Details
97
7. Release Management
104
7.1. Release List
104
7.2. Release Details
109
7.3. Iteration Planning
117
7.4. Planning Board
119
7.5. Build Details
120
8. Task Tracking
122
4
8.1. Task List
122
2.7. Projects and Users
5
8.2. Task Details
125
2.8. Document Management
5
9. Resource Tracking
130
2.9. Source Code Tracking
5
9.1 Resource Details
131
2.10. Build Management
5
2.11. Miscellaneous
5
3. User/Project Management
3.1. Login Screen
8
8
3.2. My Page
11
3.3. Global Navigation
17
3.4. Project Home
21
3.5. Project Group Home
29
3.6. My Profile
32
3.7. My Timecard
35
10. Document Management
134
10.1. Document List
134
10.2. Document Details
136
11. Reports Center
139
11.1. Reports Configuration
140
11.2. Requirement Reports
142
11.3. Test Case Reports
144
11.4. Incident Reports
147
11.5. Task Reports
148
11.6. Release Reports
149
36
11.7. Summary Graphs
150
4.1. Requirements List
36
11.8. Snapshot Graphs
155
4.2. Requirement Details
41
11.9. Date-Range Graphs
159
5. Test Case Management
50
4. Requirements Management
12. Source Code
162
5.1. Test Case List
50
12.1. Source Code File List
162
5.2. Test Case Details
56
12.2. Source Code File Details
163
5.3. Test Step Details
68
12.3. Source Code Revision List
164
5.4. Execute Test Case(s)
71
12.4. Source Code Revision Details164
5.5. Test Run List
75
5.6. Test Run Details
76
5.7. Test Set List
80
5.8. Test Set Details
83
5.9. Automation Host List
89
© Copyright 2006-2013, Inflectra Corporation
13. Mobile Access
166
13.1. Executing Test Cases/Sets 167
Page 1 of 3
This document contains Inflectra proprietary information
1. Introduction
SpiraTeam® is an integrated Application
Lifecycle Management (ALM) system
that manages your project's
requirements, releases, test cases,
issues and tasks in one unified
environment:
SpiraTeam® contains all of the features
provided by SpiraTest® - our highly
acclaimed quality assurance system and
SpiraPlan® - our agile-enabled project
management solution. With integrated
customizable dashboards of key project
information, SpiraTeam® allows you to
take control of your entire project
lifecycle and synchronize the hitherto
separate worlds of development and
testing.
This user manual outlines the features
and functionality available in
SpiraTeam®, and demonstrates how to
use the application for managing the
quality assurance and project
management processes on a typical
project.
1.1. Quality Assurance
Quality Assurance is a key component
of the Software Development Life-Cycle
(SDLC), which needs to be integrated
into the planning and management of a
program or project from its inception.
Too often though, QA is implemented as
Quality Control - whereby testing that
the required functionality works as
expected, is performed at the end, when
it is most costly to make corrections and
changes.
To manage QA across a project from
day one, it is imperative that the original
requirements are documented together
with the use-cases that validate the
desired functionality. These use-cases
then form the basis of the test scripts
that can be executed to validate that the
functionality has been correctly built,
and that the requirements have been
© Copyright 2006-2013, Inflectra Corporation
satisfied. During the execution of these test
scripts, failures may occur, which are recorded
as incidents - either to be fixed or documented
depending on the severity.
Typically, these activities require people to use
at least three different types of software:
Requirements Management
Test Script Management
Defect / Issue / Bug Tracking
However, this stove-piped approach has many
limitations and drawbacks, most importantly the
fact that there is no traceability between the
different artifacts. How can the project manager
know that all the requirements have been
tested? Conversely, how can the developer
know which test script was responsible for a
recorded bug – needed to accurately reproduce
the issue?
1.2. Project Management
As described in the Agile Manifesto, traditional
waterfall software methodologies and lifecycles
have failed to delivery projects on-time and onbudget. In addition, many systems built this way
will fail to provide the expected business value
as there is no ability to quickly refine the
requirements as the project progresses.
Consequently software development has been
transformed with these new ideas and concepts,
with new methodologies such as Extreme
Programming (XP), Scrum, Kanban, DSDM and
AUP becoming common. However the traditional
tools of project management - requirements
specifications, high level project plans, GANTT
charts, white-board schedules and top-down
task management - are too cumbersome and
not well suited.
SpiraTeam® provides a complete Agile Project
Management System in one package, that can
manages your project's requirements, releases,
iterations, tasks and issues in one environment,
fully synchronized.
Page 2 of 3
This document contains Inflectra proprietary information
2. Functionality Overview
This section outlines the functionality provided by SpiraTeam® in the areas of requirements management,
test case management, release planning, iteration planning, incident tracking, task management and
project / user management.
2.1. Requirements Management
SpiraTeam® provides the ability to create, edit and delete project scope / requirements in a hierarchical
organization that resembles a typical scope matrix. Each requirement is associated with a particular
importance level (ranging from critical to low) and a status identifier that designates where the
requirement is in the development lifecycle (requested, planned, in-progress and completed). In addition,
each requirement is mapped to one or more test cases that can be used to validate that the functionality
works as expected. This mapping is called the “Requirement Test Coverage”, since the test cases “cover”
the requirement so that if all the tests can be executed successfully, then the requirement is validated.
At the same time, from a development perspective, the team begins initial estimation of the lowest-level
requirements in the requirements matrix to determine the complexity and associated resourcing. Once the
high-level release schedule has been determined, the requirements can then be prioritized and scheduled
against the appropriate release according to their business priority.
Once the release is underway, the requirements are further decomposed into their constituent low-level
project tasks that can be assigned to the project team. The system will track the progress and revised
estimates for the tasks and display them against the requirements so that risks to the schedule can be
quickly determined.
2.2. Test Case Management
SpiraTeam® provides the ability to create, edit and delete project test cases that are stored in a
hierarchical folder structure that resembles Windows Explorer ®. Each test case consists of a set of test
steps that represent the individual actions a user must take to complete the test. These test steps also
contain a description of the expected result and any sample data elements that the tester should use
when performing the action. When a user executes a test case, the results are stored in a test run that
contains the success/failure status of each test step as well as the actual observed result that the tester
experienced.
In addition each test case is mapped to one or more requirements that the test is effectively validating,
providing the test coverage for the requirement. During the execution of the test case, each failure can be
optionally used to record a new incident, which can then be managed in the incident tracking module (see
below). This provides complete traceability from a recorded incident to the underlying requirement that
was not satisfied.
To streamline the assignment and tracking of multiple test cases, SpiraTeam® allows users to select
groups of test cases and arrange them into test sets. Each test set can contain test cases from a variety
of different folders and can be associated with a specific release of the system being tested.
2.2.1. Test Automation
As well as being able to store and manage manual test cases, SpiraTeam® can be used to manage the
scheduling and execution of automated test scripts for a variety of third-party test automation engines.
This allows you to centrally plan your automated testing and monitor the results of automated unit,
functional and load testing remotely. For example, you could schedule a set of automated functional tests
to run on five different machines (each with a different browser/OS combination) at 2:00 AM and have the
results be ready for the next morning.
© Copyright 2006-2013, Inflectra Corporation
Page 3 of 3
This document contains Inflectra proprietary information
2.3. Release Planning
SpiraTeam® provides the ability to track different versions / releases of the application being tested. Each
project in the system can be decomposed into an unlimited number of specific project releases, denoted
by name and version number. Requirements and Test Cases developed during the design phase can
then be assigned to these different releases. When a tester executes a series of test cases, they are able
to choose the version of the project being tested and the resulting test run information is then associated
with that release.
From a project planning perspective, the releases are the major milestones in the project, which are
further sub-divided into iterations which are separate mini-projects with associated project scope and
tasks. The project’s requirements are scheduled at a high-level against the releases and the detailed
tasks are scheduled against specific iteration within the release.
In addition, all incidents raised during the testing process are associated with this release, allowing the
development team to easily determine which version of the project is affected. Finally as the incidents are
resolved and verified during the testing phase, the appropriate release can be selected to indicate which
release the incident was resolved and/or verified in.
2.4. Iteration Planning
As described in section 2.3, in addition to high-level project releases, SpiraTeam® can also track the
individual iterations that comprise a release, giving the project manager the option to manage agile
methodology projects within the SpiraTeam® environment. Unlike the release planning stage, where
high-level requirements are estimated and scheduled, the iteration planning phase involves assigning
each of the requirements, incidents and tasks in the project backlog against a specific iteration until the
available effort in the iteration has been completely allocated.
When you first create iterations, you specify the start and end-dates together with the notional number of
project resources assigned to the iteration and any non-working days. SpiraTeam® uses this information
to calculate the planned effort available to the iteration, from which it will subtract the estimated task and
incident effort values to determine how much effort is available to schedule.
2.5. Incident Tracking
SpiraTeam® provides the ability to create, edit, assign, track, manage and close incidents that are raised
during the testing of the software system under development. These incidents can be categorized into
bugs, enhancements, issues, training items, limitations, change requests, and risks, and each type has its
own specific workflow and business rules. Typically each incident is raised initially as a ‘New’ item of type
‘Incident’. Following the review by the project manager and customer, they are changed to one of the
other specific types, given a priority (critical, high, medium or low), and status changed to ‘Open’. Once it
is assigned to a developer for fixing, it is changed to status ‘Assigned’.
The developer now works to correct the incident, after which time its status changes to ‘Fixed’ or ‘Not
Reproducible’ depending on the actions taken (or not taken). Finally the project manager and customer
verify that it has indeed been fixed, and the status is changed to ‘Closed’. SpiraTeam® provides robust
sorting and filtering of all the incidents in the system, as well as the ability to view the incidents associated
with particular test cases and test runs, enabling drill-down from the requirements coverage display, right
through to the open incidents that are affecting the requirement in question.
2.6. Task Management
As described above, in addition to storing the requirements for a project, SpiraTeam® includes the
capability of drilling each lowest-level requirement down further into a series of work items called ‘Tasks’.
These tasks are the discrete activities that each member of the development team would need to carry
© Copyright 2006-2013, Inflectra Corporation
Page 4 of 3
This document contains Inflectra proprietary information
out for the requirement to be fulfilled. Each task can be assigned to an individual user as well as
associated with a particular release or iteration. The system can then be used by the project manager to
track the completion of the different tasks to determine if the project is on schedule.
2.7. Projects and Users
SpiraTeam® supports the management of an unlimited number of users and projects, which can be
administered through the same web interface as the rest of the application. All artifacts (requirements,
tests and incidents) are associated with a particular project, and each user of the system can be given a
specific role for the particular project. So, a power user of one software project may be merely an
observer of another. That way, a central set of users can be managed across the enterprise, whilst
devolving project-level administration to the manager of the project. In addition to these administration
functions, each user profile and project has its own personalized dashboard view of all the pertinent and
relevant information. This feature reduces the information overload associated with managing such a rich
source of project information, and allows a single user or project snapshot to be viewable at all times for
rapid decision-making.
2.8. Document Management
SpiraTeam® includes an integrated document management collaboration system that can be used to
upload, manage and share documents between the different members of the project. This module
includes support for uploading files and URLs, versioning of documents, the ability to organize into folders
and categorize and search using meta-tags.
2.9. Source Code Tracking
SpiraPlan® and SpiraTeam® provide the ability to browse your source code repository from within the
main web application. This is an excellent way for managers and casual users of the project to browse
the files and revisions of the software code without needing to install the version control software on their
own workstations. In addition for all users, the ability to link source code revisions with SpiraTeam®
artifacts provides traceability from requirements, incidents and tasks to the code changes that were made
to implement the required feature or fix the identified defect. Should a defect resurface later, you can view
the associated source code revisions to determine which changes were made and did they truly correct
the defect.
2.10. Build Management
SpiraTeam® includes the ability to integrate with a variety of continuous integration / automated build
servers so that the results of automated builds can be displayed in SpiraTeam linked to the associated
release or iteration. In addition, the results of automated tests and source code operations can be linked
to the build events, providing traceability from a specific build to the bugs that were fixed, tests that were
run and source code files that were modified.
2.11. Miscellaneous
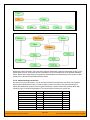
2.11.1. Artifact Relationships
The sections above have outlined the different features and functions available in the system, and have
described the various artifacts managed in the system (e.g. projects, users, requirements, tests, etc.). To
aid in understanding how the information is related, the following diagrams illustrates the relationships
between the different artifacts and entities:
© Copyright 2006-2013, Inflectra Corporation
Page 5 of 3
This document contains Inflectra proprietary information
Figure 1: The main entities that comprise a SpiraTest project.
Figure 2: The relationships between the various SpiraTest entities
With these overall concepts in mind, the rest of this help manual will outline the functionality in each of the
SpiraTeam® screens, and provide specific information on how to manage each of the artifacts illustrated
above. Note that this manual does not explain the Administration-level functionality of the system; for that,
please refer to the SpiraTeam® Administration Guide.
2.11.2. Artifact Naming Conventions
On various screens in the system, you will see lists of artifacts (requirements, test cases, etc.) together
with a unique identification number. In order to make it easier to recognize at a glance which type of
artifact the identification number refers to, SpiraTeam® uses a system of two-letter prefixes which help
identify the type of artifact being displayed. The current prefixes used by the system are:
Artifact
Project
User
Requirement
Release
Test Case
Test Step
Test Run
Test Run Step
© Copyright 2006-2013, Inflectra Corporation
Prefix
PR
US
RQ
RL
TC
TS
TR
RS
Artifact
Project Group
Incident Type
Incident Priority
Incident Severity
Workflow
Workflow Transition
Custom Property Values
Project Role
Page 6 of 3
Prefix
PG
IT
IP
IV
WK
WT
PV
RX
This document contains Inflectra proprietary information
Incident
Incident Status
Custom List
Document Type
Automation Host
IN
IS
CL
DT
AH
Task
Test Set
Document
Document Folder
Build
TK
TX
DC
DF
BL
In addition, certain artifacts in the system are displayed with an icon that helps distinguish them from each
other, and provides additional context on the state of the artifact:
Icon
Artifact Description
Summary Requirement
Detailed Requirement
Test Folder
Test Case with Test Steps
Test Case without Test Steps
Test Set
Test Run
Test Step
Linked Test Case
Release
Iteration / Sprint
Task
Incident
Source Code Revision
Project Resource
Test Automation Host
Build
Artifact has an Attachment
© Copyright 2006-2013, Inflectra Corporation
Page 7 of 3
This document contains Inflectra proprietary information
3. User/Project Management
This section outlines how you can log into SpiraTeam®, view your personalized home-page that lists the
key tasks that you need to focus on, and drill-down into each of your assigned projects in a single
dashboard view. In addition to your personal homepage, each of your projects has its own dashboard that
depicts the overall project health and status in a single comprehensive view.
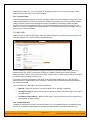
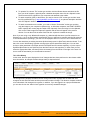
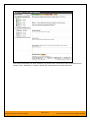
3.1. Login Screen
Upon entering the SpiraTeam® URL provided by your system administrator into your browser, you will
see the following login screen:
You need to enter your given user-name and password into the system in the appropriate boxes then
click the <Log In> button to gain access to the application. Normally you only remain logged in to the
application whilst in active use, and you will be asked to log-in again after either closing the browser or 20
minutes of inactivity. To prevent this, and stay logged-in to SpiraTeam® regardless of browser window
closing or inactivity, select the “Keep me logged in” check-box before clicking the <Log In> button. Note
that this setting is specific to each individual computer you are logging-in from, and that it will be reset
when you explicitly log-out with the log-out link (described in more detail in section 3.3).
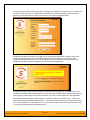
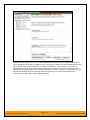
If for any reason you are unable to login with the provided username/password combination, and error
message will be displayed. If you cannot remember the correct log-in information, click on the “Forgot
your password” link and your password will be emailed to the email address currently on file. The reset
password screen is illustrated below:
© Copyright 2006-2013, Inflectra Corporation
Page 8 of 3
This document contains Inflectra proprietary information
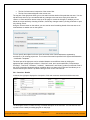
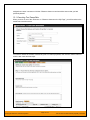
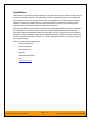
If you don’t have a SpiraTeam® account setup, clicking on the “Register for an account?” link will take you
to a form that you need to fill-in, which will be forwarded to the system administrator, who will need to
approve your account before it is active in the system. This screen is illustrated below:
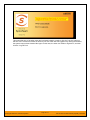
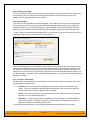
In addition, the system will prevent you logging on to the system with the same username at the same
time on multiple computers. This is to avoid the system getting confused by a user trying to make
contradictory actions at the same time. If for any reason you do try and log in to the system when you
already have an active session in progress, you will see the following screen:
You have two choices: you can either click the “Log Out” link and try logging in as a different user, or if
you want to log-off any other active sessions (e.g. you closed the browser and the session is still listed as
active), simply click the “Sign Off The Other Locations” link, and you will be logged in to the application.
Since SpiraTeam® is licensed to organizations for a specific number of concurrent users – unless they
have purchased an unlimited Enterprise license – only a fixed number of users may be active at the same
time. So, for example if an organization has a five (5) concurrent user license and a sixth user tries to login, they will be presented with the following screen:
© Copyright 2006-2013, Inflectra Corporation
Page 9 of 3
This document contains Inflectra proprietary information
This means that one of the other users who is already logged-in, needs to click the “Log Out” button so
that one of the concurrent licenses is freed for your use. If the user has logged out by closing the browser,
the system may not have detected the logout. In this case, the other user needs to log back in, and then
click the “Log Out” link.
© Copyright 2006-2013, Inflectra Corporation
Page 10 of 3
This document contains Inflectra proprietary information
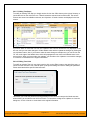
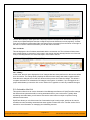
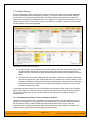
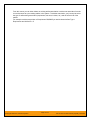
3.2. My Page
Once you have successfully logged in, you will initially be taken to your personalized home page called
“My Page”:
Note that once you have successfully logged-in and chosen a project, SpiraTeam® remembers this
selection, and on subsequent log-ins will automatically select that project, and highlight it for you in the
“My Projects” list (see 3.2.1 below).
Your homepage contains all the information relevant to you consolidated onto a single page for you to
take immediate action. By default the page lists the information for all projects that you are a member of.
However, you can choose to filter by the current project, to get a more focused list.
Next to some of the widgets is an RSS icon ( ), this allows you to subscribe to the information as a
Really Simple Syndication (RSS) newsfeed. This can be useful if you want to be able to be notified about
recently assigned items without having to setup email notifications or being logged into SpiraTeam
continuously. If you don’t see an RSS icon next to the widgets on your My Page it means that you have
not enabled RSS newsfeeds in your profile. For more details on configuring your RSS preferences,
please refer to section 3.6 (My Profile).
© Copyright 2006-2013, Inflectra Corporation
Page 11 of 3
This document contains Inflectra proprietary information
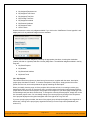
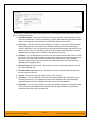
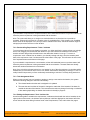
Initially the page is loaded in ‘view mode’ which means that the various ‘widgets’ on the page are
displayed with minimum visual clutter (no toolbars or control icons) that makes it easy to scan the items
on the page and see what work has been assigned. To switch the page to ‘edit mode’, click on “Modify
Layout/Settings” hyperlink:
In this mode, each of the ‘widgets’ displayed on the page can be minimized by clicking on the arrow icon
( ) in the top-left of the window, or closed by clicking-on the cross icon ( ) in the top-right of the window.
This allows you to customize your page to reflect the types of information that are relevant. If you have
closed a widget that you subsequently decide you want to reopen, you can add them back to the page
display by clicking the “Add Items” hyperlink at the top of the page. In addition, the various widgets have a
“settings” icon ( ) that allows you to customize how that widget appears. The settings are specific to
each widget and in general allow you to specify how many rows of data are displayed and what columns
are displayed.
You can move and reposition the various widgets on the dashboard by clicking the mouse on the title bar
of the widget you want to move and dragging it to the desired location. This change will be remembered
when you next login to the system. Once you have the dashboard configured the way you like it, you can
click “Return to Normal View” to switch back to ‘view mode’.
When you load your ‘My Page’ for the first time it will consists of the following main elements:
My Projects
My Saved Searches
© Copyright 2006-2013, Inflectra Corporation
Page 12 of 3
This document contains Inflectra proprietary information
My Assigned Requirements
My Assigned Test Cases
My Assigned Test Sets
My Pending Test Runs
My Assigned Incidents
My Detected Incidents
My Assigned Tasks
Quick Launch
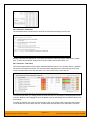
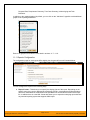
However these are not the only widgets available. If you click on the “Add/Remove” items hyperlink it will
display the list of any additional widgets that are available:
You can add the additional widgets by selecting the appropriate checkbox, choosing the destination
location (left side vs. right side) and then click the [Add] button. The additional widgets available in the My
Page are:
My Saved Reports
My Weather
My Subscribed Artifacts
My News Feeds
3.2.1. My Projects
This section lists all the projects you have been given access to, together with the name, description,
project group and date of creation. To view the description of the project, simply position the mouse
pointer over the link, and a tooltip window will popup containing the description.
When you initially view the page, all of the projects will be shown as links, in normal type, with a gray
background. When you click on a project to view, you will be taken to that project’s home-page, and that
project will be set as the current project. That project will now appear in your home-page in bold-type with
a white background (see above screen-shot). To change the currently selected project, simply click on the
link of another project name. You can always change your current project by clicking on the drop-downlist of projects displayed on the global navigation bar to the right of the “Log Out” link.
If you are a project group member, the name of the project group will also be displayed as a hyperlink. In
which case, clicking on the project group hyperlink will take you to the Project Group dashboard (see
section 3.5).
© Copyright 2006-2013, Inflectra Corporation
Page 13 of 3
This document contains Inflectra proprietary information
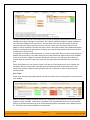
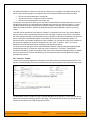
3.2.2. My Saved Searches
This section lists any filters/searches you have saved from the various artifact list screens throughout the
application. This allows you to store specific combinations of searches that you need to perform on a
regular basis (e.g. display all newly logged incidents, display all requirements that are completed but have
no test coverage).
The name of the saved search is displayed along with an icon that depicts which artifact it’s for and the
project it refers to. Clicking on the name of the saved search will take you to the appropriate screen in the
project and set the search parameters accordingly. Clicking the “Delete” link next to the saved search will
delete it. Clicking on the orange RSS icon will allow you to subscribe to the specific search so that it will
be displayed in your RSS newsreader. This allows you to setup customized lists of information that can
be displayed outside of SpiraTeam.
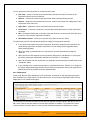
3.2.3. My Assigned Requirements
This section lists all the requirements you have been made owner of, across all the different projects you
are a member of. This typically means that the project manager has assigned you to be responsible for
either developing the supporting test cases or decomposing the requirement into its detailed work
breakdown structure of project tasks. The requirement name is displayed, along with its status
(requested, accepted, in-progress, etc.) and its importance.
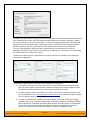
3.2.4. My Assigned Test Cases
This section lists all the test cases you have been made owner of, across all the different projects you are
a member of. This typically means that the project manager has assigned you to be responsible for
executing the assigned test scripts. To aid in this process, the script name is displayed, along with its last
execution status (failed, passed or not-run) and date of last execution. This enables you to see how
recently the tests have been run, and whether they need to be re-run.
If you click on the test-name hyperlink, you will be taken to the details page for this test-case (see section
5.2) and the project that the test-case belongs to will be made your current project. If you click on the
“>Execute” link listed below it will actually launch the test-case in the test-case execution module (see
section 5.4) so that you can easily retest failed cases.
3.2.5. My Assigned Test Sets
This section lists all the test sets (groups of test cases) you have been made owner of, across all the
different projects you are a member of. This typically means that the project manager has assigned you to
be responsible for executing the test cases contained within the test set against a specified release of the
system under test. To aid in this process, the test set name is displayed, along with its status, the project
it belongs to, the number of remaining test cases to be executed, and the date by which all the tests need
to have been run.
If you click on the test-set name hyperlink, you will be taken to the details page for this test-set (see
section 5.6) and the project that the test-set belongs to will be made your current project. If you click on
the “>Execute” link listed below it will actually launch the test-cases contained within the test-set in the
test-case execution module (see section 5.4) so that you can easily carry out your assigned testing task.
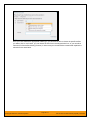
3.2.6. My Pending Test Runs
This section lists any test runs that you started executing in the test case module but haven’t yet
completed. Once a test case or test set is executed, a pending test run entry is stored in the system so
that you can continue execution at a later date. Any pending test run can be either deleted or resumed by
clicking on the appropriate link.
© Copyright 2006-2013, Inflectra Corporation
Page 14 of 3
This document contains Inflectra proprietary information
3.2.7. My Assigned Tasks
This section lists all the project tasks that you have been made the owner of across all the different
projects you are a member of. This typically means that the manager of the project in question has
assigned development tasks to you that need to be completed so that a release can be completed and/or
a requirement can be fulfilled. The tasks are listed in ascending date order so that the items with the
oldest due-dates are displayed first. In addition, each task is displayed with a progress indicator that
graphically illustrates its completion against schedule. See section 8 – task management for details of the
different progress indicators.
Clicking on the task name hyperlink will take you to the task details page. This page will describe the task
in more detail, illustrate which requirement and release it is associated with, and also allow you to view
the change log of actions that have been performed on it.
3.2.8. My Assigned Incidents
This section lists all the open incidents you are the owner of, across all the different projects you are a
member of. This typically means that the project manager has assigned you to be responsible for
resolving the incident. In the case of a bug, this can mean actually fixing the problem, whereas for other
incident types (e.g. training item) it may mean simply documenting a workaround. In either event, this
section highlights the open incidents you need to manage, ranked by importance/priority and categorized
by type, with the open date displayed to give you a sense of the age of the incident.
Clicking on the incident name hyperlink takes you to the incident details page (see section 6.2) that
describes the incident in more detail, and allows you to add new information or change its status to
indicate actions taken. In addition, if you position the mouse pointer over the name of the incident, a more
detailed description is displayed as a “tooltip”.
3.2.9. My Detected Incidents
This section lists all the open incidents that you have detected, across all the different projects you are a
member of. These incidents are not necessarily ones that you need to take an active role in resolving, but
since you were the originator – either by executing a test case or just logging a standalone incident – you
can watch them to make sure that they are resolved in a timely manner.
Clicking on the incident name hyperlink takes you to the incident details page (see section 6.2) that
describes the incident in more detail, and allows you to add new information or change its status to
indicate actions taken. In addition, if you position the mouse pointer over the name of the incident, a more
detailed description is displayed as a “tooltip”.
3.2.10. Quick Launch
This widget allows users to quickly record a new incident in any of the projects that they belong to. It’s a
shortcut that avoids having to first select a project, go to Tracking > Incidents and then click “New
Incident”. Instead you simply choose the project from the dropdown list and click the arrow icon to bring
up the new incident creation screen.
3.2.11. My Saved Reports
This section lists any reports you have saved from the reports center. This allows you to store specific
combinations of report elements, format, filters and sorts (see the section on Reporting for more details
on how to configure a report) for reports that you need to run on a regular basis:
© Copyright 2006-2013, Inflectra Corporation
Page 15 of 3
This document contains Inflectra proprietary information
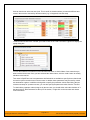
3.2.12. My Weather
This “fun” widget is designed to allow users to make the SpiraTeam® homepage more useful so that the
page becomes more central in their day-to-day operations and therefore they are more likely to keep
track of the other items reflected on the page.
3.2.13. My Subscribed Artifacts
This widget displays a list of all the artifacts in the system that you have subscribed to (by clicking on the
Subscribe icon on the item). You can display the item by simply clicking on the hyperlink. In addition, if
changes are made to any of the artifacts an email notification will be sent to you. You can click on the
“Unsubscribe” link to remove the item from this list.
3.2.14. My News Feeds
This widget allows you to subscribe to an external newsfeed and have the results be displayed inside
SpiraTeam. By default it will be set to the newsfeed from the Inflectra website that displays a list of recent
company and product announcements. You can add multiple instances of the widget to the dashboard,
allowing you to read multiple news sources at once. Typical uses for this widget are to add news from
project management and testing news sites/blogs or to add information from other tools in your
organization that can display their data in RSS format.
© Copyright 2006-2013, Inflectra Corporation
Page 16 of 3
This document contains Inflectra proprietary information
3.3. Global Navigation
Regardless of the page you are on, SpiraTeam® will always display the global navigation bar, consisting
of the SpiraTeam® icon, the current Project Group, the current Project, the four main sections (Planning,
Testing, Tracking and Reporting) that correspond to the main activities that take place in the system, the
global search bar, and the user profile avatar menu.
Under the various icons and headings are several secondary menu options that are displayed when you
click the dropdown arrow to the right of the heading (as illustrated below):
SpiraTeam Icon
My Page (described above)
My Timecard (described in Section 3.7)
Administration (described in the separate SpiraTeam Administration Guide)
Project Group Home Page (described in Section 3.5)
Project Home Page (described in Section 3.4)
Planning
Requirements (described in Section 4)
Releases (described in Section 7)
Iterations (described in Section 7.3)
Planning Board (described in Section 7.4)
Documents (described in Section 10)
Testing
Test Cases (described in Section 5)
Test Sets (described in Section 5.7)
Test Runs (described in Section 5.5)
Automation Hosts (described in Section 5.9)
Tracking
Incidents (described in Section 6)
Tasks (described in Section 8)
© Copyright 2006-2013, Inflectra Corporation
Page 17 of 3
This document contains Inflectra proprietary information
Resources (described in Section 9)
Source Code (described in Section 12)
Reporting (described in section 11)
User Profile Icon
My Profile (described in Section 3.6)
Log Out (described in Section 3.3.2)
Help? (described in Section 3.3.3)
Note: The main section headings will take you to the appropriate artifact type (requirement, test case,
incident, etc.) for the currently selected project.
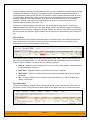
3.3.1. Global Search
SpiraTeam includes a global search bar that can be used to search across project and artifact type for
items that include the entered keywords in either the name or description field:
You can search for individual keywords by simply entering them in the search box and clicking the arrow
button on the right. You can search for phrases by enclosing the words in double quotes.
For example, searching on book name will find any artifacts that include either of the two words book and
name in the name or description. Searching on “book name” will only return items that have that exact
phrase in either the name or description.
3.3.2. Log Out
Clicking on the “Log Out” link will immediately log you out of your current session and return you to the
login page illustrated in section 3.1. If you had set the “Keep Me Logged In” option during your previous
© Copyright 2006-2013, Inflectra Corporation
Page 18 of 3
This document contains Inflectra proprietary information
login, that setting will be reset; so if you want to avoid having to keep logging-in, you’ll need to re-check
that box during your next log-in.
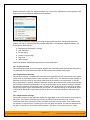
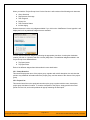
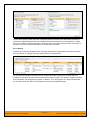
3.3.3. Help
Clicking on this link on any page will bring up the online version of this manual shown below:
Clicking on any of the [+] expand links in the left hand table of contents will open up the detailed list of
topics for each of the main areas of the system. In each area, clicking on one of the individual links will
open the appropriate section in the help manual. By default, the reading-pane will open to the help item
that is most closely related to the screen you happened to be on when you clicked the “Help” link.
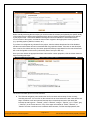
3.3.4. Choose Project and Project Group
Choosing a project from the list of your assigned projects in the drop-down-menu allows you to quickly
and easily jump between projects regardless of the page you happen to be on. When you choose a
project, you will be taken to the same page in the selected project (assuming that you have permissions
to view that page). You can use CTRL+click to open the new project in a separate browser tab:
Similarly you can choose a different project group from the list of project groups, which will display the
project group dashboard for the selected project group:
© Copyright 2006-2013, Inflectra Corporation
Page 19 of 3
This document contains Inflectra proprietary information
© Copyright 2006-2013, Inflectra Corporation
Page 20 of 3
This document contains Inflectra proprietary information
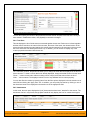
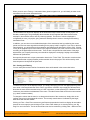
3.4. Project Home
When you click on either the “Project Home” tab or the name of the project in the “My Page” project list,
you will be taken to the homepage of the specific project in question:
This page summarizes all of the information regarding the project into a comprehensive, easily digestible
form that provides a “one-stop-shop” for people interested in understanding the overall status of the
project at a glance. It contains summary-level information for all types of artifact (requirements, test
cases, incidents, etc.) that you can use to drill-down into the appropriate section of the application. In
addition to viewing the project home page, you can choose to filter by a specific release, to get the
homepage for just that release (and any child iterations).
© Copyright 2006-2013, Inflectra Corporation
Page 21 of 3
This document contains Inflectra proprietary information
In a similar manner to the ‘My Page’, the Project Home dashboard is initially loaded in ‘view mode’ which
means that the various ‘widgets’ on the page are displayed with minimum visual clutter (no toolbars or
control icons) that makes it easy to scan the items on the page and see the health of the status of the
project at a glance. To switch the page to ‘edit mode’, you should click on “Modify Layout/Settings”
hyperlink.
Once in ‘edit mode’, each of the ‘widgets’ displayed on the project homepage can be minimized by
clicking on the arrow icon ( ) in the top-left of the window, or closed by clicking-on the cross icon ( ) in
the top-right of the window. In addition, the widgets allow you change their settings by clicking on the
settings icon ( ).This allows you to customize your view of the project to reflect the types of information
that are relevant to you. If you have closed a widget that you subsequently decide you want to reopen,
you can rectify by clicking the “Add Items” hyperlink at the top of the page, and locating the closed item
from the list of ‘Closed Widgets’.
When you load your ‘Project Home’ for the first time it will consists of the following main elements:
Project Overview
Requirements Summary
Requirements Coverage
Release Task Progress
Task Graphs
Late Finishing Tasks
Late Starting Tasks
Top Open Issues
Top Open Risks
Test Execution Status
Release Test Summary
Incident Summary
Incident Open Count
Requirement Incident Count
© Copyright 2006-2013, Inflectra Corporation
Page 22 of 3
This document contains Inflectra proprietary information
However these are not the only widgets available. If you click on the “Add/Remove” items hyperlink it will
display the list of any additional widgets that are available:
You can add the additional widgets by selecting the appropriate checkbox, choosing the destination
location (left side vs. right side) and then click the [Add] button. The additional widgets available in the
Project Home dashboard are:
Requirements Regression Coverage
Test Set Status
Incident Aging
Incident Test Coverage
Tag Cloud
Recent Builds
Each of the different widgets listed is described in more detail below:
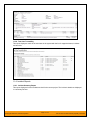
3.4.1. Project Overview
This section displays the name of the project, together with a brief description, the web-site that points to
any additional information about the project, and the names of the owners of the project.
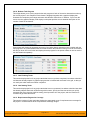
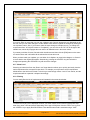
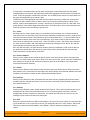
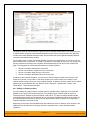
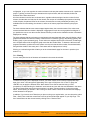
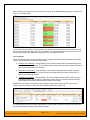
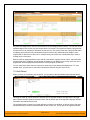
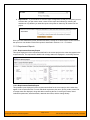
3.4.2. Requirements Summary
This section consists of a summary table that displays the aggregate count of requirements in the system
broken-down by importance (on the x-axis) and status (on the y-axis). This allows the project manager to
determine how many critical vs. low priority enhancements are waiting to be implemented, vs. actually
being implemented. In addition, it makes a distinction between those requirements simply requested and
those actually planned for implementation, so the project manager can see what the backlog is between
the customer’s demands, and the plan in place. Clicking on the “View Details” link at the top of the table
simply brings up the project requirements list (see section 4.1), whereas clicking on the individual values
in the cells will display the requirements list with the filter set to match the importance and status of the
value.
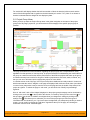
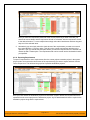
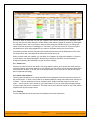
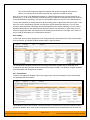
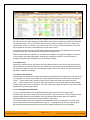
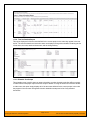
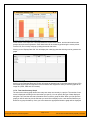
3.4.3. Requirements Coverage
This section consists of a bar graph that displays the aggregated count of requirements test coverage for
the project. The Passed, Failed, Blocked, Caution and Not-Run bars indicate the total count of
requirements that have tests covering them, allocated across the execution status of the covering tests.
For example if a requirement is covered by four tests, two that have passed, one that has failed and one
that has not yet been run, the counts would be passed = 0.5, failed = 0.25 and not-run 0.25. These
© Copyright 2006-2013, Inflectra Corporation
Page 23 of 3
This document contains Inflectra proprietary information
fractional quantities are then summed across all the requirements to give the execution status breakdown
of the covered requirements.
In addition to the five statuses for the covered requirements, the sixth (“Not Covered”) bar depicts the
total number of requirements that have no tests covering them, putting the five other bars into
perspective. Typically a project is in good health if the “Not Covered” bar is zero, and the count of
“Passed” requirements is greater than “Failed”, “Caution” or “Not Run”. The greatest risk lies with the
“Blocked”, “Not Covered” and “Not Run” status codes, since the severity/quantity of any bugs lurking
within is not yet fully known.
If you position the mouse pointer over any of the four bars, the color of the bar changes slightly and the
underlying raw data is displayed as a tooltip, together with the percentage equivalent. Clicking on the any
of the bars in the chart will take you to the requirements list page (see section 4.1) with the corresponding
filters set.
When you filter the project home by release/iteration, this widget will filter the requirements coverage
graph to only include requirements that are specifically mapped to the selected release/iteration.
This is useful when you want to determine the test coverage of new requirements that are being added to
the specific release/iteration. If instead you want to determine the regression test coverage for a release,
you should add the separate “Requirements Regression Coverage” widget to the page instead.
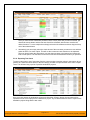
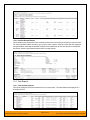
3.4.4. Requirement Incident Count
This section displays a count of the total number of incidents, and the number of open incidents mapped
against requirements in the system, sorted by the requirements that have the most open incidents first.
This section is useful for determining the parts of the application that have the most instability, as you can
look at the requirements that have yielded the greatest number of incidents. Clicking on any of the
requirements hyperlinks will take you to the detail page for the requirement in question (see section 4.2).
You can configure in the settings whether to include requirements with no open incidents, and also how
many rows of data to display.
3.4.5. Top Open Issues
This section displays a breakdown of the top issues logged against the project, in order of decreasing
priority. Note that items not given a priority are listed at the top, since critical issues could be lurking in
that list, and the project manager will want to immediately review these to assign priorities. Clicking on the
issue item hyperlink will take you to the incident details page for the issue in question (see section 6.2).
You can configure in the settings whether to use Priority or Severity for the display, and also how many
rows of data to display.
3.4.6. Top Open Risks
This section displays a breakdown of the top risks logged against the project, in order of decreasing
priority. Note that items not given a priority are listed at the top, since critical risks could be lurking in that
list, and the project manager will want to immediately review these to assign priorities. Clicking on the risk
item hyperlink will take you to the incident details page for the risk in question (see section 6.2). You can
configure in the settings whether to use Priority or Severity for the display, and also how many rows of
data to display.
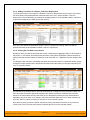
3.4.7. Release Test Summary
This widget allows you to quickly ascertain the test execution status of each of the active releases that
make up the current project in one snapshot. Each release is displayed together with a graphical display
that illustrates the execution status with different colored bars. In addition, if you hover the mouse over
the graphical display it will display a tooltip that provides a more detailed description of the number of
tests in each status.
© Copyright 2006-2013, Inflectra Corporation
Page 24 of 3
This document contains Inflectra proprietary information
Each release will display the aggregate status of any test cases directly assigned to itself, together with
the test status of any child iterations that are contained within the Release. Clicking on one of the
releases will drill you down one level further and display the test execution status for the parent release
as well as each of the child iterations separately:
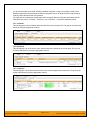
3.4.8. Incident Summary
This section consists of a summary table that displays the aggregate count of incidents in the system
broken-down by priority (on the x-axis) and status (on the y-axis). This allow the project manager to
determine how many critical vs. low priority incidents are waiting to be addressed, and how many new
items need to be categorized and assigned. Clicking on the “View Details” link at the top of the table
simply brings up the incident list (see section 6.1), whereas clicking on the individual values in the cells
will display the incident list with the filter set to match the priority and status of the value.
By default this summary table displays the total count of all incidents – regardless of type, however my
changing the drop-down list to a specific incident type (e.g. bug, enhancement, issue, etc.), the project
manager can filter the summary table to just items of that type. You can also configure in the settings
whether to use Priority or Severity for the x-axis
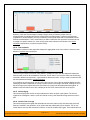
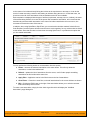
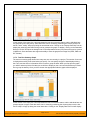
3.4.9. Test Execution Status
This section consists of a bar graph that displays the aggregated count of test cases in each execution
status for the project. Note that this graph does not consider past test-runs when calculating the totals in
each status (Passed, Failed, Not Run, etc.), it simply looks at each test-case and uses the last-run status
as the best health indicator. Thus if a test case that previously passed, has subsequently failed upon reexecution, it will be considered a failure only.
If you position the mouse pointer over any of the five bars, the color of the bar changes slightly and the
underlying raw data is displayed as a tooltip, together with the percentage equivalent. Clicking on any of
the bars will bring up the project test case list (see section 5.1) with the appropriate filter applied.
In addition to the bar-chart, there is also a display of the total number of test runs recorded for the project,
and a list of the five most recent days of recorded test-runs, together with the daily count.
© Copyright 2006-2013, Inflectra Corporation
Page 25 of 3
This document contains Inflectra proprietary information
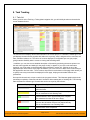
3.4.10. Release Task Progress
This widget allows you to quickly ascertain the task progress of each of the active releases that make up
the current project in one snapshot. Each release is displayed together with a graphical display that
illustrates the completion percentage and status with different colored bars. In addition, if you hover the
mouse over the graphical display it will display a tooltip that provides a more detailed description of the
number of tasks in each status.
Each release will display the aggregate progress of any tasks directly assigned to itself, together with the
task progress of any child iterations that are contained within the Release. Clicking on one of the releases
will drill you down one level further and display the task progress for the parent release as well as each of
the child iterations separately:
3.4.11. Late Finishing Tasks
This section displays the list of any project tasks that have not yet been completed, but whose scheduled
end date has already elapsed. A graphical progress bar is included with each task in the grid, so that you
can easily see which tasks are nearest completion.
3.4.12. Late Starting Tasks
This section displays the list of any project tasks that have not yet started, but whose scheduled start date
has already elapsed. Each task is listed along with its owner, priority and due-date so that you quickly
ascertain how many days late it will be starting, how important it is to the project, and who needs to be
contacted to get more information.
3.4.13. Requirements Regression Coverage
This section consists of a bar graph that displays the aggregated count of requirements test coverage for
the project in a similar fashion to the ‘Requirements Coverage’ widget:
© Copyright 2006-2013, Inflectra Corporation
Page 26 of 3
This document contains Inflectra proprietary information
However, unlike the ‘Requirements Coverage’ widget, when you filter the project home by
release/iteration, this widget will filter the requirements coverage graph to include all requirements
(regardless of release/iteration), but only considering covering test cases that are associated with the
selected release/iteration. This is useful when you want to determine the regression requirements test
coverage of a specific release (i.e. does running all the tests relevant to this release cover all the
necessary requirements, not just new requirements).
3.4.14. Test Set Status
This section consists of a bar graph that displays the aggregated count of test cases in each execution
status for each test set in the project:
Therefore if you have the same test cases stored in multiple test sets, then this widget will display the
total test case count for all combinations of test set. This is useful if you have the same test cases being
executed in different environments – represented by different test sets – and you need to make sure that
the tests passed successfully in all environments.
If you position the mouse pointer over any of the five bars, the color of the bar changes slightly and the
underlying raw data is displayed as a tooltip, together with the percentage equivalent. Clicking on any of
the bars brings up the project test set list (see section 5.6) page with the appropriate filter applied. In
addition to the bar-chart, there is also a display of the five most overdue test sets in the project.
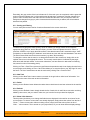
3.4.15. Incident Aging
This section displays the number of days incidents have been left open in the system. The chart is
organized as a histogram, with the count of incidents on the y-axis and different age intervals on the xaxis.
3.4.16. Incident Test Coverage
This section displays a bar-graph that illustrates the execution status of any test cases that previously
failed and resulted in the generation of an incident that has subsequently been resolved. This is very
useful when a test case was executed in Release 1.0 and an incident was logged. That incident has now
© Copyright 2006-2013, Inflectra Corporation
Page 27 of 3
This document contains Inflectra proprietary information
been resolved in Release 1.1 (and is in a closed status) but we need to know that the test case that
caused the failure has been successfully re-run. Any test cases listed as Blocked, Caution, Not-Run or
Failed in this graph need to be executed to verify that all resolved bugs in the release have truly been
fixed.
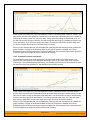
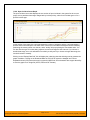
3.4.17. Task Graphs
This widget lets you quickly view the three main graphs used when measuring the progress of tasks in an
agile methodology:
1. Task Velocity – this graph shows the total estimated and actual effort delivered in each project
release and/or iteration
2. Task Burnup – this graph shows the cumulative amount of work outstanding for each
release/iteration in the project with separate lines for the estimated, remaining and completed
effort.
3. Task Burndown – this graph shows the remaining work that needs to be done for each
release/iteration in the project with separate lines for the estimated, remaining and completed
effort.
For each of the three graphs you can click on the “Display Data Grid” link to display a grid of the
underlying data that is represented in the graph and also there are options to save the graph in a variety
of different image formats.
3.4.18. Tag Cloud
This widget lets you see the list of document tags being used in the project:
The size of the tag name indicates the relative frequency of its usage in the project. Clicking on a
document tag will open up the Document List page (see section 10.1) with the filter set to the tag you
clicked on. This will display a list of related documents that have been tagged with the same tag name.
3.4.19. Recent Builds
This widget displays a list of the most recent builds that have been performed as part of the current
release or iteration:
© Copyright 2006-2013, Inflectra Corporation
Page 28 of 3
This document contains Inflectra proprietary information
For each build it will display whether the build succeeded or failed, the date the build occurred and the
name of the build together with a hyperlink to the build details (see section 7.2.7). Note: If no release or
iteration is selected then the widget will not display any data.
3.5. Project Group Home
When you click on either the Project Group name in the global navigation or the name of the project
group in the “My Page” project list, you will be taken to the homepage of the specific project group in
question:
This page summarizes all of the information regarding the project group into a comprehensive, easily
digestible form that provides a “one-stop-shop” for people interested in understanding the overall status of
the group as a whole as well as the relative performance of the different projects that make up the group.
It contains summary-level metrics for all types of artifact (requirements, test cases, tasks, incidents, etc.)
that you can use to drill-down into the appropriate project for more details.
In a similar manner to the ‘My Page’, the Project Group Home dashboard is initially loaded in ‘view mode’
which means that the various ‘widgets’ on the page are displayed with minimum visual clutter (no toolbars
or control icons) that makes it easy to scan the items on the page and see the health of the status of the
project at a glance. To switch the page to ‘edit mode’, you should click on “Modify Layout/Settings”
hyperlink.
Once in ‘edit mode’, each of the ‘widgets’ displayed on the project group homepage can be minimized by
clicking on the arrow icon ( ) in the top-left of the window, or closed by clicking-on the cross icon ( ) in
the top-right of the window. In addition, the widgets allow you change their settings by clicking on the
settings icon ( ).This allows you to customize your view of the project group to reflect the types of
information that are relevant to you. If you have closed a widget that you subsequently decide you want to
reopen, you can rectify by clicking the “Add Items” hyperlink at the top of the page, and locating the
closed item from the list of ‘Closed Widgets’.
© Copyright 2006-2013, Inflectra Corporation
Page 29 of 3
This document contains Inflectra proprietary information
When you load the ‘Project Group Home’ for the first time it will consists of the following main elements:
Group Overview
Requirements Coverage
Task Progress
Project List
Test Execution Status
Incident Aging
However these are not the only widgets available. If you click on the “Add/Remove” items hyperlink it will
display the list of any additional widgets that are available:
You can add the additional widgets by selecting the appropriate checkbox, choosing the destination
location (left side vs. right side) and then click the [Add] button. The additional widgets available in the
Project Group Home dashboard are:
Top Open Issues
Top Open Risks
Each of the different widgets listed is described in more detail below:
3.5.1. Group Overview
This section displays the name of the project group, together with a brief description, the web-site that
points to any additional information about the project group, and the names of the owners of the project
group.
3.5.2. Project List
This section lists all the active projects that make up the group, together with the name, description,
project group and date of creation. To view the description of the project, simply position the mouse
pointer over the link, and a tooltip window will popup containing the description.
© Copyright 2006-2013, Inflectra Corporation
Page 30 of 3
This document contains Inflectra proprietary information
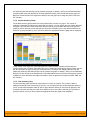
3.5.3. Requirements Coverage
This section consists of a bar graph that displays the aggregated count of requirements test coverage for
the entire project group. The Passed, Failed, Blocked, Caution and Not-Run bars indicate the total count
of requirements that have tests covering them, allocated across the execution status of the covering tests
Under the main bar graph is displayed a table containing each project in the group and a colored bar
illustrating the specific requirements coverage distribution for that project. That way you can see both the
aggregate coverage and also the relative coverage for the projects. You can configure in the widget
settings whether you want to see the aggregate bar graph, and/or the project-specific requirements
coverage.
3.5.4. Task Progress
This section consists of a bar graph that displays the aggregated count of tasks by progress category for
the entire project group. The ‘On Schedule’, ‘Late Finish’, ‘Late Start’ and ‘Not Started’ bars indicate the
total count of tasks that are in that category for all the projects in the group.
Under the main bar graph is displayed a table containing each project in the group and a colored bar
illustrating the specific task progress for that project (using the same coloring convention as the main
graph). That way you can see both the aggregate task progress and also the relative progress for each
project. You can configure in the widget settings whether you want to see the aggregate bar graph, and/or
the project-specific task progress.
3.5.5. Test Execution Status
This section consists of a bar graph that displays the aggregated count of test cases by execution status
for the entire project group. The Passed, Failed, Blocked, Caution and Not-Run bars indicate the total
count of test cases that are in that category for all the projects in the group.
Under the main bar graph is displayed a table containing each project in the group and a colored bar
illustrating the specific test case execution status for that project (using the same coloring convention as
the main graph). That way you can see both the aggregate test status and also the relative status for
each project. You can configure in the widget settings whether you want to see the aggregate bar graph,
and/or the project-specific test status.
3.5.6. Incident Aging
This section displays the number of days incidents have been left open in the system. The chart is
organized as a histogram, with the count of incidents on the y-axis (for all projects in the group) and
different age intervals on the x-axis.
Under the main bar graph is displayed a table containing each project in the group and a colored bar
illustrating the distribution of open incidents by priority for that project. That way you can see both the
aggregate aging for the group and also the relative priority of open incidents for each project. You can
configure in the widget settings whether you want to see the aggregate aging histogram, and/or the
project-specific incident count by priority.
3.5.7. Top Open Issues
This section displays a breakdown of the top issues logged against any of the projects in the group, in
order of decreasing priority. Note that items not given a priority are listed at the top, since critical issues
could be lurking in that list, and the project manager will want to immediately review these to assign
priorities. Clicking on the issue item hyperlink will take you to the incident details page for the issue in
© Copyright 2006-2013, Inflectra Corporation
Page 31 of 3
This document contains Inflectra proprietary information
question (see section 6.2). You can configure in the settings whether to use Priority or Severity for the
display, and also how many rows of data to display.
3.5.8. Top Open Risks
This section displays a breakdown of the top risks logged against any of the projects in the group, in order
of decreasing priority. Note that items not given a priority are listed at the top, since critical risks could be
lurking in that list, and the project manager will want to immediately review these to assign priorities.
Clicking on the risk item hyperlink will take you to the incident details page for the risk in question (see
section 6.2). You can configure in the settings whether to use Priority or Severity for the display, and also
how many rows of data to display.
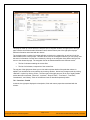
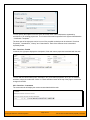
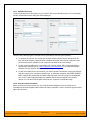
3.6. My Profile
When you click on either the “My Profile” link in the global navigation, you will be taken to the page in the
system that allows you to view and edit your personal profile:
You can change your user information including your first-name, last-name, middle-initial, avatar icon,
department and your choice of start-page. Clicking the <Update> button will commit the changes,
whereas clicking <Cancel> returns you back to either “Project Home” or “My Page” depending on whether
you have a project currently selected or not.
If you want to be able to subscribe to RSS feeds of the information assigned to you in the “My Page”,
make sure that the “Enable RSS Feeds” checkbox is selected and an RSS token has been generated in
the textbox underneath.
You can change your start page to be any of the following:
•
My Page – When you first log-in, you will be taken to your “My Page” dashboard
•
Last Opened Project – When you first login-in, you will be taken to the home page for the project
you last had open
•
Last Opened Project Group - When you first login-in, you will be taken to the home page for the
project group you last had open
3.6.1. Change Password
In addition to being able to update your user information, you can optionally change your password at the
same time. To change your password, on the Change Password tab fill in the three boxes with your
© Copyright 2006-2013, Inflectra Corporation
Page 32 of 3
This document contains Inflectra proprietary information
current password, and your new password repeated for verification. Then when the <Update> button is
clicked, the system will update your password, otherwise you will simply get a warning message
indicating what needs to be corrected.
You can also change the current password retrieval question and answer by entering in your current
password (for security reasons) as well as the new password question and answer.
Note: If your SpiraTest user profile is linked to an account stored in an external LDAP server, you may
find the change password option is disabled. This is because the system uses the password held in the
external server. To change the password in this case, please contact your system administrator who will
be able to help you change the password in your LDAP environment.
3.6.2. Email Preferences
Here you can configure the email address that the application will send notifications to, and whether or
not you want to receive email notifications.
If the Enable Notifications cannot be changed, it means that the system is either not configured to send
out notifications, or the administrator has disabled user’s ability to opt out of notifications being sent.
3.6.3. LDAP Settings
This tab will show configured LDAP options for your account. At this time, no configurable options are on
this tab, it is for reference only.
3.6.4. Regional Settings
This tab will display the current culture and timezone associated with your profile:
© Copyright 2006-2013, Inflectra Corporation
Page 33 of 3
This document contains Inflectra proprietary information
By default all profiles will be set to use the application’s default culture and timezone. This means that the
language, number formats and timezone used in the application will be the ones decided by the person
who installed the system. However there are cases where you want to use a different language, timezone
or number format (for example, a German employee working in the German office of a French company
might want to use the German culture instead of French). You can change the culture and/or timezone to
any of the options listed in the dropdown list.
Note: The system will only be installed with a certain number of language packs, so in some cases a
selected culture will only change the number formats and not the languages displayed.
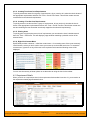
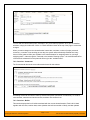
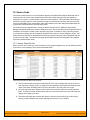
3.6.5. Actions
This tab displays the list of recent actions that you have performed in the system (across all projects):
You can search and filter the grid to find changes by project, change date range, artifact type and type of
change (added, deleted, modified).
© Copyright 2006-2013, Inflectra Corporation
Page 34 of 3
This document contains Inflectra proprietary information
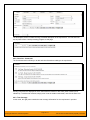
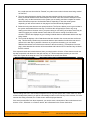
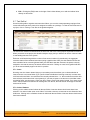
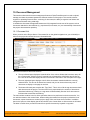
3.7. My Timecard
When you click on My Page > My Timecard the system will display a timecard that allows you to enter the
effort worked on incidents and tasks currently assigned to you (across all your projects):
The system will only include projects that have time-tracking enabled for incidents and tasks, so if some
of your assigned incidents or tasks are missing, please check with the project owner of the projects
affected to have them enable time-tracking.
Each task or incident will be displayed along with its priority, severity, start-date, end-date, project name
effort remaining and effort expended to date. For each item you can then indicate the additional actual
effort performed (which will be added to the “actual effort”) and modify the amount of hours remaining.
Once you are satisfied, click [Submit Timecard] to commit the changes.
© Copyright 2006-2013, Inflectra Corporation
Page 35 of 3
This document contains Inflectra proprietary information
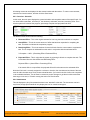
4. Requirements Management
This section outlines how the requirements management features of SpiraTeam® can be used to develop
a requirements / scope matrix for a project, and how you can map any existing test-cases to the
requirements. Typically when starting a project, developing the requirements list is the first activity after
the Administrator has set up the project in the system.
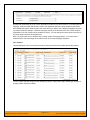
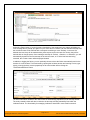
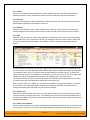
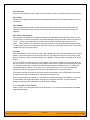
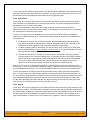
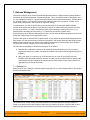
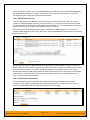
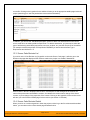
4.1. Requirements List
When you click on the Planning > Requirements link on the global navigation bar, you will initially be
taken to the requirements list screen illustrated below:
The requirements list consists of a hierarchical arrangement of the various requirements and
functionalities that need to be provided by the system in question. The structure is very similar to the
Work Breakdown Structure (WBS) developed in Microsoft Project®, and users of that software package
will find this very familiar to use. When you create a new project, this list will initially be empty, and you
will have to start using the <Insert> button to start adding requirements.
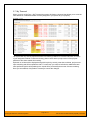
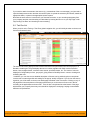
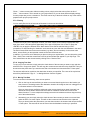
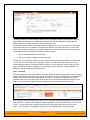
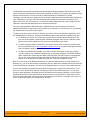
Requirements come in two main flavors: summary items shown in bold-type, and detail items shown in
normal-type with a hyperlink. When you indent a requirement under an existing requirement, the parent is
changed from a detail-item to a summary-item, and when you outdent a child item, its parent will return to
a detail-item (assuming it has no other children). This behavior is important to understand, as only detail
items are assigned a status themselves; the summary items simply display an aggregate of the worstcase assessment of their children’s status. Both summary and detail items can be mapped against testcases for test-coverage, in addition the summary items display an aggregate coverage status.
Each requirement is displayed along with its importance/priority (ranked from “Critical” to “Low”), its
completion status (from “Requested” to “Completed”), the version of the software that the requirement is
planned for, and graphical indicators that represents its test coverage status and its task progress.
For those requirements that have no test-cases covering them (i.e. validating that the requirement works
as expected) the indicator consists of a white solid bar, bearing the legend “Not Covered”. For those
requirements that have at least one test-case mapped against them, they will display block graph that
illustrates the last execution status of each of the mapped test-cases. Thus if the requirement is covered
by two test cases, one of which passed, and one of which wasn’t run, the graph will display a green bar
(50% passed) and an equal length gray bar (50% not run). To determine the exact requirements
coverage information, position the mouse pointer over the bar-chart, and the number of covering tests,
along with the pass / fail / blocked / caution / not-run breakdown will be displayed as a “tooltip”.
© Copyright 2006-2013, Inflectra Corporation
Page 36 of 3
This document contains Inflectra proprietary information
For those requirements that have at least one task associated with them, they will display a block graph
that illustrates the relative numbers of task that are on-schedule (green), late-starting (yellow), latefinishing (red) or just not-started (grey). These values are weighted by the effort of the task, so that larger,
more complex tasks will be change the graph more than the smaller tasks. To determine the exact task
progress information, position the mouse pointer over the bar-chart and the number of associated tasks,
along with the details of how many are in each status will be displayed as a “tooltip”.
4.1.1. Insert
Clicking on the <Insert> icon inserts a requirement above the currently selected requirement – i.e. the one
whose check-box has been selected, at the same level in the hierarchy. If you want to insert a
requirement below an existing item, you can use the Insert > Child Requirement option instead. If you
insert a requirement without first selecting an existing requirement from the list, the new requirement will
simply be added at the end of the list.
Once the new requirement has been inserted, the item is switched to “Edit” mode so that you can rename
the default name and choose a priority, status and/or author.
4.1.2. Delete
Clicking on the <Delete> button deletes all the requirements whose check-boxes have been selected. If
any of the items are summary items, the child requirements are also deleted. If all the children are deleted
from a summary item, it changes back into a non-summary item.
4.1.3. Indent
Clicking on the <Indent> button indents all the requirements whose check-boxes have been selected. If
any of the items are made children of a requirement that had no previous children, it will be changed from
a detail item into a summary item.
4.1.4. Outdent
Clicking on the <Outdent> button de-indents all the requirements whose check-boxes have been
selected. If any of the items were the only children of a summary requirement item, then that item will be
changed back from a summary item to a detail item.
4.1.5. Refresh
Clicking on the <Refresh> button simply reloads the requirements list. This is useful as other people may
be modifying the list of requirements at the same time as you, and after stepping away from the computer
for a short-time, you should click this button to make sure you are viewing the most current requirements
list for the project.
4.1.6. Edit
Each requirement in the list has an <Edit> button display in its right-most column. When you click this
button or just double-click on any of the cells in the row, you change the item from “View” mode to “Edit”
mode. The various columns are made editable, and <Update> <Cancel> buttons are displayed in the last
column:
© Copyright 2006-2013, Inflectra Corporation
Page 37 of 3
This document contains Inflectra proprietary information
If you click <Edit> on more than one row, the <Update> and <Cancel> buttons are only displayed on the
first row, and you can make changes to all the editable rows and then update the changes by clicking the
one <Update> button. Also, if you want to make the same change to multiple rows (e.g. to change five
requirements from “In Progress” status to “Completed”), you can click on the “fill” icon to the right of the
editable item, which will propagate the new value to all editable items in the same column.
If you want to edit lots of items, first select their checkboxes and then click the [Edit] button on the same
row as the Filters and it will switch all the selected items into edit mode.
When you have made your updates, you can either click <Update> to commit the changes, or <Cancel>
to revert back to the original information. Alternatively, pressing the <ENTER> key will commit the
changes and pressing the <ESCAPE> key will cancel the changes.
4.1.7. Show Level
Choosing an indent level from the ‘Show Level’ drop down box allows you to quickly and easily view the
entire requirements list at a specific indent level. For example you may want to see all requirements
drilled-down to the third level of detail. To do this you would simply choose ‘Level 3’ from the list, and the
requirements will be expanded / collapsed accordingly.
4.1.8. Filtering
You can easily filter the list of requirements as illustrated in the screen-shot below:
To filter the list by any of the displayed columns, you either choose an item from the appropriate dropdown list or enter a free-text phrase (depending on the type of field) then click the <Filter> icon or press
the <ENTER> key to apply the different filters. Note that the name field is searched using a “LIKE”
© Copyright 2006-2013, Inflectra Corporation
Page 38 of 3
This document contains Inflectra proprietary information
comparison, so that searching for “database” would include any item with the word database in the name.
The other freetext fields need to be exact matches (e.g. dates, requirement numbers). In the screen-shot
above, we are filtering on Status = Requested.
In addition, if you have a set of filters that you plan on using on a regular basis, you can choose the option
Filter > Save Filter to add the current filter to the list of saved filters that appear on your ‘My Page’. The
list of saved filters can also be retrieved by clicking Filter > Retrieve Filter:
4.1.9. Show / Hide Columns
This drop-down list allows you to change the fields that are displayed in the requirement list as columns
for the current project. To show a column that is not already displayed, simply select that column from the
list of “Show…” column names and to hide an existing column, simply select that column from the list of
“Hide…” column names. This is stored on a per-project basis, so you can have different display settings
for each project that you are a member of. The fields can be any of the built-in fields or any of the custom
properties set up by the project owner.
4.1.10. Copying Requirements
To copy a requirement or set of requirements, simply select the check-boxes of the requirements you
want to copy and then select the Edit > Copy menu option. This will copy the current requirements
selection to the clipboard. Then you should select the place where you want the requirements to be
inserted and choose the Edit > Paste option.
The requirements will now be copied into the destination location you specified. The name of the copied
requirements will be prefixed with “Copy of…” to distinguish them from the originals. Note that copied
requirements will also include the test coverage information from the originals.
4.1.11. Moving Requirements
To move a requirement in the requirements hierarchy, there are two options:
1. Click on the icon the requirement you want to move and then drag the icon to the location you
want it moved. The border between the destination requirements will change as the icon is
dragged over it to illustrate where it will be inserted:
© Copyright 2006-2013, Inflectra Corporation
Page 39 of 3
This document contains Inflectra proprietary information
Once you have the requirement positioned at the correct place that you want it inserted, just
release the mouse button and the requirement list will be refreshed, with the requirement moved
to the desired location. To move multiple items simply select their checkboxes and then drag-anddrop one of the selected items.
2. Alternatively you can simply select the check-boxes of the requirements you want to move and
then select the Edit > Cut menu option. This will cut the current requirements selection to the
clipboard. Then you should select the place where you want the requirements to be inserted and
choose the Edit > Paste option. The requirements will now be moved into the destination location
you specified.
4.1.12. Exporting Requirements
To export a requirement or set of requirements from the current project to another project in the system,
all you need to do is select the check-boxes of the requirement(s) you want to export and then click the
Tools > Export icon. This will then bring up a list of possible destination projects:
Once you have chosen the destination project and clicked the <Export> button, the requirements will be
exported from the current project to the destination project. Any file attachments will also be copied to the
destination project along with the requirements.
© Copyright 2006-2013, Inflectra Corporation
Page 40 of 3
This document contains Inflectra proprietary information
4.1.13. Creating Test Cases from Requirements
To quickly create test cases from a group of requirements, all you need to do is select the check-boxes of
the appropriate requirements and then click Tools > Create Test Cases. This will then create new test
cases based on the selected requirements.
4.1.14. Creating a Test Set from Requirements
To quickly create a new test set from a group of requirements, all you need to do is select the checkboxes of the appropriate requirements and then click Tools > Create Test Set. This will then create new
test set containing the test cases that are already mapped to the selected requirement(s).
4.1.15. Printing Items
To quickly print a single requirement or list of requirements you can select the items’ checkboxes and
then click Tools > Print Items. This will display a popup window containing a printable version of the
selected items.
4.1.16. Right-Click Context Menu
SpiraTeam® provides a shortcut – called the context menu - for accessing some of the most commonly
used functions, so that you don’t need to move your mouse up to the toolbar each time. To access the
context menu, right-click on any of the rows in the requirements list and the following menu will be
displayed:
You can now choose any of these options as an alternative to using the icons in the toolbar.
4.2. Requirement Details
When you click on a requirement item in the requirements list described in section 4.1, you are taken to
the requirement details page illustrated below:
© Copyright 2006-2013, Inflectra Corporation
Page 41 of 3
This document contains Inflectra proprietary information
This page is made up of three areas; the left pane displays the requirements list navigation, the top of the
right pane displays the name of the selected requirement together with various operation icons, and the
bottom of the right pane displays different tabs with information related to the requirement.
The navigation pane consists of a link that will take you back to the requirements list, as well as a list of
the peer requirements to the one selected. This latter list is useful as a navigation shortcut; you can
quickly view the coverage information of all the peer requirements by clicking on the navigation links
without having to first return to the requirements list page. The navigation list can be switched between
three different modes:
•
The list of requirements matching the current filter
•
The list of all requirements, irrespective of the current filter
•
The list of requirements assigned to the current user
The top part of the right pane allows you to view and/or edit the name of the particular requirement. You
can edit the name and once you are satisfied with any changes, simply click either the <Save>, <Save
and Close> or <Save and New> button at the top of the page to commit the changes. In addition you can
delete the current artifact by choosing <Delete>, make a copy of it by choosing <Copy>, discard any
changes made by clicking <Refresh> or print it by clicking <Print>.
Using the <Email> button on the toolbar, you can send an email containing details of the requirement to
an email address or another user on the system:
You can specify the subject line for the email, and either a list of email addresses, separated by
semicolons, or an existing project user .The content of the email is specified in the System Administration
– Notification Templates.
In addition, the bottom part of the right pane can be switched between six views: “Overview”, “Test
Coverage”, “Tasks”, “Attachments”, “History” and “Associations”, each of which will be described in more
detail below.
4.2.1. Overview - Details
In this tab, the right pane displays the description, fields and comments associated with the requirement.
The top part of this tab displays the various standard fields and custom properties associated with the
requirement.
© Copyright 2006-2013, Inflectra Corporation
Page 42 of 3
This document contains Inflectra proprietary information
The Description section contains the long, formatted description of the requirement. You can enter rich
text or paste in from a word processing program or web page.
4.2.2. Overview - Comments
The Comments section allows you to add and view discussions relating to the requirement:
Existing comments are displayed in order underneath the textbox in date order (either newest first or
oldest first). To add a new comment, simply enter it into the textbox underneath, and click the Save icon.
4.2.3. Test Coverage
In this mode, the right pane contains the test coverage information for the requirement in question:
© Copyright 2006-2013, Inflectra Corporation
Page 43 of 3
This document contains Inflectra proprietary information
The pane consists of two lists of test cases, the one on the left being the hierarchical list of the test cases
belonging to the project arranged in test folders. The right box (which will initially be empty) contains the
list of test cases mapped to this requirement. The test cases in this box include columns for their ID,
name and execution status. Hovering the mouse over the names of the test cases in either box will
display a “tooltip” consisting of the test case name, place in the folder structure and a detailed description.
Clicking on the hyperlinks in right-hand box will jump you to the test case details screen for the test case
in question (see section 5.2.9).
To change the coverage for this requirement, you use the buttons (Add, Remove, Remove All) positioned
between the two list-boxes. The <Add> button will move the selected test cases from the list of available
on the left to the list of mapped on the right. Similarly the <Remove> and <Remove All> buttons will
remove either the selected or all the test cases from the right list-box and add them back to the left listbox.
Finally, as a shortcut you can click the “Create Test Case from This Requirement” link to create a new
test case in the list of covered test cases that will be automatically linked to this requirement. This is
useful when you have created a new requirement and want to generate an initial covering test to be
fleshed-out later.
4.2.4. Tasks
In this mode, the right pane displays the list of project tasks that need to be completed for the requirement
to be satisfied:
Each of the tasks is displayed together with its name, description (by hovering the mouse over the name),
progress, priority, start-date, current owner, estimated effort, projected effort and numeric task identifier.
Clicking on the task name will bring up the Task Details page which is described in more detail in section
8.2. This allows you to edit the details of an existing task.
© Copyright 2006-2013, Inflectra Corporation
Page 44 of 3
This document contains Inflectra proprietary information
You can perform the following actions on a task from this screen:
New Task – inserts a new task in the task list with a default set of values. The task will be
associated with the current requirement.
Remove – removes the task from this requirement without actually deleting the task
Refresh – updates the list of tasks from the server, useful if other people are adding tasks to this
requirement at the same time.
Apply Filter – Applies the entries in the filter boxes to the list of tasks
Clear Filters – Clears the current filter, so that all tasks associated with the current requirement
are shown.
Edit – Clicking the [Edit] button to the right of the task allows you to edit the task inline directly on
this screen. Only columns visible will be editable.
Show/Hide Columns – Allows you to choose which Task columns are visible
The system has a series of shortcuts that simplify the editing of requirements and tasks:
If you create a new task on the requirements page, the priority, release/iteration and owner are
automatically copied from the parent requirement. You can change these suggested values
before clicking [Update]
When you assign a release/iteration to a requirement, its status automatically changes to
“Planned”
When at least one task assigned to the requirement changes from “Not Started” to “In Progress”,
the parent requirement automatically switches from “Planned” to “In Progress”
When all the tasks under the requirement are completed, the parent requirement will switch to the
“Completed” status.
If you manually move a requirement that has no associated tasks from “Planned” to “In Progress”,
the system will automatically generate one task under the requirement and use the requirement’s
planned effort field to generate the task’s estimated effort.
4.2.5. Attachments
In this mode, the main pane displays the list of documents, screenshots or web-links (URLs) that have
been “attached” to the requirement. The documents can be in any format, though SpiraTeam® will only
display the icon for certain known types.
The attachment list includes the filename/URL that was originally uploaded together with the file-size (in
KB), name of the person who attached it and the date uploaded. In addition, if you position the pointer
over the filename and hold it there for a few seconds, a detailed description is displayed as a tooltip:
© Copyright 2006-2013, Inflectra Corporation
Page 45 of 3
This document contains Inflectra proprietary information
To actually view the document, simply click on the filename hyperlink and a new web browser window will
open. Depending on the type of file, this window will either display the document / web-page or prompt
you for a place to save it on your local computer. To remove an existing attachment from a requirement,
simply click the [Remove] button and the attachment will be removed from the list. Using the standard
filter/sort options you can also sort and filter the list of attachments to make it more manageable.
If you are using SpiraPlan or SpiraTeam (but not SpiraTest) you can also choose to include file
attachments stored in a linked version control system (e.g. Subversion, CVS, Perforce, etc.) by selecting
the “Include Source Code Documents” option.
To attach a new document to the requirement, you need to first click the “Add New” link to display the
new attachment dialog box:
There are three different types of item that can be attached to a requirement:
To upload a file, choose “File” as the type and then click the Browse button and select the file
from your local computer, optionally enter a detailed description then click the <Upload> button.
The document will be copied from your computer and attached to the artifact.
To attach a web-link (URL) to the artifact, you need to choose “URL” as the type and then enter
the fully qualified URL (e.g. http://mywebsite.com?Document=1), an optional description and then
click the <Upload> button to attach the web-link.
To attach a screenshot to the artifact, you need to choose “Screenshot” as the type and then
copy the image to your computer’s clipboard (e.g. on Windows computers, the PRINT SCREEN
button captures the current page and adds to the clipboard). Once the image is in the clipboard,
click on the “Paste image from clipboard” hyperlink and the item will appear in the preview
window. You can then fill in the other fields and click <Upload> to attach the image.
© Copyright 2006-2013, Inflectra Corporation
Page 46 of 3
This document contains Inflectra proprietary information
Note: If you are using a non-Windows® computer (e.g. Macintosh®) that doesn’t put file extensions on
filenames (e.g. .xls for an Excel sheet) automatically, then you will need to manually add the file extension
to the filename before uploading if you want it to be displayed with the correct icon in the attachment list.
You can also associate an existing document (that’s already stored in SpiraTeam) with the requirement.
To do that, click on the “Add Existing” hyperlink to bring up the add file association dialog box:
You can then choose to either associate a document stored in the SpiraTeam Documents repository or
(in the case of SpiraPlan/SpiraTeam but not SpiraTest) from the linked source code repository. In either
case you first select the appropriate folder, and then pick the document(s) from the file list on the right. In
the case of a source code file association you can also add a comment.
4.2.6. History
In this mode, the main pane displays the list of changes that have been performed on the requirement
artifact since its creation. An example requirement change history is depicted below:
The change history displays the date that each change was made, together with the fields that were
changed, the old and new values and the person who made the change. This allows a complete audit trail
to be maintained of all changes in the system. In addition, if you are logged in as a project administrator
you can also click on the “Admin View” hyperlink to revert any unwanted changes.
4.2.7. Associations
In this mode, the main pane displays a list of any incidents or other requirements that are associated with
this requirement:
© Copyright 2006-2013, Inflectra Corporation
Page 47 of 3
This document contains Inflectra proprietary information
The requirements in this list are ones that a user has decided are relevant to the current one and has
created a direct link between them. In the case of incidents, the association can be either due to the
creator of an incident directly linking the incident to the requirement, or it can be the result of a tester
executing a test-run and creating an incident during the test run. In this latter case, the check-box to the
left of the association will be unavailable as the link is not editable.
Each association is displayed with the type of artifact (requirement vs. incident), name of the artifact being
linked-to, the name of the person who created the association, and a comment that describes why the
association was made. In the case of an indirect association due to a test run, the comment will contain
the name of the test run.
In addition, when using SpiraPlan or SpiraTeam, you can select the checkbox marked “Include Source
Code Revisions” and the system will also scan the source code repository for any revisions that are linked
to this artifact. Since that can take be slower than accessing SpiraTeam, it is provided as an option that
you can enable and disable:
You can perform the following actions on an association from this screen:
Delete – removes the selected association to the other artifact. This will only delete the
association, not the linked artifact itself.
Refresh – updates the list of associations from the server, useful if other people are adding
associations to this requirement at the same time.
Apply Filter – Applies the entries in the filter boxes to the list of associations
Clear Filters – Clears the current filter, so that all associations for the current requirement are
shown.
Edit – Clicking the [Edit] button to the right of the associations allows you to edit the comment
field inline directly on this screen.
To create a new association, simply click the <Add> hyperlink which will display the “Add New
Association” popup dialog box:
© Copyright 2006-2013, Inflectra Corporation
Page 48 of 3
This document contains Inflectra proprietary information
Once you have selected the appropriate artifact type, you will then be able to choose the specific artifact
you want to link to. In all cases, you can choose the item from a scrolling selection box, or you can either
enter the ID of the artifact directly (if known). In either case you can also add a comment that explains the
rationale for the association.
© Copyright 2006-2013, Inflectra Corporation
Page 49 of 3
This document contains Inflectra proprietary information
5. Test Case Management
This section outlines how the use-case / test-case management features of SpiraTest® and SpiraTeam®
can be used to develop the business use-cases for the system, which specify how the different pieces of
functionality are expected to work in practice. In addition, these use/test-cases form the basis of the
business specification of the system when associated with the underlying requirements matrix. Typically
when starting a new project:
The requirements matrix is entered first
Then the list of use-cases is developed to outline the key scenarios that need to supported to
implement the requirement
Then the use-cases are fleshed out into full test-cases by adding the detailed test-steps with the
expected result and suggested sample-data
Finally the tests are grouped into test-sets so that they can be assigned to users in batches for
execution and tracking.
However when migrating existing projects into SpiraTeam®, you may need to migrate the test-case list
first, and then add the supporting requirements matrix afterwards.
5.1. Test Case List
When you click on the Testing > Test Cases link on the global navigation bar, you will initially be taken to
the test case list screen illustrated below:
The test case list consists of a hierarchical arrangement of the various test folders and test cases that the
system being developed needs to be able to demonstrate. The structure is very similar to the folder
structure in Microsoft Windows® Explorer, and users will find this very familiar and intuitive to use. When
you create a new project, this list will initially be empty, and you will have to use the <Insert> button to
start adding test folders and test cases to the system.
The list consists of test folders shown with a folder icon and in bold-type, and test cases that are shown
with a document icon and a hyperlink. You can nest test folders and test cases under an existing test
folder, but you cannot nest anything under a test case. All of the items in the list have a name, together
with the most recent execution status (passed, failed or not-run), and owner, author, execution date,
active flag and test case number. Clicking on a test case’s hyperlink will take you to the test case details
page for the item in question (see section 5.2).
© Copyright 2006-2013, Inflectra Corporation
Page 50 of 3
This document contains Inflectra proprietary information
It is important to understand that only test cases are assigned a status themselves; the test folders
instead display a test execution bar graph that illustrates the aggregate execution status of its child testcases. Thus if the test folder contains two test cases, one of which passed, and one of which wasn’t run,
the graph will display 50% green and 50% gray.
To determine the exact aggregate test folder execution status information, position the mouse pointer
over the bar-chart, and the number of tests in each of the execution statuses (passed, failed, not-run,
blocked, caution) will be displayed as a “tooltip”. Note that if you change the owner of a test folder, then
all the child test cases will be assigned the same owner. This allows you to more easily associate entire
folders to test cases to be executed by a specific user.
5.1.1. Insert
Hovering over the <Insert> button brings up a secondary menu that allows you to choose whether to
insert a test case or a test folder (if you just click Insert it defaults to inserting a test case). In either case,
it will insert the new test folder / test case above the currently selected item – i.e. the one whose checkbox has been selected, at the same level in the hierarchy. If you want to insert a new test case or test
folder inside an existing folder, use the Insert > Child Test Case or Insert > Sub Folder option instead. If
you insert a new test folder / test case without first selected an existing item from the list, the new test
case will simply be inserted at the end of the list.
Once the new test folder / test case has been inserted, the item is switched to “Edit” mode so that you
can rename the default name and choose an owner and/or author. Note that all new test cases are
initially set with an execution status of “Not Run”.
5.1.2. Indent / Outdent
Clicking on the <Indent> button indents all the test folders / test cases whose check-boxes have been
selected. You cannot indent a test case or folder if it is below a test case, as test cases are not allowed to
have child items. Clicking on the <Outdent> button de-indents all the test folders / test cases whose
check-boxes have been selected.
5.1.3. Delete
Clicking on the <Delete> button deletes all the test cases and/or test folders whose check-boxes have
been selected. If any of the items are test folders, then all the children are all deleted (whether test cases
or folders). This behavior is similar to that in Microsoft Windows® Explorer.
5.1.4. Execute
Clicking on the <Execute> button executes all the test cases selected, together with all the test cases
contained with any selected test folders. The test execution functionality of SpiraTeam® is explained in
more detail in section 5.3.
5.1.5. Refresh
Clicking on the <Refresh> button simply reloads the test case list. This is useful as other people may be
modifying the list of test cases at the same time as you, or executing specific test cases, and after
stepping away from the computer for a short-time, you should click this button to make sure you are
viewing the most current test case list for the project.
5.1.6. Edit
Each test case in the list has an <Edit> button display in its right-most column. When you click this button
or just double-click on any of the cells in the row, you change the item from “View” mode to “Edit” mode.
The various columns are made editable, and <Update> <Cancel> buttons are displayed in the last
column:
© Copyright 2006-2013, Inflectra Corporation
Page 51 of 3
This document contains Inflectra proprietary information
If you click <Edit> on more than one row, the <Update> and <Cancel> buttons are only displayed on the
first row, and you can make changes to all the editable rows and then update the changes by clicking the
one <Update> button. Also, if you want to make the same change to multiple rows (e.g. to change the
owner of five test cases from “Fred Bloggs” to “Joe Smith”), you can click on the “fill” icon to the right of
the editable item, which will propagate the new value to all editable items in the same column.
If you want to edit lots of items, first select their checkboxes and then click the [Edit] button on the same
row as the Filters and it will switch all the selected items into edit mode.
When you have made your updates, you can either click <Update> to commit the changes, or <Cancel>
to revert back to the original information. Alternatively, pressing the <ENTER> key will commit the
changes and pressing the <ESCAPE> key will cancel the changes.
5.1.7. Show Level
Choosing an indent level from the ‘Show Level’ drop down box allows you to quickly and easily view the
entire test case list at a specific indent level. For example you may want to see all test cases drilled-down
to the third level of detail. To do this you would simply choose ‘Level 3’ from the list, and the test cases
will be expanded accordingly
5.1.8. Show / Hide Columns
This drop-down list allows you to change the fields that are displayed in the test case list as columns for
the current project. To show a column that is not already displayed, simply select that column from the list
of “Show…” column names and to hide an existing column, simply select that column from the list of
“Hide…” column names. This is stored on a per-project basis, so you can have different display settings
for each project that you are a member of. The fields can be any of the built-in fields or any of the custom
properties set up by the project owner.
5.1.9. Filtering
You can easily filter the list of test cases as illustrated in the screen-shot below:
© Copyright 2006-2013, Inflectra Corporation
Page 52 of 3
This document contains Inflectra proprietary information
To filter the list by any of the displayed columns, you either choose an item from the appropriate dropdown list or enter a free-text phrase (depending on the type of field) then click <Filter> or press the
<ENTER> key to apply the different filters. Note that the name field is searched using a “LIKE”
comparison, so that searching for “database” would include any item with the word database in the name.
The other freetext fields need to be exact matches (e.g. dates, test case numbers). In the screen-shot
above, we are filtering on Owner = (None).
In addition, if you have a set of filters that you plan on using on a regular basis, you can choose the option
Filter > Save Filter to add the current filter to the list of saved filters that appear on your ‘My Page’. The
list of saved filters can also be retrieved by clicking Filter > Retrieve Filter:
5.1.10. Copying Test Cases
To copy one or more test cases, simply select the check-boxes of the test cases you want to copy and
then select the Edit > Copy menu option. This will copy the current test case selection to the clipboard.
Then you should select the place where you want the test cases to be inserted and choose the Edit >
Paste option.
The test cases will now be copied into the destination location you specified. The name of the copied test
cases will be prefixed with “Copy of…” to distinguish them from the originals.
5.1.11. Moving Test Cases
To move test cases in the hierarchy, there are two options:
1. Click on the icon the test case/folder you want to move and then drag the icon to the location you
want it moved. The background of the destination location will change as the icon is dragged over
it to illustrate where it will be inserted:
© Copyright 2006-2013, Inflectra Corporation
Page 53 of 3
This document contains Inflectra proprietary information
Once you have the test case/folder positioned at the correct place that you want it inserted, just
release the mouse button and the test case list will be refreshed, with the item moved to the
desired location. To move multiple items simply select their checkboxes and then drag-and-drop
one of the selected items.
2. Alternatively you can simply select the check-boxes of the test cases you want to move and then
select the Edit > Cut menu option. This will cut the current test case selection to the clipboard.
Then you should select the place where you want the test cases to be inserted and choose the
Edit > Paste option. The test cases will now be moved into the destination location you specified.
5.1.12. Exporting Test Cases
To export a test case or set of test cases from the current project to another project in the system, all you
need to do is select the check-boxes of the test case(s) you want to export and then click Tools > Export
Tests. This will then bring up a list of possible destination projects:
Once you have chosen the destination project and clicked the <Export> button, the test cases will be
exported from the current project to the destination project. Any file attachments will also be copied to the
destination project along with the test cases.
© Copyright 2006-2013, Inflectra Corporation
Page 54 of 3
This document contains Inflectra proprietary information
5.1.13. Adding Test Cases to a Release, Test Set or Requirement
To quickly add a series of test cases to a Release, Test Set or Requirement, all you need to do is select
the check-boxes of the appropriate test cases and then click Tools > Add to Release / Test Set /
Requirement. This will then bring up a dialog box displaying either a list of available releases, test sets or
requirements (depending on which option was chosen):
Once you have chosen the destination release / test set / requirement, clicking <Add> will add the
selected test cases to the destination release / test set / requirement.
5.1.14. Viewing the Test Status for a Release
By default, when you view the list of test case cases, it will display an aggregate status for all releases of
the project. I.e. the test list will include all the test cases in the system (regardless of which release they
apply to) and the execution status will reflect the most recent test run – regardless of which release it was
for.
To change the test case list to just display test cases and execution status for a particular release, simply
change the release selected in the drop-down list located below the toolbar (on the right-hand side) from
“Any” to a specific release:
As illustrated in the example above, when the drop-down list is changed to select a specific release, the
list of test cases is filtered to just those mapped to the release in question. In addition, the execution
status for the test releases will only reflect test runs for that specific release (and any child iterations if
applicable). As can be seen in our example, many test cases that have been run for other releases now
show the “Not Run” status since they’ve not been run for this specific release.
As a shortcut, when you select a specific release for viewing, subsequent execution of any of the test
cases via the Tools > Execute menu option will default the test run to the selected release.
© Copyright 2006-2013, Inflectra Corporation
Page 55 of 3
This document contains Inflectra proprietary information
5.1.15. Printing Items
To quickly print a single test case, test folder or list of test cases you can select the items’ checkboxes
and then click Tools > Print Items. This will display a popup window containing a printable version of the
selected items.
5.1.16. Right-Click Context Menu
SpiraTeam® provides a shortcut – called the context menu - for accessing some of the most commonly
used functions, so that you don’t need to move your mouse up to the toolbar each time. To access the
context menu, right-click on any of the rows in the test case list and the following menu will be displayed:
You can now choose any of these options as an alternative to using the icons in the toolbar.
5.2. Test Case Details
When you click on a test case item in the test case list described in section 5.1, you are taken to the test
case details page illustrated below:
This page is made up of three areas; the left pane displays the test list navigation, the top of the right
pane displays the name of the selected test case together with various operation icons, and the bottom of
the right pane displays different tabs with information related to the test case.
The navigation pane consists of a link that will take you back to the test case list, as well as a list of the
peer test case to the one selected. This latter list is useful as a navigation shortcut; you can quickly view
the detailed information of all the peer test cases by clicking on the navigation links without having to first
return to the test cases list page. The navigation list can be switched between three different modes:
•
The list of test cases matching the current filter
© Copyright 2006-2013, Inflectra Corporation
Page 56 of 3
This document contains Inflectra proprietary information
• The list of all test cases, irrespective of the current filter
• The list of test cases assigned to the current user
The top part of the right pane allows you to view and/or edit the details of the particular test case. You can
edit the name and once you are satisfied with any changes to the test case, simply click either the
<Save> or <Save and New> button at the top of the page to commit the changes. In addition you can
delete the current artifact by choosing <Delete>, discard any changes made by clicking <Refresh> or print
it by clicking <Print>.
Using the <Email> button on the toolbar, you can send an email containing details of the test case to an
email address or another user on the system:
You can specify the subject line for the email, and either a list of email addresses, separated by
semicolons, or an existing project user .The content of the email is specified in the System Administration
– Notification Templates.
The lower part of the right pane can be switched between seven different views by clicking the
appropriate tab. Initially the pane will be in “Overview” mode, but it can be switched to “Requirements
Coverage”, “Test Runs”, “Releases”, “Incidents”, “Attachments” and “History” modes if so desired. Each of
the views is described separately below. In addition there is a shortcut icon “Execute” that allows you to
execute this test (see section 5.3) without having to return to the Test Case list.
5.2.1. Overview - Details
In this tab, the right pane displays the description, fields and comments associated with the test case:
The Description section contains the long, formatted description of the test case. You can enter rich text
or paste in from a word processing program or web page.
© Copyright 2006-2013, Inflectra Corporation
Page 57 of 3
This document contains Inflectra proprietary information
5.2.2. Overview - Test Steps
This view displays the name of the test case together with all the defined test steps that a tester would
need to perform to verify that the functionality works as expected. The list of test steps displays the
position number, the description, the expected result, some suggested sample data and the most recent
execution status of the individual test step:
Note: Test steps that are marked with a hyperlink and test case icon (e.g. “Call Login to Application” in the
screen shot above) are in fact linked test cases. Linked test cases are a useful way of reusing existing
test steps from other test cases. For example if you want to have a set of steps be in more than one test
case (e.g. a login step) then you would create a separate test case just containing these steps, then have
all the other test cases just link to it. This avoids the need to have duplicate test steps throughout the
project.
In addition, if you click on the step number hyperlink (e.g. Step 2) you will be taken to the test step details
page which allows you to perform additional editing of a specific test step as well as attach documents,
associate pre-existing incidents and view the change history.
5.2.2.1. Insert Step
Clicking on the <Insert Step> button inserts a new test step before the currently selected (by means of the
check-box) test step. Clicking the <Insert Step> button without selecting a test step will insert a new step
at the end of the list. When a new step is inserted, the fields are displayed in “Edit” mode, so the
description, expected result and sample data fields are editable, allowing you to enter the data:
Once you have entered the necessary information, you can click either <Insert> or <Update> to commit
the changes. If you choose <Insert>, another new row will be inserted which is useful if you intend on
entering lots of rows at once, whereas clicking <Update> will simply commit the current row only.
© Copyright 2006-2013, Inflectra Corporation
Page 58 of 3
This document contains Inflectra proprietary information
5.2.2.2. Insert Link
Clicking on the <Insert Link> button brings up the following dialog box that allows you to choose the test
case to be inserted:
You need to then select the name of the test case you want to insert as a link. If the test case has
declared parameters (see the section on Parameters below for more details) you will be given a list of
parameters that needed to be filled out.
You need to fill out the values of the parameters for the linked test case and then click the <Add> button
to complete the operation. The system will then insert the test case as a link just before the currently
selected test step. If no existing test step was selected, the link will be added at the end of the test step
list.
5.2.2.3. Delete
Clicking on the <Delete> button deletes the currently selected test steps, and reorders the test step
position numbers to close any gaps in numbering.
5.2.2.4. Copy
Clicking on the <Copy> button makes a copy of the current test step or linked test case and inserts the
copied version directly above the original one.
5.2.2.5. Refresh
Clicking on the <Refresh> button simply reloads the list of test steps. This is useful if other people are
making changes to the test list and you want to make sure that you have the most current version.
5.2.2.6. Show / Hide Columns
By default the test step list screen will display the Description, Expected Result and Sample Data fields.
However the Expected Result and Sample Data fields are optional and can be hidden if necessary to
make more space. If you have configured custom properties for test steps, you can use the Show/Hide
features to display one or more of your custom properties instead. These fields will then be editable in this
grid-view.
© Copyright 2006-2013, Inflectra Corporation
Page 59 of 3
This document contains Inflectra proprietary information
5.2.2.7. Editing Test Steps
To modify an existing Test Step you simply need to click on the <Edit> button to the right of the step, or
just double-click on the cells in the row. That will switch the selected row into Edit mode. The various
columns are turned into editable text-boxes, and <Update> <Cancel> buttons are displayed in the last
column:
If you click <Edit> on more than one row, the <Update> and <Cancel> buttons are only displayed on the
first row, and you can make changes to all the editable rows and then update the changes by clicking the
one <Update> button. Also, if you want to make the same change to multiple rows, you can click on the
“fill” icon to the right of the editable item, which will propagate the new value to all editable items in the
same column. When you have made your updates, you can either click <Update> to commit the changes,
or <Cancel> to revert back to the original information.
5.2.2.8. Editing Test Links
To modify an existing Test Link you simply need to click on the <Edit> button to the right of the step, or
just click on the cells in the row. That will open up the special dialog box used for editing the parameter
values associated with a specific linked test case:
This allows you to edit the parameters being passed from the current test step to the linked test case
without having to recreate the test link from scratch. To commit the change click <Update> to close the
dialog box, or click <Cancel> to revert back to the original information.
© Copyright 2006-2013, Inflectra Corporation
Page 60 of 3
This document contains Inflectra proprietary information
5.2.2.9. Moving Test Steps
To move test steps in the list, click on the icon the test step/link you want to move and then drag the icon
to the location you want it moved. The border of the destination location will change as the icon is
dragged over it to illustrate where it will be inserted.
5.2.2.10. Parameters
Test cases can have parameters associated with them. This enables one test case to be called several
times by another test case (as a link) and have different parameters passed in each case, making the
operation different. E.g. you could have a generic “login to application” test case that others call as an
initial step, which could be provided with different login information depending on the calling test case.
To view / change the parameters associated with the current test case, click on the <Parameters> icon in
the toolbar and the list of current parameters will be displayed:
The list of existing parameters is displayed in a grid, followed by the option to add a new parameter and
default value (used when the test case is run directly rather than being called by another test case). You
can delete an existing parameter and also copy the parameter token to your computer’s clipboard. The
latter option is useful so that you can insert the parameter token (in the format ${parameter name}) in the
test step description, expected result or sample data fields and have it converted into the parameter value
during test execution.
5.2.3. Overview - Automation
The Automation section displays any automated test scripts associated with the current test case. There
are three types of automated test:
•
Attached – this is when SpiraTeam physically stores the test script as an attachment in the
system. This is only available for test automation tools that store their test scripts as plain text
files. Examples of such tools are Selenium-RC and Squish.
•
Linked – this is when SpiraTeam stores the location of the test script stored on the automation
host itself or on an external network drive.
•
Repository – This is a special option only available when using Rapise™, the test automation
system from Inflectra. This allows you to store an entire folder of automated test script files in
SpiraTeam and have them linked to the test case.
The screenshot below illustrates a sample Rapise automated test script attached to a test case:
© Copyright 2006-2013, Inflectra Corporation
Page 61 of 3
This document contains Inflectra proprietary information
The automation screen includes the following fields that you should populate when using SpiraTeam® to
store an automated test script:
Automation Engine – this should be the name of the test automation engine that the test script
should be executed with. This list is populated by a system administrator using the administration
section of the application (as described in the SpiraTeam Administration Guide)
Script Type – This should be set to either “attached” or “linked”. If you choose to attach the test
script, the large text box at the bottom will be enabled, allowing you enter/edit the test script
directly in SpiraTeam. If you choose linked, the test script is stored externally and SpiraTeam just
stores a reference to it. The “repository” option is never selectable within SpiraTeam and will be
automatically set by Rapise when it attaches a test script to the test case.
Filename – If you are attaching the test script to the test case then this field just needs to contain
the filename of the test script (no folders or path needed), whereas if you are choosing to link the
test script, you need to follow the exact format that will be expected by the test automation
engine. For details, please refer to the specific test automation engine in the SpiraTest/Team
Automated Test Integration Guide.
Document Type (SpiraTeam only) - This should be set to the document type that you want the
test script associated with.
Document Folder (SpiraTeam only) - This should be set to the document folder that you want
the test script to be stored in.
Version – This should contain the version number of the test script.
Test Script – If you are attaching a test script, this should contain the actual program code for
executing the test script. The language and syntax will be dependent on the test automation
engine being used. If you are linking the test script, this section will be disabled.
Parameters – You can enter the various test case parameters by clicking on this hyperlink. Most
of the automation tools that SpiraTeam integrates with will support the passing of parameter
values from SpiraTeam to the automation tool.
© Copyright 2006-2013, Inflectra Corporation
Page 62 of 3
This document contains Inflectra proprietary information
5.2.4. Overview - Comments
The Comments section allows users to add and view discussions related to the Test Case:
Existing comments are displayed by date (either newest-first or oldest-first) above the text box. To add a
comment to the Test Case, enter your text into the textbox, then click the Save icon to save.
5.2.5. Requirements Coverage
This tab displays the name of the test case together with the requirements coverage information for the
test case in question:
The pane consists of two lists of requirements, the one on the left being the complete hierarchical list of
requirements in the project. The right box (which will initially be empty) contains the list of requirements
mapped to this test case. The requirements in this box include columns for their ID, name and status.
Hovering the mouse over the names of the requirements in either box will display a “tooltip” consisting of
the requirement name, place in the hierarchical structure and a detailed description. Clicking on the
hyperlinks in right-hand box will jump you to the requirement details screen for the requirement in
question (see section 4.2).
To change the coverage for this test case, you use the buttons (Add, Remove, Remove All) positioned
between the two list-boxes. The <Add> button will move the selected requirements from the list of
available on the left to the list of mapped on the right. Similarly the <Remove> and <Remove All> buttons
© Copyright 2006-2013, Inflectra Corporation
Page 63 of 3
This document contains Inflectra proprietary information
will remove either the selected or all the requirements from the right list-box and add them back to the left
list-box.
Finally, as a shortcut you can click the “Create Requirement from This Test Case” link to create a new
requirement in the list of covered requirements that will be automatically linked to this test case. This is
useful when you have created a new test case and want to generate an initial placeholder requirement to
be fleshed-out later.
5.2.6. Test Runs
This view displays the name of the test case together with a list of the previous execution runs that the
test case has been put through. Each test run is listed together with the date of execution, the name of
the test case, the name of the test set (if applicable), the name of the tester, the release/version of the
system that the test was executed against, the overall execution status for the test case in that run and a
link to the actual test run details (see section 5.6). In addition, you can choose to display any of the
custom properties associated with the test run.
The “customize columns” drop-down list allows you to change the fields that are displayed in the test run
list as columns. To show a column that is not already displayed, simply select that column from the list of
“Show…” column names and to hide an existing column, simply select that column from the list of
“Hide…” column names. The displayed columns can be any standard field or custom property.
You can also filter the results by choosing items from the filter options displayed in the sub-header row of
each field and clicking the “Apply Filter” link. In addition, you can quickly sort the list by clicking on one of
the directional arrow icons displayed in the header row of the appropriate field.
5.2.7. Releases
This tab displays the name of the test case together with the release mapping information for the test
case in question:
© Copyright 2006-2013, Inflectra Corporation
Page 64 of 3
This document contains Inflectra proprietary information
The pane consists of two lists of releases/iterations, the one on the left being the complete hierarchical list
of releases and iterations in the project. The right box (which will initially be empty) contains the list of
releases/iterations mapped to this test case. The releases in this box include columns for their ID, name
and active status. Hovering the mouse over the names of the releases/iterations in either box will display
a “tooltip” consisting of the release/iteration name, place in the hierarchical structure and a detailed
description. Clicking on the hyperlinks in right-hand box will jump you to the details screen for the
release/iteration in question (see section 7.2).
To change the release mapping for this test case, you use the buttons (Add, Remove, Remove All)
positioned between the two list-boxes. The <Add> button will move the selected releases from the list of
available on the left to the list of mapped on the right. Similarly the <Remove> and <Remove All> buttons
will remove either the selected or all the releases from the right list-box and add them back to the left listbox.
5.2.8. Incidents
This tab displays the list of incidents associated with the current test case. The incidents will either have
been created during an execution of the test case (and are thereby linked to one of the test runs) or
manually linked to one of the test steps in the test case.
Each incident is listed together with the type, status, priority, name, owner, detector, detection date and a
link to the actual incident details. You can customize the fields that are displayed using the “Show/Hide
Columns” option. In addition, you can perform the following operations:
Refresh – updates the list of incidents from the server, useful if other people are adding incidents
to this release at the same time.
Apply Filter – Applies the entries in the filter boxes to the list of incidents
Clear Filters – Clears the current filter, so that all incidents associated with the current release
are shown.
Edit – Clicking the [Edit] button to the right of the incident allows you to edit the incident inline
directly on this screen.
5.2.9. Attachments
In this tab, the main pane displays the list of documents that have been “attached” to the test case. The
documents can be in any format, though SpiraTeam® will only display the icon for certain known types.
© Copyright 2006-2013, Inflectra Corporation
Page 65 of 3
This document contains Inflectra proprietary information
The attachment list includes the filename that was originally uploaded together with the file-size (in KB),
name of the person who attached it and the date uploaded. In addition, if you position the pointer over the
filename and hold it there for a few seconds, a detailed description is displayed as a tooltip.
To actually view the document, simply click on the filename hyperlink and a new web browser window will
open. Depending on the type of file, this window will either display the document or prompt you for a
place to save it on your local computer. To delete an existing attachment from a test case, simply click the
<Delete> button and the attachment will be removed from the list.
If you are using SpiraPlan or SpiraTeam (but not SpiraTest) you can also choose to include file
attachments stored in a linked version control system (e.g. Subversion, CVS, Perforce, etc.) by selecting
the “Include Source Code Documents” option.
To attach a new document to the test case, you need to first click the “Add New” link to display the new
attachment dialog box:
There are three different types of item that can be attached to a test case:
To upload a file, choose “File” as the type and then click the Browse button and select the file
from your local computer, optionally enter a detailed description then click the <Upload> button.
The document will be copied from your computer and attached to the artifact.
To attach a web-link (URL) to the artifact, you need to choose “URL” as the type and then enter
the fully qualified URL (e.g. http://mywebsite.com?Document=1), an optional description and then
click the <Upload> button to attach the web-link.
To attach a screenshot to the artifact, you need to choose “Screenshot” as the type and then
copy the image to your computer’s clipboard (e.g. on Windows computers, the PRINT SCREEN
button captures the current page and adds to the clipboard). Once the image is in the clipboard,
click on the “Paste image from clipboard” hyperlink and the item will appear in the preview
window. You can then fill in the other fields and click <Upload> to attach the image.
Note: If you are using a non-Windows® computer (e.g. Macintosh®) that doesn’t put file extensions on
filenames (e.g. .xls for an Excel sheet) automatically, then you will need to manually add the file extension
to the filename before uploading if you want it to be displayed with the correct icon in the attachment list.
You can also associate an existing document (that’s already stored in SpiraTeam) with the test case. To
do that, click on the “Add Existing” hyperlink to bring up the add file association dialog box:
© Copyright 2006-2013, Inflectra Corporation
Page 66 of 3
This document contains Inflectra proprietary information
You can then choose to either associate a document stored in the SpiraTeam Documents repository or
(in the case of SpiraPlan/SpiraTeam but not SpiraTest) from the linked source code repository. In either
case you first select the appropriate folder, and then pick the document(s) from the file list on the right. In
the case of a source code file association you can also add a comment.
5.2.10. History
In this tab, the main pane displays the list of changes that have been performed on the test case artifact
since its creation. An example test case change history is depicted below:
The change history displays the date that each change was made, together with the fields that were
changed, the old and new values and the person who made the change. This allows a complete audit trail
to be maintained of all changes in the system. In addition, if you are logged in as a project administrator
you can also click on the “Admin View” hyperlink to revert any unwanted changes.
© Copyright 2006-2013, Inflectra Corporation
Page 67 of 3
This document contains Inflectra proprietary information
5.3. Test Step Details
When you click on one of the hyperlinks next to a test step in the test step list (see above), you will be
taken to the test step details screen illustrated below:
This page is made up of three areas; the left pane is the navigation window, the upper part of the right
pane contains the test step detailed information itself, and the bottom part of the right pane contains
related information about the test step.
The navigation pane consists of a link that will take you back to the test step list, as well as a list of the
peer test steps to the one selected. This latter list is useful as a navigation shortcut; you can quickly view
the detailed information of all the peer test steps by clicking on the navigation links without having to first
return to the test step list page. You can also switch between seeing the list of test steps with the current
filter applier or simply unfiltered.
The top part of the right pane allows you to view and/or edit the details of the particular test step. You can
edit the various fields (description, expected result and sample data) and custom properties. Once you
are satisfied with them, simply click the <Save> button just below the fields to commit the changes. If you
want to add a new test step to the test case, you should click <Save and New> instead.
The lower part of the right pane can be switched between three different views by clicking the appropriate
tab. Initially the pane will be in “Incidents” mode, but it can be switched to “Attachments” and “History”
modes if so desired. Each of the views is described separately below.
5.3.1. Incidents
In this mode, the main pane displays a list of any incidents that are associated with this test step. They
can either be linked indirectly due to being logged during a test run, or directly linked after the fact:
Each incident is listed together with the type, status, priority, name, owner, detector, detection date and a
link to the actual incident details. You can customize the fields that are displayed using the “Show/Hide
Columns” option. In addition, you can perform the following operations:
© Copyright 2006-2013, Inflectra Corporation
Page 68 of 3
This document contains Inflectra proprietary information
Refresh – updates the list of incidents from the server, useful if other people are adding incidents
to this release at the same time.
Apply Filter – Applies the entries in the filter boxes to the list of incidents
Clear Filters – Clears the current filter, so that all incidents associated with the current release
are shown.
Edit – Clicking the [Edit] button to the right of the incident allows you to edit the incident inline
directly on this screen.
To create a new association between this test step and an existing incident, simply click the <Add>
hyperlink which will display the “Add New Association” popup dialog box:
You need to choose the specific incident you want to link to, either by choosing the item from a scrolling
selection box, or entering the ID of the incident directly (if known). In either case you can also add a
comment that explains the rationale for the association.
Finally, to delete an existing incident association (except for those due to test runs) select the check-box
next to its name and click the <Delete> hyperlink. This will only delete the association, not the linked
incident itself.
5.3.2. Attachments
In this mode, the lower section of the screen displays the list of documents that have been “attached” to
the test step. The documents can be in any format, though SpiraTeam® will only display the icon for
certain known types.
The attachment list includes the filename that was originally uploaded together with the file-size (in KB),
name of the person who attached it and the date uploaded. In addition, if you position the pointer over the
filename and hold it there for a few seconds, a detailed description is displayed as a tooltip.
To actually view the document, simply click on the filename hyperlink and a new web browser window will
open. Depending on the type of file, this window will either display the document or prompt you for a
© Copyright 2006-2013, Inflectra Corporation
Page 69 of 3
This document contains Inflectra proprietary information
place to save it on your local computer. To remove an existing attachment from a test step, simply click
the <Remove> button and the attachment will be removed from the list.
If you are using SpiraPlan or SpiraTeam (but not SpiraTest) you can also choose to include file
attachments stored in a linked version control system (e.g. Subversion, CVS, Perforce, etc.) by selecting
the “Include Source Code Documents” option.
To attach a new document to the test step, you need to first click the <Add Attachment> link to display the
new attachment dialog box:
There are three different types of item that can be attached to a test step:
To upload a file, choose “File” as the type and then click the Browse button and select the file
from your local computer, optionally enter a detailed description then click the <Upload> button.
The document will be copied from your computer and attached to the artifact.
To attach a web-link (URL) to the artifact, you need to choose “URL” as the type and then enter
the fully qualified URL (e.g. http://mywebsite.com?Document=1), an optional description and then
click the <Upload> button to attach the web-link.
To attach a screenshot to the artifact, you need to choose “Screenshot” as the type and then
copy the image to your computer’s clipboard (e.g. on Windows computers, the PRINT SCREEN
button captures the current page and adds to the clipboard). Once the image is in the clipboard,
click on the “Paste image from clipboard” hyperlink and the item will appear in the preview
window. You can then fill in the other fields and click <Upload> to attach the image.
Note: If you are using a non-Windows® computer (e.g. Macintosh®) that doesn’t put file extensions on
filenames (e.g. .xls for an Excel sheet) automatically, then you will need to manually add the file extension
to the filename before uploading if you want it to be displayed with the correct icon in the attachment list.
You can also associate an existing document (that’s already stored in SpiraTeam) with the test step. To
do that, click on the “Add Existing” hyperlink to bring up the add file association dialog box:
© Copyright 2006-2013, Inflectra Corporation
Page 70 of 3
This document contains Inflectra proprietary information
You can then choose to either associate a document stored in the SpiraTeam Documents repository or
(in the case of SpiraPlan/SpiraTeam but not SpiraTest) from the linked source code repository. In either
case you first select the appropriate folder, and then pick the document(s) from the file list on the right. In
the case of a source code file association you can also add a comment.
5.3.3. History
In this mode, the main pane displays the list of changes that have been performed on the test step artifact
since its creation. An example test step change history is depicted below:
The change history displays the date that each change was made, together with the fields that were
changed, the old and new values and the person who made the change. This allows a complete audit trail
to be maintained of all changes in the system. In addition, if you are logged in as a project administrator
you can also click on the “Admin View” hyperlink to revert any unwanted changes.
5.4. Execute Test Case(s)
This section describes how a tester can follow the steps defined for a series of test cases and record
what actually happened in the process. In addition, recorded failures of test cases can be used to
automatically generate new incidents that will be added to the incident tracking module (see section 6).
You start test case execution in SpiraTeam by either selecting test cases or test sets on their respective
page(s) and then clicking the <Execute> button, or by clicking the “Execute” link on the test cases / test
sets listed on your personalized home page under “My Test Cases” or “My Test Sets”. If you execute a
test set then the values of the selected release and custom list properties for the test run are
automatically populated from the test set, whereas if you directly execute a test case itself, those values
can be chosen by the tester.
Regardless of the route taken to launch the test execution module, the first screen that will be displayed
will look like the following:
© Copyright 2006-2013, Inflectra Corporation
Page 71 of 3
This document contains Inflectra proprietary information
Before actually executing the test scripts, you need to select the release (and optionally the specific build)
of the system that you will be testing against and any test run custom properties that have been defined
by the project owner. This ensures that the resulting test runs and incidents are associated with the
correct release of the system, and that the test runs are mapped to the appropriate custom properties
(e.g. operating system, platform, browser, etc.).
If you have not configured any releases for the project, then the release drop-down list will be disabled
and the test runs/incidents will not be associated with any particular release. If the test run was launched
from a test set, the release and any list custom properties will be pre-populated from the test set itself and
will not be changeable on this screen (unless they weren’t set by the test set).
Once you have chosen the appropriate release name and/or custom properties, click the <Next> button to
begin executing test steps:
The screen is divided up into four main elements:
The left-hand navigation pane contains the list of test cases and test steps for the currently
executing test case. You can click on the various links to move between the test cases and/or test
steps. In addition, each test case and test step has a colored square next to the name that
indicates its status (green = “Passed”, yellow = “Blocked”, orange = “Caution”, red = “Failed”, gray
= “Not Run”) in the current test run. If any of the steps are marked as “Failed”, ”Blocked”, or
“Caution” then the overall test case is marked with that status; if all the test steps passed, then
© Copyright 2006-2013, Inflectra Corporation
Page 72 of 3
This document contains Inflectra proprietary information
the overall test case is marked as “Passed”; any other case results in the test case being marked
as “Not Run”.
The main pane displays the details of the test case together with the current test step. As the
tester you would read the name and description of the test case, then read the description of the
test step, carry out the instructions on the system you are testing, and then compare the results
with those listed as expected. As described below, depending on how the actual system
responds, you will use the buttons on the page to record what actually happened.
Below the main pane there are two optional sections. The first one allows you to log an incident in
the system associated with the test step. For failures this will typically be used to log a bug
relating to the failure. However even if you pass a step you can still log an incident, which may be
useful for logging non-critical cosmetic items that are not serious enough for a failure to be
recorded. This tab also displays any pre-existing incidents that were associated with the test step
being viewed.
The second tab displays a list of attachments that are related to the current test case and/or test
step. This list initially contains any documents that have been attached to either the test case in
general or the test step in particular. However as you perform the testing, you can attach
additional documents to this list that are relevant to the test results (e.g. screenshots of an error
page); these attached documents will be associated with both the test run itself and any incidents
that are created.
If the expected results are indeed observed, then you simply need to click the <Pass> button to mark the
test step as passed, and advance to the next test step, or if all the steps have passed, you can click
<Pass All> to pass all the steps at once. This is illustrated in the screen shot below:
This will change the icon in the left-hand navigation bar into a green square with a check mark in it. Once
all the test steps have passed, you will be automatically be taken to the first step in the next test; if it is the
last test case being executed, the <Finish> button will be displayed instead.
If the actual results differ from those expected, you need to enter a description of the result observed and
click the <Fail>, <Blocked> or <Caution> button; this is illustrated in the screen-shot below:
© Copyright 2006-2013, Inflectra Corporation
Page 73 of 3
This document contains Inflectra proprietary information
Unlike the <Pass> button, if you don’t enter a description of the actual result, the system will display an
error message and re-prompt you again for input. In the case of a failure, both the individual test step and
the overall test case will be marked with a red square containing a cross. Similarly, in the case of a
blocked test case, they will be marked with a yellow square, and in the case of a caution, they will be
marked with an orange square. Once marking a test step as <Failed>, <Caution>, or <Blocked>, you will
automatically be taken to the first test step in the next test case; or if it is the last test case being
executed, the <Finish> button will be displayed instead.
In addition to logging the failure, you can optionally choose to have the failure automatically result in the
creation of a new incident. This is achieved by opening the Incidents section and entering a name, type,
priority, severity (and any custom properties) for the new incident before clicking the
<Fail/Caution/Blocked> button:
The other information needed for the new incident is automatically populated from the test step details.
The newly created incident will also be linked to the test step, allowing traceability from within the
incidents module. The functionality for managing incidents is described in more detail in section 6.
© Copyright 2006-2013, Inflectra Corporation
Page 74 of 3
This document contains Inflectra proprietary information
If you need to attach documents to the test run (e.g. screenshots of the error message), you just need to
open the Attachments section and then choose the option to upload the necessary documents, attach the
appropriate URLs, or paste in the appropriate screen capture.
Note that the entire test run is saved once you first start execution, so you can always step away from
your computer and then resume testing at a later date by locating the test run on your ‘My Page’ under
‘My Pending Test Runs’ and choosing to resume testing.
5.5. Test Run List
When you click on the Testing > Test Runs global navigation link, you will initially be taken to the test run
list screen illustrated below:
The test run list screen displays all the individual test executions performed in the current project, in a
filterable, sortable grid. The grid displays the test run number together with fields such as execution
status, name, assigned tester, execution date, test set, specified release, etc. The choice of columns
displayed is configurable per-user, per-project, giving extensive flexibility when it comes to viewing and
searching test runs.
In addition, you can view a more detailed description of the test run by positioning the mouse pointer
over the test run name hyperlink and waiting for the popup “tooltip” to appear. If you click on the test run
hyperlink, you will be taken to the test run details page described in the next section. Clicking on any of
the pagination links at the bottom of the page will advance you to the next set of test runs in the list
according to the applied filter and sort-order. There is also a drop-down-list at the bottom of the page
which allows you to specify how many rows should be displayed in each page, helping accommodate
different user preferences.
© Copyright 2006-2013, Inflectra Corporation
Page 75 of 3
This document contains Inflectra proprietary information
5.5.1. Sorting and Filtering
You can easily filter and sort the list of test runs as illustrated in the screen-shot below:
To filter the list by any of the visible fields, you simply choose an item from the appropriate drop-down list,
and for the other fields, you enter a free-text phrase then click <Filter> or press the <ENTER> key to
apply the different filters. Note that the name field is searched using a “LIKE” comparison, so that
searching for “database” would include any item with the word database in the name.
To change the column that is sorted, or to change the direction of the current sort, simply click on the
up/down arrow icon in the appropriate column. The currently sorted column is indicated by the larger,
white arrow with the back-border. In the screen-shot above, we have filtered on test runs that have failed,
sorted in order of increasing release version number.
Clicking on Filter > Clear Filter removes any set filters and expands the test run list to display all test runs
for the current project, and clicking on Filter > Save Filter allows you to save the filter to your ‘My Page’
for use in the future. The list of saved filters can also be retrieved by clicking Filter > Retrieve Filter.
5.5.2. Printing Items
To quickly print a single test run or list of test runs you can select the items’ checkboxes and then click
the Print icon. This will display a popup window containing a printable version of the selected items.
5.6. Test Run Details
When you click on any of the individual test runs in the test run list, you are taken to the Test Run details
page (not to be confused with the Test Case details page!) shown below:
© Copyright 2006-2013, Inflectra Corporation
Page 76 of 3
This document contains Inflectra proprietary information
This page consists of three panes:
The left hand navigation pane displays a list of related test runs. The display dropdown will let you
choose whether the list contains test runs that are for the same release, test case or test set, or
are just a filtered/unfiltered list based on your last search in the main test run list page.
The main pane displays the details of the test run itself (name, description, release, test set,
estimated and actual duration, tester name, test run type, automation host, etc.). Underneath it
also displays the list of test run steps, and any console output from a test automation engine such
as Rapise, NUnit, JUnit, QTP, or Selenium.
The tab-control displays the list of list of any documents/URLs/screenshots that were attached to
the test results and any incidents that are associated with this test run.
5.6.1. Editing a Test Run
When reviewing the test run, you may find that you need to change the results of the test run (e.g. the
user selected the wrong release or custom property value). Many of the fields are editable at a later date,
and to make changes, just modify the appropriate fields and click [Save].
5.6.2. Deleting the Test Run
If you need to delete a test run that was erroneously captured, all you need to do is click on the link to
access the invalid test run and then click the <Delete> button to remove it from the system. This will then
force the system to update the status of the test case itself from the other logged test runs.
5.6.3. Test Run Steps
In the case of a manual test run, this section displays all the steps of the test case as they appeared
during the test run in question. This means that if the test steps were changed after running the test, the
list here will reflect the original information.
Each test run step is displayed along with the description, expected result, suggested sample data, a link
back to the current version of the test step in question, the actual result and the execution status for this
step in this particular test run. Where an actual result was recorded, you will have an additional hyperlink
“View Incidents” displayed. This allows you to view any incidents that are associated with this particular
test run step:
© Copyright 2006-2013, Inflectra Corporation
Page 77 of 3
This document contains Inflectra proprietary information
Clicking on the link will open up a popup dialog box that displays a list of all the incidents associated with
the selected test run step. Each of the incidents listed will reflect the most up-to-date information
regarding that incident, including its type, status, priority, name, assigned owner, detection date and who
first detected it. Clicking on the incident number hyperlink will take you to the details page for that
incident, which is described in section 6.2.
5.6.4. Console Output
In the case of an automated test run, this tab will display the details of the test run as reported from the
test runner application. These details will vary depending on the type of automated tool being used, but
typically they include the name of the automated test runner, the number of assertions raised, the name
of the corresponding test case in the tool, the status of the test run and a detailed error message, and
stack-trace in the case of a failure. An example test run as reported from the NUnit automated test runner
is illustrated below:
Details on how to use SpiraTeam® in conjunction with an automated testing tool are provided in the
®
SpiraTeam® Automated Testing Integration Guide, which can be downloaded from the Inflectra website.
5.6.5. Attachments
In this mode, the lower section of the screen displays the list of documents that have been “attached” to
the test run. The documents can be in any format, though SpiraTeam® will only display the icon for
certain known types.
The attachment list includes the filename that was originally uploaded together with the file-size (in KB),
name of the person who attached it and the date uploaded. In addition, if you position the pointer over the
filename and hold it there for a few seconds, a detailed description is displayed as a tooltip.
To actually view the document, simply click on the filename hyperlink and a new web browser window will
open. Depending on the type of file, this window will either display the document or prompt you for a
place to save it on your local computer. To remove an existing attachment from a test run, simply click the
<Remove> button and the attachment will be removed from the list.
© Copyright 2006-2013, Inflectra Corporation
Page 78 of 3
This document contains Inflectra proprietary information
If you are using SpiraPlan or SpiraTeam (but not SpiraTest) you can also choose to include file
attachments stored in a linked version control system (e.g. Subversion, CVS, Perforce, etc.) by selecting
the “Include Source Code Documents” option.
To attach a new document or web link to the test run, you need to click on the “Add New” hyperlink to
open the “Add Attachment” dialog box. There are three different types of item that can be attached to a
test run:
To upload a file, choose “File” as the type and then click the Browse button and select the file
from your local computer, optionally enter a detailed description then click the <Upload> button.
The document will be copied from your computer and attached to the artifact.
To attach a web-link (URL) to the artifact, you need to choose “URL” as the type and then enter
the fully qualified URL (e.g. http://mywebsite.com?Document=1), an optional description and then
click the <Upload> button to attach the web-link.
To attach a screenshot to the artifact, you need to choose “Screenshot” as the type and then
copy the image to your computer’s clipboard (e.g. on Windows computers, the PRINT SCREEN
button captures the current page and adds to the clipboard). Once the image is in the clipboard,
click on the “Paste image from clipboard” hyperlink and the item will appear in the preview
window. You can then fill in the other fields and click <Upload> to attach the image.
Note: If you are using a non-Windows® computer (e.g. Macintosh®) that doesn’t put file extensions on
filenames (e.g. .xls for an Excel sheet) automatically, then you will need to manually add the file extension
to the filename before uploading if you want it to be displayed with the correct icon in the attachment list.
You can also associate an existing document (that’s already stored in SpiraTeam) with the test run. To do
that, click on the “Add Existing” hyperlink to bring up the add file association dialog box. You can then
choose to either associate a document stored in the SpiraTeam Documents repository or (in the case of
SpiraPlan/SpiraTeam but not SpiraTest) from the linked source code repository. In either case you first
select the appropriate folder, and then pick the document(s) from the file list on the right. In the case of a
source code file association you can also add a comment.
5.6.6. Incidents
This tab displays the list of incidents associated with the current test run. The incidents will have been
logged during the creation of the test run and will be linked to one of the steps in the test run:
Each incident is listed together with the type, status, priority, name, owner, detector, detection date and a
link to the actual incident details. You can customize the fields that are displayed using the “Show/Hide
Columns” option. In addition, you can perform the following operations:
Refresh – updates the list of incidents from the server, useful if other people are adding incidents
to this release at the same time.
Apply Filter – Applies the entries in the filter boxes to the list of incidents
Clear Filters – Clears the current filter, so that all incidents associated with the current release
are shown.
© Copyright 2006-2013, Inflectra Corporation
Page 79 of 3
This document contains Inflectra proprietary information
Edit – Clicking the [Edit] button to the right of the incident allows you to edit the incident inline
directly on this screen.
5.7. Test Set List
As well as being able to organize test cases into folders, you can also create separate groupings of test
cases called test sets which can then be assigned to testers as a package. To view the list of test sets for
a project, click on Testing > Test Sets in the global navigation:
The test set list consists of hierarchical list of all the test sets in the current project organized into folders.
When you create a new project, this list will initially be empty, and you will have to use the <Insert> button
to start adding test sets to the system.
Each test set is listed along with the number of test cases contained (in parenthesis), the aggregate
execution status of the contained test cases (using a graphical bar-chart), the date that the test set has
been scheduled to be executed (planned date), the date that it was last executed, the person currently
assigned to execute the test set, the status and the test set id. Clicking on a test set’s hyperlink will take
you to the test set details page for the item in question.
5.7.1. Insert
Hovering over the <Insert> button brings up a secondary menu that allows you to choose whether to
insert a test set or a test set folder (if you just click Insert it defaults to inserting a test set). In either case,
it will insert the new folder / test set above the currently selected item – i.e. the one whose check-box has
been selected, at the same level in the hierarchy. If you want to insert a new test set or sub-folder inside
an existing folder, use the Insert > Child Test Set or Insert > Sub Folder option instead. If you insert a new
folder / test set without first selected an existing item from the list, the new test set will simply be inserted
at the end of the list.
5.7.2. Indent / Outdent
Clicking on the <Indent> button indents all the test folders / test sets whose check-boxes have been
selected. You cannot indent a test set or folder if it is below a test set, as test sets are not allowed to have
child items. Clicking on the <Outdent> button de-indents all the test folders / test sets whose check-boxes
have been selected.
© Copyright 2006-2013, Inflectra Corporation
Page 80 of 3
This document contains Inflectra proprietary information
5.7.3. Delete
Clicking on the <Delete> button deletes the currently selected test sets. It will delete the association
between the test set and its contained test cases, but it will not delete the test cases themselves.
5.7.4. Execute
Clicking on the <Execute> button executes all the test sets selected. The test execution functionality of
SpiraTeam® is explained in more detail in section 5.3.
5.7.5. Refresh
Clicking on the <Refresh> button simply reloads the list of test sets. This is useful if other people are
making changes to the test set list and you want to make sure that you have the most current version.
5.7.6. Edit
Each test set in the list has an <Edit> button display in its right-most column. When you click this button
or just double-click on any of the cells in the row, you change the item from “View” mode to “Edit” mode.
The various columns are made editable, and <Update> <Cancel> buttons are displayed in the last
column:
If you click <Edit> on more than one row, the <Update> and <Cancel> buttons are only displayed on the
first row, and you can make changes to all the editable rows and then update the changes by clicking the
one <Update> button. Also, if you want to make the same change to multiple rows (e.g. to change the
owner of five test sets from “Fred Bloggs” to “Joe Smith”), you can click on the “fill” icon to the right of the
editable item, which will propagate the new value to all editable items in the same column.
If you want to edit lots of items, first select their checkboxes and then click the [Edit] button on the same
row as the Filters and it will switch all the selected items into edit mode.
When you have made your updates, you can either click <Update> to commit the changes, or <Cancel>
to revert back to the original information. Alternatively, pressing the <ENTER> key will commit the
changes and pressing the <ESCAPE> key will cancel the changes.
5.7.7. Show Level
Choosing an indent level from the ‘Show Level’ drop down box allows you to quickly and easily view the
entire test set list at a specific indent level. For example you may want to see all test sets drilled-down to
the third level of detail. To do this you would simply choose ‘Level 3’ from the list, and the test sets will be
expanded accordingly
5.7.8. Show / Hide Columns
This drop-down list allows you to change the fields that are displayed in the test set list as columns for the
current project. To show a column that is not already displayed, simply select that column from the list of
© Copyright 2006-2013, Inflectra Corporation
Page 81 of 3
This document contains Inflectra proprietary information
“Show…” column names and to hide an existing column, simply select that column from the list of
“Hide…” column names. This is stored on a per-project basis, so you can have different display settings
for each project that you are a member of. The fields can be any of the built-in fields or any of the custom
properties set up by the project owner.
5.7.9. Filtering
You can easily filter the list of test sets as illustrated in the screen-shot below:
To filter the list by any of the displayed columns, you either choose an item from the appropriate dropdown list or enter a free-text phrase (depending on the type of field) then click <Filter> or press the
<ENTER> key to apply the different filters. Note that the name field is searched using a “LIKE”
comparison, so that searching for “database” would include any item with the word database in the name.
The other freetext fields need to be exact matches (e.g. dates, test set numbers). In the screen-shot
above, we are filtering on test sets that contain at least one failed test case.
In addition, if you have a set of filters that you plan on using on a regular basis, you can choose the option
Filter > Save Filter to add the current filter to the list of saved filters that appear on your ‘My Page’. The
list of saved filters can also be retrieved by clicking Filter > Retrieve Filter.
5.7.10. Copying Test Sets
To copy one or more test sets, simply select the check-boxes of the test sets you want to copy and then
select the Edit > Copy menu option. This will copy the current test set selection to the clipboard. Then you
should select the place where you want the test sets to be inserted and choose the Edit > Paste option.
The test sets will now be copied into the destination location you specified. The name of the copied test
sets will be prefixed with “Copy of…” to distinguish them from the originals.
5.7.11. Moving Test Sets
To move test sets in the hierarchy, there are two options:
1. Click on the icon the test set/folder you want to move and then drag the icon to the location you
want it moved. The background of the destination location will change as the icon is dragged over
it to illustrate where it will be inserted.
Once you have the test set/folder positioned at the correct place that you want it inserted, just
release the mouse button and the test set list will be refreshed, with the item moved to the
desired location. To move multiple items simply select their checkboxes and then drag-and-drop
one of the selected items.
2. Alternatively you can simply select the check-boxes of the test sets you want to move and then
select the Edit > Cut menu option. This will cut the current test set selection to the clipboard.
Then you should select the place where you want the test sets to be inserted and choose the Edit
> Paste option. The test sets will now be moved into the destination location you specified.
© Copyright 2006-2013, Inflectra Corporation
Page 82 of 3
This document contains Inflectra proprietary information
5.7.12. Printing Items
To quickly print a single test set, test set folder or list of test sets you can select the items’ checkboxes
and then click Tools > Print Items. This will display a popup window containing a printable version of the
selected items.
5.7.13. Right-Click Context Menu
SpiraTeam® provides a shortcut – called the context menu - for accessing some of the most commonly
used functions, so that you don’t need to move your mouse up to the toolbar each time. To access the
context menu, right-click on any of the rows in the test set list and the following menu will be displayed:
You can now choose any of these options as an alternative to using the icons in the toolbar.
5.8. Test Set Details
When you click on a test set item in the test set list described in the previous section, you are taken to the
test set details page illustrated below:
This page is made up of three areas; the left pane displays the test set list navigation, the top of the right
pane displays the name of the selected test set together with various operation icons, and the bottom of
the right pane displays different tabs with information related to the test set.
The navigation pane consists of a link that will take you back to the test set list, as well as a list of the
peer test sets to the one selected. This latter list is useful as a navigation shortcut; you can quickly view
© Copyright 2006-2013, Inflectra Corporation
Page 83 of 3
This document contains Inflectra proprietary information
the detailed information of all the peer test sets by clicking on the navigation links without having to first
return to the test sets list page. The navigation list can be switched between three different modes:
• The list of test sets matching the current filter
• The list of all test sets, irrespective of the current filter
• The list of test sets assigned to the current user
The top part of the right pane allows you to view and/or edit the details of the particular test set. You can
edit the name and once you are satisfied any changes to the test set, click either the <Save> or <Save
and New> button at the top of the page to commit the changes. In addition you can delete the current
artifact by choosing <Delete>, discard any changes made by clicking <Refresh> or print it by clicking
<Print>.
Test Sets can be specified as being either for “Manual” or “Automated” test runs. If you choose Manual,
then the test set can be executed by a tester from their “My Page.” However if you choose “Automated”,
the test set will be executed by the automation host you specified. In this case, the planned date and time
will be used by the automated test engine to know when to execute the automated test scripts. For
manual test sets, only the date component is used. In addition, you can specify a recurrence schedule for
the test set by changing the recurrence dropdown from “One Time” to “Hourly”, “Daily”, etc. so that
SpiraTeam executes the same test set according to the specified frequency.
The lower part of the right pane can be switched between different views by clicking the appropriate tab.
Initially the pane will be in “Overview” mode, but it can be switched to “Test Runs”, “Attachments”,
“Incidents” and “History” modes if so desired. Each of the views is described separately below. In addition
there is a shortcut icon “Execute” that allows you to execute all the tests in the set against the release
specified in the test set.
5.8.1. Overview – Details
In this tab, the right pane displays the description, fields and comments associated with the test set. The
top part of this tab displays the various standard fields and custom properties associated with the test set.
The Description section contains the long, formatted description of the test set. You can enter rich text or
paste in from a word processing program or web page. The “Planned Date” field lets you specify the date
and time to execute the test using the popup time picker:
© Copyright 2006-2013, Inflectra Corporation
Page 84 of 3
This document contains Inflectra proprietary information
5.8.2. Overview - Comments
The Comments section allows users to add and view discussions relating to the test set:
Existing comments are displayed in order above the textbox in date order (either newest-first or oldestfirst). To add a new comment, simply enter it into the textbox, and click the Save icon.
5.8.3. Overview - Test Cases
This section displays the list of test cases contained within the test set. You can add, remove, reposition
and remove test cases from the list. The execution status displayed next to each test case is the most
recent execution status of the test case when run in the context of the current test set.
To move the test cases, you simply need to click the test case icon and drag it to the appropriate position
in the list. Whilst you are dragging the icon, the border in the list will change color to indicate where it will
be moved to.
To modify an existing Test Case you simply need to click on the <Edit> button in the right-most column,
or just double-click on the cells in the row. That will switch the selected row into Edit mode. The owner
© Copyright 2006-2013, Inflectra Corporation
Page 85 of 3
This document contains Inflectra proprietary information
field can then be set at the test case level. This is useful in situations where you want the different test
cases in the set to be executed by different testers (e.g. in integrated, scenario tests)
To add a new test case to the Test Set, you need to click on the “Add Test Cases” hyperlink to display the
popup dialog box:
You can then select the checkboxes of the individual test cases or whole folders of test cases that you
want to add to the test set. Once you have selected the desired items, click the <Add> button to actually
add them to the test set.
Test cases in SpiraTeam can have parameters defined which are available to specify the text that should
be used to replace certain tokens in the test case. In addition these parameters may be used by certain
test automation engines. In addition to being able to specify the parameter values when linking the test
cases as test steps of a parent test case, you can also specify the parameter values from the Test Set.
To view/edit the parameter values being set by the test case, you should either select the checkbox of a
test set and click “Edit Parameters” at the top of the section, or right-click on the test case and choose
“Edit Parameters”:
© Copyright 2006-2013, Inflectra Corporation
Page 86 of 3
This document contains Inflectra proprietary information
You can then specify the values of the parameters that the test set will pass to the test case. Once you
have entered / modified the values, click [Update] to commit the changes.
5.8.4. Test Runs
This tab displays the list of all the test runs executed against the test set. Each test run is listed together
with the date of execution, the name of the test case, the name of the tester, the release/version of the
system that the test was executed against, the overall execution status for the test case in that run and a
link to the actual test run details (see section 5.6). In addition, you can choose to display any of the
custom properties associated with the test run.
The “customize columns” drop-down list allows you to change the fields that are displayed in the test run
list as columns. To show a column that is not already displayed, simply select that column from the list of
“Show…” column names and to hide an existing column, simply select that column from the list of
“Hide…” column names. The displayed columns can be any standard field or custom property.
You can also filter the results by choosing items from the filter options displayed in the sub-header row of
each field and clicking the “Apply Filter” link. In addition, you can quickly sort the list by clicking on one of
the directional arrow icons displayed in the header row of the appropriate field.
5.8.5. Attachments
In this mode, the main pane displays the list of documents that have been “attached” to the test set. The
documents can be in any format, though SpiraTeam® will only display the icon for certain known types.
© Copyright 2006-2013, Inflectra Corporation
Page 87 of 3
This document contains Inflectra proprietary information
The attachment list includes the filename that was originally uploaded together with the file-size (in KB),
name of the person who attached it and the date uploaded. In addition, if you position the pointer over the
filename and hold it there for a few seconds, a detailed description is displayed as a tooltip.
To actually view the document, simply click on the filename hyperlink and a new web browser window will
open. Depending on the type of file, this window will either display the document or prompt you for a
place to save it on your local computer. To remove an existing attachment from a test set, simply click the
<Remove> button and the attachment will be removed from the list.
If you are using SpiraPlan or SpiraTeam (but not SpiraTest) you can also choose to include file
attachments stored in a linked version control system (e.g. Subversion, CVS, Perforce, etc.) by selecting
the “Include Source Code Documents” option.
To attach a new document or web link to the test set, you need to click on the “Add New” hyperlink to
open the “Add Attachment” dialog box.
There are three different types of item that can be attached to a test set:
To upload a file, choose “File” as the type and then click the Browse button and select the file
from your local computer, optionally enter a detailed description then click the <Upload> button.
The document will be copied from your computer and attached to the artifact.
To attach a web-link (URL) to the artifact, you need to choose “URL” as the type and then enter
the fully qualified URL (e.g. http://mywebsite.com?Document=1), an optional description and then
click the <Upload> button to attach the web-link.
To attach a screenshot to the artifact, you need to choose “Screenshot” as the type and then
copy the image to your computer’s clipboard (e.g. on Windows computers, the PRINT SCREEN
button captures the current page and adds to the clipboard). Once the image is in the clipboard,
click on the “Paste image from clipboard” hyperlink and the item will appear in the preview
window. You can then fill in the other fields and click <Upload> to attach the image.
Note: If you are using a non-Windows® computer (e.g. Macintosh®) that doesn’t put file extensions on
filenames (e.g. .xls for an Excel sheet) automatically, then you will need to manually add the file extension
to the filename before uploading if you want it to be displayed with the correct icon in the attachment list.
You can also associate an existing document (that’s already stored in SpiraTeam) with the test set. To do
that, click on the “Add Existing” hyperlink to bring up the add file association dialog box:
© Copyright 2006-2013, Inflectra Corporation
Page 88 of 3
This document contains Inflectra proprietary information
You can then choose to either associate a document stored in the SpiraTeam Documents repository or
(in the case of SpiraPlan/SpiraTeam but not SpiraTest) from the linked source code repository. In either
case you first select the appropriate folder, and then pick the document(s) from the file list on the right. In
the case of a source code file association you can also add a comment.
5.8.6. Incidents
This tab displays the list of incidents associated with the current test set. The incidents will either have
been created during an execution of a test case in the test set (and are thereby linked to one of the test
runs) or manually linked to one of the test steps in a test case in the set.
5.8.7. History
In this mode, the main pane displays the list of changes that have been performed on the test set artifact
since its creation. The change history displays the date that each change was made, together with the
fields that were changed, the old and new values and the person who made the change. This allows a
complete audit trail to be maintained of all changes in the system. In addition, if you are logged in as a
project administrator you can also click on the “Admin View” hyperlink to revert any unwanted changes.
5.9. Automation Host List
This section outlines how to use the Automation Host Management features of SpiraTeam® to manage
the different host systems that will be running automated tests in your environment. Typically when
scheduling automated tests you will want to execute the same tests on multiple computers running
different environments.
SpiraTeam allows you to build a master list of automation hosts in each project, which can be used to
schedule test sets containing automated test cases against. Please refer to the Test Set section of this
manual for more information on managing and scheduling test sets.
© Copyright 2006-2013, Inflectra Corporation
Page 89 of 3
This document contains Inflectra proprietary information
When you click on the Testing > Automation Hosts global navigation link, you will initially be taken to the
automation host list screen illustrated below:
The automation host list screen displays all the automation hosts entered for the current project, in a
filterable, sortable grid. The grid displays the automation host ID together with fields such as name,
description, last modified, token, and any custom properties. The choice of columns displayed is
configurable per-user, per-project, giving extensive flexibility when it comes to viewing and searching
automation hosts.
In addition, you can view a more detailed description of the automation host by positioning the mouse
pointer over the host name hyperlink and waiting for the popup “tooltip” to appear. If you click on the host
name hyperlink, you will be taken to the automation host details page described in section 5.9.2. Clicking
on any of the pagination links at the bottom of the page will advance you to the next set of hosts in the list
according to the applied filter and sort-order. There is also a drop-down-list at the bottom of the page
which allows you to specify how many rows should be displayed in each page, helping accommodate
different user preferences.
One special column that is unique to automation hosts is the “Token” field. This needs to contain a short
textual identifier that uniquely identifies each automation host in the project. This will be used by each
host computer to identify itself to SpiraTeam.
5.9.1. Sorting and Filtering
You can easily filter and sort the list of automation hosts as illustrated in the screen-shot below:
To filter the list by one of the displayed fields, you simply choose an item from the appropriate drop-down
list or enter a free-text phrase then click <Filter> or press the <ENTER> key to apply the different filters.
Note that the name field is searched using a “LIKE” comparison, so that searching for “database” would
include any item with the word database in the name. The other freetext fields need to be exact matches
(e.g. dates, incident numbers).
To change the column that is sorted, or to change the direction of the current sort, simply click on the
up/down arrow icon in the appropriate column. The currently sorted column is indicated by the larger,
white arrow with the back-border.
Clicking on Filter > Clear Filter removes any set filters and expands the host list to display all automation
hosts in the current project, and clicking on Filter > Save Filter allows you to save the filter to your ‘My
Page’ for use in the future. The list of saved filters can also be retrieved by clicking Filter > Retrieve Filter.
© Copyright 2006-2013, Inflectra Corporation
Page 90 of 3
This document contains Inflectra proprietary information
5.9.2. New Host
Clicking on the <New Host> button adds a new automation host to the list with a default name and token.
5.9.3. Delete
Clicking on the <Delete> button deletes the automation hosts whose check-boxes have been selected in
the host list.
5.9.4. Refresh
Clicking on the <Refresh> button simply reloads the list of automation hosts; this is useful when new
hosts are being added by other users, and you want to make sure you have the most up-to-date list
displayed.
5.9.5. Show / Hide Columns
This drop-down list allows you to change the fields that are displayed in the host list as columns for the
current project. To show a column that is not already displayed, simply select that column from the list of
“Show…” column names and to hide an existing column, simply select that column from the list of
“Hide…” column names. This is stored on a per-project basis, so you can have different display settings
for each project that you are a member of. The fields can be any of the built-in fields or any of the custom
properties set up by the project owner.
5.9.6. Edit
Each automation host in the list has an <Edit> button display in its right-most column. When you click this
button or just double-click on any of the cells in the row, you change the item from “View” mode to “Edit”
mode. The various columns are made editable, and <Update> <Cancel> buttons are displayed in the last
column
If you click <Edit> on more than one row, the <Update> and <Cancel> buttons are only displayed on the
first row, and you can make changes to all the editable rows and then update the changes by clicking the
one <Update> button. Also, if you want to make the same change to multiple rows (e.g. to change five
automation hosts from Active = No to Active = Yes), you can click on the “fill” icon to the right of the
editable item, which will propagate the new value to all editable items in the same column.
If you want to edit lots of items, first select their checkboxes and then click the [Edit] button on the same
row as the Filters and it will switch all the selected items into edit mode.
When you have made your updates, you can either click <Update> to commit the changes, or <Cancel>
to revert back to the original information. Alternatively, pressing the <ENTER> key will commit the
changes and pressing the <ESCAPE> key will cancel the changes.
5.10. Automation Host Details
When you click on an automation host entry in the host list, you are taken to the automation host details
page illustrated below:
© Copyright 2006-2013, Inflectra Corporation
Page 91 of 3
This document contains Inflectra proprietary information
This page is made up of three areas; the left pane is the navigation window, the upper part of the right
pane contains the automation host detailed information itself, and the bottom part of the right pane
displays different information associated with the automation host.
The navigation pane consists of a link that will take you back to the host list, as well as a list of the peer
automation hosts to the one selected. This latter list is useful as a navigation shortcut; you can quickly
view the peer hosts by clicking on the navigation links without having to first return to the host list page.
The navigation list can be switched between two different modes:
•
The list of hosts matching the current filter
•
The list of all hosts, irrespective of the current filter
The top part of the right pane allows you to view and/or edit the details of the particular automation host.
You can edit the various fields (name, description, token, etc.) and custom properties. Once you are
satisfied with the changes, simply click either the <Save> or <Save and New> button at the top of the
page to commit the changes. In addition you can delete the current artifact by choosing <Delete>, or
discard any changes made by clicking <Refresh>.
5.10.1. Test Runs
This view displays the list of all the test runs executed against the automation host. Each test run is listed
together with the date of execution, the name of the test case, the name of the tester, the release/version
of the system that the test was executed against, the name of the test set (if applicable), the overall
execution status for the test case in that run and a link to the actual test run details (see section 5.6). In
addition, you can choose to display any of the custom properties associated with the test run.
The “customize columns” drop-down list allows you to change the fields that are displayed in the test run
list as columns. To show a column that is not already displayed, simply select that column from the list of
“Show…” column names and to hide an existing column, simply select that column from the list of
“Hide…” column names. The displayed columns can be any standard field or custom property.
© Copyright 2006-2013, Inflectra Corporation
Page 92 of 3
This document contains Inflectra proprietary information
You can also filter the results by choosing items from the filter options displayed in the sub-header row of
each field and clicking the “Apply Filter” link. In addition, you can quickly sort the list by clicking on one of
the directional arrow icons displayed in the header row of the appropriate field.
5.10.2. Attachments
In this mode, the main pane displays the list of documents, screenshots or web-links (URLs) that have
been “attached” to the automation host. The documents can be in any format, though SpiraTeam® will
only display the icon for certain known types.
If you are using SpiraPlan or SpiraTeam (but not SpiraTest) you can also choose to include file
attachments stored in a linked version control system (e.g. Subversion, CVS, Perforce, etc.) by selecting
the “Include Source Code Documents” option.
To attach a new document to the automation host, you need to first click the “Add New” hyperlink to
display the new attachment dialog box. There are three different types of item that can be attached to an
automation host:
To upload a file, choose “File” as the type and then click the Browse button and select the file
from your local computer, optionally enter a detailed description then click the <Upload> button.
The document will be copied from your computer and attached to the artifact.
To attach a web-link (URL) to the artifact, you need to choose “URL” as the type and then enter
the fully qualified URL (e.g. http://mywebsite.com?Document=1), an optional description and then
click the <Upload> button to attach the web-link.
To attach a screenshot to the artifact, you need to choose “Screenshot” as the type and then
copy the image to your computer’s clipboard (e.g. on Windows computers, the PRINT SCREEN
button captures the current page and adds to the clipboard). Once the image is in the clipboard,
click on the “Paste image from clipboard” hyperlink and the item will appear in the preview
window. You can then fill in the other fields and click <Upload> to attach the image.
Note: If you are using a non-Windows® computer (e.g. Macintosh®) that doesn’t put file extensions on
filenames (e.g. .xls for an Excel sheet) automatically, then you will need to manually add the file extension
to the filename before uploading if you want it to be displayed with the correct icon in the attachment list.
You can also associate an existing document (that’s already stored in SpiraTeam) with the automation
host. To do that, click on the “Add Existing” hyperlink to bring up the add file association dialog box. You
can then choose to either associate a document stored in the SpiraTeam Documents repository or (in the
case of SpiraPlan/SpiraTeam but not SpiraTest) from the linked source code repository. In either case
you first select the appropriate folder, and then pick the document(s) from the file list on the right. In the
case of a source code file association you can also add a comment.
5.10.3. History
In this mode, the main pane displays the list of changes that have been performed on the automation host
artifact since its creation. The change history displays the date that each change was made, together with
the fields that were changed, the old and new values and the person who made the change. This allows a
complete audit trail to be maintained of all changes in the system. In addition, if you are logged in as a
project administrator you can also click on the “Admin View” hyperlink to revert any unwanted changes.
© Copyright 2006-2013, Inflectra Corporation
Page 93 of 3
This document contains Inflectra proprietary information
6. Incident Tracking
This section outlines how the incident/defect tracking features of SpiraTeam® can be used to manage
key project artifacts during the software development lifecycle. In addition to managing the defects raised
during the execution of test cases in the test management module, the Incident Tracker is also a powerful
risk/issue/bug tracking system in its own right. When coupled with the project dashboard (see section 3.4)
it is a powerful tool for representing all the key risks and issues associated with a project in a single,
graphical format.
Unlike a standalone bug/issue tracking tool however, you can trace the incidents/defects back to the test
case and the underlying requirement that generated them, giving the project manager unprecedented
power in analyzing the “in-process” quality of a system during its lifecycle. This power is clearly illustrated
in the “Requirement Incident Count” pane in the Project Home dashboard (see section 3.4.4).
6.1. Incident List
When you click on the Tracking > Incidents global navigation link, you will initially be taken to the
incidents list screen illustrated below:
The incident list screen displays all the incidents entered for the current project, in a filterable, sortable
grid. The grid displays the incident number together with fields such as incident type (bug, issue, risk,
etc.), status (new, open, etc.), priority, name, assigned owner, detection date, detector, closed date, etc.
The choice of columns displayed is configurable per-user, per-project, giving extensive flexibility when it
comes to viewing and searching incidents.
In addition, you can view a more detailed description of the incident (along with a resolution if any) by
positioning the mouse pointer over the incident name hyperlink and waiting for the popup “tooltip” to
appear. If you click on the incident name hyperlink, you will be taken to the incident details page
described in section 6.2. Clicking on any of the pagination links at the bottom of the page will advance
you to the next set of incidents in the list according to the applied filter and sort-order. There is also a
drop-down-list at the bottom of the page which allows you to specify how many rows should be displayed
in each page, helping accommodate different user preferences.
© Copyright 2006-2013, Inflectra Corporation
Page 94 of 3
This document contains Inflectra proprietary information
6.1.1. Sorting and Filtering
You can easily filter and sort the list of incidents as illustrated in the screen-shot below:
To filter the list by incident type, status, priority, owner or detector name, you simply choose an item from
the appropriate drop-down list, and for the other fields, you enter a free-text phrase then click <Filter> or
press the <ENTER> key to apply the different filters. Note that the name field is searched using a “LIKE”
comparison, so that searching for “database” would include any item with the word database in the name.
The other freetext fields need to be exact matches (e.g. dates, incident numbers). There are also several
aggregate filters that are used to filter on multiple values at once (e.g. filtering status on (All Open) will
return any incident that is in one of the open statuses – new, open, assigned, reopen).
To change the column that is sorted, or to change the direction of the current sort, simply click on the
up/down arrow icon in the appropriate column. The currently sorted column is indicated by the larger,
white arrow with the back-border. In the screen-shot above, we are filtering on type=bug and sorting by
decreasing priority.
Clicking on Filter > Clear Filter removes any set filters and expands the incident list to display all incidents
for the current project, and clicking on Filter > Save Filter allows you to save the filter to your ‘My Page’
for use in the future. The list of saved filters can also be retrieved by clicking Filter > Retrieve Filter.
6.1.2. New Incident
Clicking on the <New Incident> button takes you to the new incident screen. This is essentially the same
screen as the incident details screen shown in section 6.2 except that the <Update> button is replaced by
an <Insert> button, and depending on how the workflow has been configured for your project, certain
fields may be disabled. For more details on setting and up configuring workflow for your project, please
refer to the SpiraTest Administration Guide.
6.1.3. Delete
Clicking on the <Delete> button deletes the incidents whose check-boxes have been selected in the
incident list.
6.1.4. Refresh
Clicking on the <Refresh> button simply reloads the list of incidents; this is useful when new incidents are
being added by other users, and you want to make sure you have the most up-to-date list displayed.
© Copyright 2006-2013, Inflectra Corporation
Page 95 of 3
This document contains Inflectra proprietary information
6.1.5. Show / Hide Columns
This drop-down list allows you to change the fields that are displayed in the incident list as columns for
the current project. To show a column that is not already displayed, simply select that column from the list
of “Show…” column names and to hide an existing column, simply select that column from the list of
“Hide…” column names. This is stored on a per-project basis, so you can have different display settings
for each project that you are a member of. The fields can be any of the built-in fields or any of the custom
properties set up by the project owner.
6.1.6. Edit
Each incident in the list has an <Edit> button display in its right-most column. When you click this button
or just double-click on any of the cells in the row, you change the item from “View” mode to “Edit” mode.
The various columns are made editable, and <Update> <Cancel> buttons are displayed in the last
column:
If you click <Edit> on more than one row, the <Update> and <Cancel> buttons are only displayed on the
first row, and you can make changes to all the editable rows and then update the changes by clicking the
one <Update> button. Also, if you want to make the same change to multiple rows (e.g. to change five
incidents from “Resolved” status to “Closed”), you can click on the “fill” icon to the right of the editable
item, which will propagate the new value to all editable items in the same column.
If you want to edit lots of items, first select their checkboxes and then click the [Edit] button on the same
row as the Filters and it will switch all the selected items into edit mode.
When you have made your updates, you can either click <Update> to commit the changes, or <Cancel>
to revert back to the original information. Alternatively, pressing the <ENTER> key will commit the
changes and pressing the <ESCAPE> key will cancel the changes.
6.1.7. Copying Incidents
To copy an incident or set of incidents, simply select the check-boxes of the incidents you want to copy
and then click <Copy>. This will make a copy of the current incident with its name prefixed ‘Copy of ….’ to
distinguish itself from the original. Any file attachments will also be copied along with the incident itself.
6.1.8. Exporting Incidents
To export an incident or set of incidents from the current project to another project in the system, all you
need to do is select the check-boxes of the incident(s) you want to export and then click the Tools >
Export icon. This will then bring up a list of possible destination projects:
© Copyright 2006-2013, Inflectra Corporation
Page 96 of 3
This document contains Inflectra proprietary information
Once you have chosen the destination project and clicked the <Export> button, the incidents will be
exported from the current project to the destination project. Any file attachments will also be copied to the
destination project along with the incidents.
6.1.9. Creating Requirement from Incidents
Sometimes you may have a situation where an enhancement has been logged in the incident tracker and
now that it has been approved, it needs to be converted into a formal requirement so that test cases and
tasks can be generated from it. To aid this process, there is a shortcut that allows you to create new
requirement from selected incidents and have it be automatically added to the requirements list. When
that is performed an association is automatically added that links this new requirement to the original
incident.
To activate this feature, select the checkboxes of the incidents you want to convert and then click Tools >
Convert Into Requirements.
6.1.10. Printing Items
To quickly print a single incident or list of incidents you can select the items’ checkboxes and then click
Tools > Print Items. This will display a popup window containing a printable version of the selected items.
6.2. Incident Details
When you click on an incident item in the incident list, or click the <New Incident> button (as described in
section 6.1), you are taken to the incident details page illustrated below:
© Copyright 2006-2013, Inflectra Corporation
Page 97 of 3
This document contains Inflectra proprietary information
This page is made up of three areas; the left pane is the navigation window where you can quickly jump
to other incidents as well as execute workflow transitions (see below), the upper part of the right pane
contains the incident detailed information itself, and the bottom part of the right pane displays different
information associated with the incident.
The navigation pane consists of a link that will take you back to the incidents list, as well as a list of the
peer incidents to the one selected. This latter list is useful as a navigation shortcut; you can quickly view
the peer incidents by clicking on the navigation links without having to first return to the incidents list
page. The navigation list can be switched between four different modes:
•
•
•
•
The list of incidents matching the current filter
The list of all incidents, irrespective of the current filter
The list of incidents assigned to the current user
The list of incidents detected/found by the current user
In addition to the left hand navigation, you can enter a specific incident number in the text-box in the
toolbar and click the <Find> button. In the same toolbar, there is also a shortcut for creating a new
incident without having to first return to the incident list page. In addition, the lower section of the incident
details page can be switched been four different views: “Overview”, “Attachments”, “History”, and
“Associations”. These are described later.
6.2.1. Editing an Existing Incident
If you are editing an existing incident, the fields that are available and the fields that are required will
depend on your stage in the incident workflow. For example an open incident might not require a
“Resolved Version” whereas a resolved incident could well do. The types of change allowed and the
email notifications that are sent will depend on how your project administrator has setup the system for
you. Administrators should refer to the SpiraTeam Administration Guide for details on configuring the
incident workflows to meet their needs.
Depending on the user’s role and whether they are listed as the owner or detector of the incident or not,
displayed in the left hand side of the page, above the navigation list is a set of allowed workflow
operations:
© Copyright 2006-2013, Inflectra Corporation
Page 98 of 3
This document contains Inflectra proprietary information
These workflow transitions allow the user to move the incident from one status to another. For example
when the incident is in the Assigned status, you will be given the options to:
Resolve the Incident – changes status to “Resolved”
Unable to Reproduce – changes the status to “Not Reproducible”
Duplicate Incident - changes the status to “Duplicate”
After changing the status of the incident by clicking on the workflow link, you can then fill in the additional
fields that are now enabled and/or required. Once you’ve made the changes to the appropriate incident
fields, you can either click <Save>, <Save and Close>, or <Save and New> to commit the changes or
<Refresh> to discard the changes and reload the incident from the database. In addition you can print the
current incident by clicking <Print>, which will display a printable version of the page in a separate
window.
6.2.2. Inserting a New Incident
If you are creating a new incident, the fields that are available and the fields that are required will depend
on how your project has been for configured. For example, some projects may require that all incidents
be started with Status=New and Type=Incident, others may allow you to specify the incident type. The
types of change allowed will depend on how your project administrator has setup the system for you.
Administrators should refer to the SpiraTeam Administration Guide for details on configuring the incident
workflows to meet their needs.
Once you’ve filled out the appropriate incident fields, you can either click <Save>, <Save and Close> or
<Save and New> to commit the new item or click on the “Back to Incident List” to discard the insertion
and return back to the incident list.
6.2.3. Overview - Comments
The Comments section allows users to add and view discussions related to the incident:
Existing comments are displayed by date (either newest-first or oldest-first) above the text box. To add a
comment to the incident, enter your text into the textbox, then click the Save icon to save.
© Copyright 2006-2013, Inflectra Corporation
Page 99 of 3
This document contains Inflectra proprietary information
6.2.4. Overview - Schedule
This section displays the general schedule and completion status of the specific incident. You can
enter/edit the start-date, closed-date (i.e. the due-date), estimate, actual and remaining effort. From these
values, the system will display the calculated percent completion, progress indicator and projected final
effort.
6.2.5. Attachments
In this tab, the lower section of the screen displays the list of documents, screenshots or web links (URLs)
that have been “attached” to the incident. The documents can be in any format, though SpiraTeam® will
only display the icon for certain known types.
The attachment list includes the filename that was originally uploaded together with the file-size (in KB),
name of the person who attached it and the date uploaded. In addition, if you position the pointer over the
filename and hold it there for a few seconds, a detailed description is displayed as a tooltip.
To actually view the document, simply click on the filename hyperlink and a new web browser window will
open. Depending on the type of file, this window will either display the document or prompt you for a
place to save it on your local computer. To remove an existing attachment from an incident, simply click
the <Remove> button and the attachment will be removed from the list.
If you are using SpiraPlan or SpiraTeam (but not SpiraTest) you can also choose to include file
attachments stored in a linked version control system (e.g. Subversion, CVS, Perforce, etc.) by selecting
the “Include Source Code Documents” option.
To attach a new document or web link to the incident, you need to click on the “Add New” hyperlink to
open the “Add Attachment” dialog box. There are three different types of item that can be attached to an
incident:
To upload a file, choose “File” as the type and then click the Browse button and select the file
from your local computer, optionally enter a detailed description then click the <Upload> button.
The document will be copied from your computer and attached to the artifact.
To attach a web-link (URL) to the artifact, you need to choose “URL” as the type and then enter
the fully qualified URL (e.g. http://mywebsite.com?Document=1), an optional description and then
click the <Upload> button to attach the web-link.
To attach a screenshot to the artifact, you need to choose “Screenshot” as the type and then
copy the image to your computer’s clipboard (e.g. on Windows computers, the PRINT SCREEN
button captures the current page and adds to the clipboard). Once the image is in the clipboard,
© Copyright 2006-2013, Inflectra Corporation
Page 100 of 3
This document contains Inflectra proprietary information
click on the “Paste image from clipboard” hyperlink and the item will appear in the preview
window. You can then fill in the other fields and click <Upload> to attach the image.
Note: If you are using a non-Windows® computer (e.g. Macintosh®) that doesn’t put file extensions on
filenames (e.g. .xls for an Excel sheet) automatically, then you will need to manually add the file extension
to the filename before uploading if you want it to be displayed with the correct icon in the attachment list.
You can also associate an existing document (that’s already stored in SpiraTeam) with the incident. To do
that, click on the “Add Existing” hyperlink to bring up the add file association dialog box. You can then
choose to either associate a document stored in the SpiraTeam Documents repository or (in the case of
SpiraPlan/SpiraTeam but not SpiraTest) from the linked source code repository. In either case you first
select the appropriate folder, and then pick the document(s) from the file list on the right. In the case of a
source code file association you can also add a comment.
6.2.6. History
In this mode, the main pane displays the list of changes that have been performed on the incident artifact
since its creation. An example incident change history is depicted below:
The change history displays the date that each change was made, together with the fields that were
changed, the old and new values and the person who made the change. This allows a complete audit trail
to be maintained of all changes in the system.
6.2.7. Associations
In this tab, the main pane displays a list of any requirements, test runs, test steps or other incidents that
are associated with this incident:
The incidents in this list are ones that a user has decided are relevant to the current one and has created
a direct link between them. In the case of requirements and test cases, the association can be either due
© Copyright 2006-2013, Inflectra Corporation
Page 101 of 3
This document contains Inflectra proprietary information
to the creator of an incident directly linking the incident to the requirement or test step, or it can be the
result of a tester executing a test-run and creating an incident during the test run. In this latter case, the
check-box to the left of the association will be unavailable as the link is not editable.
Each association is displayed with the type of artifact (requirement, test step, test run, incident), the name
of the artifact being linked-to, the name of the person who created the association, and a comment that
describes why the association was made. In the case of an indirect association due to a test run, the
comment will contain the name of the test run.
In addition, when using SpiraPlan or SpiraTeam, you can select the checkbox marked “Include Source
Code Revisions” and the system will also scan the source code repository for any revisions that are linked
to this artifact. Since that can take be slower than accessing SpiraTeam, it is provided as an option that
you can enable and disable:
You can perform the following actions on an association from this screen:
Delete – removes the selected association to the other artifact. This will only delete the
association, not the linked artifact itself.
Refresh – updates the list of associations from the server, useful if other people are adding
associations to this incident at the same time.
Apply Filter – Applies the entries in the filter boxes to the list of associations
Clear Filters – Clears the current filter, so that all associations for the current incident are shown.
Edit – Clicking the [Edit] button to the right of the associations allows you to edit the comment
field inline directly on this screen.
To create a new association, simply click the <Add> hyperlink which will display the “Add New
Association” popup dialog box:
© Copyright 2006-2013, Inflectra Corporation
Page 102 of 3
This document contains Inflectra proprietary information
Once you have selected the appropriate artifact type, you will then be able to choose the specific artifact
you want to link to. In all cases, you can choose the item from a scrolling selection box, or you can either
enter the ID of the artifact directly (if known). In either case you can also add a comment that explains the
rationale for the association. If you’re adding an association to a test step, then there are actually two
selection boxes, one to choose the overall test case and the other to choose the specific test step.
6.2.8. Creating a Requirement from an Incident
Sometimes you may have a situation where an enhancement has been logged in the incident tracker and
now that it has been approved, it needs to be converted into a formal requirement so that test cases and
tasks can be generated from it. To aid this process, there is a shortcut link on the Associations tab that
allows you to create a new requirement from the current incident and have it be automatically added to
the requirements list. When that is performed an association is automatically added that links this new
requirement to the original incident.
6.2.9. Emailing the Incident
Using the <Email> button on the toolbar, you can send an email containing details of the incident to an
email address or another user on the system:
You can specify the subject line for the email, and either a list of email addresses, separated by
semicolons, or an existing project user .The content of the email body is specified by the email template
configured in the Administration > Notification Templates screen.
© Copyright 2006-2013, Inflectra Corporation
Page 103 of 3
This document contains Inflectra proprietary information
7. Release Management
This section outlines how to use the Release Management features of SpiraTeam® to manage different
versions of the system being tested in a particular project. This is an optional feature of the system, and
you can manage the testing for a project successfully without tracking individual releases. Typically when
you develop a system, it is important to ensure that features introduced in successive versions do not
impair existing functionality - this is known as regression testing.
In such situations, you will want to be able to execute the same set of test scripts against multiple
versions of the system and be able to track failures by version. A feature that works correctly in version
1.0 may fail in version 1.1, and the maintenance team may be testing the existing lifecycle of v1.0 in
parallel with the development team testing v1.1. Therefore by developing a master set of
releases/versions in the Release Management module, you can have the different testing teams correctly
assign their testing actions to the appropriate version.
There are two types of release artifact in SpiraTeam® - major project releases that are displayed with the
blue release icon and represent major versions of the system, and release Iterations (aka builds) that are
displayed with a yellow icon and represent intermediate builds/iterations of the system. Note: Iterations
can be contained within a Release, but not the other way round.
The main differences between releases and iterations are as follows:
Releases are independent versions of the system being tested and as such, you can map a
requirement directly to a release, indicating the release of the system that the requirement will be
fulfilled in.
When you report on a release (e.g. on the project home or in one of the reports) any child
iterations are automatically taken into account, and test runs and incidents that are related to the
child iterations will get included in the release reports. Child releases on the other hand are not
aggregated up into the parent release.
7.1. Release List
When you click on the Planning > Releases global navigation link, you will initially be taken to the release
list screen illustrated below:
The release list will contain all the releases and iterations associated with current project. When you
create a new project, this list will initially be empty, and you will have to use the <Insert> button to start
adding releases and iterations to the project. The hierarchical organization of releases in the list is
© Copyright 2006-2013, Inflectra Corporation
Page 104 of 3
This document contains Inflectra proprietary information
configurable, so you can organize the various releases in the way that makes most sense for a particular
project. Typically you have the major releases as the top-level items, with sub-releases, builds and
iterations as the lower-level items.
All of the releases in the list have a release-name, together with the assigned version number for that
release, the start-date and end-date for the release, the number of estimated project personnel working
on that release, the planned effort for the release, the total effort currently scheduled (as tasks), the
available effort for new tasking, the release id, and a set of custom properties defined by the project
owner.
For those releases that have test cases mapped against them, the execution status of the various test
cases associated with the release is displayed in aggregate for each item as a graphical bar diagram. If
you position the mouse over the execution status indicator you will see the detailed execution information
displayed as a tooltip.
For those releases that have at least one requirement task associated with them, they will display a block
graph that illustrates the relative numbers of task that are on-schedule (green), late-starting (yellow), latefinishing (red) or just not-started (grey). These values are weighted by the effort of the task, so that larger,
more complex tasks will be change the graph more than the smaller tasks. To determine the exact task
progress information, position the mouse pointer over the bar-chart and the number of associated tasks,
along with the details of how many are in each status will be displayed as a “tooltip”.
Clicking on a release’s hyperlink will take you to the release details page for the item in question (see
section 7.2).
7.1.1. Filtering
You can easily filter the list of releases as illustrated in the screen-shot below:
To filter the list by any of the displayed columns, you either choose an item from the appropriate dropdown list or enter a free-text phrase (depending on the type of field) then click <Filter> or press the
<ENTER> key to apply the different filters. Note that the name field is searched using a “LIKE”
comparison, so that searching for “database” would include any item with the word database in the name.
The other freetext fields need to be exact matches (e.g. dates, release numbers). In the screen-shot
above, we are filtering on Iteration = No. Clicking on <Clear Filters> clears all the set filters and displays
all the releases for the project.
In addition, if you have a set of filters that you plan on using on a regular basis, you can choose the option
Filter > Save Filter to add the current filter to the list of saved filters that appear on your ‘My Page’. The
list of saved filters can also be retrieved by clicking Filter > Retrieve Filter:
© Copyright 2006-2013, Inflectra Corporation
Page 105 of 3
This document contains Inflectra proprietary information
7.1.2. Insert
Hovering over the <Insert> button brings up a secondary menu that allows you to choose whether to
insert a release or iteration (if you just click Insert it defaults to inserting a release). In either case, it will
insert the new release / iteration above the currently selected item – i.e. the one whose check-box has
been selected, at the same level in the hierarchy. If you want to insert a release/iteration below a
summary item, you need to insert it first, then indent it with the <Indent> button. If you insert a release
without first selecting an existing release from the list, the new release will simply be inserted at the end
of the list.
Once the new release has been inserted, the item is switched to “Edit” mode so that you can change the
default name, active flag, version number and creator.
7.1.3. Delete
Clicking on the <Delete> button deletes all the releases whose check-boxes have been selected. If any of
the items are summary items, then the child releases and iterations are also deleted. In addition, if all the
children are deleted from a summary item, it changes back into a detail item.
7.1.4. Indent
Clicking on the <Indent> button indents all the releases whose check-boxes have been selected. If any of
the items are made children of a release that had no previous children, it will be changed from a detail
item into a summary item. Note: you cannot indent a release or iteration if it is below an iteration, as
iterations are not allowed to have child items
7.1.5. Outdent
Clicking on the <Outdent> button de-indents all the releases whose check-boxes have been selected. If
any of the items were the only children of a summary release item, then that item will be changed back
from a summary item to a detail item.
7.1.6. Refresh
Clicking on the <Refresh> button simply reloads the release list. This is useful as other people may be
modifying the list of releases at the same time as you, and after stepping away from the computer for a
short-time, you should click this button to make sure you are viewing the most current release list for the
project.
7.1.7. Edit
Each release/iteration in the list has an <Edit> button display in its right-most column. When you click this
button or click on any of the cells in the row, you change the item from “View” mode to “Edit” mode. The
various columns are made editable, and <Update> <Cancel> buttons are displayed in the last column:
© Copyright 2006-2013, Inflectra Corporation
Page 106 of 3
This document contains Inflectra proprietary information
If you click <Edit> on more than one row, the <Update> and <Cancel> buttons are only displayed on the
first row, and you can make changes to all the editable rows and then update the changes by clicking the
one <Update> button. Also, if you want to make the same change to multiple rows (e.g. to change five
releases from “active” to “inactive”), you can click on the “fill” icon to the right of the editable item, which
will propagate the new value to all editable items in the same column.
If you want to edit lots of items, first select their checkboxes and then click the [Edit] button on the same
row as the Filters and it will switch all the selected items into edit mode.
When you have made your updates, you can either click <Update> to commit the changes, or <Cancel>
to revert back to the original information. Alternatively, pressing the <ENTER> key will commit the
changes and pressing the <ESCAPE> key will cancel the changes.
7.1.8. Show Level
Choosing an indent level from the ‘Show Level’ drop down box allows you to quickly and easily view the
entire release list at a specific indent level. For example you may want to see all releases drilled-down to
the third level of detail. To do this you would simply choose ‘Level 3’ from the list, and the releases will be
expanded / collapsed accordingly.
7.1.9. Show / Hide Columns
This drop-down list allows you to change the fields that are displayed in the release list as columns for the
current project. To show a column that is not already displayed, simply select that column from the list of
“Show…” column names and to hide an existing column, simply select that column from the list of
“Hide…” column names. This is stored on a per-project basis, so you can have different display settings
for each project that you are a member of. The fields can be any of the built-in fields or any of the custom
properties set up by the project owner.
7.1.10. Copying Releases/Iterations
To copy a release/iteration or set of releases/iterations, simply select the check-boxes of the
release/iteration you want to copy and then select the Edit > Copy menu option. This will copy the current
release/iteration selection to the clipboard. Then you should select the place where you want the
releases/iterations to be inserted and choose the Edit > Paste option.
The releases/iterations will now be copied into the destination location you specified. The name of the
copied releases/iterations will be prefixed with “Copy of…” to distinguish them from the originals. Note
that copied releases/iterations will also include the test mapping information from the originals.
© Copyright 2006-2013, Inflectra Corporation
Page 107 of 3
This document contains Inflectra proprietary information
7.1.11. Moving Releases/Iterations
To move a release/iteration in the hierarchy, there are two options:
1. Click on the icon the release/iteration you want to move and then drag the icon to the location you
want it moved. The border between the destination releases/iterations will change as the icon is
dragged over it to illustrate where it will be inserted:
Once you have the release/iteration positioned at the correct place that you want it inserted, just
release the mouse button and the release list will be refreshed, with the release/iteration moved
to the desired location. To move multiple items simply select their checkboxes and then drag-anddrop one of the selected items.
2. Alternatively you can simply select the check-boxes of the release/iteration you want to move and
then select the Edit > Cut menu option. This will cut the current release/iteration selection to the
clipboard. Then you should select the place where you want the release/iteration to be inserted
and choose the Edit > Paste option. The release/iteration will now be moved into the destination
location you specified.
7.1.12. Exporting Releases/Iterations
To export releases/iterations from the current project to another project in the system, all you need to do
is select the check-boxes of the releases/iterations you want to export and then click the Tools > Export
icon. This will then bring up a list of possible destination projects:
© Copyright 2006-2013, Inflectra Corporation
Page 108 of 3
This document contains Inflectra proprietary information
Once you have chosen the destination project and clicked the <Export> button, the releases/iterations will
be exported from the current project to the destination project. Any file attachments will also be copied to
the destination project along with the release/iteration.
7.1.13. Creating Test Sets from Releases
As a shortcut you can click the Tools > Create Test Sets option to create new test sets from the list of
selected releases. The created test sets will include all of the test cases associated with this release. This
is useful in regression testing when you have created a new release and want to be able to quickly assign
a tester to ensure that all the functionality in the release works as expected.
7.1.14. Printing Items
To quickly print a single release/iteration or list of releases/iterations you can select the items’
checkboxes and then click Tools > Print Items. This will display a popup window containing a printable
version of the selected items.
7.1.15. Right-Click Context Menu
SpiraTeam® provides a shortcut – called the context menu - for accessing some of the most commonly
used functions, so that you don’t need to move your mouse up to the toolbar each time. To access the
context menu, right-click on any of the rows in the release list and the following menu will be displayed:
You can now choose any of these options as an alternative to using the icons in the toolbar
7.2. Release Details
When you click on release item in the release list described in section 7.1, you are taken to the release
details page illustrated below:
© Copyright 2006-2013, Inflectra Corporation
Page 109 of 3
This document contains Inflectra proprietary information
This page is made up of three areas; the left pane is the navigation window, the upper part of the right
pane contains the release detailed information itself, and the bottom part of the right pane displays
different information associated with the release.
The navigation pane consists of a link that will take you back to the release list, as well as a list of the
other releases in the current project. This latter list is useful as a navigation shortcut; you can quickly view
the test run information of all the other releases by clicking on the navigation links without having to first
return to the release list page. The navigation list can be switched between two different modes:
•
The list of releases matching the current filter
•
The list of all releases, irrespective of the current filter
The top part of the right pane allows you to view and/or edit the details of the particular release. In
addition you can delete the current artifact by choosing <Delete>, discard any changes made by clicking
<Refresh> or print it by clicking <Print>. The lower part of the right pane can be in one of eight possible
modes that can be selected: “Overview”, “Incidents”, “Reqs & Tasks”, “Test Cases”, “Test Runs”,
“Attachments”, and “History”. Each of the different views is described separately below.
7.2.1. Overview – Details
In this tab, the right pane displays the description, fields and custom properties associated with the
release:
© Copyright 2006-2013, Inflectra Corporation
Page 110 of 3
This document contains Inflectra proprietary information
You can edit the various fields (name, description, etc.) and custom properties. Once you are satisfied
with them, simply click either the <Save> or <Save and New> button at the top of the page to commit the
changes.
When you make changes to the release/iteration’s start-date, end-date, number of project personnel
resources, or number of non-working person days, the system will automatically calculate how many
hours of effort (planned effort) are available in the release/iteration for assigning tasks. As you begin
assigning tasks – either through the Tasks tab or the Iteration Planning screen – the total estimated effort
of the tasks is subtracted from this planned effort to give the “available effort”.
7.2.2. Overview - Comments
The Comments tab shows the current discussion thread for this release:
All existing comments are listed in order by entered date (either newest-first or oldest-first). To create a
new comment, enter the text into the text box, and then click the Save icon.
7.2.3. Overview - Builds
This section displays the list of builds associated with the current release/iteration. Each build is listed
together with its name, creation date, status (whether the build succeeded or failed), and last updated
© Copyright 2006-2013, Inflectra Corporation
Page 111 of 3
This document contains Inflectra proprietary information
date. Clicking on the hyperlink for the build name will open up the Build Details page which is described in
section 7.5. of this manual.
You can also filter the results by choosing items from the filter options displayed in the sub-header row of
each field and clicking the “Apply Filter” link. In addition, you can quickly sort the list by clicking on one of
the directional arrow icons displayed in the header row of the appropriate field.
7.2.4. Incidents
This is the default view for the release details page. It displays the incidents associated with the selected
release. The incident list can be one of three modes:
Detected in this Release – this will display a list of all the incidents that were detected during the
testing of the selected release. This is useful in determining if there are open incidents associated
with a release that need to be dealt with.
Resolved in this Release – This will display a list of all the incidents that have been reportedly
resolved in this release. This is useful for double-checking that all the resolved incidents for a
release have indeed been fixed.
Verified in this Release – This will display a list of the incidents that have been verified as being
fixed in this release. This is useful for generating release notes for a specific release indicating
what changes and enhancements have been made in the release.
Regardless of the mode, each incident is listed together with the type, status, priority, name, owner,
detector, detection date and a link to the actual incident details (see section 6.2):
To change between the three modes outlined above, simply select the desired mode from the drop-down
list contained within the header of the incident list table.
© Copyright 2006-2013, Inflectra Corporation
Page 112 of 3
This document contains Inflectra proprietary information
You can perform the following actions:
Refresh – updates the list of incidents from the server, useful if other people are adding incidents
to this release at the same time.
Apply Filter – Applies the entries in the filter boxes to the list of incidents
Clear Filters – Clears the current filter, so that all incidents associated with the current release
are shown.
Edit – Clicking the [Edit] button to the right of the incident allows you to edit the incident inline
directly on this screen. This functionality is limited to project owners.
Show/Hide Columns – Allows you to choose which incident columns are visible
7.2.5. Reqs & Tasks
In this mode, the lower part of the right pane displays the list of requirements and their associated child
tasks that need to be completed for the release/iteration to be completed:
Each of the requirements and associated tasks is displayed together with its name, description (by
hovering the mouse over the name), priority, progress indicator, current owner, estimated effort, actual
effort, projected effort and numeric task identifier. Clicking on the task name will bring up the Task Details
page which is described in more detail in section 8.2. This allows you to edit the details of an existing
task.
You can perform the following actions on a task from this screen:
New Task – inserts a new task in the task list under the specified requirement, with a default set
of values. The task will be associated with the specified requirement and current release/iteration.
Delete Task – deletes the task from the project.
Refresh – updates the list of requirements and tasks from the server, useful if other people are
adding requirements and/or tasks to this release/iteration at the same time.
Apply Filter – Applies the entries in the filter boxes to the list of requirements and all their
associated tasks (it does not filter the tasks themselves).
Clear Filters – Clears the current filter, so that all requirements associated with the current
release/iteration are shown.
Edit – Clicking the [Edit] button to the right of the requirement or task allows you to edit the item
inline directly on this screen. Only columns visible will be editable.
Show Level – Allows you to quickly expand/collapse all the requirements in the list.
© Copyright 2006-2013, Inflectra Corporation
Page 113 of 3
This document contains Inflectra proprietary information
7.2.6. Test Case Mapping
This mode displays the test case mapping information for the release in question:
The pane consists of two lists of test cases, the one on the left being the hierarchical list of the test cases
belonging to the project arranged in test folders. The right box (which will initially be empty) contains the
list of test cases mapped to this release/iteration. The test cases in this box include columns for their ID
and name. Hovering the mouse over the names of the test cases in either box will display a “tooltip”
consisting of the test case name, place in the folder structure and a detailed description. Clicking on the
hyperlinks in right-hand box will jump you to the test case details screen for the test case in question (see
section 5.2.9).
To change the test case mapping for this release, you use the buttons (Add, Remove, Remove All)
positioned between the two list-boxes. The <Add> button will move the selected test cases from the list of
available on the left to the list of mapped on the right. Similarly the <Remove> and <Remove All> buttons
will remove either the selected or all the test cases from the right list-box and add them back to the left
list-box.
Finally, as a shortcut you can click the “Create Test Set from This Release” link to create a new test set
from this release, that will include all of the test cases associated with this release. This is useful in
regression testing when you have created a new release and want to be able to quickly assign a tester to
ensure that all the functionality in the release works as expected.
7.2.7. Test Runs
This view displays the list of all the test runs executed against the release. Each test run is listed together
with the date of execution, the name of the test case, the name of the tester, the release/version of the
system that the test was executed against, the name of the test set (if applicable), the overall execution
status for the test case in that run and a link to the actual test run details (see section 5.6). In addition,
you can choose to display any of the custom properties associated with the test run.
© Copyright 2006-2013, Inflectra Corporation
Page 114 of 3
This document contains Inflectra proprietary information
The “customize columns” drop-down list allows you to change the fields that are displayed in the test run
list as columns. To show a column that is not already displayed, simply select that column from the list of
“Show…” column names and to hide an existing column, simply select that column from the list of
“Hide…” column names. The displayed columns can be any standard field or custom property.
You can also filter the results by choosing items from the filter options displayed in the sub-header row of
each field and clicking the “Apply Filter” link. In addition, you can quickly sort the list by clicking on one of
the directional arrow icons displayed in the header row of the appropriate field.
7.2.8. Attachments
In this mode, the lower section of the screen displays the list of documents that have been “attached” to
the release. The documents can be in any format, though SpiraTeam® will only display the icon for
certain known types.
The attachment list includes the filename that was originally uploaded together with the file-size (in KB),
name of the person who attached it and the date uploaded. In addition, if you position the pointer over the
filename and hold it there for a few seconds, a detailed description is displayed as a tooltip.
To actually view the document, simply click on the filename hyperlink and a new web browser window will
open. Depending on the type of file, this window will either display the document or prompt you for a
place to save it on your local computer. To remove an existing attachment from a release/iteration, simply
click the <Remove> button and the attachment will be removed from the list.
If you are using SpiraPlan or SpiraTeam (but not SpiraTest) you can also choose to include file
attachments stored in a linked version control system (e.g. Subversion, CVS, Perforce, etc.) by selecting
the “Include Source Code Documents” option.
To attach a new document or web link to the release/iteration, you need to click on the “Add New”
hyperlink to open the “Add Attachment” dialog box. There are three different types of item that can be
attached to a release or iteration:
© Copyright 2006-2013, Inflectra Corporation
Page 115 of 3
This document contains Inflectra proprietary information
To upload a file, choose “File” as the type and then click the Browse button and select the file
from your local computer, optionally enter a detailed description then click the <Upload> button.
The document will be copied from your computer and attached to the artifact.
To attach a web-link (URL) to the artifact, you need to choose “URL” as the type and then enter
the fully qualified URL (e.g. http://mywebsite.com?Document=1), an optional description and then
click the <Upload> button to attach the web-link.
To attach a screenshot to the artifact, you need to choose “Screenshot” as the type and then
copy the image to your computer’s clipboard (e.g. on Windows computers, the PRINT SCREEN
button captures the current page and adds to the clipboard). Once the image is in the clipboard,
click on the “Paste image from clipboard” hyperlink and the item will appear in the preview
window. You can then fill in the other fields and click <Upload> to attach the image.
Note: If you are using a non-Windows® computer (e.g. Macintosh®) that doesn’t put file extensions on
filenames (e.g. .xls for an Excel sheet) automatically, then you will need to manually add the file extension
to the filename before uploading if you want it to be displayed with the correct icon in the attachment list.
You can also associate an existing document (that’s already stored in SpiraTeam) with the release. To do
that, click on the “Add Existing” hyperlink to bring up the add file association dialog box. You can then
choose to either associate a document stored in the SpiraTeam Documents repository or (in the case of
SpiraPlan/SpiraTeam but not SpiraTest) from the linked source code repository. In either case you first
select the appropriate folder, and then pick the document(s) from the file list on the right. In the case of a
source code file association you can also add a comment.
7.2.9. View History
In this mode, the main pane displays the list of changes that have been performed on the release artifact
since its creation. An example release change history is depicted below:
The change history displays the date that each change was made, together with the fields that were
changed, the old and new values and the person who made the change. This allows a complete audit trail
to be maintained of all changes in the system. In addition, if you are logged in as a project administrator
you can also click on the “Admin View” hyperlink to revert any unwanted changes.
© Copyright 2006-2013, Inflectra Corporation
Page 116 of 3
This document contains Inflectra proprietary information
7.3. Iteration Planning
As well as being able to assign requirements, tasks and incidents to releases and iterations individually
through the Release/Iteration details page (see above), you can also do this on the Iteration Planning
screen. When you are first planning the iteration, and need to batch assign requirements, tasks and
incidents from the backlog of unscheduled items to the iterations, it is usually more convenient to use the
Iteration Planning screen. To access this screen, go to Planning > Iterations, choose the current release
and the following screen will be displayed:
This screen is divided into two sections:
The top part of the screen displays the iterations contained within the current release (up-to three
per page) together with the list of requirements, tasks and incidents currently assigned to the
iteration. Also any of these item directly associated with the release itself are displayed in the first
panel.
The bottom part of the screen displays the list of accepted, unplanned (not started) requirements
and tasks and unplanned, open incidents that need to be scheduled for a specific iteration. This is
essentially the backlog of requirements and their associated tasks, together with any outstanding
incidents that need to be scheduled. The requirements and tasks are shown in one tab and the
incidents are shown in the other
To navigate around the release, you use the small black arrow buttons located at the top of the iteration
panels. These allow you to quickly move to the previous/next iteration in the currently selected release.
To change the release itself, you use the drop-down-list at the top-right of the page to change to a
different release.
7.3.1. Scheduling Requirements / Tasks / Incidents to Iterations
To assign a new requirement, task, or incident to the iteration schedule, you either position the mouse
pointer over a single item’s icon, dragging it to the desired iteration or you select several checkboxes in
the requirements / tasks / incident list and then drag all the selected items in one go. Once the
requirement / task / incident(s) have been added to the iteration, the utilized effort for the iteration will
increase, and the available effort will decrease by the same amount.
© Copyright 2006-2013, Inflectra Corporation
Page 117 of 3
This document contains Inflectra proprietary information
If you schedule a requirement for a specific iteration, all the child tasks that have not yet been started, will
follow the parent requirement in being associated with the iteration.
Note: The system will allow you to assign more tasks/incidents to an iteration than is possible to
complete, however this will result in a negative value for ‘available effort’. If this happens, the “Available
Effort” value will be displayed in red, and you need to rebalance the items, extend the iteration length or
add project personnel resources to the iteration.
7.3.2. Rescheduling Requirements / Tasks / Incidents
To move planned items from one iteration to another, you either position the mouse pointer over a single
item’s icon, dragging it to the desired new iteration or you select several checkboxes in the existing
iteration and then drag all the selected items to the destination iteration in one go. To remove a
requirement / task / incident from an iteration, you should just drag and drop it from the iteration panel
back to the requirement / task / incident task list at the bottom of the page. This will return the item to the
list of unplanned items at the bottom of the page.
If you reschedule a requirement to a new iteration, all the child tasks that have not yet been started, will
follow the parent requirement in being associated with the new iteration. The tasks that have already
started will remain associated to the old iteration.
Note: Once a task has changed status from ‘not-started’ to any of the other statuses, its checkbox will be
disabled and you will need to return it to the ‘not started’ status before attempting to reassign it. This is a
safety feature that prevents you from accidentally rescheduling a task that is currently being worked on.
7.3.3. Task Assignment Rules
When you move a task from one iteration to another or assign a new task to the iteration, the system
makes the following changes to the task automatically:
The release/iteration that the task is assigned-to is updated
The start-date and end-date of the task is changed to match that of the iteration if the dates lie
outside the bounds of the iteration. This means that the task may change from being on-schedule
to late-starting depending on whether the iteration is already in progress
7.3.4. Editing the Requirement / Task / Incident List
As well as being able to schedule the requirements, incidents and tasks with the various iterations in the
upper portion of the screen, the incident and requirement / task lists displayed on the bottom half of the
screen include the same editing functions found in the Requirements, Task, and Incident List pages.
© Copyright 2006-2013, Inflectra Corporation
Page 118 of 3
This document contains Inflectra proprietary information
7.4. Planning Board
The SpiraTeam Planning Board is a great way to visualize the requirements, tasks and incidents planned
for each iteration in your project. Based on the principles of the Scrum and Kanban methodologies, the
Planning Board lets you see each task, requirement or task as a virtual “card” that is grouped by the
iteration it’s been scheduled for:
When you first click on Planning > Planning Board the system will ask you to select a Release. Upon
selecting a Release, the system will display all the requirements, tasks and incidents planned for the
release, grouped by the iteration they’ve been assigned-to. Any items not assigned to any release or
iteration will be listed in the (Unassigned Items) section. You can click on the expand/collapse icons to
hide any releases/iterations that are not relevant.
Each item will be displayed with the name and ID of the artifact, together with the owner, estimated effort
and projected effort. In addition, the left border will display a color based on the priority of the item and a
progress bar will be displayed that illustrates the current progress of that item.
You can easily move items from one iteration to another by simply drag and dropping them. To move
multiple items, you just need to select their checkboxes and then drag one of the items.
To view the resource assignments of a particular iteration, click on the “View” hyperlink next to the
iteration and the system will display the list of items in the iteration, grouped by the resource they are
assigned to:
© Copyright 2006-2013, Inflectra Corporation
Page 119 of 3
This document contains Inflectra proprietary information
Any items not assigned to a resource will be listed in the (Unassigned Items) section. You can click on the
expand/collapse icons to hide any resources that are not relevant. The system will display a progress bar
for each resource to illustrate the allocation for that resource. Any resource that has a progress bar that is
completely green has been fully scheduled and should not have any additional items assigned. If the
progress bar for that resource turns red, it means that they have been over-scheduled and you need to
reassign some of the items.
Each item will be displayed with the name and ID of the artifact, together with the owner, estimated effort
and projected effort. In addition, the left border will display a color based on the priority of the item and a
progress bar will be displayed that illustrates the current progress of that item.
You can easily move items from one resource to another by simply drag and dropping them. To move
multiple items, you just need to select their checkboxes and then drag one of the items.
7.5. Build Details
When you click on a build entry in the build list, you are taken to the build details page illustrated below:
This page is made up of three areas; the left pane is the navigation window, the upper part of the right
pane contains the build detailed information itself, and the bottom part of the right pane displays different
information associated with the build.
The navigation pane consists of a link that will take you back to the build list, as well as a list of the other
builds that belong to the same release/iteration as the current one. The top part of the right pane allows
© Copyright 2006-2013, Inflectra Corporation
Page 120 of 3
This document contains Inflectra proprietary information
you to view the details of the build including a detailed description of why it succeeded or failed. Since
builds are populated from an external Continuous Integration server the build information will always be
read-only inside the SpiraTeam user interface.
The lower part of the right pane contains tabs that can display different information associated with the
build. Each of the tabs - “Incidents”, “Revisions”, and “Test Runs” - is described separately below.
7.5.1. Incidents
This tab displays the list of incidents that have been fixed in the current build. The grid can be sorted and
filtered by using the appropriate controls:
7.5.2. Revisions
This tab displays a list of the source code revisions that were included in the current build. The grid can
be sorted and filtered by using the appropriate controls:
7.5.3. Test Runs
This tab displays a list of all the tests that have been executed against the current build. The grid can be
sorted and filtered by using the appropriate controls:
© Copyright 2006-2013, Inflectra Corporation
Page 121 of 3
This document contains Inflectra proprietary information
8. Task Tracking
8.1. Task List
When you click on the Tracking > Tasks global navigation link, you will initially be taken to the tasks list
screen illustrated below:
The task list screen displays all the tasks entered for the current project, in a filterable, sortable grid. The
grid displays the task number together with fields such as priority, name, assigned owner, start date, end
date, scheduled release, etc. The choice of columns displayed is configurable per-user, per-project,
giving extensive flexibility when it comes to viewing and searching tasks.
In addition, you can view a more detailed description of the task by positioning the mouse pointer over
the task name hyperlink and waiting for the popup “tooltip” to appear. If you click on the task name
hyperlink, you will be taken to the task details page described in section 8.2. Clicking on any of the
pagination links at the bottom of the page will advance you to the next set of tasks in the list according to
the applied filter and sort-order. There is also a drop-down-list at the bottom of the page which allows you
to specify how many rows should be displayed in each page, helping accommodate different user
preferences.
One special column that is unique to tasks is the ‘progress indicator’. This illustrates graphically both the
percentage completion of the task and also if the task is either starting late or finishing late. The following
table illustrates the different type of status that can be conveyed by the indicator:
Indicator Display
Progress Description
Task has not yet started, but the scheduled start date is
still in the future.
Task has not yet started, and the start date has elapsed.
This is considered a ‘Late Starting Task’
Task has started, and is approximately 25% complete.
The scheduled end date is still in the future.
Task has started, and is approximately 25% complete.
However the scheduled end date has elapsed already.
This is a considered a ‘Late Finishing Task’.
Task has been 100% completed.
© Copyright 2006-2013, Inflectra Corporation
Page 122 of 3
This document contains Inflectra proprietary information
Essentially, the gray section of the bar indicates the % of the task yet to be completed, and the green/red
section of the bar indicates the % of the task that has already been completed. If the bar changes from
green to red it means that the end date has been reached and the task is not yet complete, and if the
background changes from gray to yellow it means that the task has not yet started, but the scheduled
start date has passed.
8.1.1. Sorting and Filtering
You can easily filter and sort the list of tasks as illustrated in the screen-shot below:
To filter the list by progress, status, priority, owner or release, you simply choose an item from the
appropriate drop-down list, and for the other fields, you enter a free-text phrase then click <Filter> or
press the <ENTER> key to apply the different filters. Note that the name field is searched using a “LIKE”
comparison, so that searching for “database” would include any item with the word database in the name.
The other freetext fields need to be exact matches (e.g. dates, task numbers).
To change the column that is sorted, or to change the direction of the current sort, simply click on the
up/down arrow icon in the appropriate column. The currently sorted column is indicated by the larger,
white arrow with the back-border. In the screen-shot above, we have filtered on tasks that are finishing
late, sorted in order of decreasing priority.
Clicking on Filter > Clear Filter removes any set filters and expands the task list to display all tasks for the
current project, and clicking on Filter > Save Filter allows you to save the filter to your ‘My Page’ for use in
the future. The list of saved filters can also be retrieved by clicking Filter > Retrieve Filter.
8.1.2. New Task
Clicking on the <New Task> button creates a new task in the grid with an initial set of information. You
can click on the name of the task to edit its information.
8.1.3. Delete
Clicking on the <Delete> button deletes the tasks whose check-boxes have been selected in the task list.
8.1.4. Refresh
Clicking on the <Refresh> button simply reloads the list of tasks; this is useful when new tasks are being
added by other users, and you want to make sure you have the most up-to-date list displayed.
8.1.5. Show / Hide Columns
This drop-down list allows you to change the fields that are displayed in the task list as columns for the
current project. To show a column that is not already displayed, simply select that column from the list of
“Show…” column names and to hide an existing column, simply select that column from the list of
“Hide…” column names. This is stored on a per-project basis, so you can have different display settings
© Copyright 2006-2013, Inflectra Corporation
Page 123 of 3
This document contains Inflectra proprietary information
for each project that you are a member of. The fields can be any of the built-in fields or any of the custom
properties set up by the project owner.
8.1.6. Edit
Each task in the list has an <Edit> button display in its right-most column. When you click this button or
just click on any of the cells in the row, you change the item from “View” mode to “Edit” mode. The various
columns are made editable, and <Update> <Cancel> buttons are displayed in the last column:
If you click <Edit> on more than one row, the <Update> and <Cancel> buttons are only displayed on the
first row, and you can make changes to all the editable rows and then update the changes by clicking the
one <Update> button. Also, if you want to make the same change to multiple rows (e.g. to change five
tasks from “Not Started” status to “In Progress”), you can click on the “fill” icon to the right of the editable
item, which will propagate the new value to all editable items in the same column.
If you want to edit lots of items, first select their checkboxes and then click the [Edit] button on the same
row as the Filters and it will switch all the selected items into edit mode.
When you have made your updates, you can either click <Update> to commit the changes, or <Cancel>
to revert back to the original information. Alternatively, pressing the <ENTER> key will commit the
changes and pressing the <ESCAPE> key will cancel the changes.
8.1.7. Copying Tasks
To copy a task or set of tasks, simply select the check-boxes of the tasks you want to copy and then click
<Copy>. This will make a copy of the current task with its name prefixed ‘Copy of ….’ to distinguish itself
from the original. Any file attachments will also be copied along with the task itself.
8.1.8. Exporting Tasks
To export a task or set of tasks from the current project to another project in the system, all you need to
do is select the check-boxes of the task(s) you want to export and then click Tools > Export. This will then
bring up a list of possible destination projects:
Once you have chosen the destination project and clicked the <Export> button, the tasks will be exported
from the current project to the destination project. Any file attachments will also be copied to the
destination project along with the tasks.
© Copyright 2006-2013, Inflectra Corporation
Page 124 of 3
This document contains Inflectra proprietary information
8.1.9. Printing Items
To quickly print a single task or list of tasks you can select the items’ checkboxes and then click Tools >
Print Items. This will display a popup window containing a printable version of the selected items.
8.2. Task Details
When you click on a task item in the lists displayed on either the main task list page or on the requirement
/ release details pages, you are taken to the task details page illustrated below:
This page is made up of three areas; the left pane is the navigation window, the upper part of the right
pane contains the task detailed information itself, and the bottom part of the right pane displays different
information associated with the task.
The navigation pane consists of a link that will take you back to the task list, as well as a list of the other
related tasks, nested under their parent requirement. This latter list is useful as a navigation shortcut; you
can quickly view the peer requirements or tasks by clicking on the navigation links without having to first
return to the requirements or tasks list pages. The navigation list can be switched between three different
modes:
•
The list of tasks matching the current filter
•
The list of all tasks, irrespective of the current filter, grouped by their parent requirement
•
The list of tasks assigned to the current user
The top part of the right pane allows you to view and/or edit the details of the particular task. You can
delete the current artifact by choosing <Delete>, discard any changes made by clicking <Refresh> or print
it by clicking <Print>. Using the <Email> button on the toolbar, you can send an email containing details of
the task to an email address or another user on the system:
© Copyright 2006-2013, Inflectra Corporation
Page 125 of 3
This document contains Inflectra proprietary information
You can specify the subject line for the email, and either a list of email addresses, separated by
semicolons, or an existing project user .The content of the email is specified in the System Administration
– Notification Templates.
The lower part of the right pane can be in one of four possible modes that can be selected: “Overview
Properties”, “Attachments”, “History” and “Associations”. Each of the different views is described
separately below.
8.2.1. Overview – Details
In this tab, the right pane displays the description, fields and custom properties associated with the task:
You can edit the various fields (name, description, etc.) and custom properties. Once you are satisfied
with them, simply click either the <Save> or <Save and New> button at the top of the page to commit the
changes to the task.
8.2.2. Overview – Comments
The comments tab will display the comments associated with the task:
© Copyright 2006-2013, Inflectra Corporation
Page 126 of 3
This document contains Inflectra proprietary information
All existing comments are displayed in date entered underneath the textbox. To enter a new comment,
enter the text into the textbox, and then click the Save button.
8.2.3. Overview - Schedule
In this mode, the main pane displays the general schedule and completion status of the specific task. You
can enter/edit the start-date, end-date (i.e. the due-date), estimated, actual and remaining effort. From
this the system will calculate the progress, percentage complete and projected final effort.
The different effort values mean the following:
Estimated Effort – This is the original estimate for how long the task would take to complete.
Actual Effort – This is the current amount of effort that has been expended in completing the
task. This does not indicate the completion progress
Remaining Effort – This is the estimate for how it will take from the current state to complete the
task. The % complete is calculated from this value in conjunction with the estimated effort:
% Complete = 100% - (Remaining Effort / Estimated Effort)
Projected Effort – This is value that the system is projecting it will take to complete the task. This
is calculated from the Actual Effort and Remaining Effort:
Projected Effort = (Actual Effort + Remaining Effort)
If the actual effort is not specified, the projected effort will be the same as the estimated effort.
Note that if this task is currently assigned to a release or iteration, the start-date and end-date of the task
must lie within the date-range of the parent release/iteration. If your task looks like it will not be completed
in the available timeframe, you will need to contact the project manager to get them to either extend the
date-range of the task, or consider moving the task to the next iteration.
8.2.4. Attachments
This tab displays the list of documents that have been “attached” to the task. The documents can be in
any format, though SpiraTeam® will only display the icon for certain known types.
© Copyright 2006-2013, Inflectra Corporation
Page 127 of 3
This document contains Inflectra proprietary information
The attachment list includes the filename that was originally uploaded together with the file-size (in KB),
name of the person who attached it and the date uploaded. In addition, if you position the pointer over the
filename and hold it there for a few seconds, a detailed description is displayed as a tooltip.
To actually view the document, simply click on the filename hyperlink and a new web browser window will
open. Depending on the type of file, this window will either display the document or prompt you for a
place to save it on your local computer. To remove an existing attachment from a task, simply click the
<Remove> button and the attachment will be removed from the list.
If you are using SpiraPlan or SpiraTeam (but not SpiraTest) you can also choose to include file
attachments stored in a linked version control system (e.g. Subversion, CVS, Perforce, etc.) by selecting
the “Include Source Code Documents” option.
To attach a new document or web link to the task, you need to click on the “Add New” hyperlink to open
the “Add Attachment” dialog box. There are three different types of item that can be attached to a task:
To upload a file, choose “File” as the type and then click the Browse button and select the file
from your local computer, optionally enter a detailed description then click the <Upload> button.
The document will be copied from your computer and attached to the artifact.
To attach a web-link (URL) to the artifact, you need to choose “URL” as the type and then enter
the fully qualified URL (e.g. http://mywebsite.com?Document=1), an optional description and then
click the <Upload> button to attach the web-link.
To attach a screenshot to the artifact, you need to choose “Screenshot” as the type and then
copy the image to your computer’s clipboard (e.g. on Windows computers, the PRINT SCREEN
button captures the current page and adds to the clipboard). Once the image is in the clipboard,
click on the “Paste image from clipboard” hyperlink and the item will appear in the preview
window. You can then fill in the other fields and click <Upload> to attach the image.
Note: If you are using a non-Windows® computer (e.g. Macintosh®) that doesn’t put file extensions on
filenames (e.g. .xls for an Excel sheet) automatically, then you will need to manually add the file extension
to the filename before uploading if you want it to be displayed with the correct icon in the attachment list.
You can also associate an existing document (that’s already stored in SpiraTeam) with the task. To do
that, click on the “Add Existing” hyperlink to bring up the add file association dialog box. You can then
choose to either associate a document stored in the SpiraTeam Documents repository or (in the case of
SpiraPlan/SpiraTeam but not SpiraTest) from the linked source code repository. In either case you first
select the appropriate folder, and then pick the document(s) from the file list on the right. In the case of a
source code file association you can also add a comment.
© Copyright 2006-2013, Inflectra Corporation
Page 128 of 3
This document contains Inflectra proprietary information
8.2.5. History
In this mode, the main pane displays the list of changes that have been performed on the task since its
creation. An example task change history is depicted below:
The change history displays the date that each change was made, together with the fields that were
changed, the old and new values and the person who made the change. This allows a complete audit trail
to be maintained of all changes in the system. In addition, if you are logged in as a project administrator
you can also click on the “Admin View” hyperlink to revert any unwanted changes.
8.2.6. Associations
In this mode, the main pane displays a list of any source code revisions that are associated with this task:
This feature allows you to display the list of any changes in the source code repository that were the
result of implementing the functionality described in the task. Clicking on the revision name takes you to
the revision details page which is described in more detail in the “Source Code” section of this guide.
You can perform the following actions:
Refresh – updates the list of revisions from the server, useful if other people are adding revisions
connected to this task at the same time.
Apply Filter – Applies the entries in the filter boxes to the list of revisions.
Clear Filters – Clears the current filter, so that all revisions for the current task are shown.
© Copyright 2006-2013, Inflectra Corporation
Page 129 of 3
This document contains Inflectra proprietary information
9. Resource Tracking
This section outlines how you can use the Resource Tracking features of SpiraPlan® and SpiraTeam® to
view the total workload for each of the project personnel resources assigned to a specific project. This
allows you to verify that the work is evenly distributed amongst the project members and that no individual
resource is overloaded.
When you click on the Tracking > Resources link on the global navigation bar, you will initially be taken to
the project resources list screen illustrated below:
This screen lists all the personnel (project resources) that belong to the current project together with the
total value of the projected effort of all the work assigned to them, the available effort based on the length
of the current release/iteration, and the remaining effort (the difference between the previous two values).
The effort is shown for tasks and incidents as well as a total of the two together.
You can display the workload for the project as a whole:
For a specific release (including all child iterations):
For a specific iteration:
© Copyright 2006-2013, Inflectra Corporation
Page 130 of 3
This document contains Inflectra proprietary information
Or for the entire project group:
There is a colored progress bar column called “Allocation” that graphically illustrates the % of the person’s
available effort that has been scheduled. If a person is over-scheduled, this bar will turn red. In addition, if
any project resources have been assigned more work that they have time to complete during the length of
the release/iteration, the background color of the remaining effort value will be also be colored in red,
indicating that you need to offload some of the work to other project resources.
Clicking on a resource name will take you to the Resource Details page.
9.1 Resource Details
The resource details page will show you what artifacts a resource has been assigned, and time values for
the items. A small table on the left will show current configured values for the project for # of hours per
workday, # of days per week, and how many non-work hours per month there are.
Tabs along the bottom will show assigned requirements and tasks, incidents, test cases, test sets and
recent actions. The views for each item are a subset of available columns, to show progress and
completion information for all items listed. Clicking on an artifact’s name will take you to the artifact details
page:
© Copyright 2006-2013, Inflectra Corporation
Page 131 of 3
This document contains Inflectra proprietary information
9.1.1. Reqs & Tasks
This tab displays the list of requirements and child tasks that are assigned to the current resource:
9.1.2. Incidents
This tab displays the list of incidents that are assigned to the current resource:
9.1.3. Test Cases
This tab displays the list of test cases that are assigned to the current resource:
9.1.4. Test Sets
This tab displays the list of test sets that are assigned to the current resource:
© Copyright 2006-2013, Inflectra Corporation
Page 132 of 3
This document contains Inflectra proprietary information
9.1.5. Actions
This tab displays the list of recent actions make by the user in the project. It lets you quickly see all the
changes they have made:
This can be useful when auditing the changes made by a specific user.
© Copyright 2006-2013, Inflectra Corporation
Page 133 of 3
This document contains Inflectra proprietary information
10. Document Management
This section outlines the document management features of SpiraTeam® that can be used to upload,
manage and share documents between the different members of the project. This module includes
support for uploading files and URLs, versioning of documents, the ability to organize into folders and
categorize and search using meta-tags.
In addition the document management features are fully integrated into the rest of the system, so that
documents attached to other artifacts (e.g. requirements, test cases, etc.) are automatically connected to
the project documentation repository.
10.1. Document List
When you click on the Project Home > Documents link on the global navigation bar, you will initially be
taken to the project documents list screen illustrated below:
This screen consists of three main sections:
The top left-hand pane displays a hierarchical list of the various folders that have been setup for
the current project. Clicking on the [+] expand icon will expand the child folders and clicking on
the name of the folder will display the list of documents in the folder in the main pane to the right.
The main right-hand pane displays a list of all the documents contained within the currently
selected folder. This list can be filtered and sorted, and you can choose how many rows of
documents to display on the page at one time.
The bottom left-hand pane contains the “Tag Cloud”. This is a list of all the tag names associated
with documents in the project. The size of the font is proportional to the number of documents
associated with the tag. Clicking on a tag name will automatically filter the list of documents to
find items that contain the selected tag.
The main toolbar contains icons for all the operations that can be performed on the document list. You
can add documents to the current folder, delete existing documents from the project, refresh the list of
documents, export documents to another project, apply a filter, and clear the current filter. In addition
there is the option to either display just the documents in the current folder or all documents in all folders.
The latter is useful when you want to search for a specific document by keyword or tag name.
© Copyright 2006-2013, Inflectra Corporation
Page 134 of 3
This document contains Inflectra proprietary information
10.1.1. Add New Document
To add a new document to the project, you just need to click on the <Add Document> icon in the toolbar,
and the ‘Add New Document’ dialog box will be displayed:
There are three different types of item that can be uploaded into the document repository:
To upload a file, choose “File” as the type and then click the Browse button and select the file
from your local computer, optionally enter a detailed description then click the <Upload> button.
The document will be copied from your computer and added to the current folder.
To add a web-link (URL) to the current folder, you need to choose “URL” as the type and then
enter the fully qualified URL (e.g. http://mywebsite.com?Document=1), an optional description
and then click the <Upload> button to add the web-link.
To add a screenshot to the current folder, you need to choose “Screenshot” as the type and then
copy the image to your computer’s clipboard (e.g. on Windows computers, the PRINT SCREEN
button captures the current page and adds to the clipboard). Once the image is in the clipboard,
click on the “Paste image from clipboard” hyperlink and the item will appear in the preview
window. You can then fill in the other fields and click <Upload> to upload the image.
10.1.2. View Document Information
When you hover the mouse pointer over any of the documents displayed in the document list, an
information panel will be displayed that contains the name, description, version, document type and metatags of the document:
© Copyright 2006-2013, Inflectra Corporation
Page 135 of 3
This document contains Inflectra proprietary information
You can click on the document URL to actually open the document itself in a new window, click on the
meta-tag links to find related documents that contain the same meta-tag, or click on “View Details” to see
more information regarding the document, including an ability to edit its meta-information and see the
different versions of the document.
10.2. Document Details
When you click on an item in the document list described above, you are taken to the document details
page illustrated below:
This page is made up of three areas; the left pane is for navigation, the upper part of the main pane
contains the details of the document, and the bottom part of the right pane contains the list of document
versions and the list of artifacts that the document is associated with.
The navigation pane consists of a link that will take you back to the project document list, as well as a list
of other documents in the current folder. This latter list is useful as a navigation shortcut; you can quickly
view the detailed information of all the peer documents by clicking on the navigation links without having
to first return to the main document list page.
The top part of the main pane allows you to view and/or edit the details of the particular document. You
can edit the various fields (name, description, etc.) and once you are satisfied with them, simply click the
<Save> button at the top of the page to commit the changes. In addition you can delete the current
document by choosing <Delete>, or discard any changes made by clicking <Refresh>.
© Copyright 2006-2013, Inflectra Corporation
Page 136 of 3
This document contains Inflectra proprietary information
The lower part of the main pane can be switched between two different views by clicking the appropriate
tab. Initially the pane will be in “Versions” mode, but it can be switched to “Association” as well. The
functionality in each of these two views is described below:
10.2.1. Edit Document Versions
This view displays the list of different versions that exist for the current document. When you initially
create a new document there will be only a single version (e.g. v1.0), however as revisions are made to
the document, rather than having to create a whole new document, you can just upload the new revision
as a new version (e.g. v1.1) and it will be added to the list of versions.
Each version in the list is displayed with its name, a description of what changed in the version, the
version number assigned to the revision, the file-size, who uploaded the new version and a link to actually
open the new version:
On this page, you have the option to delete an existing version, make a different version the active one
(the one that users see when they view the document list and click on the link) and upload a new revision.
If you upload a new version, you need to provide a description of the changes made, a new version
number and whether the new version should be made the active one. Note: If the original document was
a file (instead of a URL) then all revisions will need to be files, similarly if the original document was a
URL, all revisions will need to be URLs.
10.2.2. Edit Document Associations
This view displays a list of the artifacts in the current project that are associated with the current
document. If you originally uploaded the document as an attachment to a requirement, test case, etc.
then an initial association will be already listed, otherwise it will be empty.
© Copyright 2006-2013, Inflectra Corporation
Page 137 of 3
This document contains Inflectra proprietary information
From this screen you can either delete an existing artifact association or add a new association from the
current document to a pre-existing artifact in the system. To add the association, you just need to select
the type of artifact being associated (requirement, test case, incident, etc.) and the numeric ID of the
artifact.
For example to add an association to Requirement RQ00005 you would choose Artifact Type =
Requirement and Artifact ID = 5.
© Copyright 2006-2013, Inflectra Corporation
Page 138 of 3
This document contains Inflectra proprietary information
11. Reports Center
This section describes the reporting features of SpiraTeam®, including an overview of each of the report
types that are available. When you click on the “Reports” tab on the global navigation bar, you will initially
be taken to the reports home page illustrated below:
This page consists of three main areas:
The top left hand pane displays a list of any reports that have either been saved by the currently
logged in user, or those reports created by other members of the project, that have been marked
(by that user) as ‘shareable’.
The bottom left-hand main pane displays a list of the printable reports available in the system,
categorized by the artifact they primarily relate to (requirements, test cases, incidents and
releases). Clicking on any of the report hyperlinks will take you to the configuration page for the
report in question (see section 11.1 below for details).
The right-hand pane is a dashboard that contains the set of graph widgets configured by the
current user. By default the dashboard will display: the Incident Progress Rate, Test Run
© Copyright 2006-2013, Inflectra Corporation
Page 139 of 3
This document contains Inflectra proprietary information
Progress Rate, Requirement Summary, Test Case Summary, Incident Aging and Task
Burndown.
In addition to the graphs displayed by default, you can click on the “Add Items” hyperlink to add additional
graphs to the reporting dashboard:
Each of the graphs is described in more detail in sections 11.7 – 11.9.
11.1. Reports Configuration
The configuration page for each report differs slightly, but the general format is illustrated below:
You can configure the reports in the following ways:
Report Format – This allows you to specify the display format of the report. Depending on the
specific report, they can be displayed as a web-page (HTML), downloaded as a Microsoft Word
document, downloaded as a Microsoft Excel spreadsheet or downloaded as a Microsoft Project
file. In addition there is a raw-XML format that allows you to export the underlying report data into
any external reporting system that supports XML import.
© Copyright 2006-2013, Inflectra Corporation
Page 140 of 3
This document contains Inflectra proprietary information
Report Elements – This allows you to determine which types of information to include in the
report. This varies by report type, but includes the dependent items related to the artifact being
reported on (attachments, test steps, coverage, history, etc.)
Standard Field Filters – This allows you to constrain the range of data being reported on, based
on the various fields associated with the artifact in question. These filters are typically selections
from multi-valued-dropdown lists and date-ranges.
Custom Property Filters – This allows you to constrain the range of data being reported on,
based on the custom fields associated with the artifact by your project administrator. These filters
can be either freetext or drop-down lists.
Sort Options - This option is only available for the non-hierarchical data reports (i.e. for test runs,
incidents and tasks only) and allows you to specify the sort order of the results returned in the
report. For the hierarchical-data based reports the sort order is always the order of the hierarchy.
© Copyright 2006-2013, Inflectra Corporation
Page 141 of 3
This document contains Inflectra proprietary information
Report Name – If you would like to save the report configuration so that you can quickly re-run it
at a later date, you just need to enter a name for the report and indicate (by selecting the
checkbox or not) whether you want this report to be private or shared by all members of the
project.
Once you have selected the format, elements and filters, clicking the <Create Report> button launches
the report in a new window. Each of the reports is described in sections 11.2 – 11.6 below:
11.2. Requirement Reports
11.2.1. Requirements Summary Report
This report displays all of the requirements defined for the current project in the order they appear in the
requirements list. The requirement's details and coverage status are displayed in a summary list form:
11.2.2. Requirements Detailed Report
This printable report displays all of the requirements defined for the current project in the order they
appear in the requirements list. For each individual requirement, the name, priority, author, status and
coverage status are displayed, along with tables containing the list of covering test cases, linked
incidents/requirements, associated tasks, attached documents, and the change history:
© Copyright 2006-2013, Inflectra Corporation
Page 142 of 3
This document contains Inflectra proprietary information
11.2.3. Requirements Plan
This report displays a complete work breakdown structure of the project from a requirements perspective,
including all requirements and tasks organized by schedule:
11.2.4. Requirements Traceability Matrix
This report displays a matrix of the requirements in the system with their list of covering test cases and
associated, mapped requirements:
© Copyright 2006-2013, Inflectra Corporation
Page 143 of 3
This document contains Inflectra proprietary information
11.3. Test Case Reports
11.3.1. Test Case Summary Report
This report displays all of the test cases defined for the current project in the order they appear in the test
case list. The test case's details and execution status are displayed in a summary grid form with the test
steps optionally displayed:
11.3.2. Test Case Detailed Report
This report displays all of the test cases defined for the current project in the order they appear in the test
case list. The test case's details and execution status are displayed, along with sub-tables containing the
list of test steps, test runs, attached documents, the change history, and a list of any associated open
incidents:
11.3.3. Test Set Summary Report
This report displays all of the test sets defined for the current project in the order they appear in the test
set list. The test set's details and execution status are displayed in a summary list form:
© Copyright 2006-2013, Inflectra Corporation
Page 144 of 3
This document contains Inflectra proprietary information
11.3.4. Test Set Detailed Report
This report displays all of the test sets defined for the current project in the order they appear in the test
set list. The test set's details and execution status are displayed, along with sub-tables containing the list
of test cases, test runs, attached documents, and the change history:
11.3.5. Printable Test Scripts
This printable report is useful when you want to be able to conduct the testing activities offline on paper,
or when testers need paper copies of the test script in addition to using the online test execution wizard.
In either case, this report simply displays all of the test cases defined for the current project in the order
they appear in the test case list together with their detailed test steps and a list of any attached
documents.
© Copyright 2006-2013, Inflectra Corporation
Page 145 of 3
This document contains Inflectra proprietary information
11.3.6. Test Run Summary Report
This report displays all of the test runs defined for the current project. The test run's details and execution
status are displayed in a summary grid form:
11.3.7. Test Run Detailed Report
This report displays all of the test runs defined for the current project in date order (most recent first). The
test run's details and execution status are displayed, along with sub-tables containing the list of test run
steps, and a list of any associated open incidents:
© Copyright 2006-2013, Inflectra Corporation
Page 146 of 3
This document contains Inflectra proprietary information
11.3.8. Test Case Traceability
This report displays a matrix of the test cases in the system with the list of mapped releases, incidents
and test sets:
11.4. Incident Reports
11.4.1. Incident Summary Report
This report displays all of the incidents tracked for the current project. The incident's details are displayed
in a summary list form:
© Copyright 2006-2013, Inflectra Corporation
Page 147 of 3
This document contains Inflectra proprietary information
11.4.2. Incident Detailed Report
This printable report displays all of the incidents tracked for the current project sorted by incident number.
For each individual incident, the name, type, priority, status, opener, owner and close date are displayed,
along with tables containing the detailed description and resolutions as well as a tabular list of attached
documents, linked requirements/incidents and the change history:
11.5. Task Reports
11.5.1. Task Summary Report
This report displays all of the tasks tracked for the current project. The task's details are displayed in a
summary list form:
© Copyright 2006-2013, Inflectra Corporation
Page 148 of 3
This document contains Inflectra proprietary information
11.5.2. Task Detailed Report
This report displays all of the tasks tracked for the current project. The task's details are displayed, along
with a tabular list of attached documents and the change history:
11.6. Release Reports
11.6.1. Release Summary Report
This report displays all of the releases and iterations defined for the current project in the order they
appear in the release/iteration hierarchy. The release's details are displayed in a summary list form:
11.6.2. Release Detailed Report
This report displays all of the releases and iterations defined for the current project in the order they
appear in the release/iteration hierarchy. The release's details are displayed, along with sub-tables
containing the list of requirements added, mapped test cases, test runs executed, incidents resolved,
attached documents, scheduled tasks and the change history:
© Copyright 2006-2013, Inflectra Corporation
Page 149 of 3
This document contains Inflectra proprietary information
11.6.3. Release Plan Report
This report displays a complete work breakdown structure of the project from a release perspective,
including all releases, iterations, requirements, tasks and incidents organized by schedule:
11.7. Summary Graphs
11.7.1. Requirements Summary Graph
The requirements summary graph shows how many requirements are currently in a project. The number
of requirements is displayed according to the criteria that you specify. You can specify the type of data
displayed along the x-axis, and the requirement information which is used to group the data. When you
first open the graph you will be asked to pick the field that you would like to display on the x-axis and the
field that you would like to group the data by. Once you have chosen the appropriate fields the graph will
be displayed:
© Copyright 2006-2013, Inflectra Corporation
Page 150 of 3
This document contains Inflectra proprietary information
In this version of the report, the x-axis represents the requirements’ status, and the individual bars are
grouped by requirement importance. Each data-value can be viewed by positioning the mouse pointer
over the bar, and a “tooltip” will pop-up listing the actual data value.
Clicking on the “Display Data Grid” link will display the underlying data that is being used to generate the
graph:
Clicking on the Download Data as CSV link will export the datagrid into Comma Separated Values (CSV)
format that can be opened in MS-Excel. Some browsers also support the ability to save the graph as an
image file (JPEG, PNG and GIF formats).
11.7.2. Test Case Summary Graph
The test case summary graph shows how many test cases are currently in a project. The number of test
cases is displayed according to the criteria that you specify. You can specify the type of data displayed
along the x-axis, and the test case information which is used to group the data. When you first open the
graph you will be asked to pick the field that you would like to display on the x-axis and the field that you
would like to group the data by. Once you have chosen the appropriate fields the graph will be displayed:
© Copyright 2006-2013, Inflectra Corporation
Page 151 of 3
This document contains Inflectra proprietary information
In this version of the report, the x-axis represents the test case execution status, and the individual bars
are grouped by test case priority. Each data-value can be viewed by positioning the mouse pointer over
the bar, and a “tooltip” will pop-up listing the actual data value. Clicking on the “Display Data Grid” link will
display the underlying data that is being used to generate the graph. In addition, clicking on the Download
Data as CSV link will export the datagrid into Comma Separated Values (CSV) format that can be opened
in MS-Excel. Some browsers also support the ability to save the graph as an image file (JPEG, PNG and
GIF formats).
11.7.3. Test Run Summary Graph
The test run summary graph shows how many test runs are currently in a project. The number of test runs
is displayed according to the criteria that you specify. You can specify the type of data displayed along
the x-axis, and the test run information which is used to group the data. When you first open the graph
you will be asked to pick the field that you would like to display on the x-axis and the field that you would
like to group the data by. Once you have chosen the appropriate fields the graph will be displayed:
In this version of the report, the x-axis represents the test run execution status, and the individual bars are
grouped by test run type. Each data-value can be viewed by positioning the mouse pointer over the bar,
and a “tooltip” will pop-up listing the actual data value. Clicking on the “Display Data Grid” link will display
© Copyright 2006-2013, Inflectra Corporation
Page 152 of 3
This document contains Inflectra proprietary information
the underlying data that is being used to generate the graph. In addition, clicking on the Download Data
as CSV link will export the datagrid into Comma Separated Values (CSV) format that can be opened in
MS-Excel. Some browsers also support the ability to save the graph as an image file (JPEG, PNG and
GIF formats).
11.7.4. Incident Summary Graph
The incident summary graph shows how many incidents are currently in a project. The number of
incidents is displayed according to the criteria that you specify. You can specify the type of data displayed
along the x-axis, and the incident information which is used to group the data. When you first open the
graph you will be asked to pick the field that you would like to display on the x-axis and the field that you
would like to group the data by. Once you have chosen the appropriate fields the graph will be displayed:
In this version of the report, the x-axis represents the incidents’ status, and the individual bars are
grouped by the type of incident. Each data-value can be viewed by positioning the mouse pointer over the
bar, and a “tooltip” will pop-up listing the actual data value. Clicking on the “Display Data Grid” link will
display the underlying data that is being used to generate the graph. In addition, clicking on the Download
Data as CSV link will export the datagrid into Comma Separated Values (CSV) format that can be opened
in MS-Excel. Some browsers also support the ability to save the graph as an image file (JPEG, PNG and
GIF formats).
11.7.5. Task Summary Chart
The task summary graph shows how many tasks are currently in a project. The number of tasks is
displayed according to the criteria that you specify. You can specify the type of data displayed along the
x-axis, and the task information which is used to group the data. When you first open the graph you will
be asked to pick the field that you would like to display on the x-axis and the field that you would like to
group the data by. Once you have chosen the appropriate fields the graph will be displayed:
© Copyright 2006-2013, Inflectra Corporation
Page 153 of 3
This document contains Inflectra proprietary information
In this version of the report, the x-axis represents the tasks’ priority, and the individual bars are grouped
by the status of task. Each data-value can be viewed by positioning the mouse pointer over the bar, and a
“tooltip” will pop-up listing the actual data value. Clicking on the “Display Data Grid” link will display the
underlying data that is being used to generate the graph. In addition, clicking on the Download Data as
CSV link will export the datagrid into Comma Separated Values (CSV) format that can be opened in MSExcel. Some browsers also support the ability to save the graph as an image file (JPEG, PNG and GIF
formats).
11.7.6. Test Set Summary Graph
The test set summary graph shows how many test set are currently in a project. The number of test sets
is displayed according to the criteria that you specify. You can specify the type of data displayed along
the x-axis, and the test set information which is used to group the data. When you first open the graph
you will be asked to pick the field that you would like to display on the x-axis and the field that you would
like to group the data by. Once you have chosen the appropriate fields the graph will be displayed:
In this version of the report, the x-axis represents the test set status, and the individual bars are grouped
by the name of the tester (owner). Each data-value can be viewed by positioning the mouse pointer over
the bar, and a “tooltip” will pop-up listing the actual data value. Clicking on the “Display Data Grid” link will
© Copyright 2006-2013, Inflectra Corporation
Page 154 of 3
This document contains Inflectra proprietary information
display the underlying data that is being used to generate the graph. In addition, clicking on the Download
Data as CSV link will export the datagrid into Comma Separated Values (CSV) format that can be opened
in MS-Excel. Some browsers also support the ability to save the graph as an image file (JPEG, PNG and
GIF formats).
11.8. Snapshot Graphs
11.8.1. Requirements Coverage Graph
The requirements coverage graph shows how many requirements are currently in a project, according to
their test coverage status.
The x-axis of the report represents the various test execution statuses that a requirement can have as its
coverage status (plus the Not-Covered status), and the individual bars are grouped by the requirements
importance. Each data-value can be viewed by positioning the mouse pointer over the bar, and a “tooltip”
will pop-up listing the actual data value.
Clicking on the “Display Data Grid” link will display the underlying data that is being used to generate the
graph. You can also filter the graph to just display data for a specific release/iteration as well as for the
project as a whole. In addition, clicking on the Download Data as CSV link will export the datagrid into
Comma Separated Values (CSV) format that can be opened in MS-Excel. Some browsers also support
the ability to save the graph as an image file (JPEG, PNG and GIF formats).
11.8.2. Incident Aging Graph
The incident aging chart displays the number of days incidents have been left open in the system. The
chart is organized as a stacked histogram, with the count of incidents on the y-axis and different age
intervals on the x-axis. Each bar-chart color represents a different incident priority, giving a project
manager a snapshot view of the age of open project incidents by priority.
© Copyright 2006-2013, Inflectra Corporation
Page 155 of 3
This document contains Inflectra proprietary information
This report can be filtered by the type of incident, so for example you can see the aging of just bugs, or
just issues for the project in question. Clicking on the “Display Data Grid” link will display the underlying
data that is being used to generate the graph. In addition, clicking on the Download Data as CSV link will
export the datagrid into Comma Separated Values (CSV) format that can be opened in MS-Excel. Some
browsers also support the ability to save the graph as an image file (JPEG, PNG and GIF formats).
11.8.3. Incident Turnaround Time Graph
The incident turnaround time chart displays the number of days incidents have taken to be closed (from
the time they were first raised) in the system. The chart is organized as a stacked histogram, with the
count of incidents on the y-axis and different turnaround time intervals on the x-axis. Each bar-chart color
represents a different incident priority, giving a project manager a snapshot view of the turnaround time of
project incidents by priority.
This report can be filtered by the type of incident, so for example you can see the turnaround time of just
bugs, or just issues for the project in question. Clicking on the “Display Data Grid” link will display the
underlying data that is being used to generate the graph. In addition, clicking on the Download Data as
CSV link will export the datagrid into Comma Separated Values (CSV) format that can be opened in MS-
© Copyright 2006-2013, Inflectra Corporation
Page 156 of 3
This document contains Inflectra proprietary information
Excel. Some browsers also support the ability to save the graph as an image file (JPEG, PNG and GIF
formats).
11.8.4. Task Velocity Chart
The Task Velocity graph shows the total estimated and actual effort delivered in each project release
and/or iteration:
The y-axis of the graph displays the total estimated and actual effort delivered, and the x-axis can be
configured to display three different levels of granularity:
All Releases – This shows the total estimated and actual effort for each of the releases in the
project
Specific Release – This shows the total estimated and actual effort for each of the iterations in
the selected release
Specific Iteration – This shows the total estimated actual effort for each working day in the daterange covered by the selected iteration.
Clicking on the “Display Data Grid” link will display the underlying data that is being used to generate the
graph. In addition, clicking on the Download Data as CSV link will export the datagrid into Comma
Separated Values (CSV) format that can be opened in MS-Excel. Some browsers also support the ability
to save the graph as an image file (JPEG, PNG and GIF formats).
11.8.5. Task Burnup Chart
The Task Burnup graph shows the cumulative amount of work outstanding for each release/iteration in
the project with separate lines for the estimated, remaining and completed effort:
© Copyright 2006-2013, Inflectra Corporation
Page 157 of 3
This document contains Inflectra proprietary information
The y-axis of the graph displays the cumulative increase in work for the project, broken down by effort
(estimated, remaining and completed) with a red line indicating the ideal burnup. The x-axis can be
configured to display two different levels of granularity:
Specific Release – This shows the increase in work for each of the iterations in the selected
release
Specific Iteration – This shows the increase in work for each working day in the date-range
covered by the selected iteration.
Clicking on the “Display Data Grid” link will display the underlying data that is being used to generate the
graph. In addition, clicking on the Download Data as CSV link will export the datagrid into Comma
Separated Values (CSV) format that can be opened in MS-Excel. Some browsers also support the ability
to save the graph as an image file (JPEG, PNG and GIF formats).
11.8.6. Task Burndown Chart
The Task Burndown graph shows the remaining work that needs to be done for each release/iteration in
the project with separate lines for the estimated, remaining and completed effort:
© Copyright 2006-2013, Inflectra Corporation
Page 158 of 3
This document contains Inflectra proprietary information
The y-axis of the graph displays the total remaining work that needs to be done, broken down by effort
(estimated, remaining and completed) with a red line indicating the ideal burndown. The x-axis can be
configured to display two different levels of granularity:
Specific Release – This shows the total remaining work that needs to be done for each of the
iterations in the selected release
Specific Iteration – This shows the total remaining work that needs to be done for each working
day in the date-range covered by the selected iteration.
Clicking on the “Display Data Grid” link will display the underlying data that is being used to generate the
graph. In addition, clicking on the Download Data as CSV link will export the datagrid into Comma
Separated Values (CSV) format that can be opened in MS-Excel. Some browsers also support the ability
to save the graph as an image file (JPEG, PNG and GIF formats).
11.9. Date-Range Graphs
11.9.1. Test Run Progress Rate Graph
The test run progress rate graph shows how many tests have been executed during a period of time, and
what execution status was recorded. The report can be displayed for a specific date-range and for the
entire project or for a specific release/iteration:
In this version of the report, the y-axis represents the number of test runs executed in each 24 hour
period, and the x-axis represents a specific week in the time-span. Each data-bar can be viewed by
positioning the mouse pointer over the point, and a “tooltip” will pop-up listing the actual data value. You
can filter the report by the release/iteration that the test run was executed against, and also change the
date range. If you choose a smaller date-range, the x-axis will switch from weekly to daily and if you
choose a larger date-range, the x-axis will switch to monthly.
Clicking on the “Display Data Grid” link will display the underlying data that is being used to generate the
graph. In addition, clicking on the Download Data as CSV link will export the datagrid into Comma
Separated Values (CSV) format that can be opened in MS-Excel. Some browsers also support the ability
to save the graph as an image file (JPEG, PNG and GIF formats).
11.9.2. Incident Progress Rate Graph
The incident progress rate chart displays the total number of incidents created and closed over a
particular date-range, either for all incident types or for a specific incident type:
© Copyright 2006-2013, Inflectra Corporation
Page 159 of 3
This document contains Inflectra proprietary information
In this version of the report, the y-axis represents the number of incidents (either created or closed in a 24
hour period), and the x-axis represents a specific day in the time-span. Each data-point can be viewed by
positioning the mouse pointer over the point, and a “tooltip” will pop-up listing the actual data value. You
can filter the report by the type of incident, and also change the date range (e.g. displaying only the bugs
for the date range). If you choose a smaller date-range, the x-axis will switch from weekly to daily and if
you choose a larger date-range, the x-axis will switch to monthly.
Clicking on the “Display Data Grid” link will display the underlying data that is being used to generate the
graph. In addition, clicking on the Download Data as CSV link will export the datagrid into Comma
Separated Values (CSV) format that can be opened in MS-Excel. Some browsers also support the ability
to save the graph as an image file (JPEG, PNG and GIF formats).
11.9.3. Cumulative Incident Count Graph
The cumulative incident count chart displays the cumulative total number of incidents logged in the
system for the current project over a particular date-range, either for all incident types or for a specific
incident type. The report displays two data series, one illustrating the total count of all incidents, the other
the total count of all open incidents (i.e. with status not set to fixed or closed):
In this version of the report, the y-axis represents the number of incidents, and the x-axis represents a
specific week in the time-span. Each data-point can be viewed by positioning the mouse pointer over the
point, and a “tooltip” will pop-up listing the actual data value. You can also filter the type of incident being
reported, as well as change the date interval. If you choose a smaller date-range, the x-axis will switch
from weekly to daily and if you choose a larger date-range, the x-axis will switch to monthly.
Clicking on the “Display Data Grid” link will display the underlying data that is being used to generate the
graph. In addition, clicking on the Download Data as CSV link will export the datagrid into Comma
Separated Values (CSV) format that can be opened in MS-Excel. Some browsers also support the ability
to save the graph as an image file (JPEG, PNG and GIF formats).
© Copyright 2006-2013, Inflectra Corporation
Page 160 of 3
This document contains Inflectra proprietary information
11.9.4. Open Incident Count Graph
The open incident count chart displays the net number of open incidents in the system for the current
project over a particular date-range categorized by incident priority, either for all incident types or for a
specific incident type:
In this version of the report, the y-axis represents the number of incidents, and the x-axis represents a
specific week in the time-span. The exact count of each bar in the stacked histogram can be viewed by
positioning the mouse pointer over the bar, and a “tooltip” will pop-up listing the actual data value. You
can also filter the type of incident being reported, as well as change the date interval. If you choose a
smaller date-range, the x-axis will switch from weekly to daily and if you choose a larger date-range, the
x-axis will switch to monthly.
Clicking on the “Display Data Grid” link will display the underlying data that is being used to generate the
graph. In addition, clicking on the Download Data as CSV link will export the datagrid into Comma
Separated Values (CSV) format that can be opened in MS-Excel. Some browsers also support the ability
to save the graph as an image file (JPEG, PNG and GIF formats).
© Copyright 2006-2013, Inflectra Corporation
Page 161 of 3
This document contains Inflectra proprietary information
12. Source Code
This section outlines the source code integration features of SpiraPlan® and SpiraTeam® that can be
used to browse the source code repository associated with a particular project and link artifacts in
SpiraTeam to revisions / commits made in the source code repository. This functionality allows project
members to quickly view files in the repository through a convenient web interface and also to see the
end-to-end traceability from requirements, tasks and incidents to the code changes that addressed the
requirement, fulfilled the task or resolved the incident
The software can be integrated with a variety of different version control / Software Configuration
Management (SCM) systems by means of different plug-ins. This section will outline the general features
irrespective of the type of version control provider being used. For details on using a specific provider
(e.g. Subversion) please refer to the separate SpiraPlan/Team Version Control Integration Guide. This
section also assumes that an administrator has already configured the project to be integrated with the
version control provider. The steps for using the administrative interface are described in the separate
SpiraTeam Administration Guide.
12.1. Source Code File List
When you click on the Tracking > Source Code link on the global navigation bar, you will initially be taken
to the source code repository file list screen illustrated below:
This screen consists of three main sections:
The top left-hand pane displays a hierarchical list of the various folders that exist in the source
code repository. Clicking on the [+] expand icon will expand the child folders and clicking on the
name of the folder will display the list of files in the folder in the main pane to the right.
The main right-hand pane displays a list of all the files contained within the currently selected
folder. This list can be filtered and sorted, and you can choose how many rows of documents to
display on the page at one time.
The bottom left-hand pane contains the option to view the overall revision log for the project,
clicking on that will display the revision log page (see section 12.3 for details).
© Copyright 2006-2013, Inflectra Corporation
Page 162 of 3
This document contains Inflectra proprietary information
12.2. Source Code File Details
When you click on a file in the source code file list described above, you are taken to the file details page
illustrated below:
This page is made up of three areas; the left pane is for navigation, the upper part of the main pane
contains the details of the file, and the bottom part of the right pane contains the list of file revisions stored
in the version control system.
The navigation pane consists of a link that will take you back to the source code file list, as well as a list of
other files in the current folder. This latter list is useful as a navigation shortcut; you can quickly view the
detailed information of all the peer files by clicking on the navigation links without having to first return to
the main file list page.
The top part of the main pane allows you to view the details of the particular file in the version control
system. Clicking on the “File Path” hyperlink will actually open the file in a separate window, and
depending on the type of file, it may display in the page or prompt you to download it to your local
computer. The “Latest Revision” hyperlink allows you to view details of the latest revision (see section
12.4 below).
The lower part of the main pane can be switched between two different views by clicking the appropriate
tab. Initially the pane will be in “Revisions” mode, but it can be switched to “Associations” as well. The
functionality in each of these two views is described below:
12.2.1. Revisions
This view displays the list of revisions that have been committed for the current file:
Each revision in the list is displayed with its name, the name of the person who made the revision, a
description of what was changed, the date the change was made and two flags that denote whether the
content was changed and/or if any of the properties of the file were changed. Clicking on the revision
name will take you to the appropriate revision details page (see section 12.4).
12.2.2. Associations
This view displays a list of the SpiraTeam artifacts in the current project that are associated with the
current file. This allows you to see which requirements, test cases, incidents, tasks, etc. are linked to the
© Copyright 2006-2013, Inflectra Corporation
Page 163 of 3
This document contains Inflectra proprietary information
current file. Clicking on the hyperlink for the artifact will take you to the appropriate artifact page inside the
project (assuming your user has permissions to access that information).
In addition, you can use the “Add New Association” section to add a new association from the current
source code file to an existing artifact in SpiraTeam. To add the association, you just need to select the
type of artifact being associated (requirement, test case, incident, etc.) and the numeric ID of the artifact.
For example to add an association to Requirement RQ00005 you would choose Artifact Type =
Requirement and Artifact ID = 5.
12.3. Source Code Revision List
If you click on the “View Revision Log” hyperlink on the main Source Code page, it will take you to the
Revision List page that displays all the revisions made to the project in a sortable, filterable list:
Each revision in the list is displayed with its name, a description of what changed in the revision, the
name of the person who committed the revision, and whether the revision was a change of the actual
content, or just a change of the properties of the content. Clicking on the hyperlink for the revision name
will take you to the Revision Details page for that revision (see section 12.4 below).
12.4. Source Code Revision Details
When you click on a revision hyperlink in either the project revision log or the file revisions tab described
above, you are taken to the revision details page illustrated below:
© Copyright 2006-2013, Inflectra Corporation
Page 164 of 3
This document contains Inflectra proprietary information
This page is made up of three areas; the left pane is for navigation, the upper part of the main pane
contains the details of the revision, and the bottom part of the right pane contains the list of files that were
changed in this revision and the list of artifacts that the revision is associated with.
The navigation pane consists of a link that will take you back to the source code revision list, as well as a
list of other revisions associated with the current file. This latter list is useful as a navigation shortcut; you
can quickly view the detailed information of all the peer revisions by clicking on the navigation links
without having to first return to the main revision list page.
The top part of the main pane allows you to view the details of this revision in the version control system,
including the description of what was changed, the date that the change was made, and the name of the
person who made the change.
The lower part of the main pane can be switched between two different views by clicking the appropriate
tab. Initially the pane will be in “Files” mode, but it can be switched to “Associations” as well. The
functionality in each of these two views is described below:
12.4.1. Files
This view displays the list of files that were changed in the current revision:
Each file in the list is displayed with its name, the file-size, who made changes to the file, what action was
performed on the file (added, deleted, replaced, updated, etc.) and the most revision that exists for that
file. Clicking on the filename will take you to the appropriate file details page (see section 12.2), and
clicking on the revision hyperlink will take you the appropriate revision.
12.4.2. Associations
This view displays a list of the SpiraTeam artifacts in the current project that are associated with the
current revision. This allows you to see which requirements, incidents or tasks were affected by this
specific change to the source code:
© Copyright 2006-2013, Inflectra Corporation
Page 165 of 3
This document contains Inflectra proprietary information
Clicking on the hyperlink for the artifact will take you to the appropriate artifact page inside the project
(assuming your user has permissions to access that information). Note that these associations cannot be
modified in SpiraTeam as they are creating directly inside the version control system. If you want to
change/add associations, please refer to the appropriate section of the SpiraPlan/Team Version Control
Integration Guide.
13. Mobile Access
This section describes the functionality available in SpiraTeam® when accessing the system from a
mobile device such as an iOS® smartphone / tablet (iPod Touch®, iPhone® and iPad®) or an Android®
smartphone / tablet (Galaxy, Nexus, Droid, Kindle Fire®, etc.).
When you access the main SpiraTeam URL using a mobile device, the system will detect that you’re
using a mobile web browser and automatically redirect to you the mobile login page:
Once you have entered your username and password, click the <Log In> button and you’ll be taken to the
mobile version of the “My Page”:
From this page you can view the list of your assigned test cases and test sets as well as any test runs
that you were in the middle of executing. You can click on the <Execute> buttons to run one of your
© Copyright 2006-2013, Inflectra Corporation
Page 166 of 3
This document contains Inflectra proprietary information
assigned test cases / test sets or click the <Resume> button to continue with a test run that you had
previously started.
13.1. Executing Test Cases/Sets
When you click on one of the <Execute> or <Resume> buttons on the “My Page”, you will be taken to the
mobile test execution screen:
You need to choose the release, build and any test run custom properties, then click the <Next> button to
view the test cases and test steps:
© Copyright 2006-2013, Inflectra Corporation
Page 167 of 3
This document contains Inflectra proprietary information
If you need to navigate between the different test cases and test steps, click on the grey navigation bar on
the left of the page and the popup navigation menu will appear:
If the expected results are indeed observed, then you simply need to click the <Pass> button to mark the
test step as passed, and advance to the next test step, or if all the steps have passed, you can click
<Pass All> to pass all the steps at once. This is illustrated in the screen shot below:
© Copyright 2006-2013, Inflectra Corporation
Page 168 of 3
This document contains Inflectra proprietary information
If the actual results differ from those expected, you need to enter a description of the result observed and
click the <Fail>, <Blocked> or <Caution> button; this is illustrated in the screen-shot below:
© Copyright 2006-2013, Inflectra Corporation
Page 169 of 3
This document contains Inflectra proprietary information
Unlike the <Pass> button, if you don’t enter a description of the actual result, the system will display an
error message and re-prompt you again for input. In the case of a failure, both the individual test step and
the overall test case will be marked with a red square containing a cross. Similarly, in the case of a
blocked test case, they will be marked with a yellow square, and in the case of a caution, they will be
marked with an orange square. Once marking a test step as <Failed>, <Caution>, or <Blocked>, you will
automatically be taken to the first test step in the next test case; or if it is the last test case being
executed, the <Finish> button will be displayed instead.
© Copyright 2006-2013, Inflectra Corporation
Page 170 of 3
This document contains Inflectra proprietary information
Legal Notices
This publication is provided as is without warranty of any kind, either express or implied, including, but not
limited to, the implied warranties of merchantability, fitness for a particular purpose, or non-infringement.
This publication could include technical inaccuracies or typographical errors. Changes are periodically
added to the information contained herein; these changes will be incorporated in new editions of the
®
publication. Inflectra Corporation may make improvements and/or changes in the product(s) and/or
program(s) and/or service(s) described in this publication at any time.
SpiraTest®, SpiraPlan®, SpiraTeam® and Inflectra® are registered trademarks of Inflectra Corporation in
the United States of America and other countries. Microsoft®, Windows®, Explorer® and Microsoft
Project® are registered trademarks of Microsoft Corporation. iOS, iPod, iPad and iPhone are registered
trademarks of Apple Corporation, Android® is a registered trademark of Google Corporation, and Kindle
Fire® is a registered trademark of Amazon LLC. All other trademarks and product names are property of
their respective holders.
Please send comments and questions to:
Technical Publications
Inflectra Corporation
8121 Georgia Ave
Suite 504
Silver Spring, MD 20910
U.S.A.
[email protected]
© Copyright 2006-2013, Inflectra Corporation
Page 171 of 3
This document contains Inflectra proprietary information