1
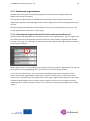
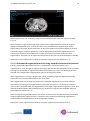
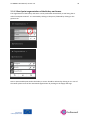
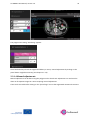
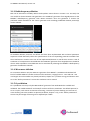
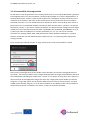
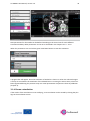
Go SMART User Manual, version 1.0
1
Generic Open-End Simulation Environment
For Minimally Invasive Cancer Treatment
User Manual
Version 1.0
Go SMART User Manual, version 1.0
2
Table of contents
General introduction ............................................................................................................................ 4
Account registration ............................................................................................................................. 6
1. Phase I: Creating a patient and upload images. ................................................................................ 7
1.1.1 Patient registration. ........................................................................................................... 7
1.1.2 Use of existing patients...................................................................................................... 8
1.2 Uploading scans .......................................................................................................................... 8
1.2.1 Requirements .................................................................................................................... 8
1.2.2 Uploading .......................................................................................................................... 9
1.3 The viewer ................................................................................................................................ 10
1.3.1 Contrast images section. .................................................................................................. 12
1.3.2 Moving through scan ....................................................................................................... 14
1.3.3 Viewer contrast ............................................................................................................... 15
1.3.4 Zooming ........................................................................................................................... 17
2. Phase II: Segmentation. .................................................................................................................. 18
2.1 General requirements ............................................................................................................... 18
2.2 Image registration for simulation .............................................................................................. 18
2.3 Segmentation for simulation .................................................................................................... 20
2.3.1 Automated segmentation ...................................................................................................... 22
2.3.1.1 Automated segmentation of the liver and associated vessels ...................................... 22
2.3.1.2 Automated segmentation of the lung, bronchi and associated vessels ........................ 23
2.3.1.3 Seed point segmentation of the the kidney and tumor ................................................ 24
2.3.1.4 Manual adjustments ..................................................................................................... 25
2.4 Image registration for system validation................................................................................... 27
2.5 Segmentation for system validation ......................................................................................... 30
3. Phase III: Simulation ....................................................................................................................... 31
3.1 Simulation for planning purposes ............................................................................................. 31
Go SMART User Manual, version 1.0
3
3.1.1 General requirements...................................................................................................... 31
3.1.2 Performing simulations .................................................................................................... 31
3.1.1 Radiofrequent ablation .................................................................................................... 32
3.1.2 Microwave ablation ......................................................................................................... 32
3.1.3 Cryoablation .................................................................................................................... 32
3.1.4 Irreversible electroporation ............................................................................................. 33
3.1.5 Continuing after appropriate setting are made ............................................................... 33
3.1.6 Rerun a simulation ........................................................................................................... 34
3.2 Simulation for system validation purposes ............................................................................... 35
3.2.1 General requirements...................................................................................................... 35
3.2.2 Simulation with single tip needles ................................................................................... 35
3.2.3 Simulation with needles containing multiple tines .......................................................... 36
3.2.4 Rerun a simulation ........................................................................................................... 36
4. Phase IV: Validation ........................................................................................................................ 37
4.1 General requirements ............................................................................................................... 37
4.2 Performing validation ............................................................................................................... 37
Go SMART User Manual, version 1.0
4
General introduction
The GO SMART website is an open source interactive web based service to enable interventionalists
to predict the outcome of minimal invasive cancer therapies (MICTs). The current available
treatments on this website, which are validated consist of radiofrequency ablation (RFA), irreversible
electroporation (IRE) and microwave ablation (MW) of the liver and the lung, and cryoablation (CA)
and RFA of the kidney. Additional information regarding the available methods can be found using
the links in the right top corner on the frontpage of the website.
The Go SMART environment is developed for three types of usage: First, interventionalists using it for
planning of minimal invasive cancer treatment. Second, the environment is designed to enable
validation of the simulation tools (system validation) for each method of treatment. Third,
developers can use the developer corner, which is extensively described elsewhere.
To explore the website's functionality, first an account must be created using a short registration
process. After this, the system is developed into four different phases, which the user must pass step
by step. The first phase (I) consists of creating a patient and upload of the proper images, which is
followed by a segmentation of the relevant anatomical structures (II), simulation of the procedure
(III) and validation of the simulation result (IV).
Phase I
Phase II
Phase III
Phase IV
Go SMART User Manual, version 1.0
5
The segmentation of the relevant anatomical structures including the tumor is necessary in order to
properly simulate the ablation and to overlay the predicted ablated lesion on the tumor.
Generally the environment has two main purposes:
1) To compare the simulated ablation zone to the segmented tumor in order to predict the outcome
of an intervention. Here the environmental focus is on planning purposes for a MICT.
2) To compare the simulated ablation zone to the real ablation zone. The latter gives direct feedback
about the accurateness of the simulation model and points out drawbacks, which might need
improvement, also known as system validation.
Interventionalists who are using the environment for planning purposes only are recommended to
read chapters 1, 2.1-2.3, 3.1 and 4. If a system validation is performed, it is recommended to follow
all subsequent steps described in this manual.
Go SMART User Manual, version 1.0
Account registration
To create an account click “register” in the login section on the frontpage of the website. For
registration a valid email address is required.
6
Go SMART User Manual, version 1.0
7
1. Phase I: Creating a patient and upload images.
1.1.1 Patient registration.
Once logged in, click on “Patients” in the black beam in top of the screen.
In the “Patients” screen all previously uploaded patients are visible to the user. Here you might find
predefined demo cases to immediately try out the environmental functions. To create a new patient
click on the “New Patient” button in the top right of the screen.
Subsequently fill out the patient data and descriptions in the section that appears and confirm by
pressing the “create” button. An anonymized name should be used as an alias to preserve patient's
privacy.
Go SMART User Manual, version 1.0
8
The patient is now available in the patient section.
Three actions can be performed for each patient visible in the patients section. To edit patient data
or to remove the patient definitively use the pencil or bin logo respectively. Under the edit patient
section also subsequent data can be filled in to create a complete Case Report Form (CRF). Using
these CRFs a complete database can be build up for scientific purposes. The first logo, the eye, is
used to open the patient in the viewer. Once the viewer is opened user can upload the first CT or MRI
scans.
1.1.2 Use of existing patients
When clicking “Patients” in the black beam on top of the screen, the start screen viewing all
previously uploaded patients becomes visible and can be selected. All uploaded images, as well as
performed actions like segmentations and simulations are saved automatically when returning to the
patient overview.
1.2 Uploading scans
In this section CT or MRI scans containing the full target organ and a contrast enhanced visualization
of larger vessels should be uploaded.
1.2.1 Requirements
Before uploading the DICOM-files should be exported from any source system (e.g. CT or PACS
workstation) into any folder and zipped into an archive (*.zip). NIFTII files are suitable as well. For
patients anonymity please be aware that all data should be anonymized before placing them in the
archive. To reduce upload time, only relevant parts of the whole dataset, e.g. only a single or relevant
series (e.g. cortical phase kidney CT scan or only the venous phase of a liver CT) can be uploaded. Still
all files need to be zipped. It is of utmost importance that the vital structures are clearly visible on
the uploaded scan. If separate structures are best visualized on different series all of these series
Go SMART User Manual, version 1.0
9
should be uploaded. For further specifications on which phase is required for segmentation of the
vital structures see chapter 2.1.
1.2.2 Uploading
Use the upload logo in the “Uploaded Images” bar in the left of the viewer to select images for
upload.
Select the zipped folder containing the appropriate images. Uploading can take up to 10 minutes or
more for scans containing all phases as the upload speed is dependent on internet connection. The
progress bar in the section “Uploaded Images” shows the progression of the upload. Once uploading
is completed, the progress bar changes its state to “converting” as in the background a conversion
into the NIFTI file format is performed. Another time duration of conversion is depended on the size
Go SMART User Manual, version 1.0
10
of the scan files. If uploading takes more than 10 minutes, an upload of only selected phases with
good visibility of the organ, tumor and vessels can be considered.
1.3 The viewer
After the upload is complete, the uploaded scan series appear in the "contrast images" section. Here
all series are listed separately below each other.
Go SMART User Manual, version 1.0
11
Go SMART User Manual, version 1.0
12
1.3.1 Contrast images section.
Three separate logos are visualized for every series.
Using the “eye” logo a single series is selected and opened in the viewer. The viewer always displays
the selected series in 3 orthogonal planes: sagittal, coronal and axial. The pink “eye” logo marks the
currently viewed series.
In case more series are uploaded the “M” logo will mark the selected series as a "master image". The
master image is used to register series that are needed for segmentation (e.g. where structures to be
segmented are best visible). In case of a single uploaded series this can directly be registered without
the need for a master image. Series available for registration can be selected with the “R” logo which
will appear after a master series is registered.
The registration process can take up to 5 minutes per series. Once the series registration is
completed the registered series appear in the “Registered Images” section (on top of the “Uploaded
Images” section). The registered images can be used for the automated segmentation, so make sure
to only register the series used for segmentation.
Go SMART User Manual, version 1.0
13
The “i” button opens a pop-up window showing file information and series metadata. This might be
helpful when looking for the right series number among several uploaded datasets.
Go SMART User Manual, version 1.0
14
1.3.2 Moving through scan
Scrolling through the slices is done by scrolling the mouse wheel, the scrolling is performed in the
plane over which the pointer of the mouse is positioned. Three crosshair lines are visible in each
viewer plane. All three are represented by a separate color. Green for the Y, blue for the Z and red
for the X plane respectively. By clicking on a region in one plane the center of the corresponding
planes be set to this region respectively. The selected coordinates of this point is displayed in the top
right and bottom right corner of the viewer of each plane.
Go SMART User Manual, version 1.0
15
1.3.3 Viewer contrast
The window contrast of the images can quickly be adjusted to preset values for several
organs/anatomical regions using the green preset buttons in the bottom right corner of the viewer.
Preset values are available for thorax/mediastinum (T1), thorax/lung (T2), bone (B), spine (S), liver (L)
and abdomen (A). The contrast can be optimized manually using the slider bar above the preset
buttons.
Go SMART User Manual, version 1.0
16
Go SMART User Manual, version 1.0
17
1.3.4 Zooming
Zooming in and out can be done in the different planes using the magnifying glasses above the
dotted line, the zooming can be undone using the transparent magnifying glass. Note that the
transparent magnifying glass also resets the coordinate of the selected point back to the center of
the image in every plane, even when no zoom is used. To show only a single plane use the up arrow
above the dotted line. The down arrow is used for switching back to the standard viewer with 3
orthogonal planes.
Go SMART User Manual, version 1.0
18
2. Phase II: Segmentation.
Segmentation of anatomical structures from pre-interventional image data is the critical step in
building patient-specific 3-D models required for the simulation. For the simulation of the MICTs the
treated organ and the tumor must be segmented. In case of liver treatment also vessels need to be
segmented, for lungs also vessels and bronchi need to be segmented. How to perform segmentation
is explained below.
When using more than one series for segmentation of the relevant structures the procedure of
image registration is required before the segmentation should be started. The process of image
registration means that different series images are correctly matched using anatomical landmarks.
2.1 General requirements
Anonymous pre-interventional images must be uploaded as described above. For segmentation
purposes different organs and structures require different phases for segmentation.
The liver can be segmented in every phase, although the vessel and tumor segmentation require a
portal venous phase. Primary hepatic carcinomas might be better visualized using an arterial phase
series.
The lungs and bronchi can be segmented in any phase, for the tumor and vessels an arterial phase is
required.
The kidney and tumor are best visualized using a cortical phase.
Intraprocedural images for validation purposes should be a series where the needles are in their
definitive position before start of the MICT and are clearly visible. The whole needles should be
displayed and ideally the entire organ should be visualized, but this is not absolutely mandatory.
Follow-up images for validation purposes should contain clear visualization and demarcation of the
ablated lesion, most likely in contrast enhanced images.
2.2 Image registration for simulation
The purpose of image registration is the matching of anatomical landmarks from different series
(with other patient positions, breathing phase, etc.). For instance when segmenting a liver lesion and
liver vessels as anatomical structures, different series might be needed for the segmentation process.
First a master file onto which the other images are registered is selected by clicking on the “M” mark
of the appropriate master series.
Go SMART User Manual, version 1.0
19
In case of a single uploaded series or when just a single series is required for segmentation this
master series can be used without registering other series. In case of more required series for the
segmentations, make sure that the structures to be segmented are best visible in the selected series
(e.g. contrast enhanced series for vessel segmentation).
After selecting the appropriate master series, the other series can be registered using the “R” logo.
Registration can take up to several minutes and a progress bar stating that conversion is ongoing will
appear.
Go SMART User Manual, version 1.0
20
2.3 Segmentation for simulation
Segmentation is performed using the tools in the “segmentations” part below the “contrast images”
section.
Make sure that all necessary images showing the needed vital structures are registered. For
segmentation of any structure select the registered series displaying this structure best by clicking on
the “eye” logo.
Go SMART User Manual, version 1.0
Hint: If the “segmentation” section is not visible because of many uploaded series in the “contrast
image” section minimize the „contrast image” section by clicking on its section header.
21
Go SMART User Manual, version 1.0
22
2.3.1 Automated segmentation
Basically there are 2 types of automated segmentation. Fully automated segmentation and
segmentation using a seed point.
Fully automated segmentation is available for liver and lung. For both organs vessels can be
segmented using fully automated segmentation and in lungs the bronchi should be segmented using
this tool.
Seed point registration should be used for kidney, where no vessel segmentation is necessary, and
for the segmentation of the tumor in every organ.
2.3.1.1 Automated segmentation of the liver and associated vessels
The fully automated segmentation is marked by a wheel in the “segmentations” part. To segment the
liver make sure that the appropriate series (on which liver is best visible) is registered and selected
(the pink “eye” logo is on). Nothing has to be selected in the image and the segmentation is initiated
by clicking on the wheel.
When segmentation is running a progress bar stating “initializing” appears. Segmentation can take up
to 10 minutes or more, depending on the server load and size of the image datasets.
In case of a liver segmentation, the result of the automated process must be checked for faults
before continuing to segmentations of the other structures. Furthermore it is important that the
entire tumor is enclosed within the segmentation of the organ. Segmentation might fail in cases with
anatomical abnormalities such as previous hepatic surgery is present (see an example case in the
following picture, where the spleen and liver are very close to each other and recognized as a single
organ).
Go SMART User Manual, version 1.0
23
Manual adjustments can be done by using the tools available under the pencil logo (see chapter
2.3.1.4).
Once the organ is segmented properly the vessels can be segmented fully automated using the
appropriate registered series. It works the same as the automated liver segmentation. Vessel
segmentation cannot be adjusted manually. As the tumor might show an enhancement in contrast
enhanced images it might be regarded as a vessel during automated vessel segmentation in an
arterial contrast phase. From experience it is best to use the portal venous phase for vessel
segmentation. The tumor can be segmented afterwards on the series in the arterial phase if needed.
Subsequent tumor segmentation is done by seed point registration (see chapter 2.1.1.3).
2.3.1.2 Automated segmentation of the lung, bronchi and associated vessels
The fully automated segmentation function is initialized by a click on the wheel in the
“segmentations” part. In order to segment the lungs make sure that the appropriate series (on which
the lungs are best visible) is registered and selected (the pink “eye” logo is on). Nothing has to be
selected in the image and the segmentation starts by clicking on the wheel.
When segmentation is running a progress bar stating “initializing” appears. Segmentation might
takes more than 5 minutes depending on the server load.
After segmentation of the lungs the result of the automated segmentation must be checked for
faults before continuing to the segmentation of the other structures. It is of importance that the
entire tumor is enclosed within the segmentation of the organ. Segmentation might fail in cases with
anatomical abnormalities. Manual adjustment can be done by using the tools available under the
pencil logo (see chapter 2.2.1.4).
Once the lungs are segmented properly, the vessels and bronchi can be segmented fully automated
using the appropriate registered series. It works the same as the automated lung segmentation.
Vessel and bronchi segmentations cannot be adjusted manually.
Subsequent tumor segmentation is done by seed point registration (see chapter 2.1.1.3).
Go SMART User Manual, version 1.0
2.3.1.3 Seed point segmentation of the kidney and tumor
The segmentation of the kidney and tumor can be performed automatically as well using the so
called "seed point method". It is activated by clicking on the pencil, followed by clicking on the
pipette icon.
Next a representable point within the kidney or tumor should be selected by clicking on it in one of
the viewer planes. Start of the automated segmentation by clicking on the floppy disk logo.
24
Go SMART User Manual, version 1.0
25
The progress bar stating “initializing” appears.
Once finished always check the segmented kidney or tumor, manual adjustment by clicking on the
pencil button might be necessary (see chapter 2.1.1.4).
2.3.1.4 Manual adjustments
Manual adjustment can be done using the polygon tool or brush tool. Adjustment can and must be
done on all separate images in a series requiring manual adjustment.
These tools are visible after clicking on the “pencil logo” next to the segmented anatomical structure.
Go SMART User Manual, version 1.0
26
The refinement compartment will become available.
Using the polygon tool any adjustment of the segmented region can be performed by setting several
new corner points of the polygon, which will be connected after the last dot is placed over the first.
To activate the tool click on the “pencil” logo and use a left mouse click to place each dot.
Go SMART User Manual, version 1.0
27
When the figure is fully surrounded by dots it is marked as a segmented part.
When the new polygon is partially inside the previous automated segmented area, this area will be
just added to the existing segmented area.
Using the brush tool a segmented part can be freely extended. To activate it click the “brush” logo
and use a left mouse click to draw any extension to the segmented area.
Store your manual corrections by clicking on the floppy disk logo and another segmentation process
will start, which incorporates your adjustments.
2.4 Image registration for system validation
This chapter is only relevant when simulation is performed to compare the simulated lesion to the
true lesion, as for the system validation (see chapter 3.2).
Once the simulation of the procedure is finished, the result of the simulation can be validated using
the images of the real procedure, if an image dataset with the needle positioned in the ablation
position and a dataset after the ablation were acquired.
During the validation process the simulated results are compared to the true result of the procedure.
To enable this comparison the virtual needles need to place as exact as possible compared to the real
situation. To enable this the images acquired during the procedure must be registered to the
preoperative images, meaning that the anatomical landmarks are matched, so that the segmentation
results are comparable between scans acquired at two different time points. Also the follow up scan
must be registered on the pre-operative scan. This enables accurate segmentation of the ablated
lesion of the true procedure.
Go SMART User Manual, version 1.0
28
The registration of the intra-operative and follow up scans to the pre-operative scan cannot be done
automatically because the scans are made at different time points with different patient positions.
Therefore a point based image registration should be used.
The point based registration can be activated through the “PB” icon behind a pair of series to be
registered. For each pair of series this logo must be activated, most likely the “master” series or any
previous registered image and the interventional or post-interventional series on the other hand.
Simply click the "PB" button in a series of the registered images and afterwards in the series you
want register.
To start the point based registration process in the selected series click the “+” logo in the appearing
“point based” registration section.
Now the system enables the user to select points on the images in the already “registered image”
(e.g. master image). Select anatomical landmarks that can be easily identified on the images that
need to be registered. All landmarks must be set on the same series. A maximum of 10 landmarks
Go SMART User Manual, version 1.0
29
can be set on the images. Each landmark is activated by using the “plus” logo in the “point based
registration” section. To set it to a specific landmark activate the entry's “pencil” logo and place the
landmark by left click on any coordinate in the viewer planes. When it is successfully placed the
button next to the pencil will turn green. Once enough landmarks are set click the “sample” button
to set the images as a sample for the images that need to be registered.
Once the “sample” button is activated, the viewer switches to the new series, which is intended to be
registered. When subsequently activating the pencil logo another time for each specific landmark,
the former placed landmark is displayed automatically viewed in the lower right plane of the viewer
layout. This helps in searching for exactly the same landmarks and enables the user to place the
landmark coordinates in the new series as accurate as possible according to the previous selection.
Once all landmarks are placed, activate the registration process by clicking on the “register” button.
Go SMART User Manual, version 1.0
30
A progress bar stating that “conversion” is ongoing appears. This can take up to five minutes or more
depending on the server load.
You can verify the accurateness of the registration by checking, whether the anatomical structures fit
in the segmented areas. In case of large misfits the process should be repeated. Therefore using
more anatomical landmarks might help.
2.5 Segmentation for system validation
Before segmentation for system validation is performed make sure the intra- and postoperative
images are registered using point based registration (chapter 2.4).
Segmentation of the organ, tumor and if necessary vessels and bronchi is done on the preoperative
scan as described in chapter 2.3. The additional segmentation required for the validation process is
the segmentation of the ablated lesion on the postoperative series. Make sure to use a series where
the ablated lesion is sufficiently visible. Open this series in the viewer. In the “segmentations” part
open the “lesion” by clicking on the pencil logo.
For the segmentation of the lesion a seed point registration process is used as described in chapter
2.3.1.3. After the lesion is segmented continue with the simulation for system validation as described
in chapter 3.2.
Go SMART User Manual, version 1.0
31
3. Phase III: Simulation
3.1 Simulation for planning purposes
3.1.1 General requirements
Before starting with the simulation make sure the organ, tumor and if applicable vessels and bronchi
are segmented on the preoperative images (chapter 2.3).
3.1.2 Performing simulations
Simulation modus is viewed by clicking on “simulation” in the black beam on top of the screen.
The registered series are all viewed in the simulation environment. Make sure that the appropriate
series with the selected structures is selected using the “eye” logo, the virtual needles are placed
within this selected series.
To start a new simulation click the “plus” button in the simulations section.
Next choose the appropriate setting for the: modality, generator, protocol and needle.
There are four modalities available with different available generators, protocols and needles as
described below.
Go SMART User Manual, version 1.0
32
3.1.3 Radiofrequency ablation
RFA can be selected as modality within the dropdown menu shown in section 3.1.2. Currently the
user is able to choose between two generators: the 1500X RF® generator from Angiodynamics or the
RF3000® radiofrequency generator from Boston Scientific. Once the generator is chosen the
preferred needle available for the chosen generator and according predefined ablation protocol(s)
can be selected.
All available ablation protocols are default and have been implemented with technical parameter
sequences which identically reflect the specifications of the corresponding protocols available from
the manufacturers. Similar to the use of the implemented devices in real life that means in case of
simulation of a temperature controlled RFA the 1500X RF® generator from Angiodynamics should be
chosen while impedance controlled RFA can be simulated by selecting the RF3000® radiofrequency
generator from Boston Scientific.
3.1.4 Microwave ablation
For microwave ablation only the AGN-H1.0 generator from AMICA® is available and validated. All
kind of available AMICA® needles can be used for simulation, ranging from 11 - 16 G and 150 - 270
mm length. Once the needles are placed (see below, chapter 3.1.7) and the energy and duration was
set in the “define parameters” section the simulation can be started.
3.1.5 Cryoablation
For cryoablation currently only the MRI Seednet® generator from Galil Medical is available and
validated. The needles ICESeed® and IceRod® can be used for the simulation. The default protocol is
set to 2 cycles, each contain 10 minutes of freezing, 2 minutes of passive thawing and 1 minute of
active thawing. Once the needles are placed (see below, chapter 3.1.5), in the “define parameters”
section the percentage of freezing can be adjusted per needle.
Go SMART User Manual, version 1.0
33
3.1.6 Irreversible electroporation
For IRE there is only one generator set in the drop down menu as currently the NanoKnife® generator
from Angiodynamics is the only one which is commercially available. It is named “Angiodynamics” in
the drop-down menu. As IRE is a multi-needle treatment it is mandatory to place at least two and a
maximum of six needles in the order of their enumeration. How to place more than one needle is
described in section 3.1.7. The needles have to be selected as “Basic” from the drop-down menu. In
general there are no predefined ablation protocols for IRE so that the tab for “protocol” can only be
switched to “empty”. In the section “Define parameters” the preferred input voltages per each single
needle pair have to be entered manually under "CONSTANT_IRE_POTENTIAL_DIFFERENCES" as [a, b,
c] where the order of needle pairs is currently set default as 1-2, 1-3, 2-3 in case of 3-needletreatment. For example [2200, 2230, 2100] would mean 2200 V between needle pair 1-2, 2230 V
between needle pair 1-3 and 2100 V between needle pair 2-3.3.1.7 Continuing after appropriate
setting are made
Once everything is selected click the “V” logo, which means a new virtual needle is created.
Now an entry and target point for the needle can be selected in one of three orthogonal planes of
the viewer. For multi-tip needles as for example the RFA probes the target would ideally be the tip of
the needle before extending the needle tines. Use the “E” to choose an entry point, this is done by a
left mouse click on the appropriate image. The same way a target point of the needle tip is chosen
using the “T” logo. Both points can be placed at different points slices in the same series. A second
needle can be selected using the “V” in the select needle area. The different colors of the needles in
the simulations section are viewed in the viewer, so they can easily be separated.
Go SMART User Manual, version 1.0
34
Next parameters for the needle can be defined according to the clinical use for each different
treatment modality. What parameters can be set is described in the chapters 3.1.3 – 3.1.6.
When the parameters are set click the green simulation button to start the simulation.
A progress bar will appear. Once the simulation is finished it is shown in red on the selected images.
It is easy to see whether the simulation of the ablated lesion is covering the entire tumor, which has
been segmented during the previous steps. An actual quantitative comparison is done by validation
(chapter 4).
3.1.6 Rerun a simulation
If the results of the simulation are not satisfying, a new simulation can be started by clicking the plus
logo in the simulation section.
Go SMART User Manual, version 1.0
35
All setting have to be reset and a new simulation can be started. The number of simulations that can
be ran is unlimited.
3.2 Simulation for system validation purposes
3.2.1 General requirements
Simulation for system validation purposes requires several compulsory steps in addition to a
simulation for planning purposes.
First make sure that an appropriate preoperative series is marked as master series and that an intraoperative scan with the needle(s) in the final position and a follow up scan clearly visualizing the
ablated lesion are point based registered (as described in chapter 2.4).
Next in the segmentations part the organ and tumor, and if applicable the vessels and bronchi should
be segmented on the preoperative scan in a similar way as described in chapter 2.2. The lesion
should be segmented as described in chapter 2.5.
3.2.2 Simulation with single tip needles
In case the simulation is performed for validation purposes, the needles must be placed as accurate
as possible in comparison to the real situation. Straight needles with one tip are ease to recognize on
the registered intra-operative image and virtual needles can be placed over the real needles in the
intra-operative images. For details regarding needle placement see chapter 3.1.5. To simulate the
real situation make sure that all simulation setting are set according to the real procedure. For details
on all treatment modalities see chapter 3.1.1-3.1.4. Once all needles are placed and the parameters
set, start the simulation by clicking the green simulation button.
Go SMART User Manual, version 1.0
36
(Figure: needles placed as accurate as possible over the real needle position in the intraoperative
image)
3.2.3 Simulation with needles containing multiple tines
In case of for instance RFA, the needle has several tines once positioned. The position of the tines will
affect the simulation. To be sure the virtual needle is exactly in the same position as the real needle,
the real needle can be registered on the intraoperative images. To simulate the real situation make
sure that all simulation setting are set as during the procedure. For details on all treatment
modalities see chapter 3.1.1-3.1.4. Once all needles are placed and the parameters set, start the
simulation by clicking the green simulation button.
3.2.4 Rerun a simulation
If the results of the simulation are not satisfying, a new simulation can be started by clicking the plus
logo in the simulation section.
All setting have to be reset and a new simulation can be started. The number of simulations that can
be ran is unlimited.
Go SMART User Manual, version 1.0
37
4. Phase IV: Validation
The purpose of validation is to compare the segmented structures in terms of overlap and it is
generally used in 2 situation.
1) To compare the simulated ablated lesion to the tumor to predict the outcome of an
intervention when using the environment for planning purposes.
2) To compare the simulated lesion to the real ablated lesion. This gives direct feedback about
the accurateness of the simulation model and point out drawbacks that might need
improvement.
4.1 General requirements
When using the validation for planning purposes make sure the simulation is finished as described in
chapter 3.1.
For validation of the simulated lesion make sure that the simulation is performed as described in
chapter 3.2. Also make sure that the follow up scan containing good visualization and demarcation of
the ablated lesion is point based registered as described in chapter 2.4 and that the ablated lesion is
segmented as described in chapter 2.5.
4.2 Performing validation
Once the simulation is finished go to the validation phase by selection it in the black beam in the top
screen. It is possible to compare 2 segmented structures by setting a reference and a sample by using
the “S” and “R” in the segmentations section respectively.
For instance when the simulated lesion should be compared to the true lesion set the simulation as
sample and the lesion as reference and click validation.
Go SMART User Manual, version 1.0
A screen will pop up with the validation results.
38