1
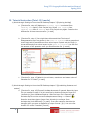
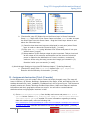
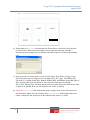
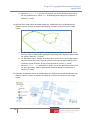
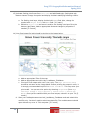
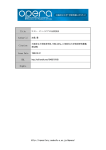
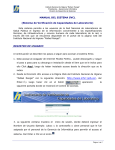
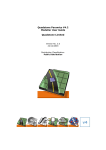
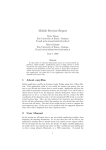
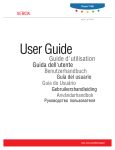
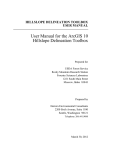
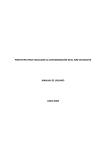
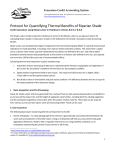
Geog 255: Geographical Information Science I Spring 2011 LAB1: Getting Started
ArcGIS Desktop
lab date January 12, 2010 – In Lab
due date January 26, 2010 – In Lab
deliverables • Answer sheet
• ArcMap document (.mxd)
• Hard copy ArcMap Layout view
I. Introduction In GEOG 255 labs, you will learn to use GIS software called ESRI ArcGIS Desktop which is
one of the most commonly used software packages among GIS users. ESRI ArcGIS Desktop
has two major applications; ArcMap (left) and ArcCatalog(right).
GEOG 255 has five main labs for this semester and each lab is composed of two sections; a
tutorial and assignment section.
In the tutorial section, you need to follow directions of the user manual, Getting to know
ArcGIS Desktop: ESRI press. While doing the tutorial section, you will be asked to answer
some questions to evaluate whether you fully understand the instructions. In the
assignment section, you may be asked to do your own project using the knowledge
obtained from the tutorial section and GEOG 255 lectures.
The labs will not only teach you how to use the ESRI ArcGIS Desktop applications, but also
will reinforce the concepts covered in the lectures. When you work through the tutorial or
assignment section, examine every step by displaying the result. If the result is different
1 Geog 255: Geographical Information Science I Spring 2011 from what you expect, rethink what you are doing and check if you are on the right track. It
is strongly recommended to read the lab handout completely BEFORE starting the tutorial
and the assignment.
Here’s the useful links. You may have to refer some online web pages to answer questions.
o
o
o
o
o
o
ESRI ArcGIS Desktop 9.3 online Help (HTML format):
http://webhelp.esri.com/arcgisdesktop/9.3/index.cfm?TopicName=welcome
ESRI ArcGIS Desktop 9.3 Help (inside program): Help>>ArcGIS Desktop Help
(menu)
ESRI Resource Centre: http://resources.esri.com
Lab materials and data folder: My Computer >> S: Drive >> Geog 255-Data
GIS data for your project: My Computer >> S: Drive >> Data Warehouse
Homework hand-in folder: My Computer >> S: Drive >> Homework >> Geog255
II. Data download and Assignment submission This Data download and assignment submission procedure is applied to this and all future
labs.
First, log on with your SIS account and password. If there is any problem regarding your
SIS log on, contact a SIS lab administrator.
Second, double click My Computer icon from the desktop and go to D:\Temp folder.
Third, delete all existing files and folders from D:\Temp. Copy appropriate data from S:
drive and paste them into D:\Temp which is your working space. If you are not sure how to
copy data from S: drive, contact a SIS lab administrator or your TA.
Fourth, after finishing your work, backup everything you need into your personal USB
memory stick or H: drive. Make sure any data left in D:\Temp folder may be deleted by
next users.
Lastly, if you are requested to submit digital format
assignments, copy your final output into
S:\Homework\Geog255\Labxx folder. You do have a
write permission, but not a Modify permission; it
means that you can upload your file into the
Homework folder but you CANNOT delete the file once
the file is uploaded. To delete the file from the
Homework folder, contact a SIS administrator.
2 Geog 255: Geographical Information Science I Spring 2011 III. Tutorial Instruction [Total: 12.5 marks] 1) Work through Getting to Know ArcGIS Desktop chapter 3 [Exploring ArcMap]
a. [Exercise 3a, step 19] Make sure <Top-most layer> is selected from
Identify from option. Click Caripito city. Select <All layers> from
Identify from lists of Identify tool. Click Caripito city again. Describe the
differences of these two scenarios. [1 mark]
b. [Exercise 3b, step 1] You might have discovered that The Area of
Disappearance layer was shown in the table of contents with a grayed-out
check mark which was different from other layers. Explain why the layer is
shown differently from other layers in the table of contents. You will find
the answer of this question once you finish Exercise 3b. [1 mark]
c. [Exercise 3c, step 15] What is the minimum, maximum and mean value of
elevation for 27 cities? [1 mark]
2) Work through Getting to Know ArcGIS Desktop chapter 5 [Symbolizing features and
rasters]
a. [Exercise 5c, step 18] Close all ArcMap documents if opened. Open the layer
file you created in step 15 in this exercise by double clicking the layer file
(Animals.lyr) from Windows Explorer. After the layer file is opened, add
Animals.shp file on the current ArcMap document using Add button ( ).
Describe how these layers (layer from Animals.lyr and layer from
Animals.shp) look differently. [1 mark]. From this example, describe the
benefits when you save a shapefile as a layer format (.lyr). You can refer
ArcGIS 9.3 online if needed.[1 mark]
3 Geog 255: Geographical Information Science I Spring 2011 b. [Exercise 5d, step 4] When you add a raster file, a pop up window titled
Create pyramids will be displayed. If you click Use my choice and … check
box, you will not get this window when you open a raster file later. If you
want to open this window again, go to Option >> Raster tab from the main
ArcMap menu and select Always prompt for pyramid calculation option.
When you add a raster file with Pyramid option (clicking Yes button), a new
file would be created. Identify the file type (extension) of the new created file.
[0.5 mark] Describe the functionalities of Pyramid files. ArcGIS 9.3 Online
help would be a good source to answer this question [1 mark].
3) Work through Getting to Know ArcGIS Desktop chapter 6 [Classifying features and
rasters]
a. [Exercise 6a, step 21] Sometimes, people prefer simple labels (lower right
image) than complex ones (lower left image). Change the label of Countries
layer in the table of content to be as simple as possible (it should still be
meaningful) similar to the image below (right) and describe how you edited
the label. [0.5 mark]. Once the label editing is done, copy your label
displayed in the table of content using Windows print screen and Paint
program and paste it in your answer sheet. [0.5 mark]. Ask your TA, if you
are not sure how to use Windows Print Screen and Paint program.
4 Geog 255: Geographical Information Science I Spring 2011 b. [Exercise 6d, step 23] Right click on the Rivers layer in Rivers frame and
select copy. Right click on the Power frame and select paste in order to insert
the Rivers layer into this Power frame. Drag the Rivers layer below to and
above the Countries layer.
(1) Describe how these two layers are displayed in each case (when Rivers
layer is under or above the Countries layer). [1 mark].
(2) Copy your Data View using Windows Print Screen and paste it into your
answer sheet [1 mark].
(3) Interpretation of GIS analyst output is quite important. Take a close look
at the output of this exercise and describe how the source of electrical
power is related to the distribution of rivers in northern, central and
southern Africa using the map (screen shot image) you created in (2).
Describe it with your own words. [1 mark].
4) Work through Getting to Know ArcGIS Desktop chapter 7 [Labeling features]
a. [Exercise7b, step3] Click Scale Range button from Layer Properties.
Describe the functionality of the button. [1 mark] IV. Assignments Instruction [Total: 25 marks] In this assignment, you will create a Simon Fraser University thematic map. The map will
have six frames; Air Photos, Buildings, Restaurants, Bus Stops, ATMs, and Parking Lots. An
ArcMap document file, Lab1_LastName_FirstName.mxd, will be given to you. This document
already contains Air Photos, Buildings and Bus Stops frame. Make sure features’ attribute
information and their geographic values are correct. You will edit or create features’
attribute values and geographic locations in lab5.
1) Go to File>>Document Property from ArcMap main menu and press Data Source
Options button. Select Store relative path names to data sources selection
from Data Source Options if needed. For more information regarding to saving
data with relative path, refer the following link:
http://webhelp.esri.com/arcgisdesktop/9.3/index.cfm?id=205&pid=197&topicname=Referenci
ng_data_in_the_map. Describe the benefit to use this relative path option. [1 mark]
5 Geog 255: Geographical Information Science I Spring 2011 2) Describe why SFU_BM_J.jpg raster image
is not displayed in the given ArcMap
document. [1 mark]
3) Insert three more frames into the given
ArcMap document and rename the frames
as Restaurants, ATMs and Parking Lots.
4) Go to File>>Print Setup from the main
menu. Select Xerox Phaser 7400DX PS
printer and change Paper Size to 11x17
from Page and Print Setup.
5) Change the current view from Data view to Layout
view. Evenly distribute six frames and change their
size. It would be much easier to add six vertical and
four horizontal guide lines (cyan colored lines in the
image below) before changing their size. You can insert
guide lines by right clicking on the ruler and selecting
Set Guide. Ask your TA if it is not still clear how to
insert guide lines.
6 Geog 255: Geographical Information Science I Spring 2011 Parking Lots 6) Switch back to Data View and activate Air Photos frame. Add rest of five jpg files
into this frame. When you add images, you may get this warning message
mentioning these images are not spatilly referenced. Ignore this warning message
now.
7) Now you have five raster layers in this current frame. SFU_Entire_2M.jpg covers
entire SFU and rest six images cover Top Right (SFU_TR_J.jpg), Top Middle (TM),
Top Left (TL), Bottom Right (BR), Bottom Middle (BM), and Bottom Right (BR) part of
SFU. Change each layer’s property in order that the map does not display
SFU_Entire_2M.jpg layer and only display other six layers when the scale of this map
is equal to or greater than 1:3,000 and the vice versa. [2 marks]
8) Switch to Layout View and make these raster images cover entire SFU within the
left top frame. Add a title (Air Photos) using Title or Text functionality above the
frame. Change its font properties to be matched with others. [1 mark]
7 Geog 255: Geographical Information Science I Spring 2011 Buildings Bus Stops Parking Lots 9) Activate Buildings frame and add Roads.shp feature class. Change its symbol and
display its labels as similar to the image below.
a. Open Symbol Selector add Transportation Symbol by pressing More
Symbols button and choose A30 for Roads feature class. Change its width to
3.00. [0.5 mark]
b. Open Layer Properties and go to Display tab. Change its Transparency
from Layer Properties to 50%. [0.5 mark]
c. Open Layer Properties if needed and go to Labels tab. Choose Define
classes of features and labels each class differently from Method.
Add two more classes on top of Default class and rename them as From Left /
Right and To Left / Right. Default class will display STREET field. Change its
Placement Properties and Symbol if needed. Its color, font, font size should
be similar to the labels of the image above. [1 mark]
d. Click Symbol button >>Properties>>Mask tab and select Holo in order that
the STREET label is not hidden by other features. [0.5 mark]
8 Geog 255: Geographical Information Science I Spring 2011 e. From Left / Right class will display FROMLEFT and FROMRIGHT fields at the
same time. After selecting From Left/ Right class, press Expression button.
Type the VBA code as same as the text box below. You will learn what each
line means in the later part of this course. Press Verify button and make
sure there is no syntax error. If no error found, press OK button. Change
Placement Properties, Scale Range, Label Styles, and Symbol. This
label should not display if this map is zoomed out to 1:4,000 or more. Make
sure its color, font, font size and label position should be similar to the labels
of the image above. Once you are satisfied with the FROM Left / Right class
label, apply this process to To Left / Right class. [3 marks]
Function FindLabel ( [FROMLEFT], [FROMRIGHT] )
if [FROMLEFT] <> 0 then
FindLabel = [FROMLEFT] & "/" & [FROMRIGHT]
end if
End Function
f.
Add Building.shp feature class above Roads layer. Display label with
Build_Name field only when this layer is zoomed in 1:3,000 or more. Set up
other label properties such as font, color, font size as you want. [1 mark]
9 Geog 255: Geographical Information Science I Spring 2011 g. Switch to Layout View and zoom in and/or out to the Buildings layers fit to
the top middle frame. Add a Text as Buildings and change its properties if
needed. [1 mark]
10) Activate Bus Stops frame and add Roads.shp, BusRoutes.shp and BusStops.shp
feature classes. Change its symbol and display its labels as similar as the image
below.
a. For Bus Stops layer, change its symbol same as the one in the image above.
You may have to add symbol package by pressing More Symbols button from
the Symbol Selector. [1 mark]
b. For Bus Route layer, change its symbol same as the one in the image above.
You can choose any color, but the symbol must have arrows inside the line
symbols and the direction of the arrows should be correct. [1 mark]
c. Switch to Layout View and zoom in and/or out to the Bus Stops layers fit to
the top right frame. Add an appropriate text and change its properties if
needed. [1 mark]
11) Activate Restaurants frame and add Roads.shp, Buildings.shp and Restaurants.shp
feature classes. Change its symbol and display its labels as similar as the image
below.
10 Geog 255: Geographical Information Science I Spring 2011 h. For Restaurants layer, go to Symbology tab from Layer Properties and choose
Unique values from Categories. Choose Type field for Value Field.
a. Choose different appropriate symbols for each Type categories. Your symbols
could be different from those in the image above but should be meaningful.
[1 mark]
b. For Buildings layer, display only features whose Build_Name is one of
Cornerstone, Academic Quadrangle Maggie Benston Student. You may have
to use VBA code which you used in 8 e). A part of VBA code is provided with
you. You only need to edit one italic font line simply. [2 mark]
Function FindLabel ( [Build_Name] )
if [Build_Name] =
FindLabel = [Build_Name]
end if
then
End Function
c. Layout View and zoom in and/or out Restaurants layers to 1:5,000. Add an
appropriate text and change its properties if needed. [1 mark]
12) Activate ATMs frame from Data View and add Roads.shp, ATMs.shp and
Buildings.shp feature classes. Change its symbol and display its labels satisfying
following criteria.
a. For ATMs layer, change its label scale range in order that the label only
displays when the layer is zoomed in 1:5,000 or detail. The color of ATMs
layer and that of Buildings layer should be different. [0.5 mark]
b. For Buildings layer, change its label scale range in order that the label only
displays when the layer is zoomed in 1:5,000 or detail. [0.5 mark]
c. Switch to Layout View and zoom in and/or out ATMs layer fit to the bottom
middle frame. Add an appropriate text and change its properties if needed.
[0.5 mark]
11 Geog 255: Geographical Information Science I Spring 2011 13) Activate Parking Lots frame from Data View and add Roads.shp, ParkingLots.shp
feature classes. Change its symbol and display its labels satisfying following criteria.
a. For Parking Lots layer, display its label with Name filed. Also, change its
symbol with Unique Values with Name field. [0.5 mark]
b. Switch to Layout View and zoom in and/or out Parking Lots layer fit to the
bottom right frame. Add an appropriate text and change its properties if
needed. [0.5 mark]
14) Your final output for lab1 should be similar to the image below.
a. Add an appropriate Title of the map.
b. Add an appropriate text with Lab1: LastName, FirstName.
c. Print your final output with 11x17 size, color. The Page and Print Setup
should be set same as the image below. Before printing the output in color, it
is strongly recommended to print it in Black and White. This may save your
print credit. You can set color option by choosing Properties (from Page
and Print Setup) >> Color Options >> Office Color >> Black and
White. Once you are satisfied with your final output, submit it to your TA. [3
marks]
d. Save your ArcMap document as lab1_LastName_FirstName.mxd and submit this
mxd file only. You don’t need to submit any data file. The mxd document should
open without any error in TA’s computer. [0.5 mark]
12 Geog 255: Geographical Information Science I Spring 2011 13