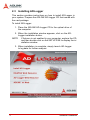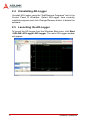
1
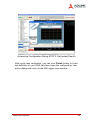
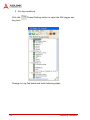
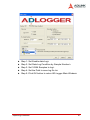
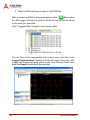
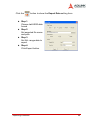
AD-Logger Configuration-based Data Logger User’s Manual Manual Rev. 2.00 Revision Date: March 9, 2009 Part No: 50-11239-1000 Advance Technologies; Automate the World. Copyright 2009 ADLINK TECHNOLOGY INC. All Rights Reserved. The information in this document is subject to change without prior notice in order to improve reliability, design, and function and does not represent a commitment on the part of the manufacturer. In no event will the manufacturer be liable for direct, indirect, special, incidental, or consequential damages arising out of the use or inability to use the product or documentation, even if advised of the possibility of such damages. This document contains proprietary information protected by copyright. All rights are reserved. No part of this manual may be reproduced by any mechanical, electronic, or other means in any form without prior written permission of the manufacturer. Trademarks LabVIEW and NI are registered trademarks of National Instruments, Inc. All product names mentioned herein are used for identification purposes only and may be trademarks and/or registered trademarks of their respective companies. Getting Service from ADLINK Contact us should you require any service or assistance. ADLINK Technology Inc. Address: 9F, No.166 Jian Yi Road, Chungho City, Taipei County 235, Taiwan קᗼխࡉؑ৬ԫሁ 166 ᇆ 9 ᑔ Tel: +886-2-8226-5877 Fax: +886-2-8226-5717 Email: [email protected] Ampro ADLINK Technology Inc. Address: 5215 Hellyer Avenue, #110, San Jose, CA 95138, USA Tel: +1-408-360-0200 Toll Free: +1-800-966-5200 (USA only) Fax: +1-408-360-0222 Email: [email protected] ADLINK Technology Beijing Address: ࣫ҀᏖ⍋⎔ऎϞഄϰ䏃 1 োⲜ߯ࡼॺ E ᑻ 801 ᅸ (100085) Rm. 801, Power Creative E, No. 1, B/D Shang Di East Rd., Beijing 100085, China Tel: +86-10-5885-8666 Fax: +86-10-5885-8625 Email: [email protected] ADLINK Technology Shanghai Address: Ϟ⍋Ꮦⓩ⊇⋒催⾥ᡔᓔথऎ䩺∳䏃 333 ো 39 ᐶ 4 ሖ (200233) Tel: +86-21-6495-5210 Fax: +86-21-5450-0414 Email: [email protected] ADLINK Technology Shenzhen Address: ⏅ഇᏖफቅऎ⾥ᡔುफऎ催ᮄफϗ䘧᭄ᄫᡔᴃು A1 ᷟ 2 ὐ C ऎ (518057) 2F, C Block, Bld. A1, Cyber-Tech Zone, Gao Xin Ave. Sec 7, High-Tech Industrial Park S., Shenzhen, 518054 China Tel: +86-755-2643-4858 Fax: +86-755-2664-6353 Email: [email protected] ADLINK Technology Inc. (German Liaison Office) Address: Nord Carree 3, 40477 Duesseldorf, Germany Tel: +49-211-495-5552 Fax: +49-211-495-5557 Email: [email protected] ADLINK (French Liaison Office) Address: 15 rue Emile Baudot, 91300 MASSY Cedex, France Tel: +33 (0) 1 60 12 35 66 Fax: +33 (0) 1 60 12 35 66 Email: [email protected] ADLINK Technology Japan Corporation Address: 151-0072 ᧲੩ㇺᷦ⼱ᐈ䊱⼱㩷 1-1-2 ᦺᣣ↢ᐈ䊱⼱䊎䊦 8F Asahiseimei Hatagaya Bldg. 8F 1-1-2 Hatagaya, Shibuya-ku, Tokyo 151-0072, Japan Tel: +81-3-4455-3722 Fax: +81-3-5333-6040 Email: [email protected] ADLINK Technology Inc. (Korean Liaison Office) Address: 昢殾柢 儛單割 嚂笊壟 60-12 壟昷捒娯 4 猻 402 笾 No.402, Dongsung B/D, 60-12, Nonhyeon-Dong Gangnam-gu, Seoul, 135-010, Korea. Tel: +82-2-2057-0565 Fax: +82-2-2057-0563 Email: [email protected] ADLINK Technology Singapore Pte Ltd. Address: 84 Genting Lane #07-02A, Cityneon Design Centre, Singapore 349584 Tel: +65-6844-2261 Fax: +65-6844-2263 Email: [email protected] ADLINK Technology Singapore Pte Ltd. (Indian Liaison Office) Address: No. 1357, "Anupama", Sri Aurobindo Marg, 9th Cross, JP Nagar Phase I, Bangalore - 560078, India Tel: +91-80-65605817 Fax: +91-80-22443548 Email: [email protected] Table of Contents Table of Contents..................................................................... i 1 Introduction to AD-Logger ................................................ 1 1.1 1.2 1.3 What is AD-Logger? ............................................................ 1 Features and Highlights....................................................... 1 Terminology ......................................................................... 2 2 Software Installation .......................................................... 3 2.1 2.2 2.3 2.4 2.5 Where to Obtain AD-Logger ................................................ Before You Proceed ............................................................ Installing AD-Logger ............................................................ Uninstalling AD-Logger........................................................ Launching the AD-Logger.................................................... 3 3 4 6 6 3 Understanding AD-Logger ................................................ 7 3.1 3.2 Main Menu .......................................................................... 7 File Menu ........................................................................ 7 Task Menu ...................................................................... 8 Setting Menu .................................................................. 8 Viewer Menu ................................................................... 9 Export Menu ................................................................... 9 Help Menu ...................................................................... 9 AD-Logger Function........................................................... 10 Speed Buttons .............................................................. 12 Buffer Viewer ................................................................ 13 Task Explorer/Logged Data Viewer .............................. 14 Status Viewer ................................................................ 17 Data Viewer .................................................................. 18 Message Viewer ........................................................... 22 4 Starting AD-Logger .......................................................... 23 4.1 4.2 Configure a DAQ Task....................................................... 23 Modify Task .................................................................. 23 Create Task .................................................................. 28 Delete Task ................................................................... 30 Setting DAQ Condition....................................................... 31 Display Settings ............................................................ 32 FFT setting .................................................................... 33 Table of Contents i 4.3 4.4 Recording Condition ..................................................... 34 Alarm condition ............................................................. 35 Start Data Acquisition ........................................................ 36 Stop and Export Data for post-processing ......................... 38 5 Exporting Functions ......................................................... 39 5.1 5.2 5.3 5.4 5.5 Export Data to Excel for post processing........................... Export Data as a CSV file for Excel for post processing.... Export Data into LabVIEW for post processing.................. Export Data into DIAdem for post processing.................... Export Data into MATLAB post processing........................ 39 41 43 56 59 6 Appendix............................................................................ 69 6.1 ii AD-Logger .DAT File Format ............................................. 69 DASK Header ............................................................... 70 ChannelRange .............................................................. 71 Data Block .................................................................... 72 AD-Logger Header ........................................................ 73 ChannelRange .............................................................. 74 Table of Contents 1 Introduction to AD-Logger 1.1 What is AD-Logger? AD-Logger is a smart and easy-to-use data acquisition software that works with all ADLINK devices which equip with analog input and digital input function. AD-Logger provides an intuitive user interface that helps complete a data acquisition application in only four steps without any programming. Get started by defining a DAQ task with the DAQPilot interactive dialog; then configure the recording conditions, and start logging for online analysis or export the data for offline analysis and post processing 1.2 Features and Highlights X Logs data based on DAQPilot task configurations X Supports both real-time and historical viewers X Supports intuitive user interface as a ready-to-run application X Supports data exporting functions for offline analysis in third party applications, including Microsoft Excel, NI® DIADem, and Mathworks MATLAB® X Supports all ADLINK DAQ hardware X Provides basic analysis functions, such as FFT X Provides monitoring features via a user-friendly toolbox X Provides a buffer monitoring mechanism to automatically evaluate the system performance to know if the captured data can be processed in real-time Introduction to AD-Logger 1 1.3 Terminology Below are some of the terms used in this document. Word Description DAQ Data acquisition. The capture or collection of data. Task A DAQ task is a complete set of parameters including channels, timing, and trigger properties. A DAQ task represents a type of measurement that you want to perform. You can easily create task, modify task and delete task in AD-Logger. Tracking The tracking function is embedded in the DataView for you to easily trace captured data. When the tracking function is enabled, the axes will adjust their min and span values based on the tracking style. In addition to enabling tracking, all cursors will be hidden, and the axes min and span will be restored to their previous values when the axes tracking were initially disabled. DAQPilot DAQPilot is a task-oriented DAQ driver comes with an intuitive wizard to assist you in developing cutting-edge DAQ applications in an instant. Buffer AD-Logger provides a buffer evaluation mechanism to monitor Mechanism system performance of data acquisition in real-time. Export Output data function. You can convert the logged files to other data formats for the further processing. FFT Fast Fourier Transform. AD-Logger provides FFT power spectrum analysis. Log Data logging is the practice of saving DAQ data to hard drive. Table 1-1: Terminology 2 Introduction to AD-Logger 2 Software Installation This section provides the installation information before you start to use AD-Logger software. 2.1 Where to Obtain AD-Logger The AD-Logger evaluation version is available on the All-In-One CD that comes in your DAQ card package. You can also download the latest evaluation version from the ADLINK website through the following URL: http://www.adlinktech.com/MAPS/AD-Logger.html. 2.2 Before You Proceed Before you starting to use AD-Logger software, make sure your system meets the following requirements. System Requirements X Windows 98/NT/2000 or 32-/64-bit editions of Windows XP/ Server 2003/Vista operating system X Intel Pentium-class CPU or higher X VGA display or higher X Minimum 64 MB of memory X Minimum 40 MB of free hard disk space X Mouse Please install DAQMaster before other ADLINK software for basic configuration and diagnosis. The ADLINK DAQMaster is a smart device manager that accesses ADLINK data acquisition products (refer to http://www.adlintkech.com/MAPS/DAQ-Master.html). Software Installation 3 2.3 Installing AD-Logger This section provides instructions on how to install AD-Logger in your system. Prepare the ADLINK AD-Logger CD that comes with the card package. To install AD-Logger: 1. Place the ADLINK AD-Logger CD to the optical drive of the computer. 2. When the installation window appears, click on the ADLogger installation button. NOTE If Autorun is not enabled in your computer, explore the CD, and then double-click on the SETUP.EXE to display the installation window. 3. When installation is complete, simply launch AD-Logger to log data for further analysis. 4 Software Installation Software Installation 5 2.4 Uninstalling AD-Logger Uninstall AD-Logger using the “Add/Remove Programs” tool in the Control Panel in Windows.. Select AD-Logger from currently installed programs and click Change/Remove button to delete the software. 2.5 Launching the AD-Logger To launch the AD-Logger from the Windows Start menu, click Start >ADLINK>AD-Logger>AD-Logger. The main AD-Logger window will appear. 6 Software Installation 3 Understanding AD-Logger 3.1 Main Menu Menu Function File System commands Task DAQ task commands Setting System configuration options Viewer View commands Export Export log data commands Help Online help and support information 3.1.1 File Menu The File Menu provides the following options: File New Task Function Create a new DAQ Task Open Open a Task or Log file New project Create a new AD-Logger project to perform data acquisition Open project Open an existing AD-Logger project Close project Close current AD-Logger project Save project Save all current data acquisition task configurations into current project Print Print current Data Print Preview Preview current Data for printing Understanding AD-Logger 7 3.1.2 Task Menu The Task Menu provides the following options: Task Function New task Launch the DAQPilot Interactive Dialog to create a new data acquisition task Modify task Launch the DAQPilot Interactive Dialog to modify The selected data acquisition task Delete task Delete an existing data acquisition task from the Task View Panel Start tasks Start to perform all data acquisition tasks on the Task View Panel Stop tasks Stop all data acquisition tasks on the Task View Panel 3.1.3 Setting Menu The setting menu provides the following options: Setting 8 Function Display Provides the Display configurations of time domain which includes X-axis, Y-axis, Appearance and Channel settings. FFT Provides the Display configurations of frequency domain which includes X-axis, Y-axis, Appearance and Channel settings. Recording Enable/Disable the function of data acquisition task. The Log functions can be stopped by manual, by pre-defined sample and by time. The location to save log data can also be selected. Alarm Condition Enable/Disable the Alarm functions which could be above or below a constant value. Understanding AD-Logger 3.1.4 Viewer Menu The Viewer Menu provides the following options: View Function Graph Viewer Enable/disable the time domain data display of the selected data acquisition task FFT Viewer Enable/disable the frequency domain data display of the selected data acquisition task Status Viewer Enable/disable the display of the system information, log task setting and hard disk space. Message Viewer Enable/disable the display of system commands and message. 3.1.5 Export Menu The Export Menu provides the following options: Export Function Excel Export the logged data to a Microsoft Excel file CSV Export the logged data to a comma separated value file Third-party Export the logged data for the post-processing in third-party software, such as LabVIEW®, DIAdem, or MATLAB® 3.1.6 Help Menu The Help Menu provides the following options Help Function AD-Logger Help Get on-line help Contact us Get technical support About AD-Logger Display the ADLINK AD-Logger version and copyright statement About my computer Display the system information such as the operating system version, processor and memory usage status Register AD-Logger Form to input the license number for using a licensed version of AD-Logger Understanding AD-Logger 9 3.2 AD-Logger Function ADLINK AD-Logger is designed with six major function blocks that can be enabled/disabled individually for operatiosn. Refer to the block diagram below. 10 Understanding AD-Logger Panels Description 1. Speed Buttons Includes four major task operations and related functions (such as exporting data). 2. Buffer Viewer Display the buffer status. Display the information of existed DAQ task and his3. Task /History View tory log. This part include two tabsheets : "Task Explorer" and "Logged Data" 4. Status Viewer Display system information including the task setting, available hard disk and the system resource. 5. Data View Display the logged data in time domain and frequency domain. 6. Message View Display the history commands and task status Understanding AD-Logger 11 3.2.1 Speed Buttons These speed buttons are designed with major task commands and exporting functions. The buttons will be dynamically enabled or disabled depends on the operation mode. Speed Buttons Description Launch the ADLINK DAQPilot interactive configuration dialog to create a new data acquisition task. AD-Logger Create Task is powered by DAQPilot, so you can finish DAQ application without any programming effort. 12 Start Start to perform the all data acquisition tasks Stop Stop all data acquisition tasks Setting Launch the setting form for configuration such as Graph, FFT, Log, Alarm and ADC. Modify Launch ADLINK DAQPilot interactive configuration dialog to modify the existed data acquisition task. Recording Enable/disable the recording function. FFT Enable/disable the power spectrum view panel Excel Export the logged data to an Excel file. CSV Export the logged data to a comma separated value file. Third Party Export the logged data for the post-processing in thirdparty software, such as LabVIEW®, DIAdem and MATLAB®. Understanding AD-Logger 3.2.2 Buffer Viewer AD-Logger provides a data buffer evaluation mechanism. The buffer evaluation mechanism will be automatically enabled to monitor and display the buffer status on the Buffer Viewer when you perform a DAQ task with recording function. The buffer status will be dynamically changed in real-time depending on system performance. The Buffer View has following status: Buffer View Status Description Blue Color The system’s performance is ample for data logging with the DAQ tasks. The buffer has more than 50 percent of available space when logging data. Yellow Color The buffer usage is sufficient with the the DAQ tasks. The buffer has 20 percent to 50 percent of available space when logging data. Red Color The buffer usage is running low with the DAQ tasks. The buffer has less than 20 percent of available space when logging data. Understanding AD-Logger 13 3.2.3 Task Explorer/Logged Data Viewer The Task/History view Panel is located on the left part of the ADLogger main window. The View Panel displays the current DAQ tasks in the Tasks panel (page 15) and history log data in the Logged Data panel (page 16). 14 Understanding AD-Logger "Task Explorer" Tabsheet The Tasks tabsheet displays the all DAQ tasks and related attributes in the project. The task with a blue background color is the selected task which displays logged data in the Data View Panel. You can click the task node to check the task status and doubleclick the task node to modify parameters via the pop-up configuration window. Icons Description DAQ task name. DAQ tasks type. This icon will be dynamically changed depends on the DAQ task type. DAQ device type. Sample rate of the DAQ task. Enable channel(s) of DAQ task. Operation error message. Alarm status Understanding AD-Logger 15 "Logged Data" Tabsheet The "Logged Data" tabsheet displays the logged file(s) which are classified by the task name and sorted by logged time. You can double click the node to display the logged data value in the Data View. 16 Understanding AD-Logger 3.2.4 Status Viewer The Status Viewer consists of three blocks. Each block is described as follows. Block 1 Block 2 Block 3 Status View Description Block 1 Shows the selected log task(s) and its log condition. Block 2 Displays hard drive status Block 3 Indicates if the following status is enabled in AD-Logger. X Data: Acquiring data if this label is blinking X Disk: Recording to Disk if this label is blinking X Alarm: Alarm indicator Understanding AD-Logger 17 3.2.5 Data Viewer The Data Viewer displays the logged data in both time and frequency domains. Initially, the selected DAQ task only displays time domain data. User can enable the frequency domain data on demand. Please refer to Section 3.2.1 (Speed Buttons). 18 Understanding AD-Logger The toolbars on the top on the time domain and frequency domain graph both provide the same function to control the data display. The functions are described as follows. Data Viewer Toolbars Description Resume The resume button enables tracking function on all axes. When tracking function is enabled, the axes will adjust their min and span values based on the tracking style. In addition to enabling tracking, all cursors will be hidden, and the axes min and span will be restored to their previous values when the axes tracking were initially disabled. Scroll (Axes) When the Axes Scroll Mode button is enabled, you can drag the axis and scroll the view. When this button is selected, the Axes Zoom Mode button is correspondingly unselected. Zoom (Axes) When the Axes Zoom Mode button is enabled, you can drag the axis and zoom the view. When this button is selected, the Axes Scroll Mode button is correspondingly unselected. When this button is clicked, all axes are zoomed out by a factor 2x.When this button is clicked, the tracking function Zoom out All Axes on all axes will be disabled and the view data will be frozen. Zoom in All Axes When this button is clicked, all axes are zoomed in by a factor 2x.When this button is clicked, the tracking function on all axes will be disabled and the view data will be frozen. Zoom Box This button allows you to band a region in the Data Viewer for zooming into. The box can start at any point, but must be dragged to the lower right to define a region for zoom function. The zoom action will affect all axes. Data Cursor This button shows or hides all data cursors. Copy to Clipboard This button copies the current plot image to the clipboard. Save to File This button brings up a Save dialog to save the plot image to a file. You can select from bitmap, metafile, or JPEG as the file type. Print This button prints the plot image. Preview This button launches the Print-Preview dialog before printing out the plot image. Understanding AD-Logger 19 Data Cursor The Data Cursor of the DataView has many useful functions which let you to check the data value on the DataView. You can click the button to enable the Data Cursor function. When you enable the Data Cursor function, you can just drag and drop the green line in the middle of the DataView to any position. The x and y value of the Data Cursor will be displayed in real-time. The Data cursor provides advanced configurations: you can rightclick the mouse on the middle green line to launch the popup menu (as shown below). You can see there are sixteen Data Cursors in each domain in the Data Viewer Panel. You can set all Data Cursors to only a specified channel at a different position, each Data Cursor to each channel, or any style you wish. 20 Understanding AD-Logger The popup menu of the Data Cursor contains the following settings. Menu Description Channel Set the Data Cursor to detect which channel you specify. Style The value of Data cursor can be configured to several styles. X Value of x-y: Show both the X and Y axes falues. X Value of x: Only show the X-Axis value. X Value of y: Only show the Y-Axis value. X Period: Show a period value of two cursors on the X-Axis X Peak to Peak: Show the difference in value between two peaks on the Y-Axis X Frequency: Display the inverse of the instance along the X-Axis or the frequency. Use Channel Color: Set the cursor’s color to channel color. Options Hide Hint on Release: Hide all value styles. Flip alignment: Switch value label to the opposite position. Understanding AD-Logger 21 3.2.6 Message Viewer The Message Viewer logs a history of operation command(s) and system messages. The Message Viewer includes the following three types of log messages: Prefex <Task> 22 Description Regarding a DAQ task operation. <Config> Regarding Data Viewer, Log, and Alarm configurations. <Buffer> Regarding the Buffer Mechanism status. Understanding AD-Logger 4 Starting AD-Logger When you launch AD-Logger, there is a default DAQ Task with pre-defined continuous analog input function which works with a Simulated Device. You can easily modify the task for further configurations. 4.1 Configure a DAQ Task 4.1.1 Modify Task 1. Choose the task node that you want to modify. 2. Click the Modify button or right-click the task node and select “modify task” in the pop-up menu to launch the DAQPilot configuration dialog. The DAQPilot interactive configuration dialog will guide you in configuring the DAQ task. Starting AD-Logger 23 3. The Task name will be shown in the DAQPilot interactive configuration dialog as shown in Step 1. If you need to change the Task name, you need to modify it first on the task node on the tree. 24 Starting AD-Logger 4. Select the supported device, then configure the channels The DAQPilot interactive configuration dialog allows you to select the device and define the corresponding channel settings. This configuration window enables you to easily set the Range and RefGround from the drop-down combo box. For more details about using the DAQPilot interactive configuration dialog, please refer to Chapter 3 of the DAQPilot user manual. More information can also be found at http:// www.adlinktech.com/MAPS/DAQPilot.html Starting AD-Logger 25 5. Acquisition Parameters The next window enables you to set the acquisition parameters. This includes the setting of the clock source, sampling rate, etc. Click Next when finished. 26 Starting AD-Logger 6. Testing the Task After setting the task parameters, you can use the DAQPilot built-in test panel to check whether the task parameters are in range and the task works well. Click the task. To stop testing, click to begin to test . You can click to change the setting of instant test panel. After a quick task verification, you can click the Finish button to complete defining your DAQ task and close the configuration interactive dialog and return to the AD-Logger main window. Starting AD-Logger 27 4.1.2 Create Task Click the button to launch the DAQPilot interactive configu- ration dialog to create a new DAQ task. When the DAQPilot interactive dialog appears, right-click the mouse to select the task type/function; then select the task subtype from the pop-up menu. AD-Logger supports analog and digital input functions as shown in the figures below. 28 Starting AD-Logger The task types AD-Logger supports are listed as follows. Function Support Mode Continuous Mode Analog Input Function Single Shot Mode Polling Mode Continuous Mode Digital Input Function Single Shot Mode Port Mode Line Mode After choosing the task type, please refer to section 4.1.1- to modify the selected task for following setting illustration. Starting AD-Logger 29 4.1.3 Delete Task In the Task Tree, you can right-click the mouse on the task node to launch a pop-up menu and choose Delete Task. If there is no task in the Task tree, the AD-Logger will automatically be settled in disabled mode. A DAQ task must be created or loaded. 30 Starting AD-Logger 4.2 Setting DAQ Condition After creating a new DAQ task, the AD-Logger will automatically open the setting form to configure the Display, FFT View, Recording Conditions and Alarm Conditions settings. If you want to launch the setting form, you can just click the task node and click setting button. The following sections will describe the setting forms. Starting AD-Logger 31 4.2.1 Display Settings item 32 Description View Number Set the number of data samples you want to display on the time domain Data Viewer. Tracking Enable/disable the tracking function. When the tracking function is enabled, the axes will adjust their min and span values based on the tracking style. Scroll Bar Enable/disable scroll bar. X-Axis Title Set the X-Axis title. Max/Min Set the Y-Axis maximum/minimum display value. Y-Axis Title Set the Y-Axis title. Appearance Configure the color of background, grid lines and the style of grid lines. Channel Setting Enable/disable the display of X and Y-Axis values in legend and set the related channel color. Starting AD-Logger 4.2.2 FFT setting item Description Enable Enable/disable to perform the FFT calculation when capturing data. View Number Set the number of data samples to perform FFT calculation and display the result on the frequency domain DataView. Tracking Enable/disable the tracking function. When the tracking function is enabled, the axes will adjust their min and span values based on the tracking style. Scroll Bar Enable/disable the function of scroll bar. X-Axis Title Set the X-Axis title. Max/Min Set the Y-Axis maximum/minimum display value. Y-Axis Title Set the Y-Axis title Appearance Configure the color of background, grid lines and the style of grid lines. Channel Setting Enable/disable the display of X and Y Axis values in legend and set channel color. Starting AD-Logger 33 4.2.3 Recording Condition item 34 Description Data Log Enable/disable to log DAQ data to disk. Recording Condition Set a condition to automatically stop logging file to disk. By Sample Number Set the amount of sample to log data to disk. By Time Interval Set the time range to log data to disk. Set Location Set a path to store logged data. Starting AD-Logger 4.2.4 Alarm condition Item Description You can enable/disable the alarm condition and set trigger value for each channel of the DAQ task. If AD-Logger Alarm Condition Settings detects the trigger value you set, the Alarm warning will show in the Status Viewer. Starting AD-Logger 35 4.3 Start Data Acquisition After you configure the DAQ parameters in section 4.2, you can click button in the AD-Logger main window to start data acquisition based on the pre-defined DAQ task. Display Log Enable Status If the task start with the recording function. (Section 4.2.3), the Buffer Monitor Bar will display the available memory status of buffer (see figure below). When the AD-Logger completes the logging task, the Buffer Monitor Bar will switch to a disabled status. 36 Starting AD-Logger Display Alarm Status If the task starts with the alarm function (Section 4.2.4), AD-Logger will keep detecting the alarm condition during the data logging until you click the Stop button. If AD-Logger detects the trigger condition, AD-Logger will automatically stop the DAQ procedure (figure below). The related task in the Task View Panel will also show the alarmed status with a red color. You can launch the setting form and switch to the Alarm Condition tabsheet to configure the Alarm conditions. Starting AD-Logger 37 4.4 Stop and Export Data for post-processing Click the button to stop the task(s). If you already have data logged in the system, the log files could be managed in the Logged Data tabsheet. Switch to Logged Data tabsheet; double click the selected log file to display the data in the DataView Window. If the sample number is more than 1024, the scrollbar can be used to switch the data block for display. 38 Starting AD-Logger 5 Exporting Functions The AD-Logger log data is in binary files with private data format (Appendix). You can manage log file on AD-Logger "Logged Data" tabsheet or use the following exporting functions. The ADLogger provides several data formats which help you to do analysis and post-processing in the third-party applications. 5.1 Export Data to Excel for post processing 1. Launch AD-Logger and select the Logged Data tabsheet. 2. Double click the log file you want to export. 3. Click the Exporting Functions button to show Export Data setting form. 39 4. Specify the file name and file path by Browser button. 5. Configure the Range Option and click the Export button. The exported data will be automatically loaded and displayed in the Excel tabsheet. 40 Exporting Functions 5.2 Export Data as a CSV file for Excel for post processing 1. Launch AD-Logger and Switch to the Logged Data tabsheet 2. Double click the log file you want to export. 3. Click the Exporting Functions button to show Export Data setting form. 41 4. Specify the file name and file path by Browser button. 5. Configure the Range Option and click the Export button. The data will be exported to a CSV file in the path you specified. 42 Exporting Functions 5.3 Export Data into LabVIEW for post processing This section will demonstrate how to perform Data Acquisition with ADLINK PCI-9221 and do FFT analysis in LabVIEW. Before the post-processing captured in LabVIEW, you need to use AD-Logger Export function to convert the AD-Logger file to LabVIEW compatible format. The process includes three steps: X Configure DAQ device and Set log conditions. X Start the data acquisition and Export captured data to LabVIEW. X Use LabVIEW to do FFT analysis 1. Configure DAQ device and parameters. Launch AD-Logger and click Modify DAQ task button to open DAQPilot interactive configuration dialog. You can configure DAQ device and relative parameters in the following setting dialogs. Exporting Functions 43 <Interactive Configuraiton Dialog STEP 1: Select Device & Channel> <Interactive Configuraiton Dialog STEP 2: Timing/Trigger Setting > 44 Exporting Functions <Interactive Configuraiton Dialog STEP 3: Get Instant Result> After quick task verification, you can click Finish button to finish the definition of your DAQ task then close the configuration interactive dialog and return to the AD-Logger main window. Exporting Functions 45 2. Set log conditions Click the Project Setting button to open the AD-Logger set- ting form. Change to Log Tab sheet and finish following steps. 46 Exporting Functions X Step 1: Set Enable data Log> X Step 2: Set Data Log Condition by Sample Number> X Step 3: Set 16384 Samples to log> X Step 4: Set the Path to save log file to> X Step 5: Click OK button to return AD-Logger Main Window> Exporting Functions 47 3. Start to DAQ and Export data to LabVIEW file After configuring DAQ and log parameters, click Start button the AD-Logger will start to perform DAQ; the log file will be saved to the path you specified. Click “Logged Data” change to See history data The log files will be sequentially list by task name and time in the Logged Data tabsheet. Double click the file name in the tree, ADLogger will display the data value in the Time Domain Data View; then the Export buttons will be enabled. 48 Exporting Functions Click the button to show the Export Data setting form. X Step 1: Choose LabVIEW data format X Step 2: Set exported file name and path X Step 3: Set ALL range data to export X Step 4: Click Export button Exporting Functions 49 4. Use LabVIEW to do advanced analysis Load the exported LVM file into LabVIEW. 50 X Step 1: Open a Blank VI in the NI LabVIEW software. X Step 2: Right click and place a “Read From Measurement File” Express VI in the Block Diagram. X Step 3: In the Configure “Read From Measurement File” form, specify the file location that you want to import. X Step 4: Click “Read File Now” button can preview the data value then close form by click OK button. Exporting Functions X Step 5: Right click and place a “Spectral Measurements” Express VI of Signal Analysis in the Block Diagram. The “Spectral Measurements” setting form will be opened. Example: Using FFT function to calculate power spectrum result. Input Signal = 1022.34 Hz Sampling rate = 250 KHz Exporting Functions 51 X 52 Step 6: There are four measurement functions in the Configure Spectral Measurements , in this case we chose “Power spectrum” function. Exporting Functions X Step 7: Place a “Waveform Graph” VI in the Front Panel X Step 8: Finish following signal links in the Block Diagram. Exporting Functions 53 54 X Step 9: Right click on the Waveform Graph VI and choose property of the pop-up menu. X Step 10: In the Scales tab, set Name of the X-Axis and Multiplier of Scaling Factors(sample rate). Exporting Functions X Step 11: In the Plots tab, enable the following option. X Step 12: Switch to the Block Diagram, start to execute the program will display the power spectrum result. Exporting Functions 55 5.4 Export Data into DIAdem for post processing 1. Launch AD-Logger and Switch to the Logged Data tabsheet. 2. Double click the log file you want to export. 3. Click the button to show the Export Data setting form. 56 Exporting Functions 4. Assign the file name and file path. 5. Click the DIAdem data format. 6. Configure the Range Option and click the Export button. The exported data can be found in the path you specified. 7. Load the exported data through the DIAdem NAVIGATOR. 8. Drag and drop the Group Name of log file into the Data Portal window. Then the Group Name will be added in the Data Portal for further operations. 9. Switch to the VIEW window of DIAdem, select a 2D Axis System in the worksheet. Exporting Functions 57 10.Drag and drop Channel 0 and Channel 1 to the 2D Axis System. The data value will be displayed in the graph. 58 Exporting Functions 5.5 Export Data into MATLAB post processing This section will demonstrate how to perform Data Acquisition with ADLINK PCI-9221 and do analysis in MATLAB. Before the postprocessing captured in MATLAB, you need to use the AD-Logger Export function to convert the AD-Logger file to MATLAB compatible format. The process includes three steps: X Configure DAQ device and Set log conditions. X Start the data acquisition and Export captured data to MATLAB. X Use MATLAB to do advanced analysis 1. Configure DAQ device and parameters. Launch AD-Logger and click Modify DAQ task button to open DAQPilot interactive configuration dialog. You can configure DAQ device and relative parameters in the following setting dialogs. Exporting Functions 59 <Interactive Configuraiton Dialog STEP 1: Select Device & Channel> <Interactive Configuraiton Dialog STEP 2: Timing/Trigger Setting > 60 Exporting Functions <Interactive Configuraiton Dialog STEP 3: Get Instant Result> After quick task verification, you can click the Finish button to finish the definition of your DAQ task then close the configuration interactive dialog and return to the AD-Logger main window. Exporting Functions 61 2. Set log conditions Click the Project Setting button to open the AD-Log- ger setting form. 62 Exporting Functions Change to Log Tab sheet and finish following steps. X Step 1: Set Enable data Log X Step 2: Set Data Log Condition by Sample Number X Step 3: Set 16384 Samples to log X Step 4: Set the Path to save log file to X Step 5: Click OK button to return AD-Logger Main Window Exporting Functions 63 3. Start to DAQ and Export data to MATLAB file After configuring DAQ and log parameters, click Start button the AD-Logger will start to perform DAQ; the log file will be saved to the path you specified. Click “Logged Data” change to History Data View The log files will be sequentially list by task name and time in the Logged Data tabsheet. Double click the file name in the tree, AD-Logger will display the data value in the Time Domain DataView; then the Export buttons will be enabled. 64 Exporting Functions Click the button to show the Export Data setting form. Z Step 1: Choose MATLAB data format Z Step 2: Set exported file name and path Z Step 3: Set ALL range data to export Z Step 4: Click Export button 4. Use MATLAB to do advanced analysis Load the exported CSV file into MATLAB. Z Step 1: Set the Current Directory to the exported file saved. Z Step 2: Type “load D9221Data.csv” in the Command Window Z Step 3: An array created with the same name of the exported file in the Workspace. Exporting Functions 65 X Step 4: You can use this data array to do the advanced analysis like following pictures Example: Using FFT function to calculate power spectrum result. Input Signal = 1022.34 Hz Sampling rate = 250 KHz The source code is listed in the next page. Signal Input 5 4 3 Amplitude (V) 2 1 0 -1 -2 -3 -4 -5 0 2000 4000 6000 8000 10000 12000 14000 16000 18000 Points Input Signal = 1022.34 Hz @ 5.0132 dBFS, Sampling rate = 250 KHz 20 0 -20 Magnitude(dB) -40 -60 -80 -100 -120 -140 -160 66 0 2 4 6 8 Frequency (Hz) 10 12 14 4 x 10 Exporting Functions load D9221Data.csv Fs = 250000; % Sampling frequency fin = 1022.34; numpt = 16384; % Length of signal notdc = 3; figure(1); plot(D9221Data); title('Signal Input'); xlabel('Points');ylabel('Amplitude (V)'); Doutw = D9221Data.*hann(numpt); Dout_spect = fft(Doutw); Dout_dB = 20*log10(abs(Dout_spect)); % Recalculate to dB spectP = (abs(Dout_spect)).*(abs(Dout_spect)); % Determine power spectrum FFT_freq = [0:numpt/2-1].*Fs/numpt; FFT_spectrum = Dout_dB(1:numpt/2); figure(2); % Plot single-sided amplitude spectrum. plot(FFT_freq,FFT_spectrum) title('Power Spectrum of Input Signal') xlabel('Frequency (Hz)') ylabel('Magnitude(dB)') pll_title = ['Input Signal = ', num2str(fin), ' Hz @ ',num2str(signal_dBFS), ' dBFS',', Sampling rate = ', num2str(Fs/ 1000), ' KHz']; title(pll_title); Exporting Functions 67 68 Exporting Functions 6 Appendix 6.1 AD-Logger .DAT File Format This appendix describes the file format of the .dat files logged through file AD-Logger file system. The data file includes five parts, ADLINK DASK Header, ChannelRange, Data Block, ADLogger Header and ChannelRange. The file structure is shown in the figure below: DASK Header ChannelRange(Optional) DAQ data AD-Logger Header ChannelRange(Optional) Appendix 69 6.1.1 DASK Header The DASK header part records the information related to the stored data and its total length is 60 bytes. The data structure of the file header is as follows: DASK Header Length: 60 bytes Type Size (bytes) ID char 10 file ID ex. ADLinkDAQ1 card_type short 2 card Type ex. PCI-7250, PCI-9112 num_of_channel short 2 number of scanned channels ex. 1, 2 unsigned char 1 channel number where the data read from (only available as the num_of_channel is 1) ex. 0, 1 num_of_scan long 4 the number of scan for each channel (total count / num_of_channel) data_width short 2 the data width 0: 8 bits, 1: 16 bits, 2: 32 bits channel_order short 2 the channel scanned sequence 0: normal(ex. 0-1-2-3) ad_range short 2 the AI range code Please refer to ADLINK DASK Function Reference Appexdix B ex. 0 (AD_B_5V) scan_rate double 8 The scanning rate of each channel (total samplingate/ num_of_channel) num_of_channel_range short 2 The number of ChannelRange* structure start_date char 8 The starting date of data acquisition ex. 12/31/99 start_time char 8 The starting time of data acquisition ex. 18:30:25 start_millisec char 3 The starting millisecond of data acquisition ex. 360 reserved char 6 The AD-Logger supports log files which the first byte of reservd element is “A”. Others no used. Elements channel_no Comments *If the num_of_channel_range is 0, the ChannelRange block won't be included in the data file. 70 Appendix 6.1.2 ChannelRange The ChannelRange part records the channel number and data range information related to the stored data. This part consists of several channel and range units. The length of each unit is 2 bytes. The total length depends on the value of num_of_channel_range (one element of the file header) and is calculated with this formula: Total Length = 2 * num_of_channel_range bytes The data structure of each ChannelRange unit is listed below: ChannelRange Length: 2 bytes Elements channel range Appendix Type Size (bytes) char 1 scanned channel number ex. 0, 1 1 the AI range code Please refer to ADLINK DASK Function Reference Appexdix B ex. 0 (AD_B_5V) char Comments 71 6.1.3 Data Block The data is written to file in a 16-bit binary format, with the lower byte first (little endian). For example, the value 0x1234 is written to disk with 34 first followed by 12. The total length of the data block depends on the data width and the total data count. The file is written in Binary format and may not be read by normal text editor. You can use any binary file editor to view it or the functions used for reading files (such as fread) to get the file information and data value. PCIS-DASK provides the DAQCvt utility to convert the binary file. Refer to the PCIS-DASK user manual for details 72 Appendix 6.1.4 AD-Logger Header The AD-Logger header part records the information related to the stored data and its total length is 64 bytes. The data structure of the file header is as follows: AD-Logger Header Length: 64 bytes Type Size (bytes) char 10 file ID ex. ADLogger1 task_type unsigned long 4 The DAQPilot DAQ task type ex. Continuous Wave Acquisition card_type short 2 card Type ex. PCI-7250, PCI-9112 num_of_channel short 2 number of scanned channels ex. 1, 2 unsigned char 1 channel number where the data read from (only available as the num_of_channel is 1) ex. 0, 1 num_of_scan long 4 the number of scan for each channel (total count / num_of_channel) data_width short 2 the data width 1: 8 bits, 2: 16 bits, 4: 32 bits channel_order short 2 the channel scanned sequence 0: normal(ex. 0-1-2-3) ad_range short 2 the AI range code Please refer to ADLINK DAQPilot User Manual ex. 0 (AD_B_5V) scan_rate double 8 The scanning rate of each channel (total samplingate/ num_of_channel) num_of_channel_range short 2 The number of ChannelRange* structure start_date char 8 The starting date of data acquisition ex. 12/31/99 start_time char 8 The starting time of data acquisition ex. 18:30:25 start_millisec char 3 The starting millisecond of data acquisition ex. 360 reserved char 6 No used. Elements ID channel_no Comments *If the num_of_channel_range is 0, the ChannelRange block won't be included in the data file. Appendix 73 6.1.5 ChannelRange The ChannelRange part records the channel number and data range information related to the stored data. This part consists of several channel and range units. The length of each unit is 2 bytes. The total length depends on the value of num_of_channel_range (one element of the file header) and is calculated with this formula: Total Length = 2 * num_of_channel_range bytes The data structure of each ChannelRange unit is listed below: ChannelRange Length: 2 bytes Elements channel range 74 Type Size (bytes) char 1 scanned channel number ex. 0, 1 1 the AI range code Please refer to ADLINK DAQPilot User Manual ex. 0 (AD_B_5V) char Comments Appendix