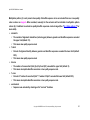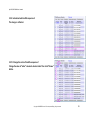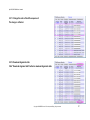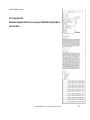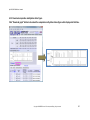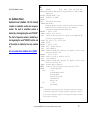
1
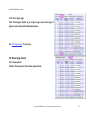
April 30, 2008 QUMA User’s manual http://quma.cdb.riken.jp/ QUMA User’s manual April 30, 2008 Version 1.02 Contact information Yuichi Kumaki & Masaki Okano Laboratory for Mammalian Epigenetic Studies, Center for Developmental Biology, RIKEN 2-2-3 Minatojima-Minamimachi, Chuo-ku, Kobe 650-0047, Japan If you have any questions/comments/requests etc., please feel free to contact: [email protected] Copyright© 2008 RIKEN Center for Developmental Biology All right reserved 1 April 30, 2008 QUMA User’s manual 5.4.5. Genomic sequence file 1 ............................................. 16 5.4.6. Genomic sequence file 2 ............................................. 16 Contents 5.4.7. Bisulfite sequences ..................................................... 17 1. About QUMA ............................................................................. 5 2. Quick start................................................................................. 6 5.4.8. Bisulfite sequences file 1 ............................................ 17 5.4.9. Bisulfite sequences file 2 ............................................ 18 2.1. Select a genomic sequence file .......................................... 6 5.4.10. Conditions to exclude bisulfite sequences ............. 18 2.2. Select a bisulfite sequence file ........................................... 6 5.4.11. Strand of bisulfite conversion .................................. 19 2.3. Submit .................................................................................... 7 5.5. Analysis result page ........................................................... 20 3. Supported browsers ................................................................ 7 5.5.1. Overview of analysis result page 1 ............................ 20 4. Overview ................................................................................... 8 5.5.2. Overview of analysis result page 2 ............................ 21 5. Methylation status analysis mode.......................................... 9 5.5.3. Change methylation status figure 1 ........................... 21 5.1. Main features ......................................................................... 9 5.5.4. Change methylation status figure 2 ........................... 22 5.2. Top page .............................................................................. 10 5.5.5. Download methylation status figure .......................... 23 5.3. Top page simple ...................................................................11 5.5.6. Overview of analysis result page 3 ............................ 23 5.3.1. Genomic sequence file 1 ..............................................11 5.5.7. Show alignment ............................................................ 25 5.3.2. Genomic sequence file 2 ..............................................11 5.5.8. Include/exclude bisulfite sequence 1 ........................ 25 5.3.3. Bisulfite sequences file 1 ............................................ 12 5.5.9. Include/exclude bisulfite sequence 2 ........................ 26 5.3.4. Bisulfite sequences file 2 ............................................ 12 5.5.10. Change the order of bisulfite sequences 1 ............. 26 5.3.5. Submit ........................................................................... 13 5.5.11. Change the order of bisulfite sequences 2 ............. 27 5.4. Top page option .................................................................. 13 5.5.12. Download alignments data........................................ 27 5.4.1. Show options................................................................ 13 5.5.13. Alignments data ......................................................... 28 5.4.2. Optional fields .............................................................. 14 5.5.14. Download analysis data ............................................ 29 5.4.3. Hide options ................................................................. 15 5.5.15. Analysis data .............................................................. 29 5.4.4. Genomic sequence ...................................................... 15 5.5.16. Download methylation pattern figure ...................... 30 Copyright© 2008 RIKEN Center for Developmental Biology All right reserved 2 April 30, 2008 QUMA User’s manual 5.5.17. Methylation pattern figure ......................................... 30 5.8.10. Option of figure 3 ....................................................... 41 5.5.18. Go to figure page ....................................................... 31 5.8.11. Figure 4 ........................................................................ 42 5.6. Result page options ........................................................... 31 5.8.12. Option of figure 4 ....................................................... 42 5.6.1. Show options 1............................................................. 31 6. Statistical analysis mode ...................................................... 43 5.6.2. Show options 2............................................................. 32 6.1. Main features ....................................................................... 43 5.6.3. Hide options ................................................................. 32 6.2. Top page .............................................................................. 44 5.6.4. Change the order of bisulfite sequences 1 ............... 33 6.2.1. Show options ................................................................ 44 5.6.5. Change the order of bisulfite sequences 2 ............... 33 6.2.2. Optional fields .............................................................. 44 5.6.6. Conditions to exclude bisulfite sequences 1............ 34 6.2.3. Genomic sequence ...................................................... 45 5.6.7. Conditions to exclude bisulfite sequences 2............ 34 6.2.4. Genomic sequence file 1 ............................................. 45 5.7. Alignment page ................................................................... 35 6.2.5. Genomic sequence file 2 ............................................. 46 5.7.1. Overview of alignment page ....................................... 35 6.2.6. First bisulfite sequence group.................................... 46 5.7.2. Download alignment data ........................................... 36 6.2.7. File of first bisulfite sequence group 1 ...................... 47 5.7.3. Alignment data ............................................................. 36 6.2.8. File of first bisulfite sequence group 2 ...................... 47 5.8. Figure page.......................................................................... 37 6.2.9. Second bisulfite sequence group .............................. 48 5.8.1. Download methylation pattern figure ........................ 37 6.2.10. File of second bisulfite sequence group 1 .............. 48 5.8.2. Change methylation pattern figure 1 ......................... 37 6.2.11. File of second bisulfite sequence group 2 .............. 49 5.8.3. Change methylation pattern figure 2 ......................... 38 6.2.12. Conditions to exclude bisulfite sequences ............. 49 5.8.4. Show options................................................................ 38 6.2.13. Strand of bisulfite conversion .................................. 50 5.8.5. Figure 1 ......................................................................... 39 6.2.14. Submit ......................................................................... 50 5.8.6. Option of figure 1 ......................................................... 39 6.3. Statistical analysis result page ......................................... 51 5.8.7. Figure 2 ......................................................................... 40 6.3.1. Overview of statistical analysis result page 1 .......... 51 5.8.8. Option of figure 2 ......................................................... 40 6.3.2. Overview of statistical analysis result page 2 .......... 52 5.8.9. Figure 3 ......................................................................... 41 6.3.3. Change methylation status figure 1 ........................... 53 Copyright© 2008 RIKEN Center for Developmental Biology All right reserved 3 April 30, 2008 QUMA User’s manual 6.3.4. Change methylation status figure 2 ........................... 53 7.1. Genomic sequence ............................................................. 67 6.3.5. Download comparative methylation status figure ... 54 7.2. Bisulfite sequences ............................................................ 68 6.3.6. Overview of statistical analysis result page 3 .......... 55 8. Sequence format .................................................................... 69 6.3.7. Show alignment............................................................ 57 8.1. Plain sequence format ....................................................... 69 6.3.8. Include/exclude bisulfite sequence 1 ........................ 57 8.2. FASTA format ...................................................................... 69 6.3.9. Include/exclude bisulfite sequence 2 ........................ 58 8.3. GenBank format .................................................................. 70 6.3.10. Change the order of bisulfite sequences 1 ............. 58 8.4. Multi-FASTA format ............................................................. 71 6.3.11. Change the order of bisulfite sequences 2 ............. 59 8.5. Zipped archive of sequence files ...................................... 72 6.3.12. Download alignments data ....................................... 59 8.6. How to create zipped archive (Macintosh) ....................... 72 6.3.13. Alignments data ......................................................... 60 8.6.1. Mac OS X 10.3 and later............................................... 72 6.3.14. Download statistical analysis data .......................... 61 8.6.2. Other Mac OS................................................................ 74 6.3.15. Statistical analysis data ............................................ 61 8.7. How to create zipped archive (Windows) ......................... 75 6.4. Statistical analysis result page options ........................... 62 8.7.1. Windows Me/XP/Vista .................................................. 75 6.4.1. Show options 1............................................................. 62 6.4.2. Show options 2............................................................. 62 6.4.3. Hide options ................................................................. 62 6.4.4. Change the order of bisulfite sequences 1 ............... 63 6.4.5. Change the order of bisulfite sequences 2 ............... 63 6.4.6. Conditions to exclude bisulfite sequences 1............ 64 8.7.2. Other Windows ............................................................. 76 9. Statistical test ......................................................................... 77 9.1. Fisher‟s exact test............................................................... 77 9.2. Mann-Whitney U-test .......................................................... 79 10. Other .................................................................................... 84 6.4.7. Conditions to exclude bisulfite sequences 2............ 64 10.1. How to open a CSV file ..................................................... 84 6.5. Alignment page ................................................................... 65 10.1.1. Mac OS ........................................................................ 84 6.5.1. Overview of alignment page ....................................... 65 10.1.2. Windows ...................................................................... 84 6.5.2. Download alignment data ........................................... 66 6.5.3. Alignment data ............................................................. 66 7. Input data ................................................................................ 67 Copyright© 2008 RIKEN Center for Developmental Biology All right reserved 4 April 30, 2008 QUMA User’s manual 1. About QUMA Bisulfite sequencing, a standard method for DNA methylation profile analysis, is widely used in basic and clinical studies. This method is limited, however, by the time-consuming data analysis processes required to obtain accurate DNA methylation profiles from the raw sequence output of the DNA sequencer, and by the fact that quality checking of the results can be influenced by a researcher‟s bias. We have developed an interactive and easy-to-use web-based tool, QUMA (QUantification tool for Methylation Analysis), for the bisulfite sequencing analysis of CpG methylation. QUMA includes most of the data-processing functions necessary for the analysis of bisulfite sequences. It also provides a platform for consistent quality control of the analysis. QUMA has four major features. First, it is easy-to-use and needs only two types of input: a PCR target genomic sequence and raw bisulfite sequences. With its user-friendly interface, only a few clicks are needed to quickly align, visualize, and quantify the bisulfite sequence data in a comprehensive manner. Almost all the displayed data are downloadable. Second, QUMA is an all-in-one tool that includes most of the data-processing functions necessary for the analysis of bisulfite sequences. In addition, many optional parameters are available to change the output style according to the user‟s preferences. Third, QUMA provides a helpful feature that allows the user to control the quality of aligned sequences easily, by changing the cutoff parameters; if the input data and cutoff parameters are indicated, anyone can reproduce the analysis, by using the QUMA web server. Fourth, QUMA server can be launch locally, on a personal computer connected to a local network, by using a bootable CD. This feature is especially helpful to the researcher who must analyze sensitive data. The QUMA web server is available at http://quma.cdb.riken.jp/ Overall, we feel confident that QUMA will prove to be of value to the biological community. Copyright© 2008 RIKEN Center for Developmental Biology All right reserved 5 April 30, 2008 QUMA User’s manual 2. Quick start 2.1. Select a genomic sequence file The genomic sequence must be an unconverted sequence between PCR primer pair (not necessary to convert "C" to "T"). (See “7.1. Genomic sequence” for more details.) 2.2. Select a bisulfite sequence file Raw sequence data can be used. Removal of plasmid vector sequence is not necessary. Use 8.4. Multi-FASTA file or 8.5. Zipped archive of sequence files. (See “7.2. Bisulfite sequences” for more details.) Copyright© 2008 RIKEN Center for Developmental Biology All right reserved 6 April 30, 2008 QUMA User’s manual 2.3. Submit Typically, only a few seconds necessary to process sequence data. are 3. Supported browsers We supported the following web browsers. Firefox (Mac/Win) Safari (Mac) Opera (Mac/Win) Internet Explorer(IE) 6.0 and higher (Win) (IE 7 is not recommended because it has many bugs) Many browsers such as IE 5.0 for Windows, Mozilla, and Netscape 6 and higher may work as well. Some older browsers such as IE for Mac or Netscape 4 will not work. Copyright© 2008 RIKEN Center for Developmental Biology All right reserved 7 April 30, 2008 QUMA User’s manual 4. Overview QUMA is a web-based tool for CpG methylation analysis. You can easily align, visualize and quantify bisulfite sequence data! QUMA consists of two separate analyses; a “Methylation status analysis mode” using one group of bisulfite sequences and a ”Statistical analysis mode” mode using two groups of bisulfite sequences. Copyright© 2008 RIKEN Center for Developmental Biology All right reserved 8 April 30, 2008 QUMA User’s manual 5. Methylation status analysis mode 5.1. Main features Raw bisulfite sequences are acceptable. No need to exclude plasmid vector sequence Typically only a few seconds are necessary for Bisulfite alignment Sequence trimming Sequence quality check Methylation pattern analysis Making of figures Easy to iterate many alignments with different parameters without difficulties. Many optional parameters are available to change the output style to the user‟s preference. Copyright© 2008 RIKEN Center for Developmental Biology All right reserved 9 April 30, 2008 QUMA User’s manual 5.2. Top page Top page can be switched between two modes, that is, 5.3. Top page simple and 5.4. Top page option. Copyright© 2008 RIKEN Center for Developmental Biology All right reserved 10 April 30, 2008 QUMA User’s manual 5.3. Top page simple 5.3.1. Genomic sequence file 1 Click the first button (in this case "Browse..." button) to upload a target genomic sequence file. 5.3.2. Genomic sequence file 2 Select a target genomic sequence file to upload. See also “7.1. Genomic sequence”. Copyright© 2008 RIKEN Center for Developmental Biology All right reserved 11 April 30, 2008 QUMA User’s manual 5.3.3. Bisulfite sequences file 1 Click the second button to upload a file of bisulfite sequences. 5.3.4. Bisulfite sequences file 2 Select a file of bisulfite sequences. Acceptable file formats are 8.4. Multi-FASTA or 8.5. Zipped archive of sequence files See also "7.2. Bisulfite sequences", "8.6. How to create zipped archive (Macintosh)" and "8.7. How to create zipped archive (Windows)". Copyright© 2008 RIKEN Center for Developmental Biology All right reserved 12 April 30, 2008 QUMA User’s manual 5.3.5. Submit Click the submit button to analyze. Typically, only a few seconds are necessary. See “5.5. Analysis result page” for next step. 5.4. Top page option 5.4.1. Show options Click the "Show options" link to show optional fields. Copyright© 2008 RIKEN Center for Developmental Biology All right reserved 13 April 30, 2008 QUMA User’s manual 5.4.2. Optional fields Optional fields will appear. The third text input field is used only for the Statistical analysis mode. Copyright© 2008 RIKEN Center for Developmental Biology All right reserved 14 April 30, 2008 QUMA User’s manual 5.4.3. Hide options If you want to go back to the simple top page, click the "Hide options" link. 5.4.4. Genomic sequence Input a project name (optional). When the project name is presented, it will be included in the output file name. The target genomic sequence can be input by two ways of 1) direct input and 2) upload. 1) In case of direct input, paste a target genomic sequence (8.1. Plain sequence, 8.2. FASTA or 8.3. GenBank format). See also "7.1. Genomic sequence". Copyright© 2008 RIKEN Center for Developmental Biology All right reserved 15 April 30, 2008 QUMA User’s manual 5.4.5. Genomic sequence file 1 2) Or click the first button (in this case "Browse..." button) to upload a target genomic sequence file. 5.4.6. Genomic sequence file 2 Select a target genomic sequence file to upload. See also "7.1. Genomic sequence". Copyright© 2008 RIKEN Center for Developmental Biology All right reserved 16 April 30, 2008 QUMA User’s manual 5.4.7. Bisulfite sequences Input a group name of bisulfite sequences (optional). The bisulfite sequences can be input by two ways of 1) direct input and 2) upload. 1) In case of direct input, paste the bisulfite sequences (8.4. Multi-FASTA format). See also "7.2. Bisulfite sequences". 5.4.8. Bisulfite sequences file 1 2) Or click the second button to upload a file of bisulfite sequences. Copyright© 2008 RIKEN Center for Developmental Biology All right reserved 17 April 30, 2008 QUMA User’s manual 5.4.9. Bisulfite sequences file 2 Select a file of bisulfite sequences. Acceptable file formats are 8.4. Multi-FASTA or 8.5. Zipped archive of sequence files. See also "7.2. Bisulfite sequences", "8.6. How to create zipped archive (Macintosh)" and "8.7. How to create zipped archive (Windows)". 5.4.10. Conditions to exclude bisulfite sequences If you want, change conditions to exclude low quality bisulfite sequences. Upper limit of unconverted CpHs number of unconverted CpHs (CpA, CpC and CpT) ⋅Lower limit of percent converted CpHs percent of "number of converted CpHs"/"number of CpHs" Upper limit of alignment mismatch number of alignment mismatches and gaps between genomic and bisulfite sequences Lower limit of percent identity percent of alignment identity between genomic and bisulfite sequences Copyright© 2008 RIKEN Center for Developmental Biology All right reserved 18 April 30, 2008 QUMA User’s manual 5.4.11. Strand of bisulfite conversion Select a strand of bisulfite conversion of the target genomic sequence. C=>T conversion When bisulfite PCR primer pair was designed for forward strand of the genomic sequence (default). G=>A conversion When bisulfite PCR primer pair was designed for reverse strand of the genomic sequence. Both Search both direction of conversion and adopt more appropriate strand. 5.4.12. Submit Click the "Submit" button to analyze. Typically, only a few seconds are necessary. Copyright© 2008 RIKEN Center for Developmental Biology All right reserved 19 April 30, 2008 QUMA User’s manual 5.5. Analysis result page 5.5.1. Overview of analysis result page 1 Analysis result page consists of three sections. A) Summary of information B) Methylation status of each CpG sites C) Information and methylation pattern of each bisulfite sequences Copyright© 2008 RIKEN Center for Developmental Biology All right reserved 20 April 30, 2008 QUMA User’s manual 5.5.2. Overview of analysis result page 2 A) Summary of information Length of the target genome sequence, number of CpG sites and number of bisulfite sequences are indicated. B) Methylation status of each CpG sites Position and methylation status of each CpG sites and figure of methylation status are shown. 5.5.3. Change methylation status figure 1 Click "Change graph" link to switch methylation status figures. Copyright© 2008 RIKEN Center for Developmental Biology All right reserved 21 April 30, 2008 QUMA User’s manual 5.5.4. Change methylation status figure 2 Methylation status figures are switched one after the other by clicking "Change graph" link. Figures 1 and 2 are reflected the position of CpG sites almost accurately. Figures 3-6 are not reflected accurately. Copyright© 2008 RIKEN Center for Developmental Biology All right reserved 22 April 30, 2008 QUMA User’s manual 5.5.5. Download methylation status figure Click "Download graph" button to download the methylation status figure which displayed at that time. 5.5.6. Overview of analysis result page 3 C) Information and methylation pattern of each bisulfite sequences 1. Number of mismatches and percent identity of bisulfite alignment 2. Number of methylated CpG sites 3. Number of bisulfite unconverted CpHs (CpA, CpC, CpT) 4. Pattern of CpG methylation (Black circle: methylated, White circle: unmethylated, Cross: mismatch or gap) Copyright© 2008 RIKEN Center for Developmental Biology All right reserved 23 April 30, 2008 QUMA User’s manual Methylation pattern (4.) is not present when quality of bisulfite sequence is low or excluded from user. Low quality value is shown as magenta. When excluded, reason(s) for the exclusion will be indicated at methylation pattern column (4.). Conditions to exclude low quality bisulfite sequences can be changed (See "5.6.1. Show options 1" for more detail). mismatch: The number of alignment mismatches (includes gaps) between genomic and bisulfite sequences exceeded the upper limit (default: 10). This means low quality sequence read. % ident Percent of alignment identity between genomic and bisulfite sequences exceeded the lower limit (default: 90%). This means low quality sequence read. Unconv The number of unconverted CpHs (CpA, CpC and CpT) exceeded the upper limit (default: 5). This means incomplete bisulfite conversion or low quality sequence read. % conv Percent of "number of converted CpHs" / "number of CpHs" exceeded the lower limit (default 95%). This means incomplete bisulfite conversion or low quality sequence read. user desired Sequence was excluded by checking on the "exclude" checkbox. Copyright© 2008 RIKEN Center for Developmental Biology All right reserved 24 April 30, 2008 QUMA User’s manual 5.5.7. Show alignment Click links to show bisulfite alignment between bisulfite sequence to genomic sequence. See “5.7. Alignment page” for next step. 5.5.8. Include/exclude bisulfite sequence 1 To include/exclude a bisulfite sequence, check off/on "exclude" checkbox. Then click "Renew" button. To include all bisulfite sequence information, click “unselect all” link. Copyright© 2008 RIKEN Center for Developmental Biology All right reserved 25 April 30, 2008 QUMA User’s manual 5.5.9. Include/exclude bisulfite sequence 2 The change is reflected. 5.5.10. Change the order of bisulfite sequences 1 Change the value of "order" column to desired order. Then click "Renew" button. Copyright© 2008 RIKEN Center for Developmental Biology All right reserved 26 April 30, 2008 QUMA User’s manual 5.5.11. Change the order of bisulfite sequences 2 The change is reflected. 5.5.12. Download alignments data Click "Download alignment data" button to download alignments data. Copyright© 2008 RIKEN Center for Developmental Biology All right reserved 27 April 30, 2008 QUMA User’s manual 5.5.13. Alignments data Downloaded alignments data file can be opened by TextEdit (Mac), Notepad (Win) or other text editors. Copyright© 2008 RIKEN Center for Developmental Biology All right reserved 28 April 30, 2008 QUMA User’s manual 5.5.14. Download analysis data Click "Download methylation status data" button to download analysis data. 5.5.15. Analysis data Downloaded analysis data file can be opened by Microsoft Excel, OpenOffice/StartSuite or other spreadsheet software (CSV file format). See also “10.1. How to open a CSV file”. Copyright© 2008 RIKEN Center for Developmental Biology All right reserved 29 April 30, 2008 QUMA User’s manual 5.5.16. Download methylation pattern figure Click "Download figure" button to download methylation pattern figure. 5.5.17. Methylation pattern figure This figure reflects order and include/exclude sequences in analysis result page. Black and white circle indicate methylated and unmethylated CpG respectively. Cross indicate mismatch or gap in the alignment. Other types of figures can be created at 5.8. Figure page. Detailed parameters, such as line width, diameter of circle and etc., can also be changed at 5.8. Figure page. Copyright© 2008 RIKEN Center for Developmental Biology All right reserved 30 April 30, 2008 QUMA User’s manual 5.5.18. Go to figure page Click "Show figure" button to go to figure page where other types of figures can be created with detailed parameters. See “5.8. Figure page” for next step. 5.6. Result page options 5.6.1. Show options 1 Click the "Show options" link to show optional fields. Copyright© 2008 RIKEN Center for Developmental Biology All right reserved 31 April 30, 2008 QUMA User’s manual 5.6.2. Show options 2 Optional fields will appear. 5.6.3. Hide options Click the "Hide options" link to hide optional fields. Copyright© 2008 RIKEN Center for Developmental Biology All right reserved 32 April 30, 2008 QUMA User’s manual 5.6.4. Change the order of bisulfite sequences 1 Order of bisulfite sequences can be changed by several parameters and ascending/descending order. Then click "Renew" button. user specified order The value of "order" column. number of methylated CpGs number of unconversions unconverted CpHs (CpA, CpC, CpT) percent conversion percent of converted CpHs / total CpHs number of mismatches percent identity sequence name ascending order descending order 5.6.5. Change the order of bisulfite sequences 2 The change is reflected. Copyright© 2008 RIKEN Center for Developmental Biology All right reserved 33 April 30, 2008 QUMA User’s manual 5.6.6. Conditions to exclude bisulfite sequences 1 Conditions to exclude low quality bisulfite sequences can be changed. Then click "Reset with new parameter" button (order and exclusion of bisulfite sequences will be reset). Upper limit of unconversion number of unconverted CpHs (CpA, CpC and CpT) Lower limit of percent conversion percent of "number of converted CpHs"/"number of CpHs" Upper limit of alignment mismatch number of alignment mismatches and gaps between genomic and bisulfite sequences Lower limit of percent identity percent of alignment identity between genomic and bisulfite sequences 5.6.7. Conditions to exclude bisulfite sequences 2 The change is reflected. Copyright© 2008 RIKEN Center for Developmental Biology All right reserved 34 April 30, 2008 QUMA User’s manual 5.7. Alignment page 5.7.1. Overview of alignment page Alignment page consists of four sections. A) Summary of information Information about bisulfite alignment. B) Genome sequence C) Bisulfite sequence Sequence outside alignment is indicated as gray color. D) Bisulfite alignment Methylated C of CpG site, unmethylated C of CpG site, Unconverted C (CpA, CpC, CpT) are indicated as different colors. Copyright© 2008 RIKEN Center for Developmental Biology All right reserved 35 April 30, 2008 QUMA User’s manual 5.7.2. Download alignment data Click "Download alignment data" button to download alignment data which displayed hear. 5.7.3. Alignment data Downloaded alignment data file can be opened by TextEdit (Mac), Notepad (Win) or other text editors. Copyright© 2008 RIKEN Center for Developmental Biology All right reserved 36 April 30, 2008 QUMA User’s manual 5.8. Figure page 5.8.1. Download methylation pattern figure Click "Download figure" button to download methylation pattern figure which displayed at that time. 5.8.2. Change methylation pattern figure 1 Click "Change figure" link to switch methylation pattern figures. Copyright© 2008 RIKEN Center for Developmental Biology All right reserved 37 April 30, 2008 QUMA User’s manual 5.8.3. Change methylation pattern figure 2 Methylation pattern figures are switched one after the other. 5.8.4. Show options Click the "Show options" link to show optional fields. Copyright© 2008 RIKEN Center for Developmental Biology All right reserved 38 April 30, 2008 QUMA User’s manual 5.8.5. Figure 1 This figures is displayed circle at even intervals (not depend on CpG positions). 5.8.6. Option of figure 1 The meaning of the value of each option parameter is shown. "Scale to show" means size reduction rate to show in the window. Click "Renew" button to reflect parameters. Copyright© 2008 RIKEN Center for Developmental Biology All right reserved 39 April 30, 2008 QUMA User’s manual 5.8.7. Figure 2 This figure is displayed circles at even intervals with the center line for each bisulfite sequences. s 5.8.8. Option of figure 2 The meaning of the value of each option parameter is shown. "Scale to show" means size reduction rate to show in the window. Click "Renew" button to reflect parameters. Copyright© 2008 RIKEN Center for Developmental Biology All right reserved 40 April 30, 2008 QUMA User’s manual 5.8.9. Figure 3 The positions of circles are reflected the position of CpG sites almost accurately. But closely positioned CpG sites are overlapped. 5.8.10. Option of figure 3 The meaning of the value of each option parameter is shown. "Scale to show" means size reduction rate to show in the window. Click "Renew" button to reflect parameters. Copyright© 2008 RIKEN Center for Developmental Biology All right reserved 41 April 30, 2008 QUMA User’s manual 5.8.11. Figure 4 The positions of circles depend on the position of CpG sites, but not accurately. The circles are placed as not to overlap. 5.8.12. Option of figure 4 The meaning of the value of each option parameter is shown. "Scale to show" means size reduction rate to show in the window. Click "Renew" button to reflect parameters. Copyright© 2008 RIKEN Center for Developmental Biology All right reserved 42 April 30, 2008 QUMA User’s manual 6. Statistical analysis mode 6.1. Main features Differences from Methylation status analysis mode are listed below. The target genomic sequence and two groups of bisulfite sequences are necessary for input data. Figure of comparative methylation status is shown. The statistical significance of the difference between two bisulfite sequence groups at each CpG site is evaluated with 9.1. Fisher‟s exact test. The statistical significance between two groups of the entire set of CpG sites is evaluated with 9.2. Mann-Whitney U-test. Copyright© 2008 RIKEN Center for Developmental Biology All right reserved 43 April 30, 2008 QUMA User’s manual 6.2. Top page 6.2.1. Show options Click the "Show options" link to show optional fields. 6.2.2. Optional fields Optional fields will appear. Copyright© 2008 RIKEN Center for Developmental Biology All right reserved 44 April 30, 2008 QUMA User’s manual 6.2.3. Genomic sequence Input a project name (optional). When the project name is presented, it will be included in the output file name. The target genomic sequence can be input by two ways of 1) direct input and 2) upload. 1) In case of direct input, paste a target genomic sequence (8.1. Plain sequence, 8.2. FASTA or 8.3. GenBank format). See also "7.1. Genomic sequence". 6.2.4. Genomic sequence file 1 2) Or click the first button (in this case "Browse..." button) to upload a target genomic sequence file. Copyright© 2008 RIKEN Center for Developmental Biology All right reserved 45 April 30, 2008 QUMA User’s manual 6.2.5. Genomic sequence file 2 Select a target genomic sequence file to upload. See also "7.1. Genomic sequence". 6.2.6. First bisulfite sequence group Input a group name of first bisulfite sequence group (optional). The bisulfite sequences can be input by two ways of 1) direct input and 2) upload. 1) In case of direct input, paste the bisulfite sequences (8.4. Multi-FASTA format). See also "7.2. Bisulfite sequences". Copyright© 2008 RIKEN Center for Developmental Biology All right reserved 46 April 30, 2008 QUMA User’s manual 6.2.7. File of first bisulfite sequence group 1 2) Or click the second button to upload a file of bisulfite sequences of first group. 6.2.8. File of first bisulfite sequence group 2 Select a file of bisulfite sequences of first group. Acceptable file formats are 8.4. Multi-FASTA or 8.5. Zipped archive of sequence files. See also "7.2. Bisulfite sequences", "8.6. How to create zipped archive (Macintosh)" and "8.7. How to create zipped archive (Windows)". Copyright© 2008 RIKEN Center for Developmental Biology All right reserved 47 April 30, 2008 QUMA User’s manual 6.2.9. Second bisulfite sequence group Input a group name of second bisulfite sequence group (optional). Then, input the bisulfite sequences of second group. 1) In case of direct input, paste the bisulfite sequences of second group. The sequence format of the second group is same as the first group. 6.2.10. File of second bisulfite sequence group 1 2) Or click the third button to upload a file of bisulfite sequences of second group. Copyright© 2008 RIKEN Center for Developmental Biology All right reserved 48 April 30, 2008 QUMA User’s manual 6.2.11. File of second bisulfite sequence group 2 Select a file of bisulfite sequences of second group. The sequence file format of the second group is same as the first group. 6.2.12. Conditions to exclude bisulfite sequences If you want, change conditions to exclude low quality bisulfite sequences. Upper limit of unconverted CpHs number of unconverted CpHs (CpA, CpC and CpT) ⋅Lower limit of percent converted CpHs percent of "number of converted CpHs"/"number of CpHs" Upper limit of alignment mismatch number of alignment mismatches and gaps between genomic and bisulfite sequences Lower limit of percent identity percent of alignment identity between genomic and bisulfite sequences Copyright© 2008 RIKEN Center for Developmental Biology All right reserved 49 April 30, 2008 QUMA User’s manual 6.2.13. Strand of bisulfite conversion Select a strand of bisulfite conversion of the target genomic sequence. C=>T conversion: When bisulfite PCR primer pair was designed for forward strand of the genomic sequence (default). G=>A conversion When bisulfite PCR primer pair was designed for reverse strand of the genomic sequence. Both Search both direction of conversion and adopt more appropriate strand. 6.2.14. Submit Click the "Submit" button to analyze. Typically, only a few seconds are necessary. Copyright© 2008 RIKEN Center for Developmental Biology All right reserved 50 April 30, 2008 QUMA User’s manual 6.3. Statistical analysis result page 6.3.1. Overview of statistical analysis result page 1 Statistical analysis result page consists of three sections. A) Summary of information B) Statistical data C) Information and methylation pattern of each bisulfite sequences Copyright© 2008 RIKEN Center for Developmental Biology All right reserved 51 April 30, 2008 QUMA User’s manual 6.3.2. Overview of statistical analysis result page 2 A) Summary of information Length of the target genome sequence, number of CpG sites and number of bisulfite sequences are indicated. B) Statistical data Position of CpG sites, methylation status of each CpG sites and statistical significances (P-value) of difference between two bisulfite sequence groups are shown. Fisher's exact test: The statistical significance of the difference between two bisulfite sequence groups at each CpG site is evaluated with Fisher's exact test that is non-parametric statistical significance test to determine if there are nonrandom associations between two categorical data. See “9.1. Fisher‟s exact test” for more detail. Mann-Whitney U-test: The statistical significance between two groups of the entire set of CpG sites is evaluated with the Mann-Whitney U-test (also called the Wilcoxon rank-sum test) that is non-parametric statistical significance test for two distributed samples. See “9.2. Mann-Whitney U-test” for more detail. As a limitation of both tests, CpG methylation pattern is not considered and allele specific CpG methylation pattern, especially for imprinting locus, is not detectable. Figure of comparative methylation status is also shown. Copyright© 2008 RIKEN Center for Developmental Biology All right reserved 52 April 30, 2008 QUMA User’s manual 6.3.3. Change methylation status figure 1 Click "Change graph" link to switch comparative methylation status figures. 6.3.4. Change methylation status figure 2 Comparative methylation status figures are switched one after the other by clicking "Change graph" link. Figures 1 and 2 are reflected the position of CpG sites almost accurately. Figures 3-7 are not reflected accurately. Copyright© 2008 RIKEN Center for Developmental Biology All right reserved 53 April 30, 2008 QUMA User’s manual 6.3.5. Download comparative methylation status figure Click "Download graph" button to download the comparative methylation status figure which displayed at that time. Copyright© 2008 RIKEN Center for Developmental Biology All right reserved 54 April 30, 2008 QUMA User’s manual 6.3.6. Overview of statistical analysis result page 3 C) . Information and methylation pattern of each bisulfite sequences. Two sequence groups are indicated separately. 1. Number of mismatches and percent identity of bisulfite alignment 2. Number of methylated CpG sites 3. Number of bisulfite unconverted CpHs (CpA, CpC, CpT) 4. Pattern of CpG methylation (Black circle: methylated, White circle: unmethylated, Cross: mismatch or gap) Methylation pattern (4.) is not present when quality of bisulfite sequence is low or excluded from user. Low quality value is shown as magenta. When excluded, reason(s) for the exclusion will be indicated at methylation pattern column (4.). Conditions to exclude low quality bisulfite sequences can be changed (See "5.6.1. Show options 1" for more detail). Copyright© 2008 RIKEN Center for Developmental Biology All right reserved 55 April 30, 2008 QUMA User’s manual mismatch: The number of alignment mismatches (includes gaps) between genomic and bisulfite sequences exceeded the upper limit (default: 10). This means low quality sequence read. % ident Percent of alignment identity between genomic and bisulfite sequences exceeded the lower limit (default: 90%). This means low quality sequence read. Unconv The number of unconverted CpHs (CpA, CpC and CpT) exceeded the upper limit (default: 5). This means incomplete bisulfite conversion or low quality sequence read. % conv Percent of "number of converted CpHs" / "number of CpHs" exceeded the lower limit (default 95%). This means incomplete bisulfite conversion or low quality sequence read. user desired Sequence was excluded by checking on the "exclude" checkbox. Copyright© 2008 RIKEN Center for Developmental Biology All right reserved 56 April 30, 2008 QUMA User’s manual 6.3.7. Show alignment Click links to show bisulfite alignment between bisulfite sequence to genomic sequence. See “6.5. Alignment page” for next step. 6.3.8. Include/exclude bisulfite sequence 1 To include/exclude a bisulfite sequence, check off/on "exclude" checkbox. Then click "Renew" button. To include all bisulfite sequence information, click “unselect all” link. Copyright© 2008 RIKEN Center for Developmental Biology All right reserved 57 April 30, 2008 QUMA User’s manual 6.3.9. Include/exclude bisulfite sequence 2 The change is reflected. 6.3.10. Change the order of bisulfite sequences 1 Change the value of "order" column to desired order. Then click "Renew" button. Copyright© 2008 RIKEN Center for Developmental Biology All right reserved 58 April 30, 2008 QUMA User’s manual 6.3.11. Change the order of bisulfite sequences 2 The change is reflected. Two sequence groups are ordered separately. 6.3.12. Download alignments data Click "Download alignment data" button to download alignments data. Copyright© 2008 RIKEN Center for Developmental Biology All right reserved 59 April 30, 2008 QUMA User’s manual 6.3.13. Alignments data Downloaded alignments data file can be opened by TextEdit (Mac), Notepad (Win) or other text editors. Copyright© 2008 RIKEN Center for Developmental Biology All right reserved 60 April 30, 2008 QUMA User’s manual 6.3.14. Download statistical analysis data Click "Download statistical data" button to download statistical analysis data. 6.3.15. Statistical analysis data Downloaded statistical analysis data file can be opened by Microsoft Excel, OpenOffice/StartSuite or other spreadsheet software (CSV file format). See also “10.1. How to open a CSV file”. Copyright© 2008 RIKEN Center for Developmental Biology All right reserved 61 April 30, 2008 QUMA User’s manual 6.4. Statistical analysis result page options 6.4.1. Show options 1 Click the "Show options" link to show optional fields (right top figure). 6.4.2. Show options 2 Optional fields will appear (left bottom figure). 6.4.3. Hide options Click the "Hide options" link to hide optional fields (right bottom figure). Copyright© 2008 RIKEN Center for Developmental Biology All right reserved 62 April 30, 2008 QUMA User’s manual 6.4.4. Change the order of bisulfite sequences 1 Order of bisulfite sequences can be changed by several parameters and ascending/descending order. Then click "Renew" button. user specified order The value of "order" column. number of methylated CpGs number of unconversions unconverted CpHs (CpA, CpC, CpT) percent conversion percent of converted CpHs / total CpHs number of mismatches percent identity sequence name ascending order descending order 6.4.5. Change the order of bisulfite sequences 2 The change is reflected. Two sequence groups are ordered separately. Copyright© 2008 RIKEN Center for Developmental Biology All right reserved 63 April 30, 2008 QUMA User’s manual 6.4.6. Conditions to exclude bisulfite sequences 1 Conditions to exclude low quality bisulfite sequences can be changed. Then click "Reset with new parameter" button (order and exclusion of bisulfite sequences will be reset). Upper limit of unconversion number of unconverted CpHs (CpA, CpC and CpT) Lower limit of percent conversion percent of "number of converted CpHs"/"number of CpHs" Upper limit of alignment mismatch number of alignment mismatches and gaps between genomic and bisulfite sequences Lower limit of percent identity percent of alignment identity between genomic and bisulfite sequences 6.4.7. Conditions to exclude bisulfite sequences 2 The change is reflected. Copyright© 2008 RIKEN Center for Developmental Biology All right reserved 64 April 30, 2008 QUMA User’s manual 6.5. Alignment page 6.5.1. Overview of alignment page Alignment page consists of four sections. A) Summary of information Information about bisulfite alignment. B) Genome sequence C) Bisulfite sequence Sequence outside alignment is indicated as gray color. D) Bisulfite alignment Methylated C of CpG site, unmethylated C of CpG site, Unconverted C (CpA, CpC, CpT) are indicated as different colors. Copyright© 2008 RIKEN Center for Developmental Biology All right reserved 65 April 30, 2008 QUMA User’s manual 6.5.2. Download alignment data Click "Download alignment data" button to download alignment data which displayed hear. 6.5.3. Alignment data Downloaded alignment data file can be opened by TextEdit (Mac), Notepad (Win) or other text editors. Copyright© 2008 RIKEN Center for Developmental Biology All right reserved 66 April 30, 2008 QUMA User’s manual 7. Input data 7.1. Genomic sequence Select the genomic sequence file of target region to upload. Or paste the target genomic sequence into the text box (only for “5.4. Top page option”). The genomic sequence must be unconverted (not necessary to convert "C" to "T") and use sequence between PCR primer pair. Sequence of 8.1. Plain sequence, 8.2. FASTA or 8.3. GenBank format is acceptable. Only rich text format (with ".rtf" file extension) or plain text format text file is acceptable for upload file. Binalry file (such as Microsoft Word file) is unacceptable. Rich text format file can be created with TextEdit (Macintosh), WordPad (Windows) or many word processors. Plain text file can be created with TextEdit (Macintosh), NotePad (Windows), many word processors or text editors. Copyright© 2008 RIKEN Center for Developmental Biology All right reserved 67 April 30, 2008 QUMA User’s manual 7.2. Bisulfite sequences Select the file of bisulfite sequences to upload (8.4. Multi-FASTA format file or 8.5. Zipped archive of sequence files). Or paste the 8.4. Multi-FASTA format bisulfite sequences into the text box (only for “5.4. Top page option”). The bisulfite sequences outputted from DNA sequencer can be used as input sequences. No need to remove plasmid vector sequence. Only rich text format (with ".rtf" file extension) or plain text format text file is acceptable for multi-FASTA upload file. Rich text format file can be created with TextEdit (Macintosh), WordPad (Windows) or many word processors. Plain text file can be created with TextEdit (Macintosh), NotePad (Windows), many word processors or text editors. Copyright© 2008 RIKEN Center for Developmental Biology All right reserved 68 April 30, 2008 QUMA User’s manual 8. Sequence format ex. CAGTCCGGCAGCGCCGGGGTTAAGCGGCCCAAGTAAACGTAGCGCAGCGA 8.1. Plain sequence format TCGGCGCCGGAGATTCGCGAACCCGACACTCCGCGCCGCCCGCCGGCCAG Plain sequence contains only sequence characters and line feed. (Only one sequence can contain in one file.) GACCCGCGGCGCGATCGCGGCGCCGCGCTACAGCCAGCCTCACTGGCGCG CGGGCGAGCGCACGGGCGCTC 8.2. FASTA format Sequence of FASTA format is started from single comment line and followed by lines of sequence. A greater-than (">") symbol is used at the first character of comment line to distinguish from sequence lines. See more detail about FASTA format (Wikipedia) ex. >Dnmt3a partial sequence ACTCCCCGTGCGCGCCCGGCCCGTAGCGTCCTCGTCGCCGCCCCTCGTCT CGCAGCCGCAGCCCGCGTGGACGCTCTCGCCTGAGCGCCGCGGACTAGCC CGGGTGGCCCACTGGCGCGCGGGCGAGCGCACGGGCGCTCCAGTCCGGCA GCGCCGGGGTTAAGCGGCCCAAGTAAACGTAGCGCAGCGATCGGCGCCGG AGATTCGCGAACCCGACACTCCGCGCCGCCCGCCGGCCAGGACCCGCGGC GCGATCGCGGCGCCGCGCTACAGCCAGCCTCACGACAGGCCCGCTGAGGC TTGTGCCAGACCTTGGAAACCTCAGGTATATACCTTTCCAGACGCGGGAT CTCCCCTCCCCCATCCATAGTGCCTTGGGACCAAATCCAGGGCCTTCTTT CAGGAAACAATGAAGGGAGACAGCAGACATCTGAATGAAGAAGAGGGTGC CAGCGGGTATGAGGAGTGCATTATCGTTAATGGGAACTTCAGTGACCAGT CCTCAGACACGAAGGATGCTCCCTCACCCCCAGTCTTGGAGGCAATCTGC ACAGAGCCAGTCTGCACACC Copyright© 2008 RIKEN Center for Developmental Biology All right reserved 69 ex. April 30, 2008 QUMA User’s manual 8.3. GenBank format GenBank format (GenBank Flat File Format) consists of annotation section and sequence section. The start of annotation section is marked by a line beginning the word "LOCUS". The start of sequence section is marked by a line beginning the word "ORIGIN" and the end of the section is marked by line only contains "//". See more detail about GenBank format (NCBI) LOCUS AF068625 200 bp mRNA linear ROD 06-DEC-1999 DEFINITION Mus musculus DNA cytosine-5 methyltransferase 3A (Dnmt3a) mRNA, complete cds. ACCESSION AF068625 REGION: 1..200 VERSION AF068625.2 GI:6449467 KEYWORDS . SOURCE Mus musculus (house mouse) ORGANISM Mus musculus Eukaryota; Metazoa; Chordata; Craniata; Vertebrata; Euteleostomi; Mammalia; Eutheria; Euarchontoglires; Glires; Rodentia; Sciurognathi; Muroidea; Muridae; Murinae; Mus. REFERENCE 1 (bases 1 to 200) AUTHORS Okano,M., Xie,S. and Li,E. TITLE Cloning and characterization of a family of novel mammalian DNA (cytosine-5) methyltransferases JOURNAL Nat. Genet. 19 (3), 219-220 (1998) PUBMED 9662389 REFERENCE 2 (bases 1 to 200) AUTHORS Xie,S., Okano,M. and Li,E. TITLE Direct Submission JOURNAL Submitted (28-MAY-1998) CVRC, Mass. Gen. Hospital, 149 13th Street, Charlestown, MA 02129, USA REFERENCE 3 (bases 1 to 200) AUTHORS Okano,M., Chijiwa,T., Sasaki,H. and Li,E. TITLE Direct Submission JOURNAL Submitted (04-NOV-1999) CVRC, Mass. Gen. Hospital, 149 13th Street, Charlestown, MA 02129, USA REMARK Sequence update by submitter COMMENT On Nov 18, 1999 this sequence version replaced gi:3327977. FEATURES Location/Qualifiers source 1..200 /organism="Mus musculus" /mol_type="mRNA" /db_xref="taxon:10090" /chromosome="12" /map="4.0 cM" gene 1..>200 /gene="Dnmt3a" ORIGIN 1 gaattccggc ctgctgccgg gccgcccgac ccgccgggcc acacggcaga gccgcctgaa 61 gcccagcgct gaggctgcac ttttccgagg gcttgacatc agggtctatg tttaagtctt 121 agctcttgct tacaaagacc acggcaattc cttctctgaa gccctcgcag ccccacagcg 181 ccctcgcagc cccagcctgc // Copyright© 2008 RIKEN Center for Developmental Biology All right reserved 70 April 30, 2008 QUMA User’s manual 8.4. Multi-FASTA format Multi-FASTA format consists of multiple sequences of 8.2. FASTA format. ex. >sequence1 ACTCCCCGTGCGCGCCCGGCCCGTAGCGTCCTCGTCGCCGCCCCTCGTCTCGCAGCCGCA GCCCGCGTGGACGCTCTCGCCTGAGCGCCGCGGACTAGCCCGGGTGGCC >sequence2 CAGTCCGGCAGCGCCGGGGTTAAGCGGCCCAAGTAAACGTAGCGCAGCGATCGGCGCCGG AGATTCGCGAACCCGACACTCCGCGCCGCCCGCCGGCCAGGACCCGCGGCGCGATCGCGG CGCCGCGCTACAGCCAGCCTCACTGGCGCGCGGGCGAGCGCACGGGCGCTC >sequence3 CACGACAGGCCCGCTGAGGCTTGTGCCAGACCTTGGAAACCTCAGGTATATACCTTTCCA GACGCGGGATCTCCCCTCCCC >sequence4 CAGCAGACATCTGAATGAAGAAGAGGGTGCCAGCGGGTATGAGGAGTGCATTATCGTTAA TGGGAACTTCAGTGACCAGTCCTCAGACACGAAGGATGCTCCCTCACCCCCAGTCTTGGA GGCAATCTGCACAGAGCCAGTCTGCACACC Copyright© 2008 RIKEN Center for Developmental Biology All right reserved 71 April 30, 2008 QUMA User’s manual 8.5. Zipped archive of sequence files Zipped archive, which consists single folder and includes bisulfite sequence files of 8.2. FASTA or 8.1. Plain sequence format, is uploadable. Acceptable file extension of sequence file is ".seq", ".fa", ".fas", ".fasta" or ".txt". 8.6. How to create zipped archive (Macintosh) 8.6.1. Mac OS X 10.3 and later 1. Put bisulfite sequence files of 8.2. FASTA or 8.1. Plain sequence format into a folder. (Acceptable file extension of sequence file is ".seq", ".fa", ".fas", ".fasta" or ".txt".) Copyright© 2008 RIKEN Center for Developmental Biology All right reserved 72 April 30, 2008 QUMA User’s manual 2. Click to select the folder. 3. Select „Create Archive of "FOLDER NAME"‟ from "File" menu in the Finder toolbar. Copyright© 2008 RIKEN Center for Developmental Biology All right reserved 73 April 30, 2008 QUMA User’s manual 4. The zipped archive automatically appears with extension ".zip" at the same location as the folder you selected. 8.6.2. Other Mac OS Please use ZipIT!, CleanArchiver, MacZip, STUFFIT or other program to create zipped archive. Copyright© 2008 RIKEN Center for Developmental Biology All right reserved 74 April 30, 2008 QUMA User’s manual 8.7. How to create zipped archive (Windows) 8.7.1. Windows Me/XP/Vista 1. Put bisulfite sequence files of 8.2. FASTA or 8.1. Plain sequence format into a folder. (Acceptable file extension of sequence file is ".seq", ".fa", ".fas", ".fasta" or ".txt".) 2. Right-click on the folder. Slide the mouse up to "Send To" and then click on "Compressed (zipped) Folder". Copyright© 2008 RIKEN Center for Developmental Biology All right reserved 75 April 30, 2008 QUMA User’s manual 3. The zipped archive automatically appears as a folder icon with a zipper at the same location as the folder you selected. 8.7.2. Other Windows Please use 7-Zip, WinZip or other program to create zipped archive. Copyright© 2008 RIKEN Center for Developmental Biology All right reserved 76 April 30, 2008 QUMA User’s manual 9. Statistical test 9.1. Fisher‟s exact test The statistical significance of the difference between two bisulfite sequence groups at each CpG site is evaluated with Fisher's exact test that is non-parametric statistical significance test to determine if there are nonrandom associations between two categorical data. Fisher's exact test can use the same way as the Chi-square test for independence and more exact for small number of methylated CpGs or unmethylated CpGs, that is usually detected in CpG methylation analysis. Two-tailed p-value of Fisher's exact test is calculated from the 2 x 2 tables (exampled below) at each CpG site. This p-value is used to show the independence of CpG methylation between two groups at the CpG site. Example 2 x 2 table for CpG methylation status methylated CpG unmethylated CpG a: number of methylated CpGs of group1 at the CpG site b: number of unmethylated CpGs of group1 at the CpG site group1 a b c: number of methylated CpGs of group2 at the CpG site group2 c d d: number of unmethylated CpGs of group2 at the CpG site In case of sample data show in table1, this data can be transformed as table2. Table 1 Table2 CpG position total unmethylated CpG total group1 12 1 13 4/10 (40.0%) group2 4 6 10 16/23 (69.6%) total 16 7 23 group1 12/13 (92.3%) Me-CpG group2 methylated CpG 375 Copyright© 2008 RIKEN Center for Developmental Biology All right reserved 77 April 30, 2008 QUMA User’s manual The probability p of this table can be determined by following formula: p = a+bCa * c+dCc / a+b+c+dCa+c = 13C12 10C4 / 23C16 = (13! 10! 16! 7!) / (12! 1! 4! 6! 23!) = 0.0111357212 where the symbol ! indicates the factorial operator. When the marginal totals are fixed, there are 9 cases indicated below. 6 7 10 0 70 0.0069995962 7 6 9 1 47 0.0699959618 To determine a two-tailed p-value of the significance, make a sum of probabilities of the case when the absolute value of "ad - bc" is not less than the absolute value of "ad - bc" of the sample. In this data, the cases of a = 6, 12 and 13 are used. Then, the two-tailed p-value 8 5 8 2 24 0.2362363710 = 0.0069995962 + 0.0111357212 + 0.0004894823 = 0.0186257997 9 4 7 3 1 0.3499798089 10 3 6 4 22 0.2449858662 11 2 5 5 45 0.0801771926 12 1 4 6 68 0.0111357212 13 0 3 7 91 0.0004894823 a b c d |ad - bc| probability Copyright© 2008 RIKEN Center for Developmental Biology All right reserved 78 April 30, 2008 QUMA User’s manual 9.2. Mann-Whitney U-test The statistical significance between two groups of the entire set of CpG sites is evaluated with the Mann-Whitney U-test (also called the Wilcoxon rank-sum test) that is non-parametric statistical significance test for two distributed samples. Although, Student's t-test is useful in the same situations as Mann-Whitney U-test, we adopt not the parametric Student's t-test but the non-parametric Mann-Whitney U-test, because methylation status does not distribute as a normal distribution, especially in case of hyper- or hypo-methylation. Two-tailed p-value of the Mann-Whitney U-test is determined from ranks of ratio of CpG methylation to all CpG at each bisulfite sequence (exampled below). This p-value indicates the independence of distribution of the ratio of CpG methylation to all CpG. Importantly, this test dose not detect differences in the some situations, especially CpG methylation of imprinting regions, because this test only check the difference of the average of two groups. Additionally, the patterns of CpG methylation are not considered. Example The sample data sets are: Me-CpGs/CpGs of each sequence (number of methylated CpGs / number of CpGs) average ratio of number of methylation sequences group1 6/19, 6/19, 8/19, 9/19 12/19, 15/19, 16/19, 18/19, 18/19, 18/19, 18/18, 19/19, 19/19 0.7409 13 (= n1) group2 2/19, 2/19, 3/19, 3/19 5/19, 5/19, 7/19, 7/19, 7/19, 8/19 0.2579 10 (= n2) (This is the analyzed data of the QUMA sample sequence files.) Is this difference between the average ratio of methylation (0.7409 vs. 0.2579) significant? Copyright© 2008 RIKEN Center for Developmental Biology All right reserved 79 April 30, 2008 QUMA User’s manual First, make ranking of the values (methylation ratio) and determine a rank. When two or more values are share the same rank, take an average of the rank values. In the sample data, two sequences are Me-CpGs/CpGs = 3/19 and the rank values are 3 and 4. Then use 3.5 (average of 3 and 4) as the rank. Second, calculate sum of the rank (Rank sum): R1 and R2. Position i Me-CpGs/CpGs 1 2 3 4 5 2/19 3/19 5/19 6/19 7/19 6 7 8 9 10 11 12 8/19 9/19 12/19 15/19 16/19 18/19 1 Rank sum rank 1,2 3,4 5,6 7,8 9-11 12,13 14 15 16 17 18-20 21-23 rank (average) 1.5 3.5 5.5 7.5 10 12.5 14 15 16 17 19 group1 0 0 0 2 0 1 1 1 1 1 3 3 212.5 (=R1) group2 2 2 2 0 3 1 0 0 0 0 0 0 total 2 2 2 2 3 2 1 1 1 1 3 3 number of sequences 22 63.5 (=R2) Third, determine temporary U-value, U1 and U2, as below. U1 = n1 * n2 + n1 * (n1 + 1) / 2 - R1 = 8.5 U2 = n1 * n2 + n2 * (n2 + 1) / 2 - R2 = 121.5 Take the smaller value of U1 and U2 as the U-value. In this case, U = 8.5 Then determine a two-tailed p-value from the U-value. To determine the p-value, we take the approximation using the normal distribution for the number of sequences above 20. In the case of small sequences (20 and below), we determine the p-value from exact probabilities (Mann Whitney U exact test). Copyright© 2008 RIKEN Center for Developmental Biology All right reserved 80 April 30, 2008 QUMA User’s manual The normal approximation is performed as: where z is a standard normal deviate, E(U) is the mean of U and V(U) is the variance of U: where ti is the number of tied ranks of the position i. At the sample, E(U) = 65, V(U) = 257.812 and z = 3.51879. Then, the two-tailed p-value = 0.0004 is determined from the standard normal distribution (double value for two-tail). Another sample data sets for Mann Whitne U exact test are: Table 1 Me-CpGs/CpGs of each sequence (number of methylated CpGs / number of CpGs) average ratio of number of methylation sequences group1 6/19, 6/19, 9/19 12/19, 15/19, 18/19 0.5789 6 (= n1) group2 3/19, 5/19, 5/19, 7/19, 7/19 0.2842 5 (= n2) Copyright© 2008 RIKEN Center for Developmental Biology All right reserved 81 April 30, 2008 QUMA User’s manual Table 2 Position i Me-CpGs/CpGs 1 2 3 4 5 6 7 8 3/19 5/19 6/19 7/19 9/19 12/19 15/19 18/19 number of Rank sum rank 1 2,3 4,5 6,7 8 9 10 11 sequences rank (average) 1 2.5 4.5 6.5 8 9 10 11 group1 0 0 2 0 1 1 1 1 6 47 (=R1) group2 1 2 0 2 0 0 0 0 5 19 (=R2) total 1 2 2 2 1 1 1 1 11 number of sequences U1 = n1 * n2 + n1 * (n1 + 1) / 2 - R1 = 4 U2 = n1 * n2 + n2 * (n2 + 1) / 2 - R2 = 26 U = min (U1, U2) = 4 When the marginal totals are fixed, there are 179 cases and 11 cases indicated below have U-value not more than the U-value of the sample. Copyright© 2008 RIKEN Center for Developmental Biology All right reserved 82 April 30, 2008 QUMA User’s manual Position i 1 2 3 4 5 6 7 8 Me-CpGs/CpGs 3/19 5/19 6/19 7/19 9/19 12/19 15/19 18/19 Rank sum rank 1 2,3 4,5 6,7 8 9 10 11 rank (average) 1 2.5 4.5 6.5 8 9 10 11 group1/group2 1/0 2/0 2/0 1/1 0/1 0/1 0/1 0/1 21.5/44.5 group1/group2 1/0 2/0 2/0 0/2 1/0 0/1 0/1 0/1 group1/group2 1/0 2/0 2/0 0/2 0/1 1/0 0/1 group1/group2 1/0 2/0 2/0 0/2 0/1 0/1 group1/group2 1/0 2/0 1/1 2/0 0/1 group1/group2 1/0 2/0 1/1 1/1 group1/group2 0/1 1/1 0/2 group1/group2 0/1 0/2 group1/group2 0/1 group1/group2 group1/group2 U-value Probability 0.5 0.00433 23/43 2 0.00216 0/1 24/42 3 0.00216 1/0 0/1 25/41 4 0.00216 0/1 0/1 0/1 23.5/42.5 2.5 0.00433 1/0 0/1 0/1 0/1 25/41 4 0.00866 1/1 1/0 1/0 1/0 1/0 47/19 4 0.00866 2/0 0/2 1/0 1/0 1/0 1/0 47/19 4 0.00216 0/2 1/1 2/0 0/1 1/0 1/0 1/0 47.5/18.5 3.5 0.00433 0/1 0/2 1/1 1/1 1/0 1/0 1/0 1/0 49/17 2 0.00866 0/1 0/2 0/2 2/0 1/0 1/0 1/0 1/0 51/15 0 0.00216 To determine a two-tailed p-value of the significance, make a sum of probabilities of these 11 cases. Then, the two-tailed p-value = 0.0498 Copyright© 2008 RIKEN Center for Developmental Biology All right reserved 83 April 30, 2008 QUMA User’s manual 10. Other 10.1. How to open a CSV file In many case, CSV formatted analysis data file can be opened from Microsoft Excel by double-clicking the file icon. If not, try the "drug & drop" procedure indicated below. 10.1.1. Mac OS Drug & drop the data file icon to the software icon of the Microsoft Excel or OpenOffice. 10.1.2. Windows Open a blank window of the Microsoft Excel or OpenOffice/StartSuite. Then drug & drop the data file icon to the window. Alternatively, open the data file from the "File" menu -> "Open" sub-menu (change "Files of type" tab to "All" or "Text files"). Copyright© 2008 RIKEN Center for Developmental Biology All right reserved 84