1
Tutorial 3: Creating Multiple Layer Graphs
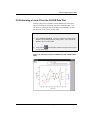
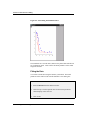
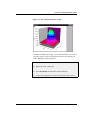
The double Y axis graph template is ideal for plotting data that includes
two or more dependent datasets and a common independent dataset. A
sample double Y axis graph is currently active in your project.
1) Right-click on the double Y axis graph window title bar and select
Hide from the shortcut menu.
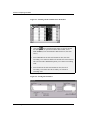
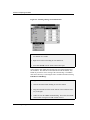
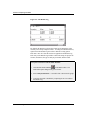
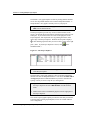
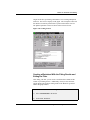
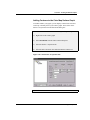
The Project Explorer provides easy access to all the windows in the
project. By default, the Project Explorer is docked at the bottom of your
workspace. If you cannot see the five icons on the right pane of the
Project Explorer, then expand the view by pointing the mouse on the
upper edge of the Project Explorer. When the mouse pointer displays
, click-and-drag upward so that you can see all five icons on the right
pane. (Note: If your Project Explorer is closed, click
Standard toolbar.)
on the
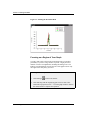
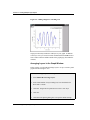
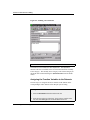
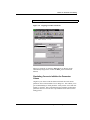
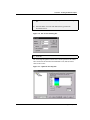
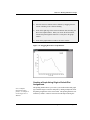
Figure 3.1: The Project Explorer
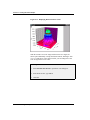
2) Double-click on the Horizontal2Panel graph icon on the right pane
of the Project Explorer.
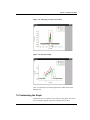
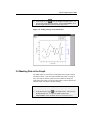
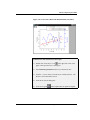
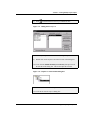
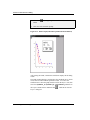
The horizontal 2 panel graph template is ideal for plotting related data
that does not share an independent dataset. You can use the Edit:Add &
Arrange Layers menu command and the Layer tool to customize the
spacing of the layers and to swap the layer arrangement.
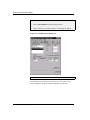
3) Right-click on the Horizontal2Panel graph icon on the right pane of
the Project Explorer and select Hide Window from the shortcut
menu.
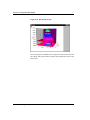
4) Double-click on the Vertical2Panel graph icon on the right pane of
the Project Explorer.
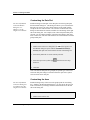
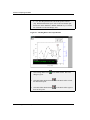
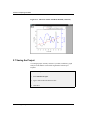
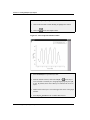
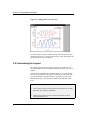
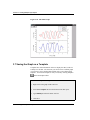
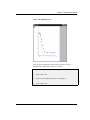
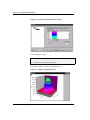
The vertical 2 panel graph template provides the same data presentation
as the horizontal 2 panel graph template, but in a one column with two
rows configuration.
24 • 3.3 Viewing Origin's Multiple Layer Graph Templates