1
Tutorial 5: Creating 3D Surface Graphs
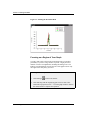
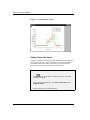
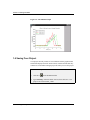
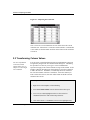
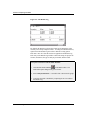
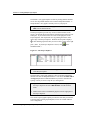
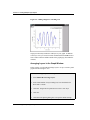
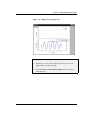
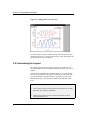
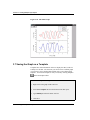
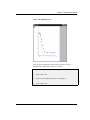
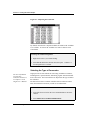
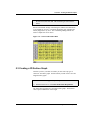
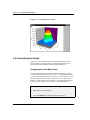
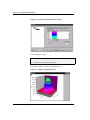
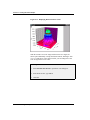
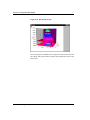
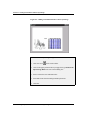
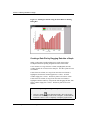
Figure 5.3: Color Map Surface Graph
5.4 Customizing the Graph
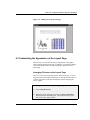
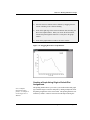
Origin gives you full control over the color mapping applied to the
surface data plot. All the options for customizing the color map are
located on the Color Map tab of the Plot Details dialog box.
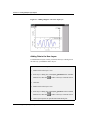
Changing the Color Map Values
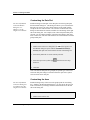
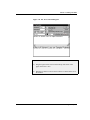
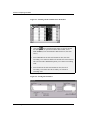
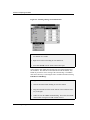
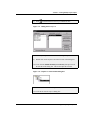
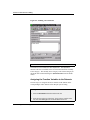
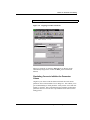
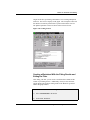
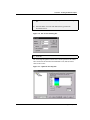
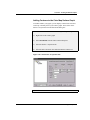
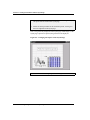
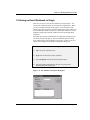
The Color Map tab on the Plot Details dialog box displays the current
color map associated with levels of Z values. To edit an individual level
or color, click on the value or color in the Level or Fill column. To edit
the entire range of levels or colors, click on the Level or Fill column
heading. To edit a range of levels, SHIFT + click on the desired values
to select a range, then click on the Level or Fill column heading.
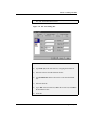
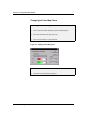
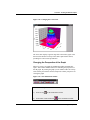
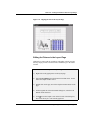
To Change the Number of Levels in the Color Map:
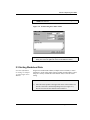
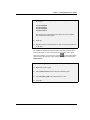
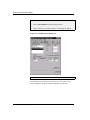
1) Right-click on the surface plot.
2) Select Plot Details from the shortcut menu that opens.
54 • 5.4 Customizing the Graph