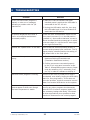
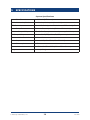
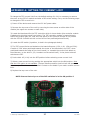
1
PCI-1D (Rev B)
User Guide
Port City Instruments, LLC
2764 N Green Valley Pkwy #538 | Henderson, NV 89014 866-456-2488 | www.PortCityInstruments.com
Copyright © 2014 Port City Instruments, LLC. All Rights Reserved.
This document may not be copied, disclosed, transferred, or modified without the prior
written consent of Port City Instruments, LLC. Port City Instruments, LLC reserves the right
to modify the products and product specifications described in this manual without advance
notice.
Trademarks
Any trademarks, logos, and service marks displayed in this manual are the property of Port
City Instruments, LLC, or other third parties. Users are not permitted to use these marks
without the prior written consent of the company.
All other trademarks mentioned in this document are the property of their respective
owners.
Document Change History
Rev #
Date
Changes
1.0
February 2013
Initial Release (Rev. A).
1.1
November 2013
Added sqrt(I2+Q2) 2f option, and linear scaling of spectra (Rev A).
1.2
October 2014
Rev B version (I-Q demodulation removed, ext. preamp input)
CONTENTS
1INTRODUCTION................................................................................................. 4
1.1 Product overview . .................................................................................. 4
1.1.1
DESCRIPTION OF THE PCI-1DA CONTROLLER............................... 4
1.1.2
Package Contents..................................................................... 4
1.2 User Guide Overview............................................................................... 4
1.3 Precautions and Disclaimer....................................................................... 6
2 INITIAL SETUP.................................................................................................. 8
2.1 Software Installation................................................................................ 8
2.2 Hardware Connections............................................................................. 8
2.2.1
Laser and Detector Connections................................................. 9
2.2.2
Laser Enable/Disable Switch...................................................... 9
2.2.3
Laser Temperature Control Connector......................................... 9
2.2.4
Rear Panel Connections............................................................10
2.2.5
Front Panel Adjustments...........................................................11
3 OPERATION AND USER INTERFACE...................................................................13
3.1 Launching the Program...........................................................................13
3.2 Configuring Scans and Data Acquisition.....................................................15
3.2.1
Laser Scan Settings Tab...........................................................15
3.2.2
Optimizing Preamp and 2f Gain/Phase Settings............................16
3.2.3
Acquisition Settings Tab...........................................................17
3.2.4
Filter and Graph History Tab.....................................................18
3.2.5
Translation Parameters............................................................19
3.2.6
Hardware Settings...................................................................20
3.2.7
Continuous vs. Single Sweep....................................................21
3.3 Spectrum Capture and Save....................................................................21
3.4 Pressure and Temperature Data...............................................................22
3.5 Cursors.................................................................................................23
3.6 Graph Controls.......................................................................................23
4TROUBLESHOOTING.........................................................................................25
5SPECIFICATIONS..............................................................................................26
APPENDIX A: SETTING TEC CURRENT LIMIT..........................................................27
1
INTRODUCTION
1.1 PRODUCT OVERVIEW
1.1.1 DESCRIPTION OF THE PCI-1D CONTROLLER
The PCI-1D is a benchtop laser controller and data acquisition/display module for use with
distributed feedback (DFB) tunable diode lasers and external detector/preamp combinations
with outputs in the 0-10V range. It combines laser current and laser temperature control
with high-speed 16-bit data acquisition and real-time spectrum display to enable highresolution spectroscopic experiments in the laboratory. Spectra can be acquired in
conventional direct transmission mode, or in second harmonic (2f) mode for improved
sensitivity and lower gas detection limits. USB connection to a Windows™ compatible
PC provides display and user interface functions which allow viewing of spectra in real
time, capturing of spectra to disk files, and control of transfer functions for pressure and
temperature sensors which can also be monitored with the system.
Spectrum timing and data acquisition parameters are adjusted via a graphical user interface
(GUI), and spectra can be written to ASCII disk files for subsequent processing or storage.
The system is intended for laboratory or field use with tunable DFB tunable diode lasers.
This user guide describes the hardware and software provided with the PCI-1D module.
Manuals and data sheets are also available from our website in the “Downloads” section:
http://www.portcityinstruments.com/downloads
1.1.2 PACKAGE CONTENTS
The PCI-1D module includes:
•
Controller unit compatible with universal A/C power input (U.S. power cable included)
•
One USB cable for connecting the module to a Windows™ compatible PC
•
One USB “thumb” drive containing the control software. This user manual is available
at http://www.portcityinstruments.com/downloads.php (PCI-1D, Rev B, PDF
1.2 USER GUIDE OVERVIEW
This user guide provides detailed information on how to set up the PCI-1D data acquisition
and display module and the accompanying software. It is assumed that the user has a basic
understanding of Microsoft Windows™, USB ports, and how to locate and manipulate data
files within the Windows™ environment.
An understanding of scanning high-resolution laser spectroscopy is also assumed as the
core function of this product is to acquire and store spectra that are produced by directing
a laser beam through a gas sample to a detector while scanning its wavelength with the
PCI-1D module. A detailed discussion of laser spectroscopy is outside of the scope of this
manual, but many useful references on the subject can easily be found with an internet
search.
© Port City Instruments, LLC
4
PCI-1DA
Before installing the software, make sure your computer is running a compatible version of
the Microsoft Windows™ operating system (XP service pack 3, Vista, or Windows 7), and
has at least one available USB port. Video resolution should be 1280 × 1024, or greater.
Throughout this manual, the direct transmission spectrum (or laser power spectrum) is
referred to as the “DC” spectrum, and the second harmonic spectrum is referred to as the
“2f” spectrum. The DC spectrum is simply the transmitted laser power as measured by the
detector. If the 1f modulation is turned off, then the DC spectrum represents a traditional
transmission spectrum where the zero transmission level can be measured as the value
of the DC spectrum during the (optional) “null” pulse (see section 3.2.1). A normalized
transmission spectrum can be obtained by fitting the transmission spectrum baseline (i.e.
points away from any absorption lines) with a polynomial which is then divided into the
observed transmission spectrum taking into account the observed zero level. Alternatively,
the DC spectrum from an “empty” cell (or a cell filled with a non-absorbing gas) can be
used to normalize the DC spectrum to obtain the normalized transmission spectrum. The
normalized transmission spectrum can then be used for quantitative analysis, conversion to
absorption coefficient, etc. Some relevant relationships are:
Raw transmission spectrum:T(ν); Recorded as the “DC” spectrum from
the PCI-1DA. ν is wavenumber (cm-1)
Transmission baseline = To(ν):To(ν); Obtained by baseline fit, or empty
cell spectrum
Zero level = Z:DC spectrum value during the null pulse (or
with the beam blocked from the detector)
Normalized transmission spectrum:Tn(ν) = [T(ν) – Z)] / [To(ν) – Z]
Absorption spectrum:A(ν) = 1 – Tn(ν)
Absorbance spectrum:A’(ν) = -ln[Tn(ν)]
Absorption Coefficient spectrum:k(ν) = -ln[Tn(ν)] /(ρ * L) = A’(ν) /(ρ * L)
ρ = molecules/cm3, L = pathlength in cm
Second harmonic (2f) spectrum:H(ν); Recorded as the 2f spectrum from
the PCI-1DA
The above relationships can be used to convert the raw transmission spectrum provided
by the system to useful quantitative spectra for further analysis. Note that when the
modulation amplitude (Imod) is nonzero, the raw transmission spectrum is distorted
(spectral lines are broadened and reduced in amplitude) due to the wavelength excursions
caused by the sinusoidal current modulation. However, the area under the normalized
transmission lines is preserved so that traditional “area under the curve” processing can be
used for quantitative analysis even when the modulation amplitude is not zero.
Lastly, the original PCI-1DA units (Rev A), used I-Q demodulation to extract the 2f signal.
The Rev B version uses conventional 2f demodulation where the phase is adjusted using a
knob on the front instrument panel. The other difference between the Rev A system and
the Rev B system is that the Rev B system requires an external preamp that produces a
voltage in the 0-10V range. It is not compatible with direct detector inputs as with Rev A.
© Port City Instruments, LLC
5
PCI-1DA
Always connect the output of an external preamp to the 'Preamp" input of the Rev B version
of the PCI-1D controller
1.3 PRECAUTIONS AND DISCLAIMER
This control unit can supply up to 250 mA of DC laser drive current to a DFB laser. Always
ensure that the programmed laser current is below the specified current limit for the laser
being used. We suggest the following procedures for safely driving a DFB laser:
1) Set the front panel laser enable/disable key switch (described in section 2.2.2) to the
OFF position (full counterclockwise, or vertical) before powering up the system. This switch
should always be placed in the OFF position prior to power up.
2) Power up the unit (power rocker switch is on the far right of the front panel), and start
the control program. Check the programmed laser current values (starting current, ending
current, modulation amplitude) to ensure that the values are within range for the laser
being used. All values are shown in mA on the GUI.
3) Turn the laser enable/disable key switch into the ON position (clockwise) to allow current
to pass to the laser. The green LED adjacent to this switch will illuminate to indicate that
laser current is enabled.
To power off the system follow these steps:
1) Set the laser enable/disable switch to the OFF position and ensure that the green LED is
off.
2) Stop the control program using the STOP button on the GUI (top left of the user
interface).
3) Power down the unit using the front panel power switch.
Note that it is the user’s responsibility to confirm safe operating currents for the laser being
used, and that the laser is connected to the system with the correct polarity as described
in this manual. Port City Instruments or its distributors cannot be held responsible for laser
damage caused by incorrect connections, or currents exceeding the laser’s specifications.
If there is any doubt as to the laser current being provided by the system, measure it
directly as follows:
1) Place a precision 10 ohm, ½W resistor across the laser drive BNC connector. Do not
ground the negative (outer ring of BNC) connection, but connect the resistor directly across
the BNC terminals using suitable wiring and connectors.
2) Power up the system, set the laser scan current parameters, and set the laser enable/
disable key switch to the ON (turn colckwise) position.
3) Using an oscilloscope, place the ground clip or negative lead to a power ground point
(eg. the outer ring of the rear panel 0-5V output BNC). Place the probe or positive lead on
the laser anode point (side of resistor connected to the center pin of the BNC) and note the
© Port City Instruments, LLC
6
PCI-1DA
voltage at both the start of the sweep and at the end of the sweep that should be displayed
on the oscilloscope.
4) Repeat the above voltage measurements on the cathode (negative) side of the resistor
(outer ring of BNC) which should also display the scan ramp, but at a lower amplitude.
5) Subtract the voltage levels observed at the anode and cathode connections to get the
voltage across the 10 ohm resistor, and calculate the current using Ohm’s law (I = V/R with
R = 5 ohm). This allows direct measurement of the starting and ending currents.
Note: For the Rev A version of the controller, the laser scan waveform had a positive voltage
when viewed as described above (laser anode is driven by a positive voltage ramp). For
the Rev B version the laser driver circuit is based on the Wavelength Electronics FL500
laser current driver. This driver holds the laser anode at +5V and drives the cathode with
a negative sloping ramp. In both configurations the connections to the laser are the same
(center pin is anode, outer ring is cathode) so operation and connections are the same for
Rev A and Rev B. The Rev B unit has "Rev B" on the rear panel overlay (upper right). The
Rev A unit has no label in this position on the rear panel. The FL500 datasheet is available
at the Wavelength Electronics website:
http://www.teamwavelength.com/downloads/datasheets/fl500.pdf
Port City Instruments, LLC has no business relationship with Wavelength Electronics and
are using this component level laser driver due to its suitability for driving DFB lasers, low
noise operation, and safety features. Please consult the datasheet above for the FL500 for
additional information and specifications on this laser driver.
© Port City Instruments, LLC
7
PCI-1DA
2 INITIAL SETUP
2.1 SOFTWARE INSTALLATION
Install the software as follows (install software before connecting PCI-1D USB cable):
1. Insert the supplied USB drive into an available USB port.
2. Double-click the file setup.exe in the root folder of the USB drive and follow the onscreen instructions to install the software on your computer.
NOTE: A Labview™ runtime engine will be installed if you do not already have this
software on your computer. Accept the licenses that are presented.
3. Connect the supplied USB cable between the PCI-1D unit and a PC running a
compatible version of Microsoft Windows™ (XP SP3, Vista, Windows 7).
Windows should identify the internal I/O board and load the driver automatically.
Create a Desktop Icon for the new application (called PortCity_1D) as follows if the icon
does not appear on the desktop automatically:
•
Locate the control program in the Start > All Programs menu. Right click the new
program and select Send To, then select Desktop (create shortcut) to place the
program icon on your desktop for easy future access.
2.2 HARDWARE CONNECTIONS
The front and rear panels of the PCI-1D module (Rev B) are shown below:
Front Panel
Rear Panel
© Port City Instruments, LLC
8
PCI-1DA
2.2.1 LASER AND EXTERNAL PREAMP CONNECTIONS
Cathode (–)
Anode (+)
BNC
Laser drive output and preamp input signals are via BNC
connectors on the panel whose functions are labeled. The
positive (anode) connection is at the center pin and the
negative (cathode) connection is the outer ring of the BNC
connector. Always confirm correct polarity of the laser
connections before allowing current to flow as damage to
the laser is highly likely if the polarity is reversed! Note
that the laser cathode is not tied to ground internally
so never ground the outer ring of the BNC connector …
connect the laser anode and cathode pins directly to the
BNC as shown here. If alternate connections are preferred
(e.g. SMA), there are commercial suppliers of suitable
adapters that can be used with the module.
Preamp input connection follows the same polarity as for the laser connector (+ preamp
output signal is center pin, - is the outer ring and can be ground based).
2.2.2 LASER ENABLE/DISABLE SWITCH
The key switch located directly to the left of the laser BNC connector on the front panel
must be ON (turned clockwise 90 degrees) for current to flow through the laser, regardless
of any setting on the GUI. This key switch is connected to a CMOS switch on the internal
control board which blocks current to the laser when the switch is OFF (vertical). A green
LED is illuminated when this switch is in the ON position to indicate that laser current is
enabled. Always confirm that the laser current levels on the user interface are within range
for the laser being used before placing the key switch into the ON position!
2.2.3 LASER TEMPERATURE CONTROL CONNECTOR
The 9-pin D connector on the front panel interfaces to the laser thermoelectric cooler and
thermistor. This connector is wired internally to the thermoelectric cooler (TEC) controller.
Most commercial laser packages contain an NTC thermistor with a resistance of 10Kohm
at 25C. See section 3.2.4 for instructions on how to enter the appropriate conversion
factors for the actual thermistor being used so that the display correctly indicates the laser
temperature. As shipped, the controller is set for a nominal 25C set point assuming a 10K
at 25C thermistor and typical beta value of ~3900. If the laser being used has a different
thermistor beta or 25C resistance value, be sure to adjust the conversion parameters
described in section 3.2.5 so that the value displayed on the GUI is correct.
Note: At first power-up, leave the 9-pin front panel connector disconnected and ensure that
the laser set point temperature displayed on the GUI is near 25C (or at a safe value) in case
the temperature adjustment knob was moved during shipping.
The internal TEC controller operates from 5V and can provide up to 2A of current to the
laser. However, a current limit of 1A is set by default using an internal DIP switch. This
current limit is appropriate for most near-IR DFB lasers having internal TEC and thermistor.
For higher current limits see Appendix A for instructions on how to raise the TEC current
limit. It is important never to exceed the specified laser TEC current limits!
© Port City Instruments, LLC
9
PCI-1DA
The pinout for the 9-pin Dsub connector is given in Table 1.
Table 1: 9-pin Laser Temperature Connector
Pin
Signal
1
TEC +
2
No Connection
3
No Connection
4
No Connection
5
Thermistor
6
TEC –
7
No Connection
8
No Connection
9
Thermistor
Always confirm correct TEC polarity before powering up the unit. Reversing the connections
to the TEC can result in damage to the TEC element! The thermistor connections have no
polarity and can be connected in either order.
2.2.4 REAR PANEL CONNECTIONS
The rear panel contains three BNC connectors for monitoring the raw laser power and 2f
signals using an oscilloscope. These are labeled “DC” for laser power (output of the DC
signal chain), "2f" for the second harmonic signal, and "+5V" for a 5V DC output which can
be used to power external preamps. The outer BNC rings are tied to power supply ground
inside the enclosure. The center pin of the rear panel DC and 2f BNC connectors may not be
grounded, but centered near the midpoint of the 0-5V power supply range at approximately
2.5V. The +5V DC output BNC ring is tied to power ground internal to the enclosure
A 25-pin D connector is provided on the rear panel for temperature and pressure sensor
input signals, which are conditioned to produce higher voltage level outputs that the
software converts to engineering units. Appropriate transfer functions can be customized to
match a wide range of thermistors, PRTDs and pressure sensor types (see section 3.2.4). A
stable 5.00V reference signal is provided on this connector for use with ratiometric pressure
sensors having an output in the 0-5V range (such sensors typically provide outputs of 0.25
to 4.75V, 0.5 to 4.5V, etc., that vary linearly with pressure, and in proportion to the power
supply voltage). A 10V bias signal is also provided for use with unamplified pressure sensors
having (typically) 0-100 mV outputs. An internal differential amplifier is provided for these
types of sensors which cancels out the high common mode voltage generally present on the
outputs of this type of sensor (e.g. the popular Honeywell 19 mm series).
For amplified pressure sensors powered by the 5.00V reference, connections are made
to pins 17-19 as indicated in the table. Pin 17 is monitored by the software as the final
pressure sensor output voltage. It is also possible to use unamplified pressure sensors
having a 0-100 mV output, but the output signal from this type of connector (at pin 20)
must be routed externally at the 25-pin connector to pin 17. Note that only one type of
pressure sensor can be connected to the system … either an amplified sensor without
output in the 0-5V range, or an unamplified sensor with an output in the 0-100 mV range.
In either case the software monitors pin 17, and uses the transfer function defined in the
© Port City Instruments, LLC
10
PCI-1DA
Translation Parameters section (see section 3.2.5). To use an unamplified pressure
sensor with a 0 – 100 mV native output, connect it as shown in Table 2 (pins 7, 8, 20 and
21), and connect pin 20 to pin 17 at the external connector. The output on 17 in this case is
typically 0 – 3.5V for a 0 – 100 mV sensor output.
Table 2: 25-pin Auxiliary Connector (rear panel)
Pin
*
Signal*
1
No Connection
2
No Connection
3
No Connection
4
Ground
5
Ground
6
Ground
7
Unamplified P Sensor bias (+10V)
8
Unamplified P Sensor Output (–)
9
PRTD Bias
10
PRTD (-)
11
Ground
12
Thermistor #1 Return (Ground)
13
Thermistor #2 Return (Ground)
14
No Connection
15
No Connection
16
No Connection
17
Amplified P Sensor Output (+)
18
Amplified P Sensor Bias (+5.00V)
19
Amplified P Sensor Return (Ground)
20
Unamplified P Sensor Output (+) **
21
Unamplified P Sensor Bias Return (Ground)
22
PRTD (+)
23
PRTD Ground
24
Thermistor #1 +
25
Thermistor #2 +
Colors indicate suggested pin connectors for each sensor input. All grounds/returns are tied together
on the internal circuit board so alternate ground points can be chosen if desired.
**
Wire pin 20 to pin 17 if an unamplified 0 – 100 mV pressure sensor is used (and make no
connections to pins 18 or 19 in this case).
2.2.5 FRONT PANEL ADJUSTMENTS
The four knobs on the front panel allow adjustment of the laser temperature, preamp
signal amplitude, 2f gain, and 2f phase, as labeled. Each adjustment is a 10-turn precision
potentiometer to provide a high resolution on the settings. Note that the "Preamp Gain"
adjustment scales the incoming external preamp signal so that it is within the allowed 0-5V
range of the system. This gain adjustment range is from 0.5 to 3.0 (scale factor applied to
the input signal), provided primarily to reduce signals above 5V down to the 0-5V range.
© Port City Instruments, LLC
11
PCI-1DA
Always adjust the gain of the external preamp to below 5V if possible, then use the PCI-1D
preamp gain adjustment to further optimize the DC spectrum signal amplitude.
Laser temperature setpoint and actual setpoint values are displayed on the GUI in the Data
section of the screen provided the translation parameters in the software are set correctly
(see section 3.2.5 for details on setting these parameters). These values are updated at the
same rate as the spectrum plots, and the setpoint can be increased or decreased using the
adjustment knob on the front panel. Clockwise rotation increases the laser temperature and
counterclockwise rotation decreases the laser temperature.
Both gain adjustments (preamp and 2f) increase in the clockwise direction. See
section 3.2.2 for a description of how to optimize the preamp and 2f gain settings for
measurements.
© Port City Instruments, LLC
12
PCI-1DA
3 OPERATION AND USER INTERFACE
3.1 LAUNCHING THE PROGRAM
1. Make sure the USB cable is connected between the computer and the PCI-1D module
and that the software has been installed.
2. Launch the user interface by double-clicking the program icon.
NOTE: You can also launch the interface by navigating to the program via Start >
All Programs > Port City Instruments, LLC > PCI-1D > PortCity_1D.
3. Set the correct device number for the I/O board. Depending on whether you have
additional I/O boards connected to the computer, the device number assigned by
Windows may differ from the default setting in the software. In this case you will see
the following error message dialog box appear at program start (the right image is
the same error box, scrolled down to show the remainder of the message):
Click on the Continue button on this dialog box after noting the “Suggested Device” at the
bottom of the error message window. Next, click on the button labeled “HW Settings/
Translation” just below the EXIT button at the top, left of the GUI. This produces a small
window where the device number can be changed, as shown below (select Hardware
Settings tab).
Change the numeric value in both of the boxes at
the top (Input Physical Channels and Output Physical
Channels) to match the “Suggested Device” number
shown in the initial error box. The best way to do this
it to simply highlight the “5” and replace it with “1”
(for this example … use the appropriate numbers for
your system). Click the Apply button at the bottom
to make the change, then click the OK button to
permanently save it. The device number is saved to
a configuration file so this process should only be
necessary the first time the program is executed.
If you don’t see the error dialog, then the device
number is already correct.
© Port City Instruments, LLC
13
PCI-1DA
Note: The format of the channel number ranges if you want to use the drop-down arrow to
select a device number (which should match that shown in the “Suggested Device”). The
channel ranges must be must be specified with a colon and entered exactly as shown below:
Devn/ai0:9 for the input channels
Devn/ao0:1 for the output channels
where "n” is the device number. Ensure that “0” is numeric zero, not letter “o”.
The program will start automatically when launched from Windows, and can be started and
stopped interactively using the buttons at the top left of the screen:
•
START
•
STOP
•
EXIT
The main user interface is shown in the screen capture below:
Within this interface, the upper right plot works like an oscilloscope and updates when each
new spectrum pair (a single pair, or an averaged group) is available.
•
Clicking the Capture Spectra button at the left, center section of the GUI fills the
lower plot with the most recent spectrum from the upper plot.
•
Clicking the Save Spectra button writes the captured spectra to a disk file, with or
© Port City Instruments, LLC
14
PCI-1DA
without the pressure and temperature data (depending on whether the “Omit P/T”
box is checked … see section 3.3 for file format details).
In this way the upper plot window can be monitored in real time, and the Capture Spectra
button used to “capture” a spectrum pair for the lower window. Once in the lower window
the graph controls for that graph window can be used to zoom, pan, and so on for closer
examination, while the upper plot window continues to display the real-time spectra
acquired by the module. See section 3.6 for more information on the various graph controls.
3.2 CONFIGURING SCANS AND DATA ACQUISITION
At the upper left of the user interface screen are three tabs which are selected by clicking
on the appropriate heading. These are described as they appear from left to right.
3.2.1 LASER SCAN SETTINGS TAB
This tab controls the laser scan current as well as the length or existence of a laser OFF
pulse (“null” pulse) at the start of each current sweep. Values that can be entered on this
tab are the laser scan starting current in mA, the ending current in mA, and the amplitude
(peak-to-peak) of a sinusoidal 1f modulation at 31.2 KHz that is added to the base laser
scan ramp for second harmonic (2f) detection. When “Imod” has a value of zero, the 2f
spectrum is not present and traditional direct transmission spectra can be recorded. For any
nonzero value of Imod, a 2f spectrum is produced whose line shapes will vary with
modulation amplitude.
The laser off (Null) pulse is useful
for determining the system zero
level in the absence of laser light.
When the detector is only able
to see laser light and no other
source of light (e.g. room lights,
sunlight) the laser power level
during the null pulse is stable
and the Null pulse check box can
be unchecked to disable this laser off period. If stray light from any source can reach the
detector, checking the Null pulse box allows the detector zero level to be measured at each
sweep. In the example plot above the null pulse is enabled (red curve) and the brief laser
© Port City Instruments, LLC
15
PCI-1DA
off pulse is visible at the left side of the spectrum plot. The null pulse length is entered as a
percentage of the total scan width (2-3% is typical, or the null pulse can be disabled).
Values are “live” in that any time a value is changed and the mouse is clicked in another
location on the screen, the most recent value entered into an entry box is activated. Always
make sure the laser current settings are within range for the laser being used, and it is
strongly suggested to always use the pushbutton on the front panel of the control box
to turn the laser off if there is any possibility of entering an unsafe current for the laser.
The control board is capable of supplying up to 250 mA to the laser, and it is the user’s
responsibility to ensure that valid laser current values are entered in this section.
Two counters are displayed at the lower portion of each tab. Avg Count shows the current
scan number within an averaged group and simply resets to 1 when the final count is
reached (for example, if averaging 4 scans, this number will run 1, 2, 3, 4, 1, 2, 3, 4, etc.).
Trigger Count counts every trigger input continuously as long as the program is running.
Click Reset to reset this to 1 and continue counting from that point.
3.2.2 OPTIMIZING PREAMP AND 2F GAIN/PHASE SETTINGS
Optimum preamp and 2f gain settings will vary with laser power and alignment and the level
of absorption by the spectral line(s) under study. Before either of these gain settings can
be optimized it is necessary to define the laser scan settings as described in the previous
section, and to align the laser to the detector to create a signal to work with.
The typical adjustment procedure for the preamp and 2f gains is as follows:
1) Set the laser scan parameters as desired and align the laser to the detector to produce
a nonzero DC signal in the Dynamic plot window on the GUI (upper plot window).
Initially, the DC signal in this plot window may be entirely near the bottom of the plot
window (preamp gain too low), or entirely at the top of the plot window (preamp gain too
high). Adjust the preamp gain to bring the signal at the extreme right side of the plot to
approximately 4.5V (the left scale is the amplitude of the DC signal). Iterate laser alignment
and preamp gain to ensure that the DC signal in the Dynamic plot window is on scale at
the highest power point in the scan (usually the highest current point of the scan, at the far
right side of the plot window).
2) Once the preamp gain is set, and when the modulation amplitude value is nonzero (i.e.
when 2f detection is used), adjust the 2f gain knob to ensure that the largest 2f signal in
the spectrum is on scale (the right vertical scale is the 2f signal amplitude). The 2f signal
amplitude varies in proportion to laser power as well as the preamp gain, so the 2f gain
setting may require adjustment if laser power and/or preamp gain are varied. It also
depends on the 2f Phase setting which can be adjusted for maximum signal amplitude using
the front panel phase adjustment knob.
The 2f signal phase adjustment covers a full 360 degree range. As a result, the 2f signal
can be adjusted so that the central signal lobe is either positive or negative. This is purely a
preference and the peak-to-peak signal amplitude at optimum phase setting (the value that
produces the largest amplitude 2f signal) is the same whether the central lobe is positive
or negative. Adjust the phase setting for maximum 2f signal amplitude, and for your
preferrred polarity of the 2f signal.
© Port City Instruments, LLC
16
PCI-1DA
3.2.3 ACQUISITION SETTINGS TAB
The Acquisition Settings tab defines the timing for acquisition of spectra.
•
Scan Period: Time (in ms) of a single laser sweep. Valid values are from 200 ms
(5 Hz) to 5,000 ms (0.2 Hz).
•
#Points/Spectrum: The total number of data points to acquire per spectrum. Valid
values depend on the scan period based on the maximum data acquisition rate of the
I/O board (250 KHz). The aggregate sampling rate is shown below the scan period
and must be less than 250,000. Note that the aggregate sampling rate includes all of
the analog input channels, which are all sampled at the same rate.
•
#Scans Averaged: The number of spectra to average before plotting. The software
will acquire and average this number of spectra and use this as the basic result to
plot and/or save to a disk file. The “capture” window (see Section 3.3) also shows
only the averaged spectrum if more than one spectrum is averaged. To plot every
spectrum set this parameter to 1. Valid ranges are 1 – 256.
3.2.4 FILTER AND GRAPH HISTORY TAB
A simple moving average can be applied to the spectra in real time by using the parameters
within this tab. Each spectrum is processed independently and filtering can be turned on or
off using the checkboxes next to each selection box as shown below.
The individual entries under Run Avg control the number of points that will be used in the
moving average and must be odd. This can be turned on or off independently for the laser
power (DC) and second harmonic (2f) channels using the check boxes to the left of each
numeric entry box. Optimal settings are best obtained by visual inspection of the spectra
as these parameters are changed. The minimum value is 3 and maximum value is not
limited, but should generally be no larger than 35. The primary purpose of these filters is to
implement an effective time constant that is longer than the hardware value, or to filter out
higher frequency noise in the spectra.
© Port City Instruments, LLC
17
PCI-1DA
The Spectra Graph History entry allows multiple spectra to be “captured” into the Capture
window at the lower right of the GUI. If the entry is set to 1, every capture event will erase
the previous spectrum pair and plot the most recent pair from the Dynamic window into
the lower Capture window. For values greater than 1, each capture event will plot the most
recent spectrum pair into the Capture window without erasing the previous spectrum pair
until the Graph History value is reached. At that point each new capture event will erase
the oldest spectrum pair from the Capture window and add the most recent spectrum pair.
Clicking the Clear History button erases all plots within the Capture window. The Save
Spectra button saves only the most recent spectrum pair to the disk file.
3.2.5 TRANSLATION PARAMETERS
Just below the EXIT button at the upper left of the GUI is a button labeled “HW Settings/
Translation.” Clicking this button brings up a new 2-tab window that allows changes to
the hardware settings, and definition of the coefficients used to translate the pressure and
temperature sensor raw voltages into engineering units. The Translation Parameters
tab contains conversion parameters for the pressure and temperature sensor raw voltage
inputs, as described below (reference the screen capture).
•
Pressure: This is a simple linear conversion of the raw input voltage (Vin) to a
pressure in mbar. The correct values for b1 and b2 must be determined by lab
calibration of the pressure sensor being used. Usually, a specific pressure sensor
will have a linear output with pressure, but there are a wide range of sensors on the
market with both amplified and unamplified outputs. Refer to your pressure sensor
specifications for details on the pressure sensor output vs. pressure relationship and
enter the appropriate values for b1 and b2 in this section. These value are retained
in a file and used at each restart, and can be changed at any time.
© Port City Instruments, LLC
18
PCI-1DA
•
PRTD: This is also a polynomial (quadratic) for conversion of a PRTD sensor’s
resistance to a temperature in centigrade. A bias circuit on the internal control board
produces a voltage from the sensor according to the following relationship:
Rt = 495.52 * Vin
where Vin is the raw input voltage read by the control unit.
Various relationships can be used to convert the PRTD resistance into a temperature.
A common (linear) relationship is given by
T(C) = [(Rt / Ro) – 1] / alpha
where Ro is the PRTD resistance at 0C (usually 100, 500 or 1000 ohm), Rt is the
PRTD resistance at temperature T, and alpha is a scale factor specific to the PRTD
being used. A typical value for alpha is 0.00385 ohm/ohm/C and is usually provided
with the PRTD, along with Ro. The above equation can also be written:
T(C) = a1 + a2*Rt
with a1 = -1 / alpha, and a2 = 1 / (alpha * Ro).
If a quadratic term is needed the parameter a3 can be used and the user can define
all three coefficients using this screen. 1000 ohm PRTDs work best with this system
and should be used if available (higher voltage output for a given bias current).
© Port City Instruments, LLC
19
PCI-1DA
•
Thermistors:
Thermistor conversions use the common “beta” value along with the resistance at
25C (To) as follows:
T(K) = [(1/β)ln(Rt/Rto) + 1/To]-1
T(C) = T(K) – 273.15
where β is the beta value typically provided with the thermistor and Rto is the
thermistor resistance at To = 25C. Rt is the thermistor resistance at temperature T
and is measured internally by the system prior to the above conversions.
•
Spectrum Scaling:
The lower two sections allow a linear scaling and offset to the raw DC and 2f spectra
via the b1 and b2 coefficients. As indicated, these coefficients allow an offset (b1)
and linear scaling (b2) of the raw input data. For example, it may be useful to place
the DC spectrum null pulse level at 0V, and to place the 2f spectrum baseline at 0V.
Setting b1 = 0.0 and b2 = 1.0 produces no scaling. Setting b1 = 0.0 and b2 = -1.0
will invert the spectrum, etc.
Clicking the Apply button activates any parameter changes but does not save them.
Clicking the Cancel button discards any changes that were made and exits the screen.
Clicking the OK button saves all changes and writes them to a file for the next startup.
3.2.6 HARDWARE SETTINGS
The second tab on the HW Settings/Translation button controls which hardware channels
are used by the software. As described in section 3.1, the device number assigned by
Windows at first use of the controller may be different from the device number in the
configuration file as shipped. Follow the instructions given in section 3.1 to change the
device number, if necessary.
© Port City Instruments, LLC
20
PCI-1DA
3.2.7 CONTINUOUS VS. SINGLE SWEEP
The program can operate in a continuous sweep mode (default) which continuously applies
the laser scan ramp to the laser and displays each spectrum in the Dynamic plot window, or
it can operate in a single sweep mode where only one laser current sweep is executed when
the START button is clicked. The system works best in continuous sweep mode with a laser
scan rate of 1 Hz or faster. Single sweep is provided as an option but for optimum stability
and reproducibility the continuous sweep mode is recommended.
The laser temperature will better stabilize when the scan ramp is continuous and repeating,
especially if a null pulse is implemented. Also, the control application needs time to process
each spectrum and update the GUI after each scan (or averaged group of scans), and
several scan periods may be necessary for stabilization if the laser current parameters are
changed, or if the laser temperature is changed. Always wait for the spectra to stabilize in
the Dynamic plot window before capturing or saving spectra to disk files. DFB lasers are
extremely sensitive to temperature and must be allowed to stabilize after laser current or
laser temperature changes are implemented.
3.3 SPECTRUM CAPTURE AND SAVE
This section contains a button (Capture Spectra) that allows the most recent spectrum pair
displayed in the Dynamic (upper) plot window to be “captured” into the lower plot window.
Each time this button is clicked the system will wait until the next spectrum pair (DC and 2f)
is plotted in the upper window, then it will duplicate that data plot in the lower plot window.
Once a spectrum pair is displayed in the lower plot window it can be saved to a disk file by
clicking on the Save Spectra button. This button only writes the most recent spectrum pair
that is displayed in the lower plot window, regardless of how many spectra are displayed in
this window (controlled by the Graph History value … see section 3.2.4). If you want to save
a successive series of spectra make sure to save each one after it is captured, and before
capturing another spectrum. The most recent spectrum captured will stay in the lower plot
© Port City Instruments, LLC
21
PCI-1DA
window as long as the program is running so it can be saved to disk at any time, as long
as a new spectrum pair is not captured via the Capture Spectra button. A file dialog box
appears to select the name and location of the disk file each time the Save Spectra button
is clicked.
The check box titled Omit P/T can be used to disable writing of the pressure and
temperature data. When this box is unchecked (default), data is written to the disk file as
follows (variables are delimited by spaces):
N DC 2f P PRTD T1 T2 Tset Tactual
where:
N = spectrum index running 1, 2, 3 … to NPTS, with NPTS = number of points per
spectrum. These values are useful for plotting as the x-axis for the raw spectra.
DC = DC spectrum values (in same units used for the data plots).
2f = 2f spectrum values (in same units used for the data plots).
P = Pressure in mbar (1 mbar = 100 pascals = 1 hectopascal = 0.75062 Torr).
T1 = Thermistor #1 value in degrees C.
T2 = Thermistor #2 value in degrees C.
Tset = Laser temperature set point value in degrees C.
Tactual = Actual laser temperature value in degrees C.
When the Omit P/T box is checked, only the first three columns are written to the disk
file (i.e. N, DC and 2f). All of the pressure and temperature values are omitted. Since the
pressure and temperature values are the same for every point in the spectrum, these
values repeat on each row of the data file. The Omit P/T option allows these values to be
eliminated, although the extra storage space they require is generally negligible on modern
computers.
3.4 PRESSURE AND TEMPERATURE DATA
The Data section of the GUI displays the current values for the pressure sensor and the
various temperature sensors, as well as the amplitude and position of a 2f feature between
the cursors (see section 3.5 below). The two thermistors are labeled “Therm1” and Therm2”,
with the remaining parameters identified by their labels. These values update at the same
rate as the spectra. When adjusting the laser temperature using the front panel knob, it
is best to set the number of spectra being averaged to 1 so that this parameter updates
at a rate fast enough to follow visually. The thermal time constant of the TEC controller is
approximately 2-3s, and this limits how fast the actual laser temperature can change in
response to a laser temperature set point change. When Tactual equals Tset (or when stable
even with a slight difference) the laser temperature is stable and spectrum acquisition can
proceed.
© Port City Instruments, LLC
22
PCI-1DA
3.5CURSORS
Two cursors are provided in the Dynamic plot window for monitoring the peak-to-peak
amplitude of a specific 2f signal. These cursors can be dragged left or right using the mouse
(click and hold the left mouse button down on one of the cursors, then drag the cursor
left or right). Their positions are indicated in the display box directly below the upper plot
window. The peak-to-peak 2f signal between the cursors is displayed in the Data Display
Section, as is the position of the positive maximum within the region bounded by the
cursors. Note that the position is relative to the left cursor and not the first point in the
spectrum. Clicking the Reset Cursors button at the bottom right of the Data Display Section
will reset the cursors to the extreme left/right ends of the plot window.
3.6 GRAPH CONTROLS
There are three separate graph control functional blocks associated with each graph. These
are located at the upper right, the lower left, and the lower right of the graph windows.
These controls provide a wide range of functions such as zooming,
panning, changing the color and width of the lines on the plots, switching
between fixed axes and autoscaling axes, etc. National Instruments
provide a searchable online Help resource where examples can be found
for any of the graph functions. It is located here:
http://zone.ni.com/reference/en-XX/help/371361H-01/
(e.g. type in “zoom in on a graph” to get links for examples and tutorials
on this feature). The best way to familiarize yourself with the graph
controls is to try them out. The upper right control block (located above
the top, right portion of the plot window) produces drop-down lists with
options that are descriptive and mostly obvious (e.g. “Color” changes the
color of the line plot).
Left-click once on the DC or 2f inverted triangle to produce the dropdown list shown to the left.
Most of the available options shown have further drop-down lists which
provide the various selections for that option. Here the line colors,
widths, style, etc., can be changed, along with many other appearance
options. These options are all “live’ in that they alter the appearance of
the plot in real time as they are selected.
The control block at the lower left of the plots contains the zoom and
pan options. Clicking the center icon (magnifying glass with “+” sign)
produces the zoom selection block shown to the right.
© Port City Instruments, LLC
23
PCI-1DA
The diagrams indicate the function of each zoom option. For example, the upper left option
zooms to a selected window, and the middle, lower option returns the plot to full scale on
both axes. Again, experiment with these various options to learn their functions, or visit
the website link given earlier in this section for more complete descriptions of the various
graph controls. For this application, the pan and zoom functions are the most useful as fine
features in the spectra can be examined, especially within the capture window where the
plotted data are static.
Another useful control is the “lock” control. This is located within the lower right set of graph
controls shown below. The leftmost control within each section (padlock icon) allows the
selected axis/variable chosen to be fixed at the current value and
not autoscale with the data. This is a toggle control and can be
turned on and off by left-clicking the padlock icon. It is especially
useful for locking the vertical axis scale to monitor variations in
signal amplitude relative to some fixed value.
Also located within this control block is the
ability to change precision, format, etc., of the axis labels. Clicking the
rightmost icon produces the selections shown in the screen capture
to the right. These options can be useful for creating a specific plot
format if plots are saved using screen captures, or the “Export” option
shown above from the top, right control block.
© Port City Instruments, LLC
24
PCI-1DA
4 TROUBLESHOOTING
Problem
Solution
Driver not found when program is
started, or other error messages
indicating a problem with the I/O
board driver.
1. M
ake sure that the software has been
installed properly and that the USB cable is
connected to the PCI-1D unit.
No spectra displayed when laser is
known to be aligned and detector
connected properly.
Check the laser enable/disable switch on the
front panel to ensure it is in the ON position
(pressed in). Also confirm that laser current is
above threshold and the preamp gain is within
a correct range (ie. not too low for zero signal,
or too high to exceed 5V).
Spectra are “upside down” on the GUI.
Ensure that the external preamp polarity is
correct at the preamp input connector. The 2f
signal polarity is determined by the setting of
the phase knob on the front panel.
Pressure and temperature data are
wrong.
1. C
heck translation parameters in the
Hardware Settings/Translation tab
(Translation Parameters section).
2. U
nplug the USB cable, wait 10s, then plug
the USB cable back in to force Windows to
reactivate the USB device.
2. C
onfirm sensors are connected properly
to the 25-pin rear panel connector as per
Table 2. Unamplified pressure sensor output
must be routed to pin 17 externally (from
pin 20) in order for software to display it.
USB error while program is running.
This error can occur if a USB port or hub is
overloaded, even briefly. Unplug the USB cable,
wait 10s, then plug back in. If this does not
solve the problem, check for excessive current
draw from another USB device on the system.
Spectrum timing is not stable, or
spectra appear to drift even though
the laser temperature is stable.
Best performance is obtained if Windows is not
running any other programs simultaneously
with the PCI-1D control program (apart from
the necessary background tasks). Shut down
all other applications when possible to allow
maximum resources for the control program.
© Port City Instruments, LLC
25
PCI-1DA
5 SPECIFICATIONS
System Specifications
Laser Drive Current
0 – 250 mA (DFB lasers)
1f Modulation Amplitude
0 – 66 mA peak-to-peak (sinusoidal)
TEC Controller
0 to ±1A Default (up to ±2A via internal DIP switch), 5V
Laser Sweep Rate
200ms to 5s scan periods (5 Hz to 0.2 Hz rates)
Detector Compatibility
PCI-1D, Rev B, requires external preamp, 0-10V output
PC Compatibility
Windows™ XP(SP3), Vista, 7, USB port required
Minimum Video Resolution
1280 × 1024
Power Input
Universal AC (47 – 63 Hz, 85 – 264 VAC)
Power Consumption
<15W
Dimensions
10.4”W × 10.0”D × 3.6”H (264 × 254 × 91 mm)
Weight
4.1 lbs (1.9 kg)
© Port City Instruments, LLC
26
PCI-1DA
APPENDIX A: SETTING TEC CURRENT LIMIT
To change the TEC current limit from the default setting of 1.0A it is necessary to remove
the cover on the PCI-1D module and alter a DIP switch setting. Carry out the following steps
to change the TEC current limit:
1) Power off the device and remove the 120 VAC power cable.
2) Remove the top cover of the unit by removing the two screws on either side of the
module (the upper two screws on each side).
3) Locate the bias board for the TEC controller which is shown below (the controller module
is attached to this bias board from below). The TEC controller module is located directly
behind the preamp gain pot, near the front panel of unit (the blue trimpot is not present
with the PCI-1D controller as this is wired to the front panel adjustment knob).
4) Locate the DIP switch (4 position, circled in the photograph below).
5) The TEC current limits are labeled on the board silkscreen (0.5A, 1.0A, 1.5A and 2.0A).
A switch is “ON” when positioned towards the center of the bias board, and “OFF” when
positioned towards the edge of the circuit board (i.e. towards the current limit labels on
the silkscreen, or the white 1,2,3,4 numbers on the switch itself). In the photo below all
switches are OFF.
6) Push switch #2 (1.0A) into the OFF position before selecting a new current limit.
7) Select a new current limit by pushing the appropriate switch into the ON position. Note
that the 0.5A option is not available. The two resistors used for that limit are left open so
that user-specific values can be installed. Contact us for details if you need a custom current
limit.
8) Replace the top cover of the unit.
NOTE: Ensure that only one of the DIP switches is in the ON position !!
© Port City Instruments, LLC
27
PCI-1DA